Article

Impacts of Pacific SSTs on Atmospheric Circulations Leading to California Winter Precipitation Variability: A Diagnostic Modeling

1
APEC Climate Center, Busan 48058, Korea
2
Department of Marine Sciences and Convergent Technology, Hanyang University, Ansan 15588, Korea
3
Center of Excellence in Earth Systems Modeling and Observations, Chapman University, Orange, CA 92866, USA
*
Author to whom correspondence should be addressed.
Atmosphere 2018, 9(11), 455; https://doi.org/10.3390/atmos9110455
Submission received: 6 September 2018 / Revised: 8 November 2018 / Accepted: 15 November 2018 / Published: 19 November 2018

Abstract

:
One of the primary meteorological causes of the winter precipitation deficits and droughts in California (CA) is anomalous developments and maintenance of upper-tropospheric ridges over the northeastern Pacific. In order to understand and find the key factors controlling the winter precipitation variability in CA, the present study examines two dominant atmospheric modes of the 500 hPa geopotential height in the Northern Hemisphere using an Empirical Orthogonal Function (EOF) and their associated large-scale circulation patterns for the last 41 winters (1974/75–2014/15). Explaining 17.5% of variability, the second mode (EOF2) shows strong anti-cyclonic circulations in the North Pacific and cyclonic circulations in the eastern USA and mid-latitude North Atlantic, similar to the atmospheric circulation observed in the 2013/14 drought of CA. EOF2 is tightly and significantly correlated with CA winter precipitation. EOF2 is associated with warm western‒cool eastern tropical Pacific, resembling a mirror image of canonical El Niño events. In particular, it is found that, since the mid-1990s, sea surface temperatures (SSTs) in the western tropical Pacific have been more tightly correlated with EOF2 and with the variability of CA precipitation. A diagnostic regression model based on the west‒east SST difference in the tropical Pacific developed for two recent decades (1994/95–2014/15) has been found to capture the slow-moving interannual variability of the CA winter precipitation (about 50%). The regression model performs well, especially for the central and northern CA precipitation, where the impacts of El Niño Southern Oscillation (ENSO) and Pacific Decadal Oscillation (PDO) on precipitation are indecisive. Our results emphasize the significant role of the western tropical Pacific SST forcing in the recent past, and in turn on CA droughts and potentially other precipitation extremes.

1. Introduction

California (CA) has a Mediterranean climate characterized by mild and wet winters and hot and dry summers; over a half of the annual precipitation total (~54%) occurs in winter (December‒February, DJF, hereafter). While the DJF and annual precipitation totals in CA undergo substantial interannual-to-decadal variabilities (Figure 1), they also show decreasing trends, especially since 1999. This suggests that the already overstretched water resources in CA will be even more scarce in the future. As such, the recent CA drought from 2011 to 2016 has placed most of CA under exceptional drought conditions [1,2,3,4]. In particular, the longevity and severity of the recent CA drought has limited the agricultural water supply to the heavily farmed Central Valley and increased the occurrences of severe wildfires to cause extreme socioeconomic losses [5,6].
One of the direct causes of the recent CA drought is abnormally developed anti-cyclonic circulations over the northeastern (NE) Pacific, close to the west coast of North America [2,3,7,8,9]. During the 2013/14 winter, the abnormal dipole mode (i.e., anti-cyclonic circulations in the NE Pacific and cyclonic circulations in the eastern USA) was known to cause the western drought and the northeastern snow storms in the USA [2,3,8]. Previous studies revealed that an anti-cyclonic circulation in this region is likely to suppress (intensify) sub-tropical (polar) jets to redirect surface cyclones to the north into Alaska and Canada, resulting in turn in the reduction of precipitation in CA [10,11,12,13]. On the other hand, although the link is less tight, the opposite situation is also valid; cyclonic circulations associated with below-normal geopotential heights in the NE Pacific tend to increase precipitation in CA. As such, the variability of upper-level geopotential heights with a barotropic structure in the NE Pacific shows significant inverse relationship with the CA winter precipitation [10,12,14].
The aforementioned effects of the anomalous anti-cyclonic circulations in the NE Pacific on CA precipitation have been known to be strongly modulated by the El Niño–Southern Oscillation (ENSO) [10,11,12,13], the North Pacific Oscillation [11] or the North Atlantic Oscillation (NAO) [15,16,17]. In El Niño winters, for example, negative geopotential height anomalies tend to develop in the North Pacific due to diabatic heating and northward propagation of Rossby waves originating from the central tropical Pacific of warm sea surface temperature (SST) [12,18]. Similarly, but in contrast, positive geopotential height anomalies tend to develop in the NE Pacific in La Niña winters. In more detail, these atmospheric circulations in response to ENSO events induce an opposite effect on precipitation tendency between the southern and the northern part of the western USA, respectively [12,13,14,19]. Therefore, for CA, the correlation between ENSO and DJF precipitation is statistically significant only in southern CA but is weak or nonexistent in northern CA, so that the interannual correlation between ENSO and DJF averaged precipitation in CA is only marginally significant [12,13,14,20].
On decadal and multi-decadal scales, other factors can also influence CA’s precipitation. Many studies found that the strength of the ENSO‒precipitation linkage in CA described above depends on the phase of the Pacific Decadal Oscillation (PDO); the El Niño‒precipitation linkage is strengthened during positive PDO periods [11,12,21]. In addition, McCabe et al. [22] asserted that phase combinations of the PDO and the Atlantic Multi-Decadal Oscillation (AMO) are known to be critical to the occurrence of multidecadal droughts in the southwestern USA, including CA. These studies suggest that large-scale circulations and climate conditions controlling CA winter precipitation require further investigation. In particular, a lack of understanding of the key factors that control the precipitation variability in northern CA where the connection of precipitation variability to ENSO and/or PDO is negligible hinders skillful seasonal forecasts in CA [19,23].
Our study aims to investigate and understand the large-scale circulations and the key factors that control winter precipitation in CA, considering the importance of mid-tropospheric geopotential height variability over the northeastern Pacific on CA winter precipitation. In particular, this study identifies the dipole mode (i.e., anti-cyclonic circulations in the NE Pacific and cyclonic circulations in the eastern USA) that is similar to the one observed during the 2013/14 winter period using an Empirical Orthogonal Function (EOF) analysis, and further examines mechanistic characteristics of the dipole mode as well as its impacts on winter precipitation variability in CA. Lastly, based on these findings, we develop a diagnostic linear regression model in order to estimate the precipitation variability in CA. During these investigations, decadal changes of relationships of the key factors with CA winter precipitation are also considered.

2. Data and Methods

The monthly precipitation data for CA used in the analyses of this study are obtained from the U.S. Climate Division Data, provided by the National Climatic Data Center (NCDC). The Climate Division Data provide monthly means and anomalies (for the 1980–2010 base period) of station observations from regions within states that are considered to be climatically homogeneous [22]. While CA is composed of seven climate divisions, NCDC provides both statewide- and division-averaged values. The original precipitation data (not log-transformed) are used due to the negligible differences in the correlation results shown in Section 3. In this study, the CA precipitation index (PRCP, hereafter) is defined as statewide-averaged winter (DJF) precipitation anomalies. The division-wide averaged precipitation anomalies for the seven climate divisions are also used.
We also used 0.5° × 0.5° monthly surface temperature (Ts) and precipitation data from the Climate Research Unit (CRU). The CRU precipitation data yielded similar results as the NCDC data. Atmospheric variables including the 500 hPa geopotential height (HGT) and sea-level pressure (SLP) are obtained from the 2.5° × 2.5° National Centers for Environmental Prediction–National Center for Atmospheric Research (NCEP–NCAR) reanalysis (R1). SST and the outgoing longwave radiation at the top of the atmosphere (OLR) are obtained from the SST Extended Version 4 (2° × 2°) and monthly interpolated OLR (2.5° × 2.5°) from the National Oceanic and Atmospheric Administration (NOAA), respectively.
For oceanic climate indices, the monthly values of the ENSO [24], PDO, El-Niño Modoki Index (EMI), Southern Oscillation Index (SOI), and NINO West (wNINO, 130–150° E and 0–15° N), NAO [25,26] and Arctic Oscillation (AO) indices are obtained from the National Oceanic and Atmospheric Administration Climate Prediction Center archives (http://www.esrl.noaa.gov/psd/data/climateindices/list/). The ENSO indices includes NINO1 + 2 (NINO12, hereafter), NINO3.4 (NINO34, hereafter), and NINO4, and their anomalies from the long-term mean (1980–2010). In this study, El Niño (La Niña) winters are defined by which DJF-mean NINO34 index is greater (less) than one positive (negative) standard deviation of the 41-year variability.
The analysis period includes the 41 winters from 1974/75 to 2014/15 (Period 1 in Table 1). The recent 21 years from 1994/95 to 2014/15 (Period 2 in Table 2) are of special interest in Section 4 due to the potential impacts of the climate shift in the mid-1990s on regional weather conditions [27,28,29,30]. The years specified below refer to those of January and February (e.g., 2010 for December 2009–February 2010).
In order to examine the interannual variability of the upper-tropospheric geopotential height anomaly, an EOF analysis is performed on the DJF mean HGTs for the 41 winters. Conventional (not rotated) EOF analysis is used since we are interested in the dipole mode that is not identified by a rotated EOF analysis. The target area is 20° N~85° N; the areal weight according to latitudes is accounted for. For the relationship between variables, we compute linear correlation coefficients for both before and after removing the linear long-term trends of each variable. The results presented below are from the analyses performed on the detrended data; the raw data including linear trends yield essentially the same results except for the high-latitude North Atlantic and the arctic regions. In addition, 21-year moving correlation coefficients are also computed in order to investigate the decadal variations of the key variables and factors. A linear regression analysis is used to develop models for estimating precipitation variability.
The resulting Pearson correlation coefficients indicate the strength of a linear relationship between two fields. Assuming independent, normally distributed data, 0.33 (0.44) is the 95% confidence level for a nonzero correlation for the 41-year (21-year) samples of 39 (19) degrees of freedom (N-2; N is the total number of samples). Composite analyses of extreme positive and negative years of principal components in the 41-y period (i.e., with the PC2 threshold of ±0.7 standard deviation) are performed for various oceanic and atmospheric variables in order to find the atmospheric circulation responsible for major EOF modes. The threshold value of ±0.7 standard deviation is an optimization compromise between small sample and signal to noise ratio. A statistical significance test for the composite analysis is also performed by the bootstrap resampling technique of repeating 1000-time random selections without replacement.

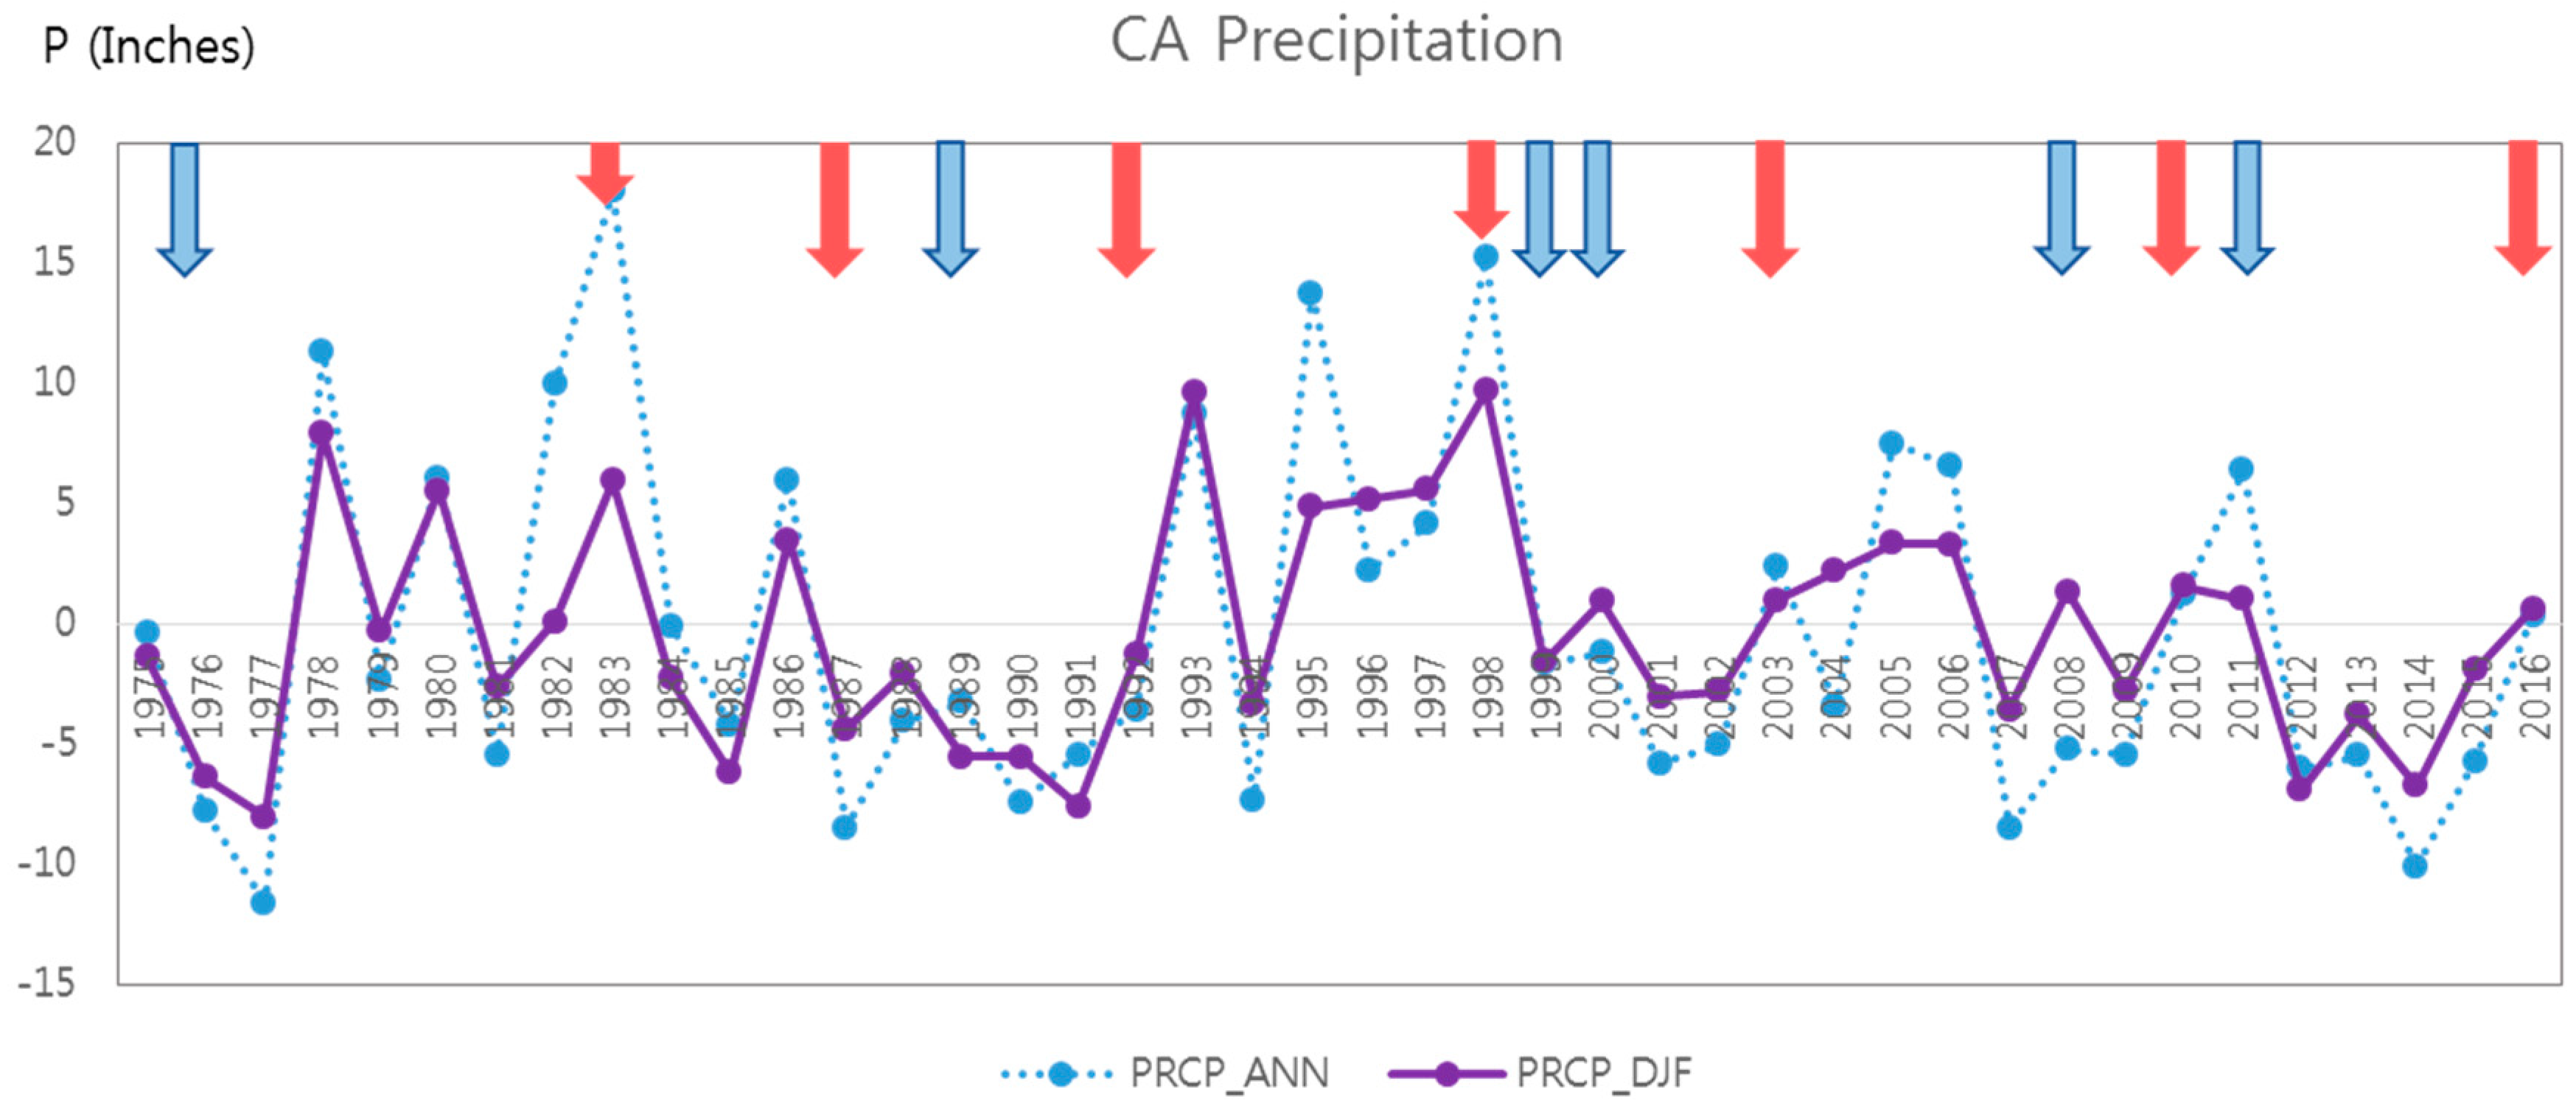
3. Large-Scale Circulations Associated with CA Precipitation Variability

3.1. Correlations of Precipitation Variability with Atmospheric/Oceanic Variables

To understand the general structure of atmospheric/oceanic variables associated with the CA DJF precipitation variability, simultaneous correlations of PRCP with SLP, HGT, OLR, and SST for the entire analyzed Period 1 are calculated (Figure 2). Note that, for focusing on precipitation deficits and droughts, the correlation coefficients are multiplied by −1.0. For SLP and HGT_500 (Figure 2a,b, respectively), reduced PRCP is associated with anti-cyclonic circulation at the surface and in the mid-troposphere in the NE Pacific and the western USA, as reported in the previous studies [2,3,7,8,9]. It is also found that PRCP reduction has remote relationships in the tropical Pacific, e.g., the surface cyclonic circulation in the western tropical Pacific and mid-tropospheric cyclonic circulation in the tropical and subtropical eastern Pacific. The OLR‒PRCP correlations (Figure 2c) depict the alternating sign changes from the South Pacific (Southern Pacific Convergence Zone, SPCZ) to the western coasts of the USA. Regarding SST (Figure 2d), PRCP is significantly but marginally correlated with SSTs in the central and eastern tropical Pacific, with negative signs that correspond to a positive relationship between CA precipitation and ENSO. Positive correlations in the central North Pacific and the subtropical western Pacific are also observed.

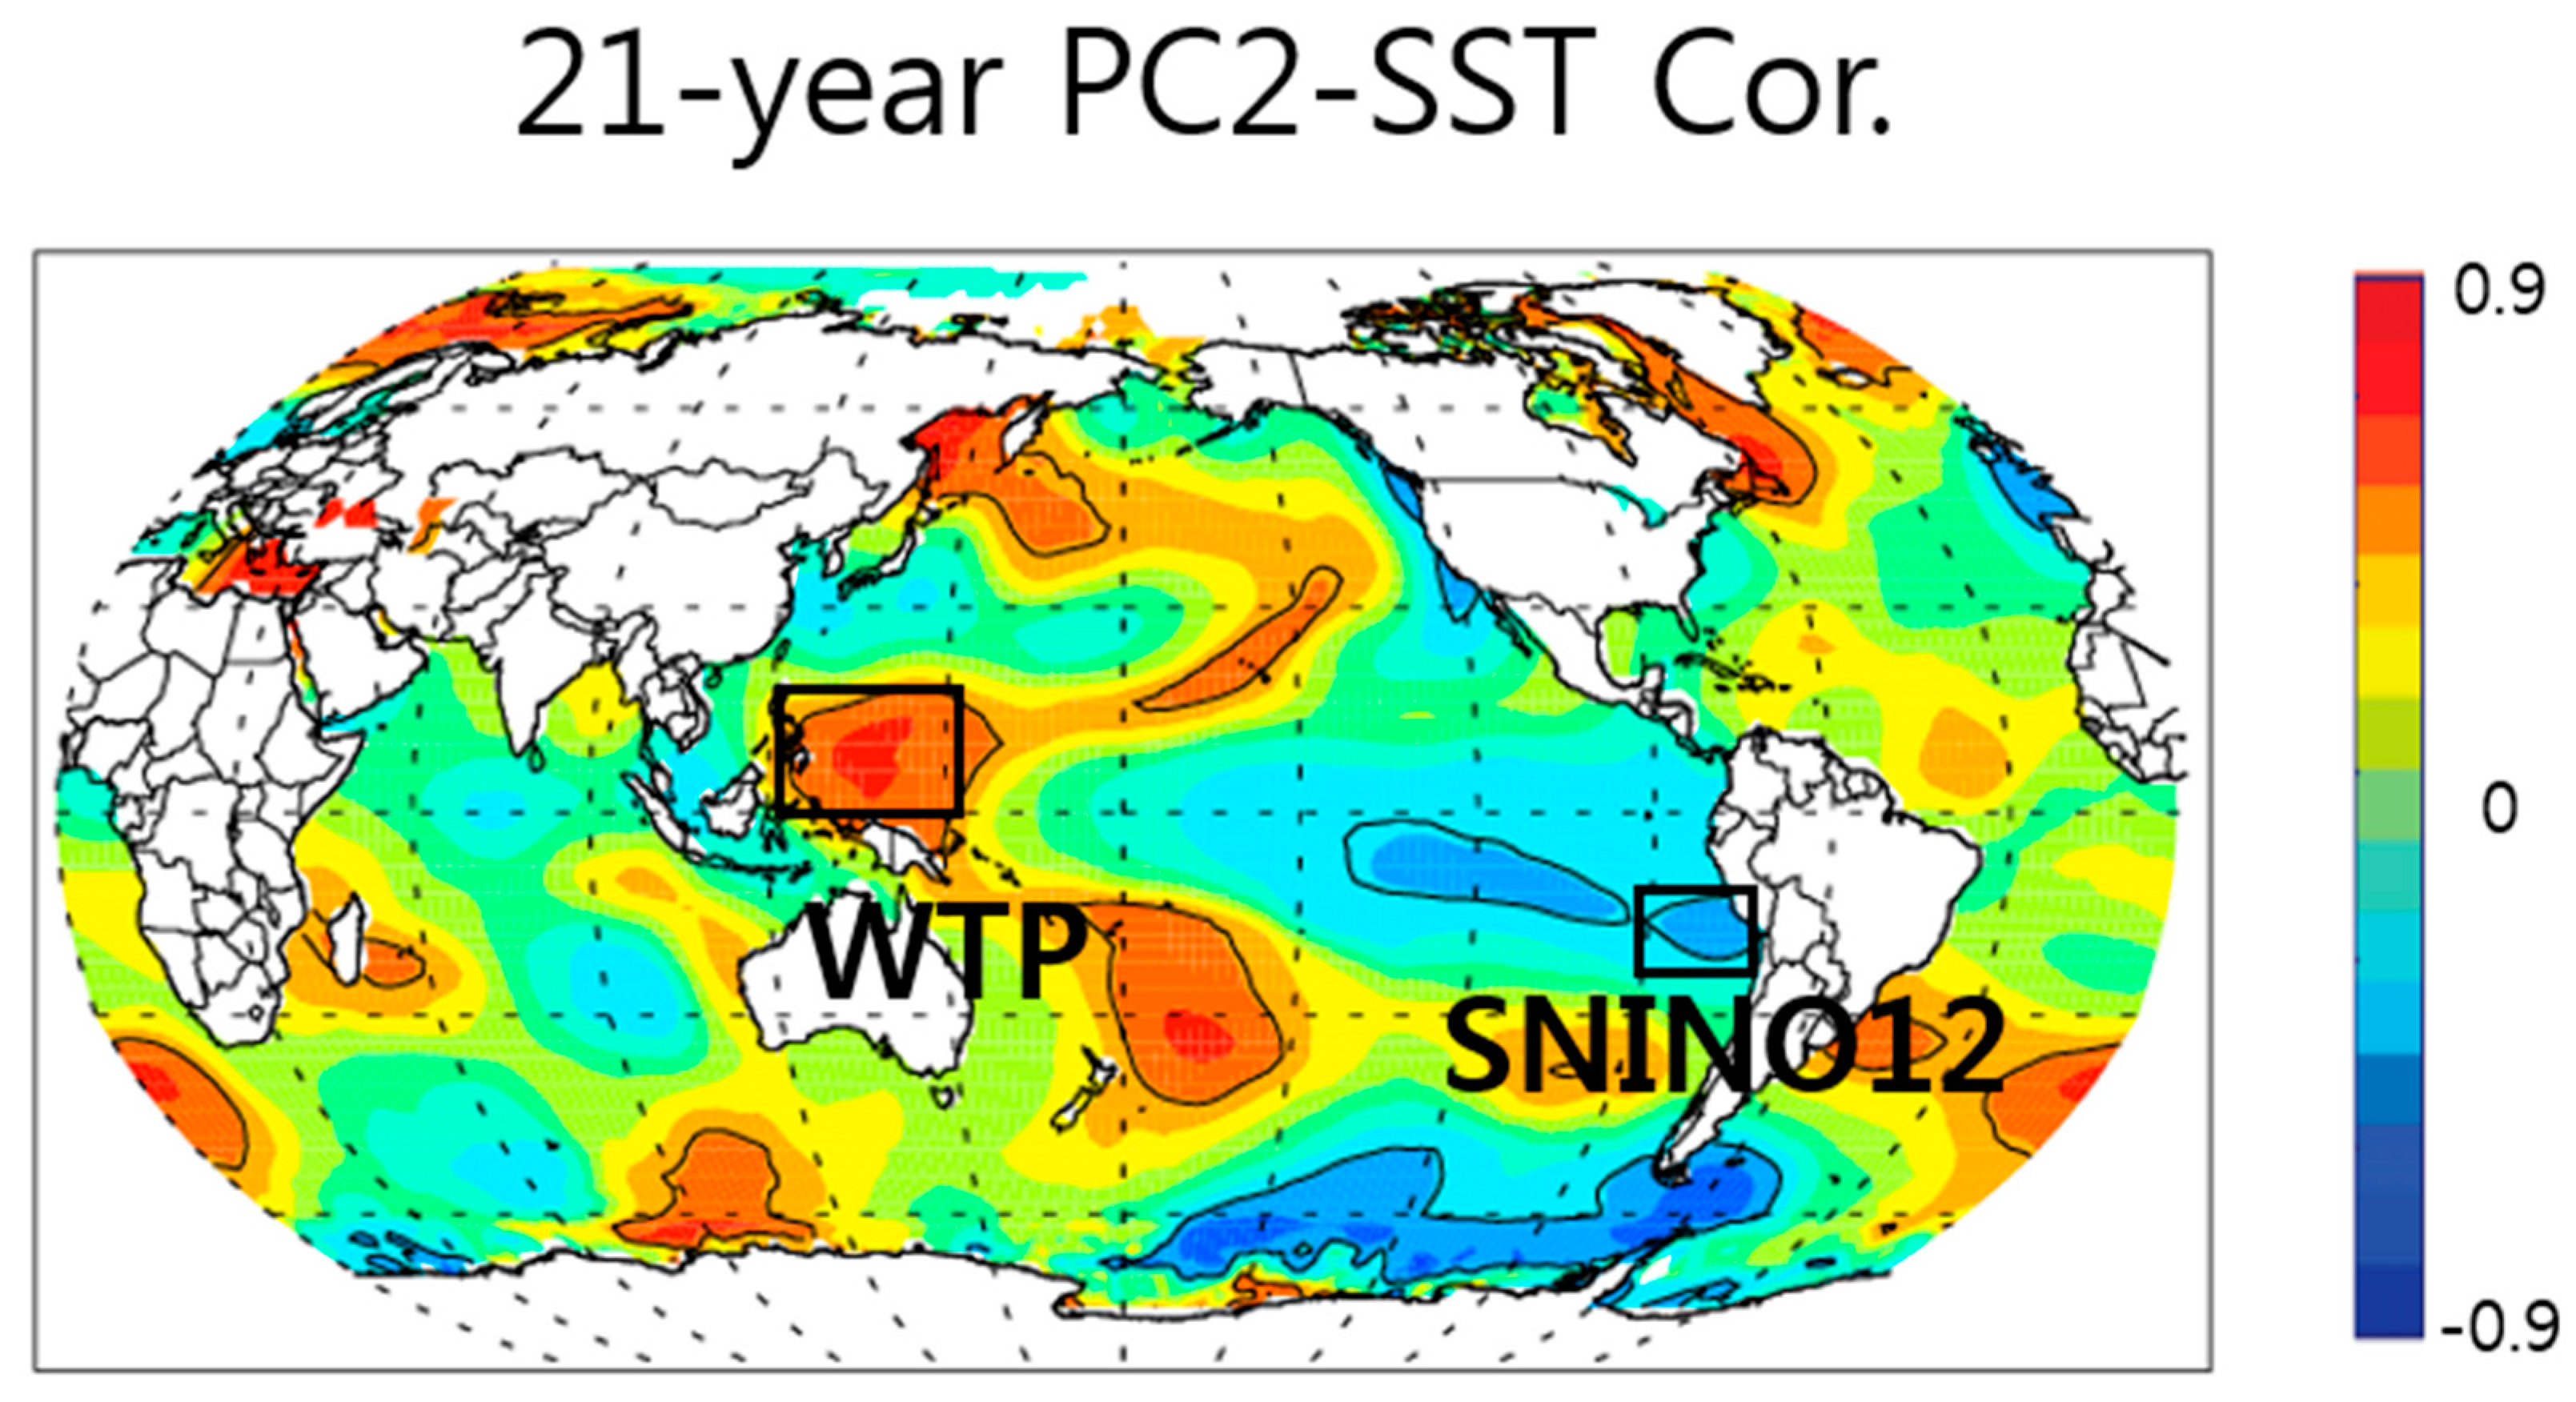
3.2. Dominant EOF Modes of Mid-Tropospheric Geopotential Heights and Their Associated Large-Scale Circulations

Figure 3 shows the first and second EOF modes (EOF1 and EOF2, respectively) and their corresponding time series of principle components (PC1 and PC2, respectively). The EOF1 and EOF2 mode explains 22.8% and 17.5%, respectively. While the both EOF1 and EOF2 modes have strong positive values in the North Pacific, they are different from each other in their spatial patterns over North America and the North Atlantic. The EOF2 has negative values over the central/eastern North America and the mid-latitude North Atlantic and does positive values over the high-latitude North Atlantic including Greenland. The spatial pattern is reversed for EOF1 between the mid-latitudes and high-latitudes of the North Atlantic. Additionally, positive values are dominant in most of the mid-latitude regions including East Asia. Due to these spatial patterns, PC1 is positively and strongly correlated with NAO (r = 0.78) and with AO (r = 0.94) while PC2 is not (r = −0.38 with NAO and r = −0.20 with AO) (see also Table 3). Particularly, the positive values over the North Pacific and the negative values over the northeastern USA of the EOF2 mode are quite similar to the upper-tropospheric condition that is known to cause the western drought and the northeastern snow storms in the USA, respectively, during the 2013/14 winter [2,3,8].
Correlations of the EOF modes with various oceanic and atmospheric indices are shown in Table 2. Both PC1 and PC2 are significantly correlated with NINO34, but their relationships to the other indices are different. PC1 is significantly correlated with NINO4, PDO, and EMI but not with NINO12 and SOI. PC2 is significantly correlated with NINO12, SOI and wNINO, but not with PDO and EMI.
The anti-cyclonic circulation of the EOF1 and EOF2 modes in the North Pacific have their centers located to the east of the international Dateline; this is likely to suppress precipitation in CA. Actually, while both PCs are negatively correlated with PRCP (Figure 3e–h and Table 3), the PC2‒PRCP correlation is more tight and significant at the 95% confidence level for both Period 1 and Period 2. Furthermore, the correlation coefficient of PC2 for Period 2 is 0.59 when one outlier (the 2011/12 winter indicated by the dotted circle in Figure 3h) is excluded. Three out of the seven total cases of the strong positive phases of PC2 were drought years (Table 4). Therefore, we will focus on the characteristics of the EOF2 mode hereafter.
In order to further investigate the large-scale circulations associated with the EOF2 mode, correlation maps of the PC2 with SST, SLP, OLR, Ts, and CRU precipitation are examined (Figure 4). For SST (Figure 4a), PC2 is negatively (positively) correlated in the central‒eastern Pacific, while it is positively correlated in the western tropical (WT) Pacific, the central North Pacific, and the SPCZs. The PC2‒SST relationship shows strong contrasts between the central/far-eastern tropical Pacific (negative) and WT Pacific (positive). The PC2-SLP correlations (Figure 4b) are strong in the WT Pacific and in the Indian Ocean with negative signs, while they are negligible in the eastern tropical Pacific. Considering the positive PC2-SST correlations in the WT Pacific in Figure 4a, this result suggests that the EOF2-related anti-cyclonic circulations over the NE Pacific are dominant when the WT Pacific is warmer and its SLP is lower.
For OLR (Figure 4c), PC2 shows significant positive correlations off the west coast of the USA including CA, indicating that winter precipitation in the U.S. west coast region is suppressed in a positive PC2 phase. Further to the south, negative correlations (i.e., enhanced convection and precipitation) prevailing in the subtropics encompassing Hawaii are observed with positive correlations in the tropical Pacific. Negative correlations are found in the western tropical Pacific including Maritime Continent and SPCZ. On the other hand, to the north, negative and positive correlations exist in the central North America and Greenland, respectively.
The directions of Rossby wave propagation and preferred teleconnection patterns are known to vary according to zonal asymmetries in the climatological state, transients, and/or baroclinic and non-linear effects [24]. These OLR correlation patterns indicate that the alteration axis of the PC2‒OLR correlation is southwest-to-northeast from the NE Pacific to North America/North Atlantic, which also appears to be connected to central Russia (Ural Mountains), South China, and even further to the WT Pacific with a wave-like pattern. This feature is contrast to the fact that the alteration axis of the PC1‒OLR correlation is from tropics to the Polar regions with a negligible connection to the WT Pacific (not shown).
Correlations of Ts with PC2 (Figure 4d) are negative in most of North America and the central Russia, which corresponds to the negative values of EOF2 (Figure 3b). This implies barotropic structures of the EOF2 mode. For the relationship with CRU precipitation (Figure 4e), EOF2 tends to reduce (enhance) precipitation in the southwestern USA, including CA as well as Texas and the northeastern Mexico (the central North America, and Alaska).
Since the correlation maps here present the temporal correlation at each grid point but not the spatial coherence, a composite analysis is performed for the winters of extremely positive and negative years using ±0.7 standard deviation of PC2, respectively, as the threshold (Table 4). It is found that the spatial patterns of the correlation maps are mostly consistent with the spatial patterns of the composites (Figure 5). In Table 4, we also indicate winter drought years in bold defined by PRCP being less than −0.7 standard deviation for the 41 winters. The result indicates that most winter droughts occurred in the positive composite years of PC2.
The underlying mechanisms for the connection between the warm and convective WT Pacific and barotropic anti-cyclonic circulations in the NE Pacific were studied extensively in Seager et al. [3] and Seager and Henderson [9]. With both observational and modeling approaches, they found that convective precipitation in the warm WT Pacific forced Rossby wave propagation northeastward, inducing upper-level convergence and low-level divergence in the NE Pacific in the 2013/14 winter. Although the height anomaly pattern is partially attributed to the atmospheric internal variability, it is highly possible that the warm western tropical Pacific and cool central/eastern tropical Pacific played a significant role. The results of those studies are consistent to ours, especially the strong correlations of PC2 with SSTs, SLP, and OLR in the WT Pacific.

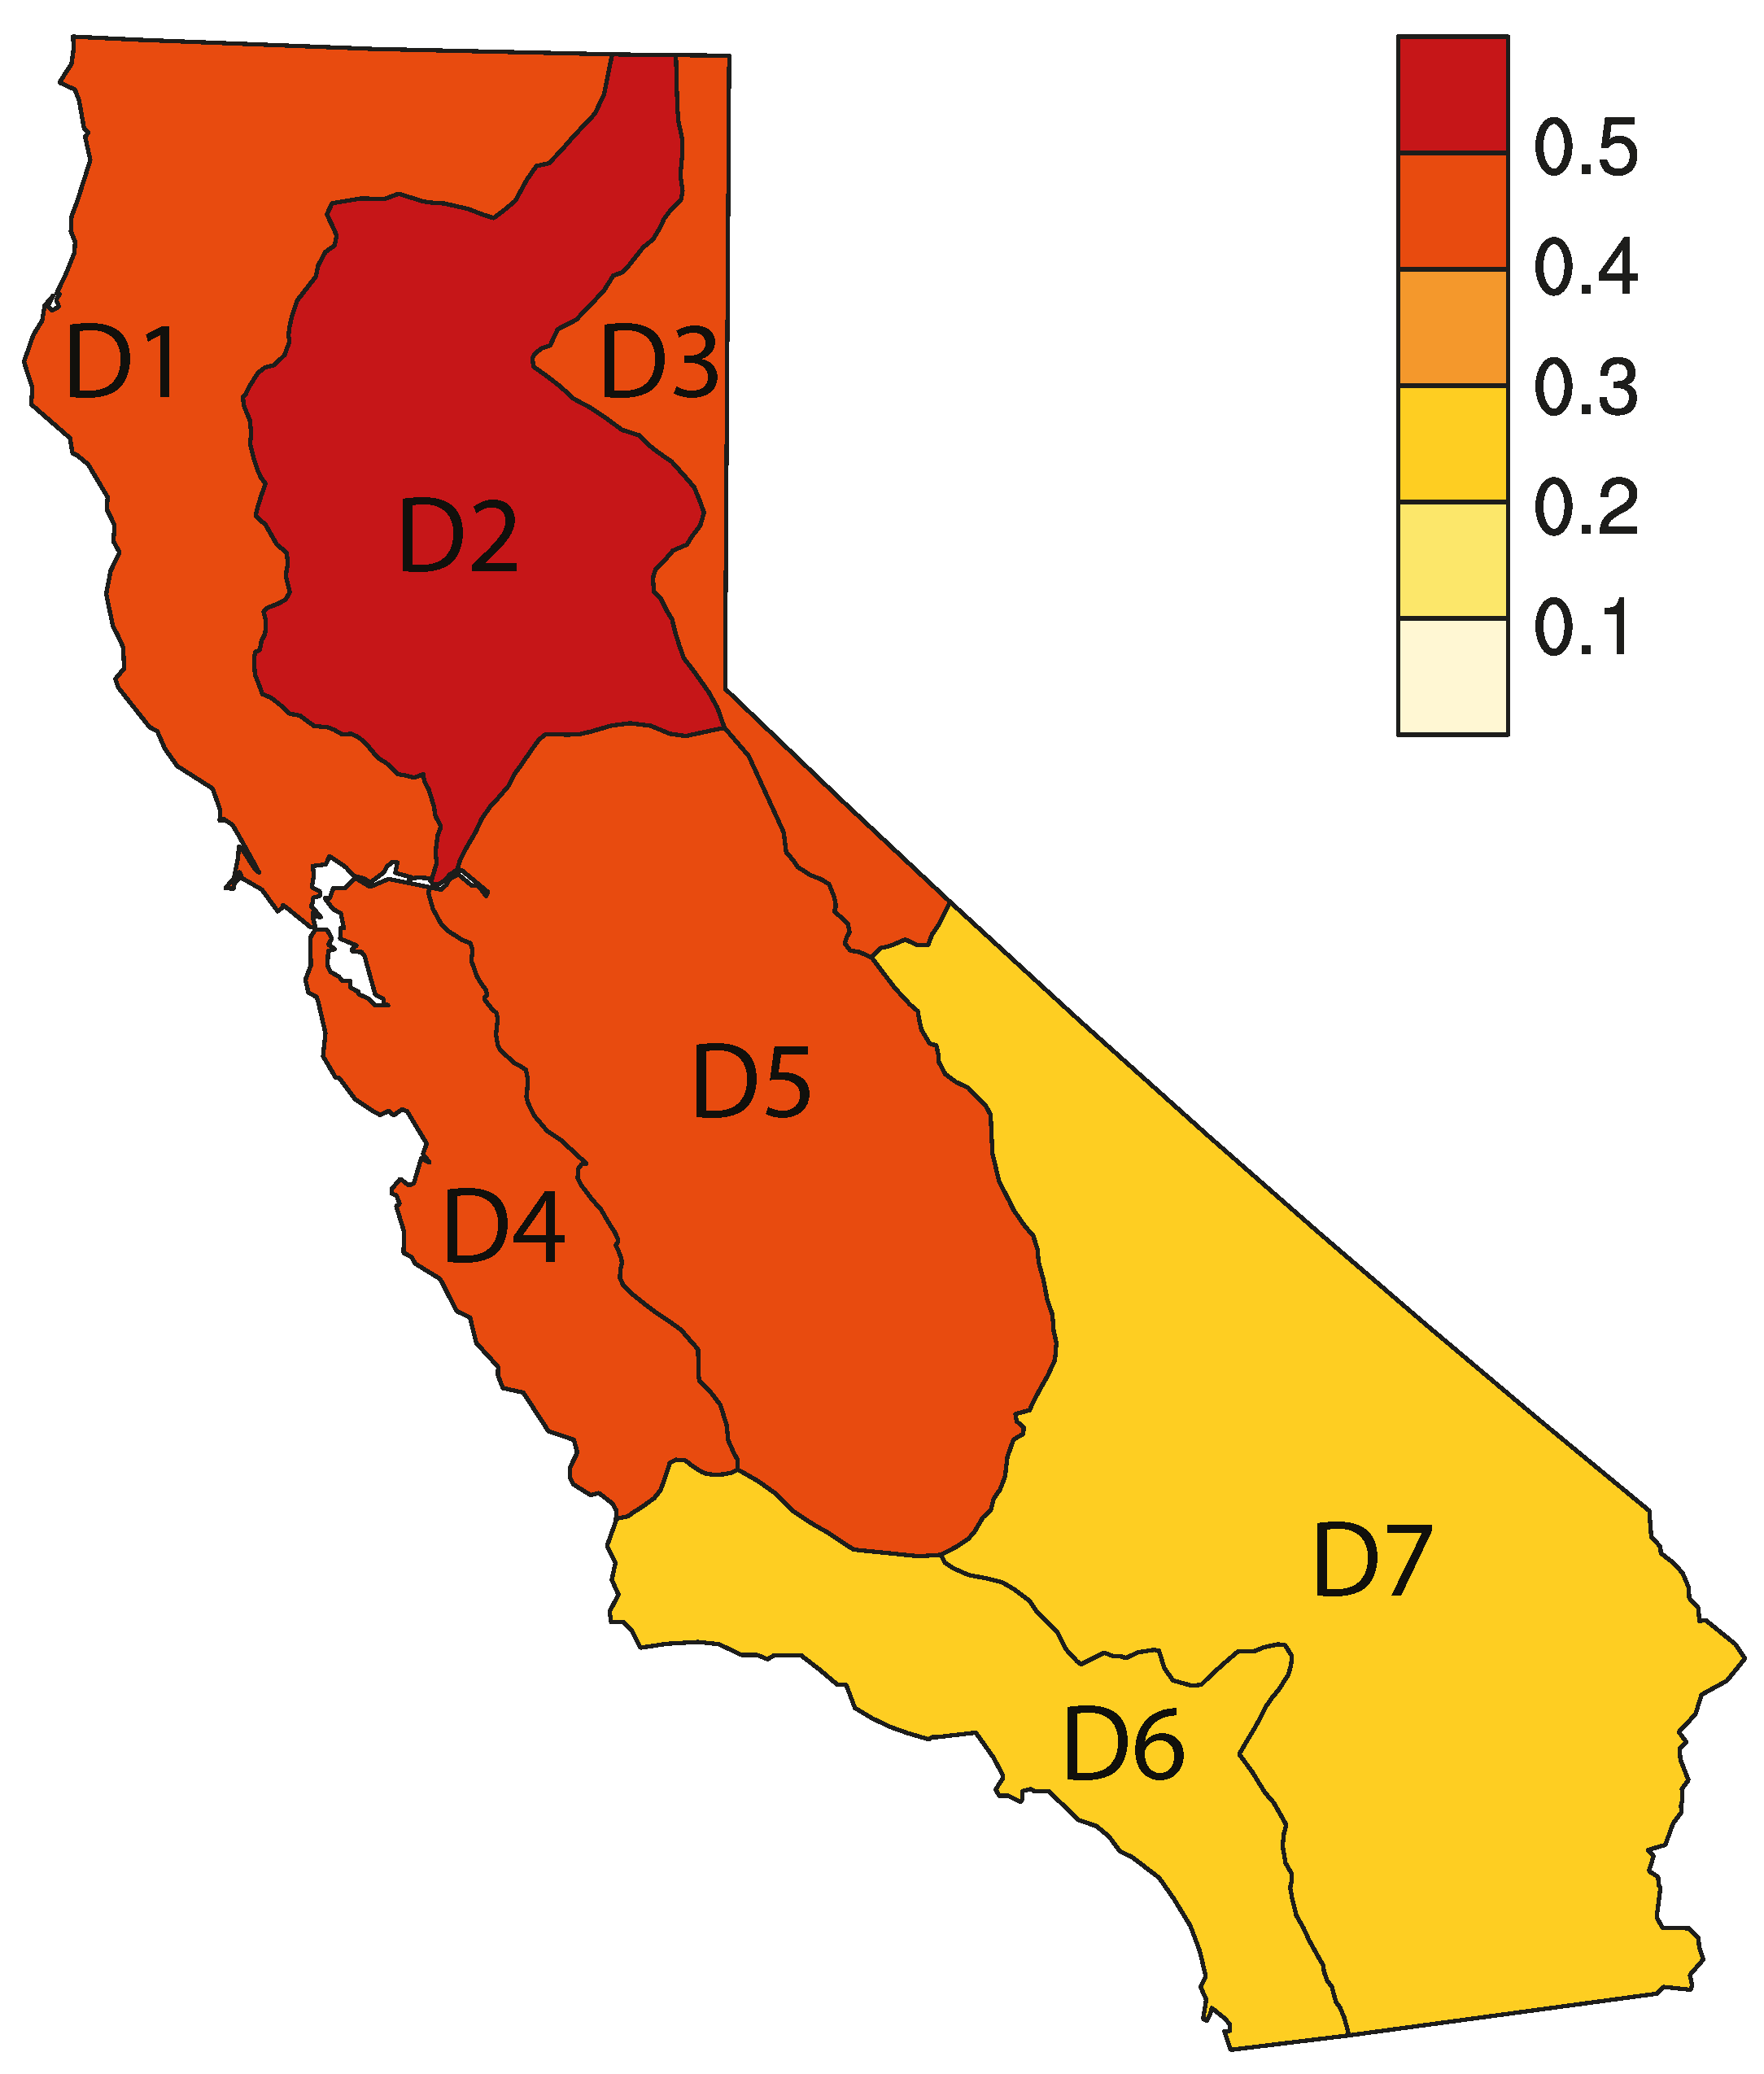
4. Development of a Regression Model for CA Winter Precipitation

Comparison of the PRCP correlation results (Figure 2) to the PC2 correlation results (Figure 4) indicates that the PRCP correlations resemble the PC2 correlations. For example, the spatial pattern of the SLP‒PRCP correlations (Figure 2a) resembles that of the SLP‒PC2 correlations (Figure 4b), showing the strong southwest-northeast contrast in the North Pacific. In addition, the HGT‒PRCP (Figure 2b) also resembles the spatial pattern of PC2 (Figure 3b), particularly the negative signs over the eastern Canada and the positive signs near Florida.
Meanwhile, several studies have reported the mid-1990’s climate shift leading to precipitation pattern changes in East Asia [27,28,29,30] that may be related to the changes of ENSO characteristics, e.g., more (less) frequent occurrences of the Central Pacific type (canonical) El Niño events [31,32,33,34,35].
We examine the recent (Period 2) PRCP correlations in Figure 6. While most of the correlation results are consistent with those in Period 1 (Figure 2) except in the arctic regions, SST correlations have substantial decadal changes; the positive correlations in the WT Pacific are more pronounced while the negative correlations in the central tropical Pacific are weakened. In the equatorial eastern Pacific, significant negative correlations are found off the west coast of Peru. Similarly, significant correlations of the PC2-SST in the WT Pacific (WTP box in Figure 7) and in the south of the NINO1+2 region (SNINO12 box in Figure 7) are also observed in Period 2 (compared to Period 1 in Figure 4a). This occurs while the PC1-SST correlations do not show substantial decadal changes (not shown).
Based on these results, as well as the understanding of the above relationships associated with PC2 and with PRCP, we attempt to formulate a SST-based regression model for estimating the DJF precipitation anomaly. SST variables are often chosen as predictors since they are considered as one of slowly varying boundary conditions [36,37,38,39]. This attempt focuses on Period 2 in order to consider the strong correlations of SST in the WT Pacific with PRCP (Figure 6d) and with PC2 (Figure 7). As independent variables, SST average in the WT Pacific (WTP, hereafter) and SST average in the south of the NINO1+2 region (SNINO12, hereafter) are considered; WTP and SNINO12 are the averaged SSTs of the regions where SSTs are significantly correlated with PC2 (Figure 4a) in the Pacific. The SNINO12 region rather than the central tropical Pacific region is chosen as Lee et al. [14] emphasized that CA winter precipitation is sensitive to SST in the far eastern tropical Pacific rather than in the central tropical Pacific.
In order to examine the connection between independent variables and the mid-tropospheric geopotential height field, correlations of the independent variable with HGT are displayed in Figure 8 for Period 1 (a and c) and Period 2 (b and d). For easy comparison, the SNINO12 correlations are multiplied by −1.0. For Period 2, both the variables are strongly associated with HGT over the NE Pacific although exact locations are slightly different. Positive HGT correlations over the NE Pacific indicate that higher WTP and lower SNINO12 than averages are linked with anti-cyclonic circulations over the NE Pacific. The linkage to the anti-cyclonic circulation is intensified in Period 2 for both of WTP and SNINO12 but more distinctively for WTP. In addition, for both, negative correlations are found in central North America, resembling the spatial pattern of the EOF2 (Figure 3b). Being consistent to the results of Seager et al. [3] and Seager and Henderson [9], this suggests that WTP and SNINO12 can modulate PRCP by altering geopotential height anomalies in the NE Pacific.
In order to examine decadal variations, regression models are developed for each 21-year period starting from 1975 to 1995 (e.g., 1975–1995, 1976–1996 and 1995–2015, total 21 models for each set). Here, WTP_diff is the difference between WTP and SNINO12 since WTP and SNINO12 are significantly correlated with each other (r = −0.46 for Period 2). Figure 9a displays correlation coefficients between observed precipitation anomalies and the estimated precipitation anomalies for each 21-year period.
The result indicates that precipitation is largely explained by WTP_diff (red line) during most of the periods except for the early period (e.g., 1985–1987) while WTP (blue line) plays an important role since the 1992–2012 period. These features emphasize again that the zonal SST difference is more important than WTP itself or NINO12 on the CA winter precipitation, being consistent to the results of the previous studies (e.g., [2,3,4]). As shown in Figure 8, the HGT‒WTP correlation pattern is very similar to the HGT‒SNINO12 correlation pattern, particularly over the North Pacific and North America. When the two effects are combined i.e., when the WT Pacific is warm and the eastern Pacific (SNINO12) is cool, positive HGT anomalies over the North Pacific and negative HGT anomalies in Canada are enhanced. These results suggest that the zonal SST gradient and EOF2 are critical to the DJF precipitation characteristics in CA especially during the recent two decades.
The model employing WTP_diff shows the highest correlation for the entire period. For this model, the correlation coefficient increases substantially with time since the 1988–2008 period and reaches its maximum (r = 0.70) for most of the recent two decades, 1995–2015 (Period 2), explaining about 50% of the total variability. The estimated and observed precipitation anomalies for Period 2 are displayed in Figure 9b with the model equation below:
[DJF Precip anomaly] = 2.199 − 4.477 × WTP_diff
The model successfully estimates the consecutive above-normal precipitation during 1995–1998 (except 1996) and 2003–2006 and the below-normal precipitation during 1999–2002 and 2012–2015. Although the dry years in 2007 and 2009 are not successfully simulated, the model tends to successfully capture the periods of consecutively dry or wet winters and the recent four drought winters (2012–2015). Leave-one-out validation gives the temporal correlation coefficient of 0.64 between the observed and estimated precipitations (not shown).
Using WTP diff, we also have developed regression models for the DJF precipitation in each of the seven climate divisions in CA (Table 5 and Figure 10). While most of the R2 exceed 0.4, higher performance occurs in the northern and the coastal divisions (e.g., D1, D2, and D4). This result is important since ENSO and PDO significantly influence winter precipitation in southern CA and key climate indices for winter precipitation are rarely found in northern CA.

5. Discussion and Conclusions

CA winter precipitation tends to be greatly affected by mid-tropospheric geopotential height anomalies in the northeastern (NE) Pacific, south of Alaska. Abnormal development and persistence of ridges in the NE Pacific are considered to be direct causes of the recent extreme winter droughts in CA in 2013/14 and 2014/15 [2,3,8,40]. Based on these previous studies, the present study examines the dominant interannual variability modes of the mid-tropospheric geopotential height in the Northern Hemisphere (north of 20° N) and related large-scale circulations in order to understand key factors controlling the CA winter precipitation variability.
Applying an EOF analysis to the 41-year DJF mean HGT field from 1974 to 2015, we identify two leading EOF modes featured with anti-cyclonic circulations in the NE Pacific, but with an opposite meridional pattern in the North Atlantic region. Among them, EOF2 (17.5%) is more closely and significantly correlated with the DJF precipitation than EOF1. The EOF2 mode shows strong anti-cyclonic circulations in the NE Pacific and cyclonic circulations in the eastern USA and the mid-latitudinal North Atlantic that are often observed in winter drought events in CA and winter blizzards in the northeastern USA, respectively, for recent years. They are associated with the warm western‒cool eastern tropical Pacific, resembling the mirror image of canonical El Niño events. The strong connection of the EOF2 mode to the western tropical Pacific is observed in the fields of SLP, SST, and OLR.
Correlation patterns of CA winter precipitation with climate indices and variables are analogous to those of the EOF2, emphasizing the role of the EOF2 on the precipitation variability in CA. Based on the findings presented above, linear regression models are developed to estimate the precipitation variability based on SST; the model employing the west‒east SST difference (WTP_diff) in the tropical Pacific as an independent variable is found to capture the slow-moving interannual variability of CA winter precipitation successfully. At the sub-regional level, our model performs well not only in the southern parts but also in the central and northern parts of CA where dominant factors on precipitation are rarely found. The marginally significant correlation between the CA winter precipitation and NINO3.4 indicates their fragile relationship, one that can be greatly affected by internal variability of the atmosphere and deep convection in other areas [14,41,42].
The results of this study emphasize the west‒east SST difference in the tropical Pacific on the EOF2 mode and also the effects on CA winter precipitation. Although the west‒east SST difference causing the CA drought event in 2013/14 was proposed in previous studies [2,3,4], the present study confirms the general linkage between the west‒east SST difference and CA winter precipitation though the EOF2 mode.
One deficiency of this study is that the model development is based on a short period, such as two recent decades. Nevertheless, finding new predictability sources is an important task to improve model performance, under the situation that anomalous SST tendencies are observed in the Central Pacific (e.g., CP type El Niño) and in the Atlantic (e.g., Increased AMO) [43,44,45], and the atmospheric responses to those SST tendencies have changed accordingly [27,28,29,30]. Since abnormally warm conditions in the western tropical Pacific have been observed since the early 2000s [46], prolonged precipitation deficits and droughts in CA are projected to occur more often in the near future.

Author Contributions

Formal analysis, B.M.; Methodology, S.-W.Y.; Writing—Original draft, B.M.; Writing—Review & Editing, S.-W.Y., J.K. and M.K.

Funding

S.-W.Y. was supported by the National Research Fund of Korea Grant funded by the Korean Government (MEST) NRF-2009-C1AAA001-2009-0093042.

Acknowledgments

This research was supported by the APEC Climate Center.

Conflicts of Interest

The authors declare no conflict of interest.

References

  1. Borsa, A.A.; Agnew, D.C.; Cayan, D.R. Ongoing drought-induced uplift in the western United States. Science 2014, 345, 1587–1590. [Google Scholar] [CrossRef] [PubMed]
  2. Wang, S.-Y.; Hipps, L.; Gillies, R.R.; Yoon, J.-H. Probable causes of the abnormal ridge accompanying the 2013–2014 California drought: ENSO precursor and anthropogenic warming footprint. Geophys. Res. Lett. 2014, 41, 3220–3226. [Google Scholar] [CrossRef]
  3. Seager, R.; Hoerling, M.; Schubert, S.; Wang, H.; Lyon, B.; Kumar, A.; Nakamura, J.; Henderson, N. Causes of the 2011 to 2014 California drought. J. Clim. 2015, 28, 6997–7024. [Google Scholar] [CrossRef]
  4. Watson, P.A.G.; Weisheimer, A.; Knight, J.R.; Palmer, T.N. The role of the tropical West Pacific in the extreme Northern Hemisphere winter of 2013/2014. J. Geophys. Res. Atmos. 2016, 121, 1698–1714. [Google Scholar] [CrossRef]
  5. Howitt, R.; Medellin-Azuara, J.; MacEwan, D.; Lund, J.; Sumner, D.A. Economic Analysis of the 2014 Drought for California Agriculture; Center for Watershed Sciences, University of California: Davis, CA, USA, 2014. [Google Scholar]
  6. Williams, A.P.; Seager, R.; Abatzoglou, J.T.; Cook, B.I.; Smerdon, J.E.; Cook, E.R. Contribution of anthropogenic warming to California drought during 2012–2014. Geophys. Res. Lett. 2015, 42, 6819–6828. [Google Scholar] [CrossRef]
  7. Swain, D.L.; Tsiang, M.; Haugen, M.; Singh, D.; Charland, A.; Rajaratnam, B.; Diffenbaugh, N.S. The extraordinary California drought of 2013/2014: Character, context, and the role of climate change. Bull. Am. Meteorol. Soc. 2014, 95, S3–S7. [Google Scholar]
  8. Wang, H.; Schubert, S. Causes of the extreme dry conditions over California during early 2013 [in “Explaining Extremes of 2013 From a Climate Perspective”]. Bull. Am. Meteorol. Soc. 2014, 95, S7–S11. [Google Scholar] [CrossRef]
  9. Seager, R.; Henderson, N. On the role of tropical ocean forcing of the persistent North American west coast ridge of winter 2013/14. J. Clim. 2016, 29, 8027–8049. [Google Scholar] [CrossRef]
  10. Ropelewski, C.F.; Halpert, M.S. Global and regional scale precipitation patterns associated with the El Niño/Southern Oscillation. Mon. Weather Rev. 1987, 115, 1606–1626. [Google Scholar] [CrossRef]
  11. Gershunov, A.; Barnett, T. Interdecadal modulation of ENSO teleconnections. Bull. Am. Meteorol. Soc. 1998, 79, 2715–2726. [Google Scholar] [CrossRef]
  12. McCabe, G.J.; Dettinger, M.D. Decadal variations in the strength of ENSO teleconnections with precipitation in the western United States. Int. J. Climatol. 1999, 19, 1399–1410. [Google Scholar] [CrossRef] [Green Version]
  13. Myoung, B.; Deng, Y. Interannual variability of the cyclone activity along the US Pacific Coast: Influences on the characteristics of winter precipitation in the western US. J. Clim. 2009, 22, 5732–5747. [Google Scholar] [CrossRef]
  14. Lee, S.-K.; Lopez, H.; Chung, E.-S.; DiNezio, P.; Yeh, W.S.; Wittenberg, A.T. On the fragile relationship between El Niño and California rainfall. Geophys. Res. Lett. 2018, 45, 907–915. [Google Scholar] [CrossRef]
  15. Hurrell, J.W.; Van Loon, H. Decadal variations in climate associated with the North Atlantic Oscillation. Clim. Chang. 1997, 36, 301–326. [Google Scholar] [CrossRef]
  16. Kapala, A.H.; Mächel, H.; Flohn, H. Behaviour of the centres of action above the Atlantic since 1881. Part II: Associations with regional climate anomalies. Int. J. Climatol. 1998, 18, 23–36. [Google Scholar] [CrossRef] [Green Version]
  17. Higgins, R.W.; Leetmaa, A.; Xue, Y.; Barnston, A. Dominant factors influencing the seasonal predictability of US precipitation and surface air temperature. J. Clim. 2000, 13, 3994–4017. [Google Scholar] [CrossRef]
  18. Shukla, J.; Wallace, J.M. Numerical simulation of the atmospheric response to equatorial Pacific sea surface temperature anomalies. J. Atmos. Sci. 1983, 40, 1613–1630. [Google Scholar] [CrossRef]
  19. Dettinger, M.; Cayan, D.R. Drought and the California delta—A matter of extremes. San Franc. Estuary Watershed Sci. 2014, 12, 1–6. [Google Scholar] [CrossRef]
  20. Latif, M.; Barnett, T.P. Causes of decadal climate variability over the North Pacific and North America. Science 1994, 266, 634–637. [Google Scholar] [CrossRef] [PubMed] [Green Version]
  21. Brown, D.P.; Comrie, A.C. A winter precipitation ‘dipole’ in the western United States associated with multidecadal ENSO variability. Geophys. Res. Lett. 2004, 31, L09203. [Google Scholar] [CrossRef]
  22. McCabe, G.J.; Palecki, M.A.; Betancourt, J.L. Pacific and Atlantic Ocean influences on multidecadal drought frequency in the United States. Proc. Natl. Acad. Sci. USA 2004, 101, 4136–4141. [Google Scholar] [CrossRef] [PubMed] [Green Version]
  23. Myoung, B.; Kim, S.H.; Kim, J.; Kafatos, M.C. On the relationship between the North Atlantic Oscillation and early warm season temperatures in the southwestern United States. J. Clim. 2015, 28, 5683–5698. [Google Scholar] [CrossRef]
  24. Trenberth, K.E.; Branstator, G.W.; Karoly, D.; Kumar, A.; Lau, N.C.; Ropelewski, C. Progress during TOGA in understanding and modeling global teleconnections associated with tropical sea surface temperatures. J. Geophys. Res. 1998, 103, 14291–14324. [Google Scholar] [CrossRef] [Green Version]
  25. Hurrell, J.M. Decadal trends in North Atlantic Oscillation and relationship to regional temperature and precipitation. Science 1995, 269, 676–679. [Google Scholar] [CrossRef] [PubMed]
  26. Jones, P.D.; Jónsson, T.; Wheeler, D. Extension to the North Atlantic Oscillation using early instrumental pressure observations from Gibraltar and south-west Iceland. Int. J. Climatol. 1997, 17, 1433–1450. [Google Scholar] [CrossRef]
  27. Kwon, M.; Jhun, J.-G.; Wang, B.; An, S.-I.; Kug, J.-S. Decadal change in relationship between east Asian and WNP summer monsoons. Geophys. Res. Lett. 2005, 32, L16709. [Google Scholar] [CrossRef]
  28. Chen, X.; Zhou, T. Relative role of tropical SST forcing in the 1990s periodicity change of the Pacific-Japan pattern interannual variability. J. Geophys. Res. Atmos. 2014, 119. [Google Scholar] [CrossRef]
  29. Ding, H.; Greatbatch, R.J.; Latif, M.; Park, W.; Gerdes, R. Hindcast of the 1976/77 and 1998/99 climate shifts in the Pacific. J. Clim. 2013, 26, 7650–7661. [Google Scholar] [CrossRef]
  30. Jin, D.; Hameed, S.N.; Huo, L. Recent changes in ENSO teleconnection over the Western Pacific impacts the Eastern China precipitation dipole. J. Clim. 2016, 29, 7587–7598. [Google Scholar] [CrossRef]
  31. Ashok, K.; Behera, S.; Rao, A.S.; Weng, H.; Yamagata, T. El Niño Modoki and its teleconnection. J. Geophys. Res. 2007, 112. [Google Scholar] [CrossRef]
  32. Kao, H.Y.; Yu, J. Contrasting eastern Pacific and central Pacific types of ENSO. J. Clim. 2009, 22, 615–632. [Google Scholar] [CrossRef]
  33. Kug, J.S.; Jin, F.; An, S.I. Two types of El Niño events: Cold tongue El Niño and warm pool El Niño. J. Clim. 2009, 22, 1499–1515. [Google Scholar] [CrossRef]
  34. Yeh, S.W.; Kug, J.S.; Dewitte, B.; Kwon, M.H.; Kirtman, B.P.; Jin, F.F. El Niño in a changing climate. Nature 2009, 461, 511–514. [Google Scholar] [CrossRef] [PubMed]
  35. Yeh, S.W.; Wang, X.; Wang, C.; Dewitte, B. On the relationship between the North Pacific climate variability and Central Pacific El Nino. J. Clim. 2015, 28, 663–677. [Google Scholar] [CrossRef]
  36. Lau, K.-M.; Kim, K.-M.; Yang, S. Dynamical and boundary forcing characteristics of regional components of the Asian summer monsoon. J. Clim. 2000, 13, 2461–2482. [Google Scholar] [CrossRef]
  37. Lee, S.-E.; Seo, K.-H. The Development of a Statistical Forecast Model for Changma. Weather Forecast. 2013, 28, 1304–1321. [Google Scholar] [CrossRef]
  38. Wang, B.; Xiang, B.; Lee, J. Subtropical High predictability establishes a promising way for monsoon and tropical storm predictions. Proc. Natl. Acad. Sci. USA 2013, 110, 2718–2722. [Google Scholar] [CrossRef] [PubMed] [Green Version]
  39. Yim, S.-Y.; Wang, B.; Xing, W.; Lu, M.-M. Prediction of Meiyu rainfall in Taiwan by multi-lead physical–empirical models. Clim. Dyn. 2015, 44, 3033–3042. [Google Scholar] [CrossRef]
  40. Teng, H.; Branstator, G. Causes of extreme ridges that induce California droughts. J. Clim. 2017, 30, 1477–1492. [Google Scholar] [CrossRef]
  41. Capotondi, A.; Wittenberg, A.T.; Newman, M.; Di Lorenzo, E.; Yu, J.Y.; Braconnot, P.; Cole, J.; Dewitte, B.; Giese, B.; Guilyardi, E.; et al. Understanding ENSO diversity. Bull. Am. Meteor. Soc. 2015, 96, 921–938. [Google Scholar] [CrossRef]
  42. Paek, H.; Yu, J.-Y.; Qian, C. Why were the 2015/2016 and 1997/1998 extreme El Niños different? Geophys. Res. Lett. 2017, 44, 1848–1856. [Google Scholar] [CrossRef]
  43. Vecchi, G.A.; Delworth, T.L.; Booth, B. Origin of Atlantic decadal swings. Nature 2017, 548, 284–285. [Google Scholar] [CrossRef] [PubMed]
  44. Yu, J.-Y.; Paek, H. Precursors of ENSO beyond the tropical Pacific. US CLIVAR Var. 2015, 13, 15–20. [Google Scholar]
  45. Wang, L.; Yu, J.-Y.; Paek, H. Enhanced biennial variability in the Pacific due to Atlantic capacitor effect. Nat. Commun. 2017, 8, 14887. [Google Scholar] [CrossRef] [PubMed] [Green Version]
  46. Sun, C.; Kucharski, F.; Li, J.; Jin, F.-F.; Kang, I.-S.; Ding, R. Western tropical Pacific multidecadal variability forced by the Atlantic multidecadal oscillation. Nat. Commun. 2017, 8, 15998. [Google Scholar] [CrossRef] [PubMed] [Green Version]
Figure 1. Forty-two-year (1975–2016) time series of annual (blue dashed line) and DJF (purple solid line) precipitation anomaly (PRCP) in CA (y-axis in left). The red and blue arrows indicate El Niño and La Niña winters, respectively.
Atmosphere 09 00455 g001
Figure 2. Correlation map of precipitation with (a) sea-level pressure, (b) geopotential height at 500 hPa, (c) outgoing long-wave radiation and (d) sea surface temperature for the 41-year (1975–2015). Correlation coefficients are multiplied by (−1.0). Black solid lines indicate significance at the 95% confidence level.
Atmosphere 09 00455 g002
Figure 3. The first (a) and second (b) EOF mode for the winter-mean 500 hPa geopotential height for the 41-year period and their principle components (c,d, respectively). Scatter plots of anomalies of CA winter precipitation (inches in y-axis) with PC1 and PC2 for the 41-year (21-year) period are shown in (e,f), and (g,h), respectively. One outlier is indicated by the dotted circle in (h).
Atmosphere 09 00455 g003
Figure 4. The 41-year (1975–2015) correlation map of the PC2 with (a) SST, (b) SLP, (c) OLR, (d) CRU surface temperature, and (e) CRU precipitation. Black solid lines indicate statistical significance at the 95% confidence level.
Atmosphere 09 00455 g004
Figure 5. Composite anomaly fields of (i) HGT_500 (m), (ii) SST (°C), (iii) SLP (mb), and (iv) CRU precipitation (mm) of the positive and negative PC2 composite (a,b, respectively) shown in Table 4. Black solid lines indicate statistical significance at the 95% confidence level.
Atmosphere 09 00455 g005
Figure 6. Correlation map of precipitation with (a) SLP, (b) HGT, (c) OLR and (d) SST for the 21-year (1995–2015). Correlation coefficients are multiplied by (−1.0). Black solid lines indicate significance at the 95% confidence level.
Atmosphere 09 00455 g006
Figure 7. Twenty-one-year (1995–2015) correlation map of PC2 and SST. Black solid lines indicate significance at the 95% confidence level.
Atmosphere 09 00455 g007
Figure 8. Forty-one-year correlation map of HGT with (a) WTP and (b) SNINO12 for Period 1 (1975–2015); (c), and (d) are the same but for Period 2 (1995–2015). SNINO12 values are multiplied by (−1.0). Black solid lines indicate statistical significance at the 95% confidence level.
Atmosphere 09 00455 g008
Figure 9. (a) Correlation coefficients (21-year running results from 1975 to 2015) between the observed DJF precipitation and the regressed precipitation using three single dependent variables. (b) Observed DJF precipitation (blue bar, inches) and regressed DJF precipitation (orange bar, inches) using WTP diff for a recent period of 21 years (1995–2015).
Atmosphere 09 00455 g009
Figure 10. R-squared values for each climate division of CA.
Atmosphere 09 00455 g010
Table 1. Specified periods for research.
Period NamePeriod
Period 11974/1975~2014/2015 (41 years)
Period 21994/1995~2014/2015 (21 years)
Table 2. Temporal correlation of CA Dec–Feb averaged precipitation with PC1 and with PC2 for Period 1 and Period 2. Numbers in bold are statistically significant at the 95% confidence level.
PeriodPC1PC2
Period 1 (41 years)−0.27−0.35
Period 2 (21 years) −0.37−0.44
Table 3. Forty-one-year correlation coefficients of PC1, PC2, and PRCP with various oceanic and atmospheric indices. Bolds are statistically significant correlations at the 95% confidence level.
Index PC1PC2PRCP
NINO34−0.41−0.410.33
NINO4−0.42−0.310.30
NINO12−0.27−0.370.40
EMI−0.36−0.120.18
PDO−0.53−0.250.19
wNINO0.170.42−0.15
SOI−0.280.44−0.47
NAO0.78−0.38−0.11
AO0.94−0.20−0.12
Table 4. Composite years of the positively and negatively extreme PC2 years within the 41-year period (1975–2015). Refer to the manuscript for the definitions of the composite years and the drought years. The number of years is indicated in parentheses. Bold and italics indicate winter drought years. Red and blue colors refer El Niño and La Niña winters, respectively.
ModeYears
Positive PC21979, 1982, 1985, 1990, 2009, 2011, and 2014 (7)
Negative PC21981, 1983, 1992, 1995, 1998, and 2012 (6)
Table 5. Linear regression models estimating DJF precipitation in each climate division of CA using WTP_diff for the 21-year (1995–2015) period.
CA Climate DivisionConstantCoefficient (WTP_diff)
North Coast (D1)5.782−12.776
Sacramento River (D2)5.510−11.094
Northeast Interior Basins (D3)1.259−4.856
Central Coast Drainage (D4)3.960−8.716
San Joaquin Drainage (D5)2.656−7.102
South Coast Drainage (D6)1.970−8.414
Southeast Desert Basin (D7)0.306−2.233

