Article

Polycyclic Aromatic Hydrocarbons in PM2.5 and PM2.5–10 in Urumqi, China: Temporal Variations, Health Risk, and Sources

1
Key Laboratory of Coal Clean Conversion and Chemical Engineering Process, Xinjiang Uyghur Autonomous Region, College of Chemistry and Chemical Engineering, Xinjiang University, Urumqi 830046, China
2
State Environmental Protection Key Laboratory of Urban Environment & Ecology, South China Institute of Environmental Sciences, Ministry of Environmental Protection, Guangzhou 510535, China
3
State Key Laboratory of Organic Geochemistry, Guangzhou Institute of Geochemistry, Chinese Academy of Sciences, Guangzhou 510640, China
*
Authors to whom correspondence should be addressed.
Atmosphere 2018, 9(10), 412; https://doi.org/10.3390/atmos9100412
Submission received: 21 July 2018 / Revised: 7 October 2018 / Accepted: 18 October 2018 / Published: 22 October 2018
(This article belongs to the Section Air Quality)

Abstract

:
PM2.5 and PM2.5–10 samples were simultaneously collected in Urumqi from January to December 2011, and 14 priority polycyclic aromatic hydrocarbons (PAHs) were determined. The mean concentrations of total PAHs in PM2.5 and PM2.5–10 were 20.90~844.22 ng m−3 and 19.65~176.5 ng m−3 respectively, with the highest in winter and the lowest in summer. Above 80% of PAHs were enriched in PM2.5, which showed remarkable seasonal variations compared to coarse particles. High molecular weight (HMW) PAHs were predominant in PM2.5 (46.61~85.13%), whereas the proportions of lower molecular weight (LMW) and HMW PAHs in PM2.5–10 showed a decreasing and an increasing trend, respectively, from spring to winter. The estimated concentrations of benzo[a]pyrene equivalent carcinogenic potency (BaPeq) in PM2.5 (10.49~84.52 ng m−3) were higher than that of in PM2.5–10 (1.15~13.33 ng m−3) except in summer. The estimated value of inhalation cancer risk in PM2.5 and PM2.5–10 were 1.63 × 10⁻⁴~7.35 × 10⁻³ and 9.94 × 10⁻⁵~1.16 × 10⁻³, respectively, far exceeding the health-based guideline level of 10−4. Diagnostic ratios and positive matrix factorization results demonstrated that PAHs in PM2.5 and PM2.5–10 were from similar sources, such as coal combustion, biomass burning, coking, and petroleum combustion, respectively. Coal combustion was the most important source for PAHs both in PM2.5 and PM2.5–10, accounting for 54.20% and 50.29%, respectively.

Graphical Abstract

1. Introduction

Polycyclic aromatic hydrocarbons (PAHs) are ubiquitous constituents of particulate matter in the atmosphere and well-known to be carcinogenic and/or mutagenic [1,2], and are emitted into the atmosphere from natural as well as anthropogenic sources. Natural sources include forest fires and volcanic eruptions, while anthropogenic sources include meat cooking, motor vehicles, road dust (including particles generated by tire wear and brake lining erosion), natural gas home appliances, tobacco smoke, asphalt, boilers, coal combustion, wood burning [3,4], solid waste incineration, and petroleum spills and discharge [5].
Urumqi, the capital of Xinjiang Uygur Autonomous Region of China, is in central Xinjiang, which is on the north foot of Tianshan Mountain and the south edge of Jungger Basin. It is located in the center of Asia, north of the Taklimakan desert and south of the Gurbantunggut desert (Figure 1). Three sides of it are surrounded by the Tianshan Mountain, of which the highest elevation is 5000 m. The particles are brought into the urban area from the Quasigeer basin through the north–south route [6,7]. Rapid economic development has caused more and more serious air pollution problems in Urumqi, which is one of the most polluted cities during winter in China [8]. During the six months of heating, the city was covered by the haze for at least one third of the time. Li et al. (2008) reported that the mean concentrations of PM10 in the winter of 2006 in Urumqi was 305.6 µg m−3 with a maximum of 1048.5 µg m−3, and the mean concentrations of PM2.5 (particle diameter ≤2.5 µm) and TSP (Total Suspended Particulate, particle diameter ≤100 µm) in the winter of 2007 were 187 and 385 µg m−3 with a maximum of 487 and 1313 µg m−3, respectively, far higher than the National Ambient Air Quality Standard of China [6].
Research on atmospheric PAHs in China is mainly focused on the Yangtze River Delta and the Pearl River Delta region [9,10,11,12,13,14]. In contrast, much fewer studies (most published in Chinese) have been carried out in Urumqi [7,8,15,16,17,18,19,20]. Early, Peng et al. (2006) analyzed the sources of PAHs in TSP and in PM10 in Urumqi with the composition of carbon isotope [20]. Diao et al. (2005) analyzed PAHs using a GC/MS technique in Urumqi Xinshi district from December 2004 to January 2005 (winter) and reported that the major source of PAHs in Urumqi Xinshi district was coal combustion and vehicle exhaust [15]. Lately, Limu et al. (2013) analyzed the PAHs in PM2.5 and PM2.5–10 in Urumqi’s southern urban area from 26 September 2010 to 3 March 2011 (autumn and wintertime) [7]. The results showed that the ΣPAHs (sum of 15 PAHs) ranged from 0.11 to 1058.08 ng m−3 in PM2.5 and 0.01 to 90.89 ng m−3 in PM2.5–10, respectively, and 90% of the ΣPAHs existed in PM2.5. The above studies were based on the winter or autumn seasons, and the source analysis of PAHs in Urumqi was limited to the ratio and the principal component analysis methods. Although Ren et al. (2017) reported particle size distribution of PAHs in the atmosphere of Urumqi and analyzed their source using the Positive Matrix Factorization (PMF) model, it was also limited to the heating season [8]. Urumqi belongs to typical temperate semiarid continental climate, with a large temperature difference between winter and summer. Winter is long and cold, and the temperature is stable. It is windy in spring and autumn, and the precipitation is concentrated in summer, which has the effect of washing and purifying pollutants in the atmosphere. The pollution characteristics of PAHs in different seasons may vary greatly. However, to date, there are few detailed studies about the pollution levels, particle size distributions, temporal variations, health risk, identification, and apportionment of the specific pollution sources of PAHs using PMF model in PM2.5 and PM2.5–10 in Urumqi throughout the year. Our study sought to fill this knowledge gap.

2. Materials and Methods
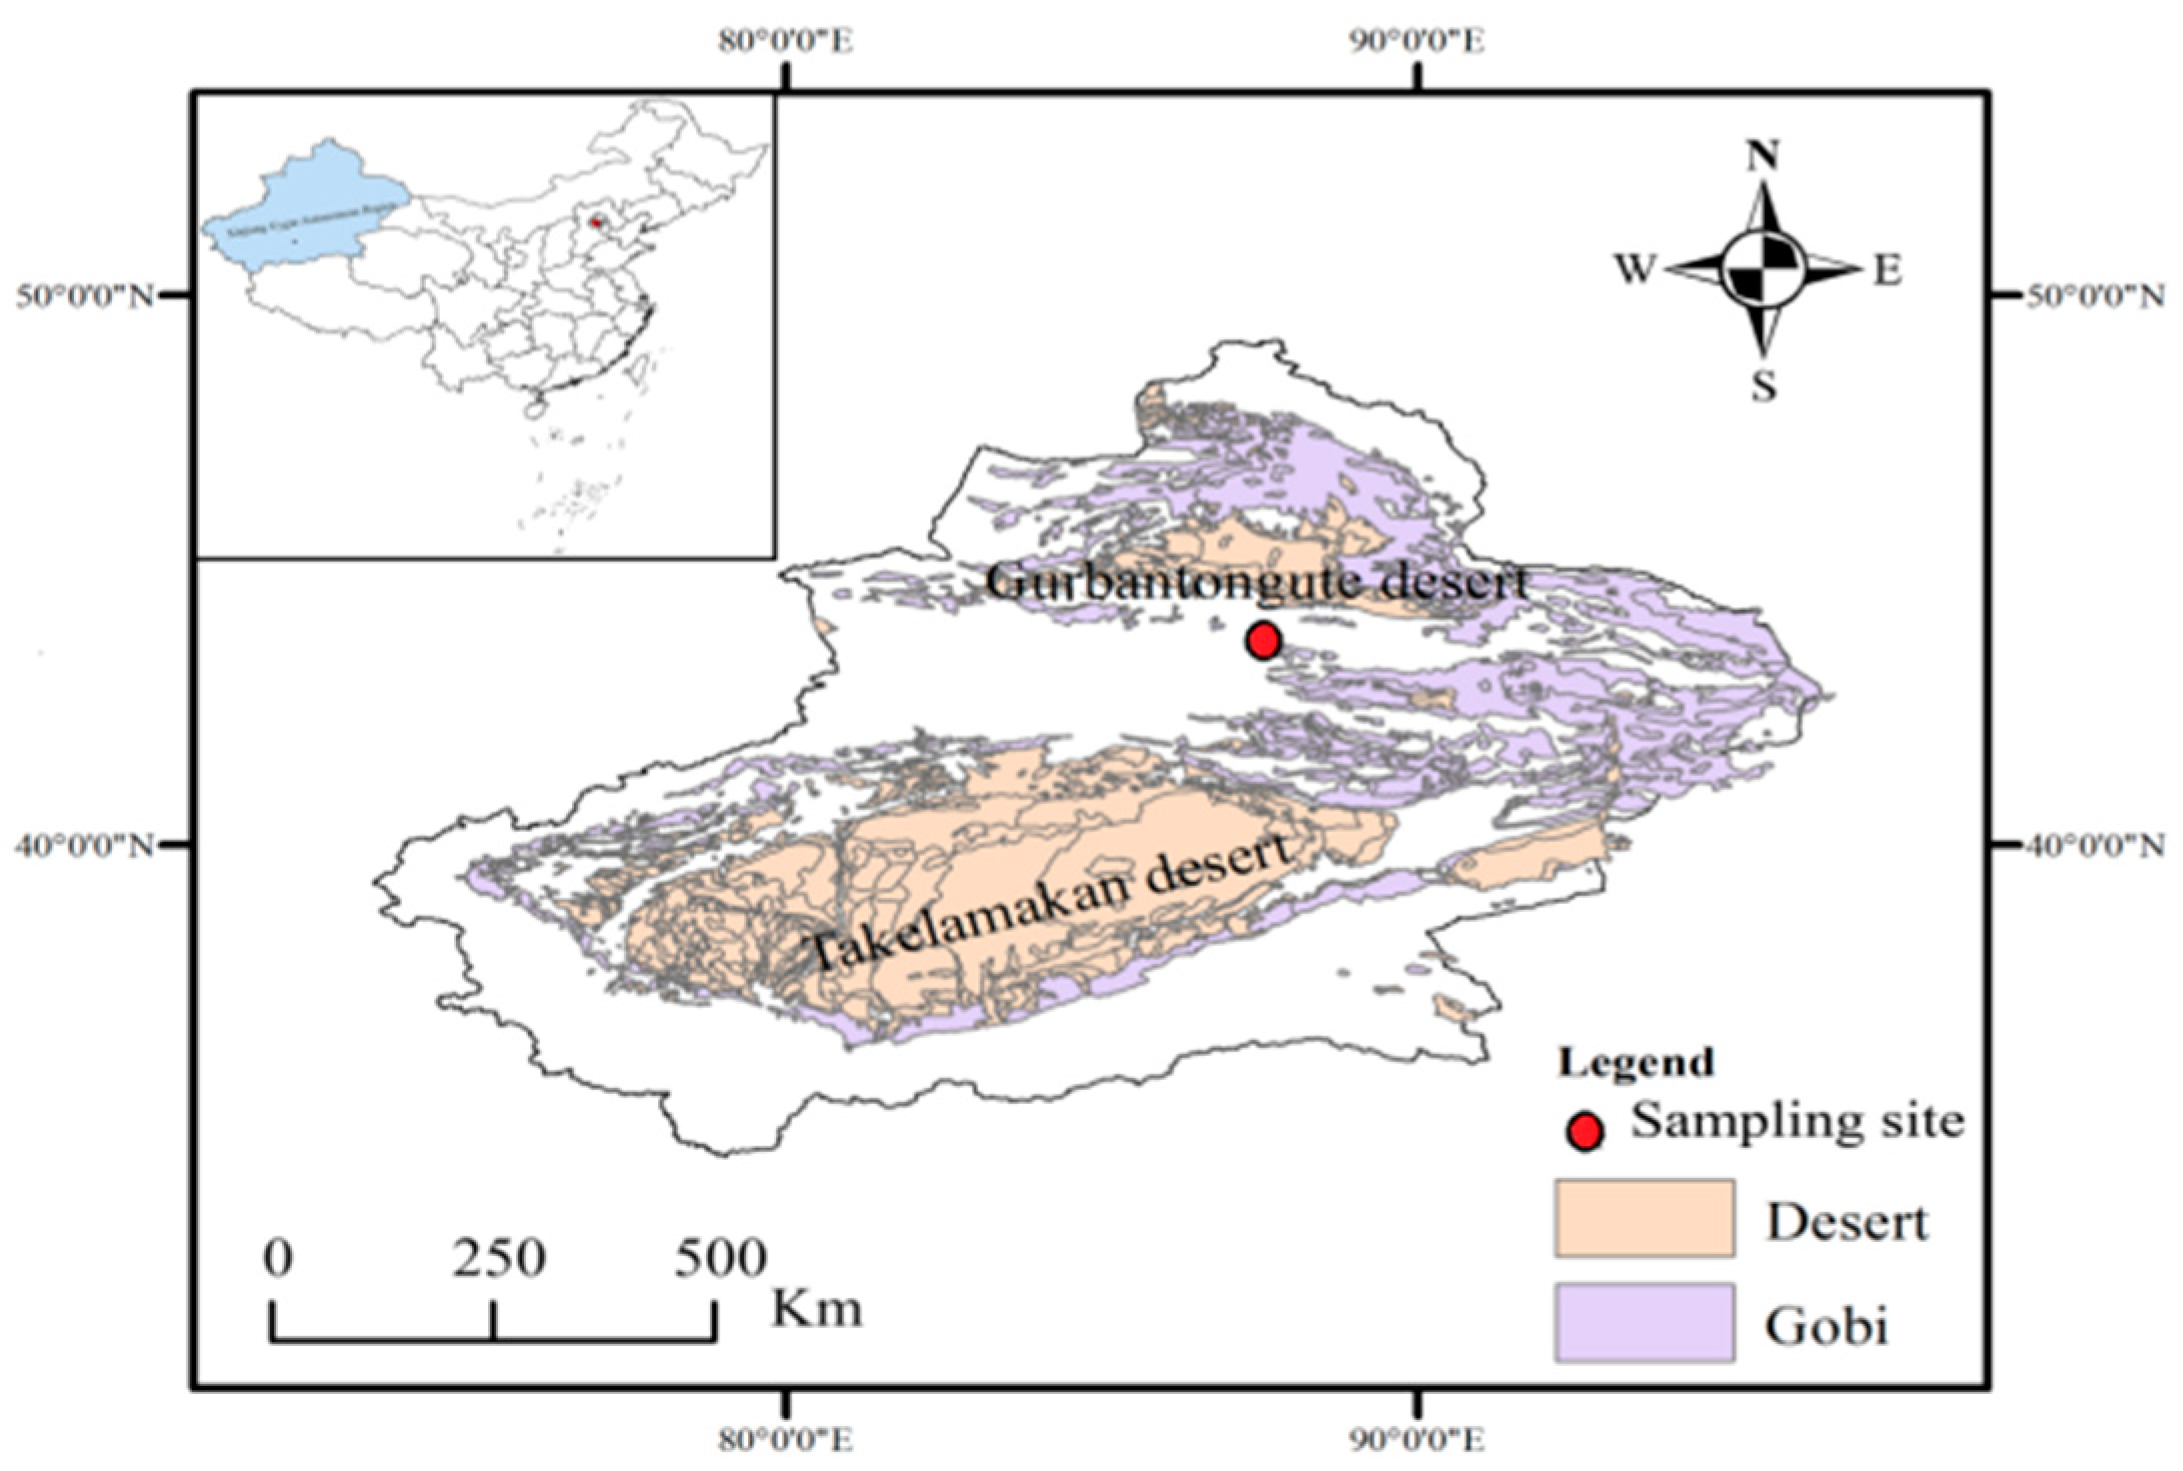
2.1. Sampling

Samples were collected at the rooftop (9 m above the ground) of the Xinjiang branch of Chinese academy of sciences (N43°51′51″, E87°34′9″) in Xinshi district in Urumqi. This point is 500 m away from the main road (Beijing road). Xinshi district, located in the northwest of Urumqi city with a total area of 143 km2 and a total population of 730,307 (2010), is the National Technology Industry Development Zone. It is also the transportation center to the north Xinjiang, representing an area of mixed residential, commercial, and industrial activities.
On five rainless days each month from January to December 2011, a middle-volume sampler (NL20; Tokyo Dylec Co, Tokyo, Japan) equipped with quartz fiber filter (Whatman, Mainstone, UK) was used to collect 24-h PM2.5 and PM2.5–10 particles simultaneously at a flow rate of 20 L/min. The filters were wrapped within aluminum foil and baked for 4 h at 450 °C before sampling. After sampling, samples were also wrapped in prebaked aluminum foil, sealed with clean Teflon bags and stored at −20 °C until analysis [7].

2.2. Pretreatment and Analysis of Samples

Extraction and analysis of PAHs was performed according to a previously published protocol [10]. Before solvent extraction, deuterium PAH standards (Naphthalene-d8, Acenaphthene-d10, Phenanthrene-d10, Chrysene-d12, and Perylene-d12), were added to the samples as surrogates. Each sample was ultrasonically extracted three times with 30 mL dichloromethane for 30 min each time. Then, the extracts were combined and concentrated to 1~2 mL by a rotary evaporator. Solvent was exchanged to n-hexane purified using a 1:2 alumina/silica column chromatography. Two fractions were eluted. The first fraction containing nonpolar compounds was eluted by 30 mL of hexane. The second fraction was eluted by 70 mL of DCM/hexane (3:7 v/v). The two fractions were combined, concentrated to ~1.0 mL by a rotary evaporator, and blown down to 0.3 mL under a gentle nitrogen stream.

2.3. GC/MS Analysis

All samples were analyzed by a gas chromatography-mass spectrometer (GC-MS) (Agilent 6890-5973N, Santa Clara, CA, USA) equipped with a HP-5MS elastic quartz capillary column (30 m × 0.25 mm × 0.25 mm). Injection of 1 µL samples was conducted with an automatic sampler in the splitless mode.
The chromatographic condition was as follows: carrier gas was helium with a purity of 99.9%; Inlet and transfer line temperatures were 290 °C; the oven temperature program was initiated at 65 °C (held for 2 min) and increased to 290 °C at 5 °C/min (held for 20 min). Mass spectrometric conditions were: electron impact (EI) selective ion monitoring mode, electron impact energy 70 ev [21]; multiplier voltage, 1624 V; scanning range (M/Z), 50~500 amu (unit of molecular mass).

2.4. Quality Control and Quality Assurance (QA/QC)

All samples were subjected to strict quality control and assurance, according to U.S. EPA-610 method [7]. Limits of detection (LOD) for each compound were calculated as three times the signal-to-noise ratio, which was taken as the standard deviation of the lowest level standard [22]. In this work, the LOD of PAHs was in the range of 0.02~0.12 ng m−3. The recovery experiment was done by spiking the standard solution onto blank filters (n = 3). Amounts of target compounds in the standard solution are similar to those in real samples. After being evaporated to dryness, the spiked filters were analyzed in a manner the same as the real samples [22]. The recoveries of deuterium polycyclic aromatic hydrocarbons in the samples were Naphthalene-d8 32% ± 9%, Phenanthrene-d10 38% ± 10%, Acenaphthene-d10 42% ± 8%, Chrysene-d12 88% ± 11%, and Perylene-d12 69% ± 9%. Field and laboratory blanks were also extracted and analyzed in the same way as the field samples. Target compounds were very low (0~0.05 ng m−3) and in most cases not detectable in the blanks. Data reported here are all corrected for the blanks, but not corrected for the recoveries.
In this study, 14 PAHs were analyzed including phenanthrene (Phe), anthracene (Ant), fluoranthene (Flu), pyrene (Pyr), benz[a]anthracene (BaA), chrysene (Chr), benzo[b]fluoranthene (BbF), benzo[k]fluoranthene (BkF), benzo[e]pyrene (BeP), benzo[a]pyrene (BaP), indeno[1,2,3-cd]pyrene (IcdP), benzo[g,h,i]perylene (BghiP), dibenz[a,h]anthracene (DahA), and Coronene (Cor). Because Naphthalene (Nap), Acenaphthene (Ace), Acenaphthylene (Acy), and Fluorene (Fl) are low molecular weight compounds with highly volatile characteristics which lead to low recovery rates, we did not discuss these compounds.

2.5. Source Apportionment with Positive Matrix Factorization (PMF)

Positive Matrix Factorization (PMF), a receptor-based source apportionment model, is based on a least squares method. In this study, the USEPA PMF 5.0 model was applied to identify the sources of observed ambient PAHs. The principles, detailed concepts, and applications of the PMF model for source apportionment can be found in previous studies [23,24]. In our study, we have tested 3~7 factors and discovered that three-factor solution produced a good fit to the data and was the most stable and interpretable. Additional factors made negligible contributions to PAHs and caused factor splitting for tracers. Therefore, more than three factors did not produce meaningful results compared with that of three factors. After the initial run, the Q values were stable, and the Q values in the robust mode were approximately equal to the degrees of freedom [25]. All of the scaled residuals were between −3 and 3. There was a good correlation between measured and predicted PAH concentrations, indicating that most of the species were simulated well.

3. Results and Discussion

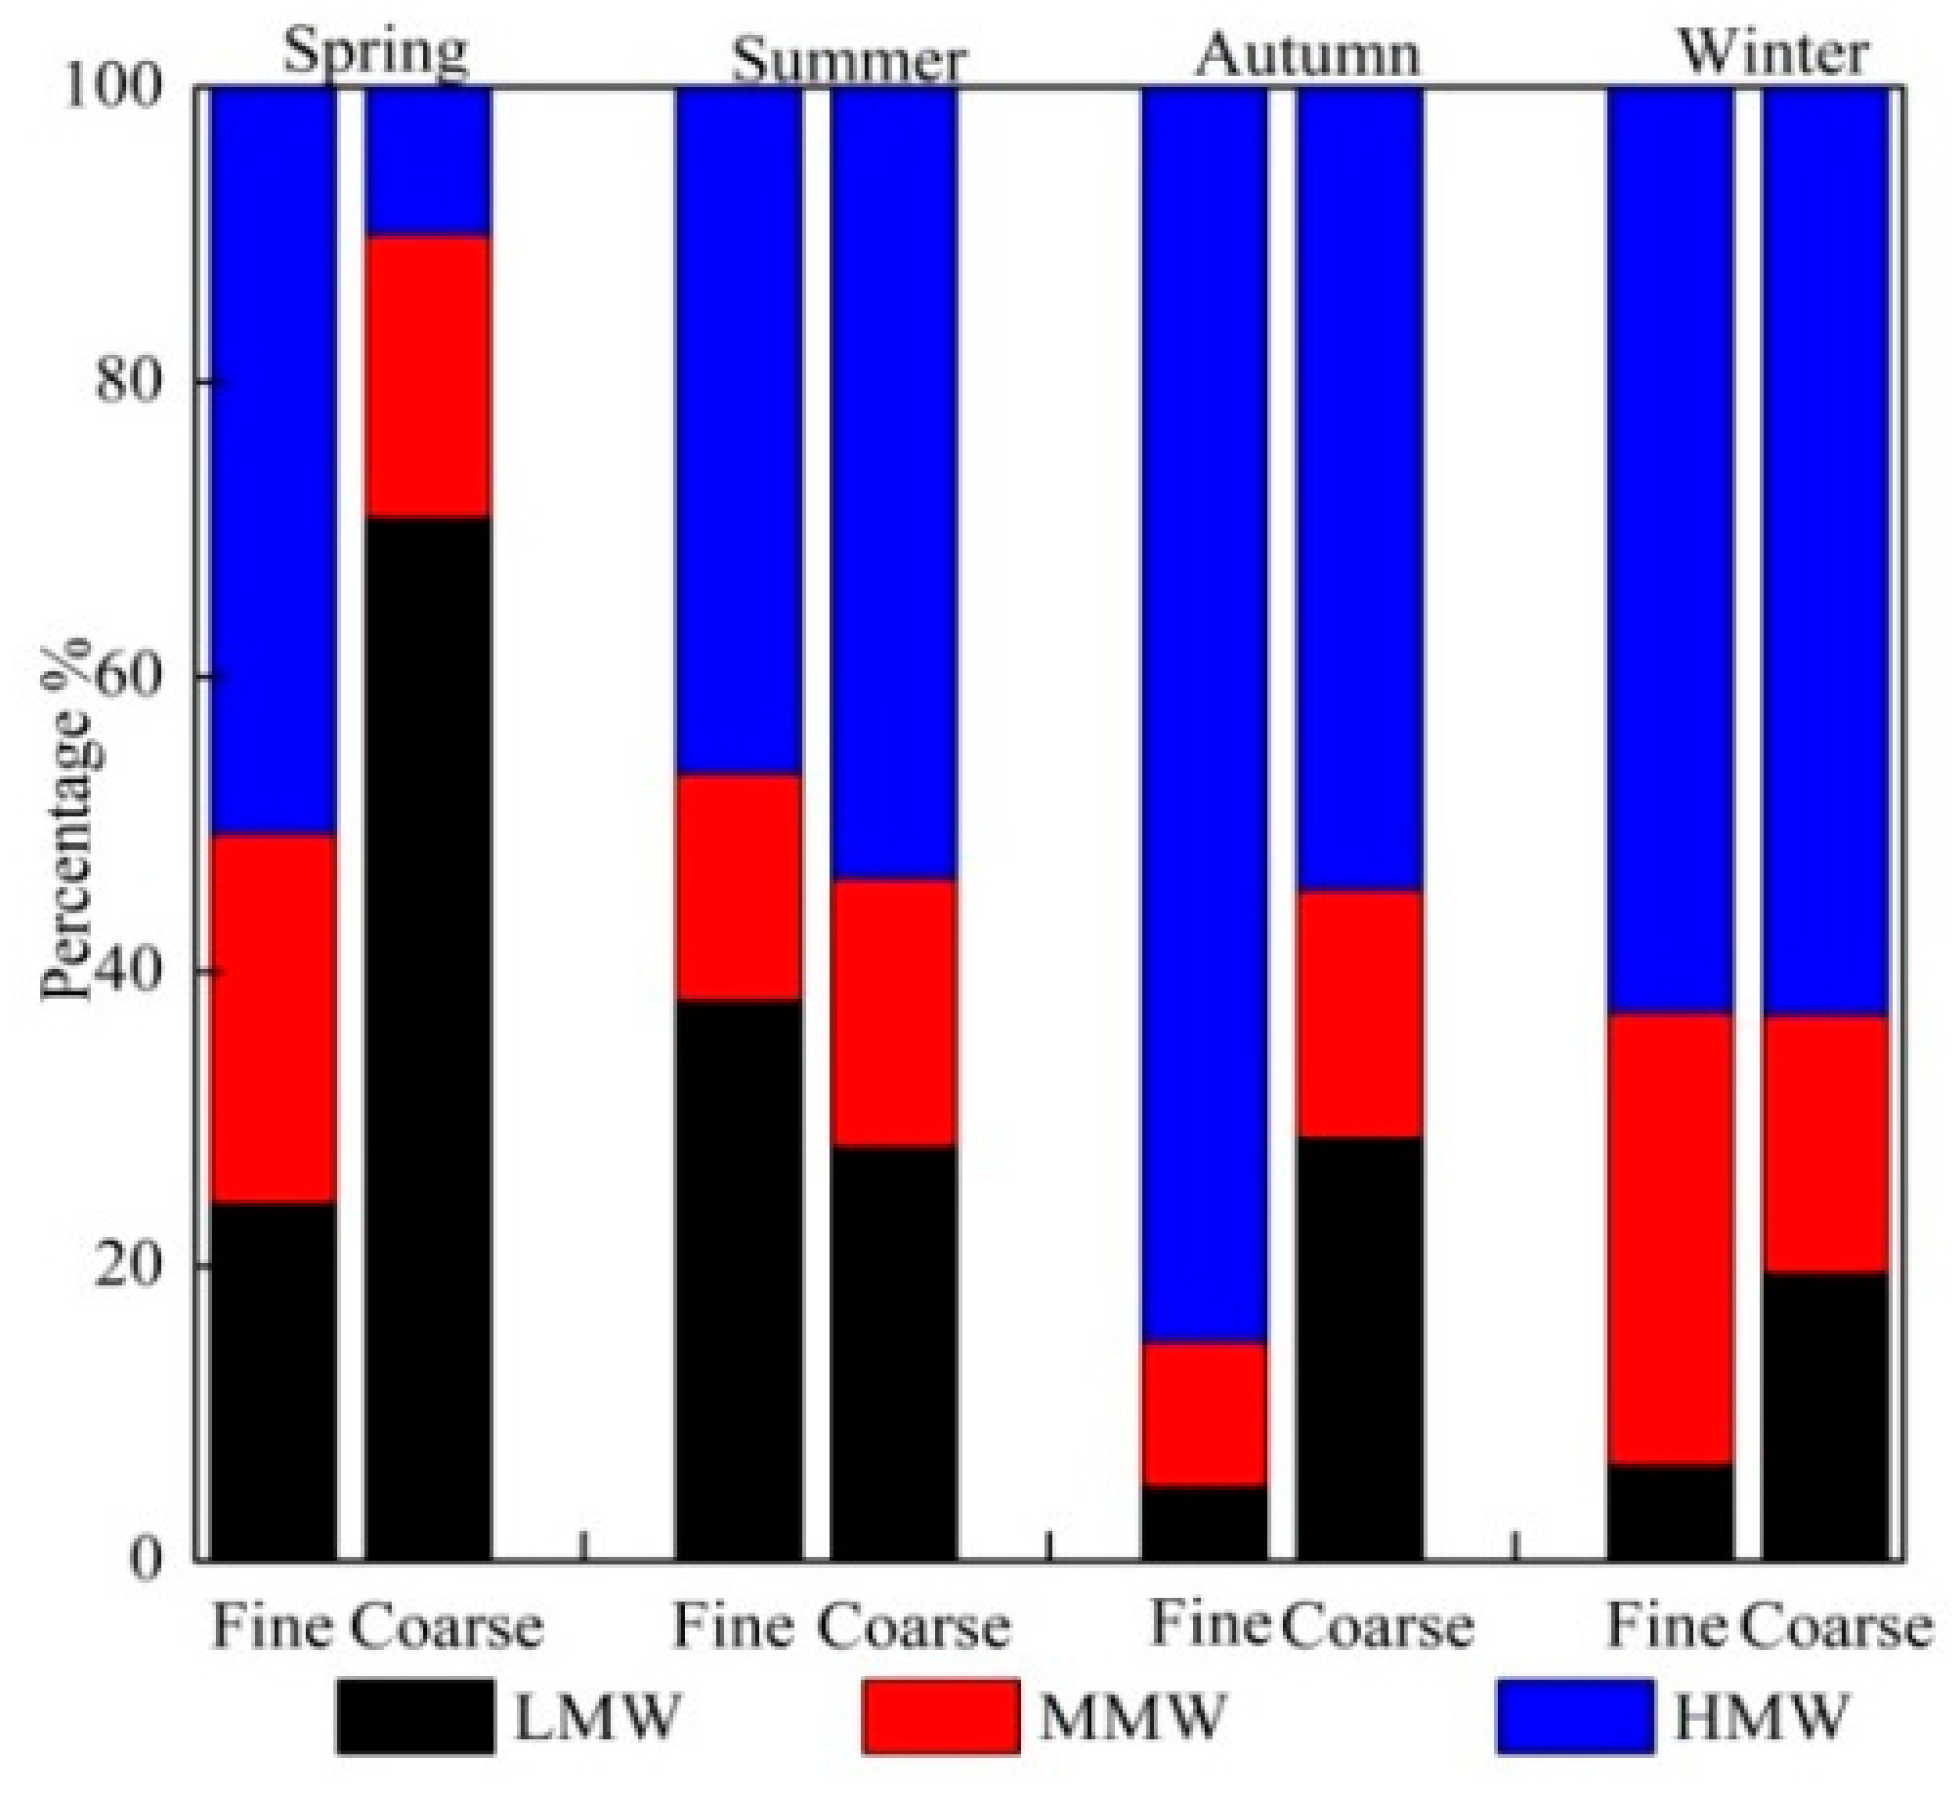
3.1. Size Distributions of PAHs in Aerosols

The mean concentrations and particle size distributions of individual and total PAHs in PM2.5 and PM2.5–10 were shown in Table 1. The mean concentrations of individual PAHs in PM2.5 and PM2.5–10 were in the range of 0.24 ng m−3 (Cor)~148.68 ng m−3 (BbF) and 0.09 ng m−3 (Cor)~44.50 ng m−3 (Phe), respectively. The mean concentration of total PAHs (Σ14PAHs) varied 20.90~844.22 ng m−3 (mean: 303.37 ng m−3) in PM2.5 and 19.65~176.50 ng m−3 (mean: 72.06 ng m−3) in PM2.5–10, respectively. We found that the mean concentrations of PM2.5- and PM2.5–10-bound PAHs in this study were much lower than those reported that Liaoning (PM2.5: 75.32~1900.89 ng m−3 and PM2.5–10: 16.74~303.24 ng m−3) [26], north of Portugal (PM2.5: 29 ± 10 μg m−3 and PM2.5–10: 14 ± 8 μg m−3) [27], whereas they were higher than Beijing (PM2.5: 199.23 ng m−3 and PM2.5–10: 64.06 ng m−3) [28]. The result of correlation analysis of the annual mean concentration of each individual PAHs in PM2.5 and PM2.5–10 indicated that, except for BaP (R2 = 0.35, p < 0.05) and BghiP (R2 = 0.05, p < 0.05), all the other individuals’ correlation coefficients (R2) in PM2.5 and PM2.5–10 were higher than 0.57, and the highest level reached 0.89 (BaA). The proportions (ρ2.5/(ρ2.5 + ρ2.5–10)) of the annual mean concentrations of PM2.5-bound individual PAHs in total (PM2.5 + PM2.5–10) were Phe 57.99%, Ant 45.40%, Flu 69.85%, Pyr 70.21%, BaA 77.63%, Chr 76.71%, BbF 78.96%, BkF 77.33%, BeP 76.54%, BaP 80.16%, IcdP 81.04%, Bghi P 79.36%, DahA 79.21%, and Cor 78.45%, respectively. The results indicated that, except for Ant, all the other PAHs were mainly distributed in fine particles and agreed with other studies [26,29,30], reflecting the influence of physicochemical properties and sources of particles.

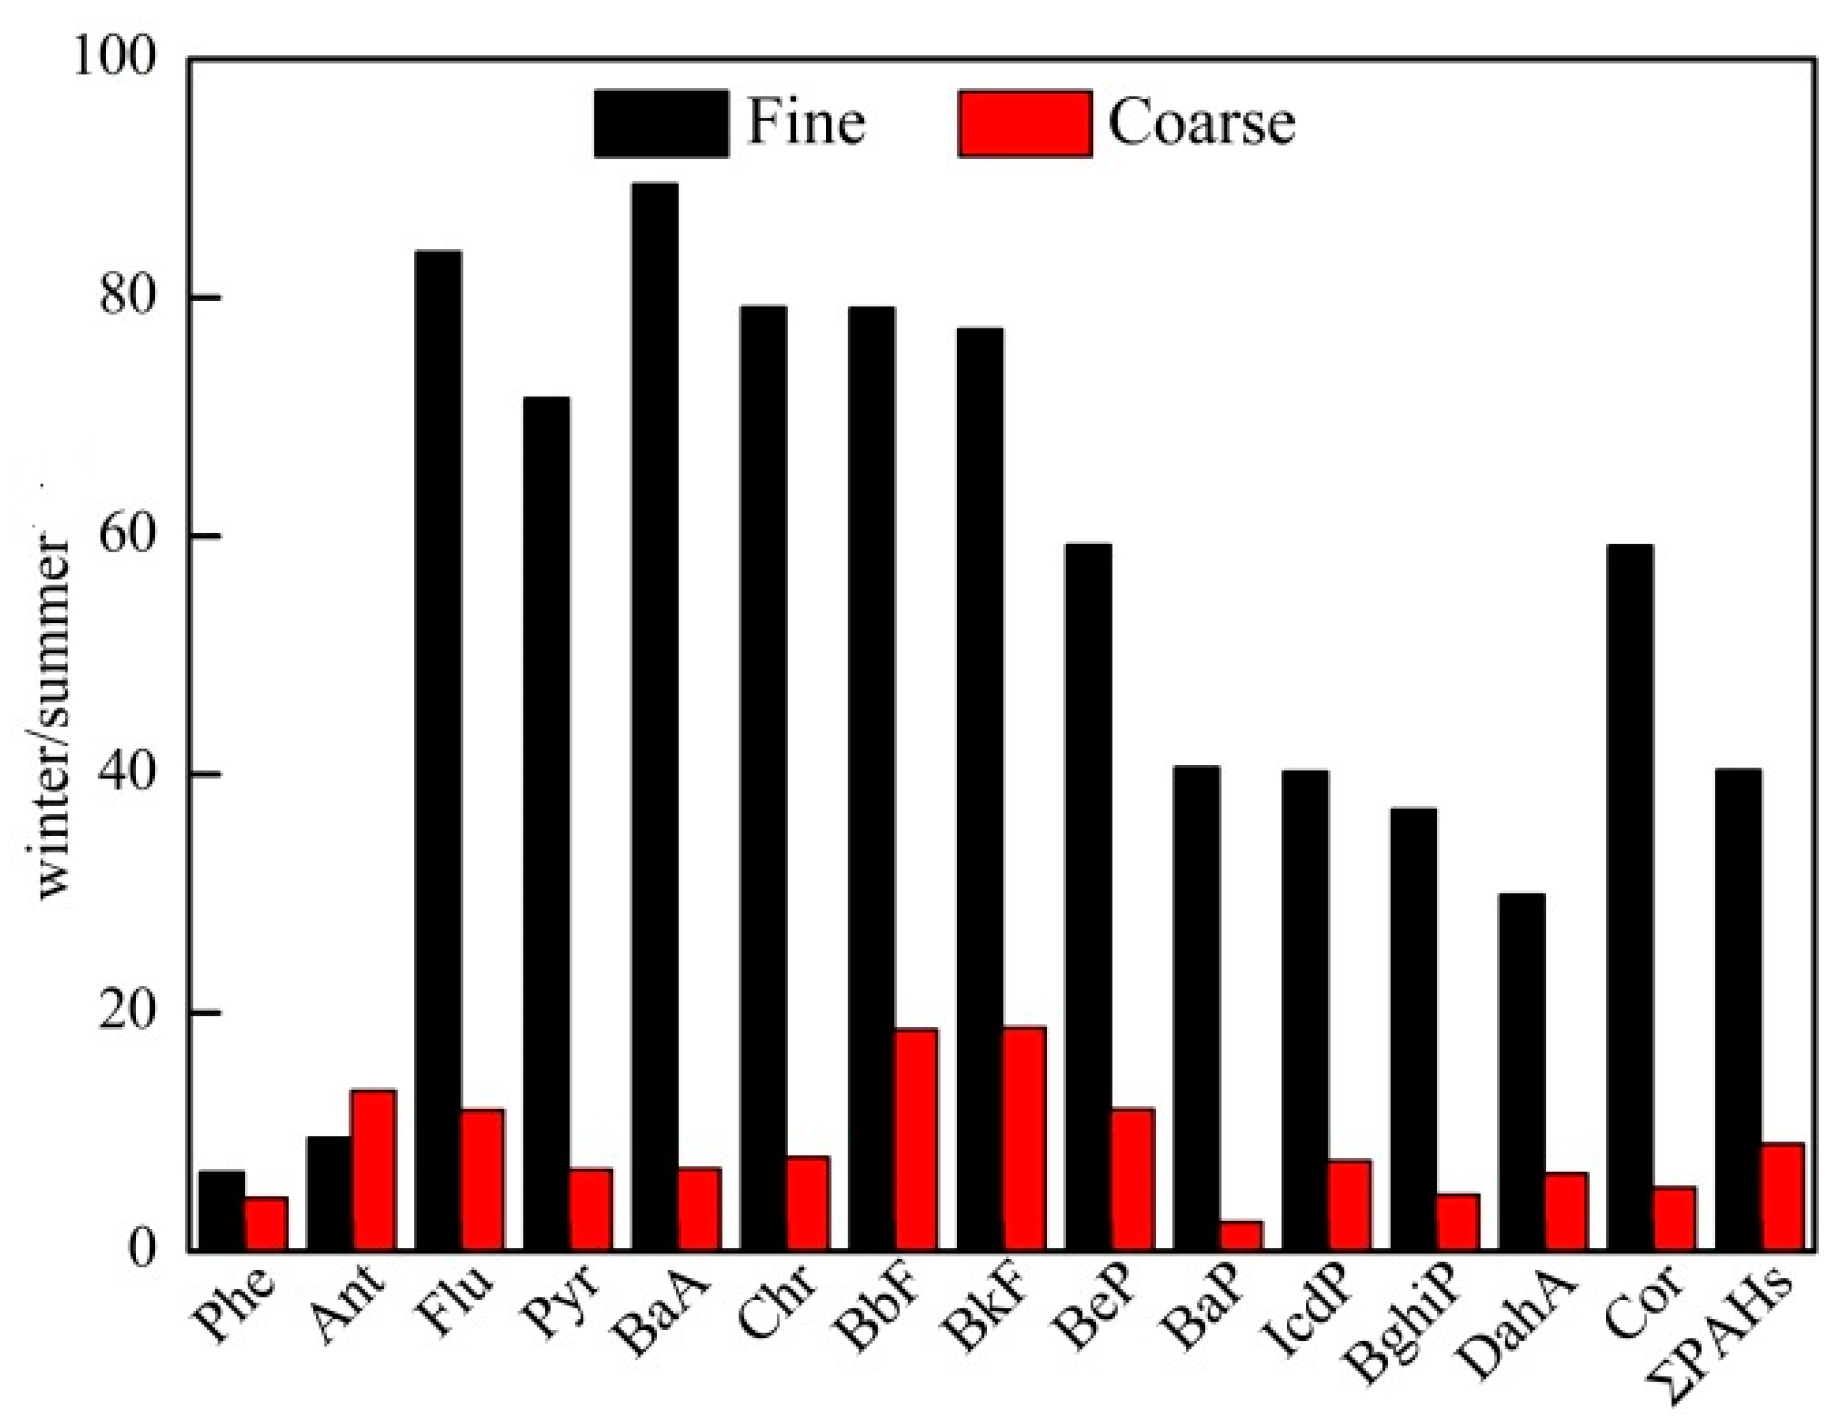
3.2. Seasonal Variations of PAHs in Aerosols

Table 1 presents seasonal variation of mean concentrations of Σ14PAHs in PM2.5 and PM2.5–10, whose values were 134.05 ng m−3 and 67.59 ng m−3 in spring, 20.90 ng m−3 and 19.65 ng m−3 in summer, 214.30 ng m−3 and 24.48 ng m−3 in autumn, and 844.2 ng m−3 and 176.5 ng m−3 in winter, respectively. The result suggested that the distribution of PAHs in particulate matter was significantly associated with seasonal variation. Namely, whether in PM2.5 or in PM2.5–10, the mean concentration of total PAHs was the lowest in summer and the highest in winter. This could be explained by adverse weather conditions for pollutant dispersion in cold season [31]. In PM2.5, the concentrations of total PAHs in autumn were higher than in spring, while an opposite trend was found in PM2.5–10. In addition, the ρ2.5/(ρ2.5 + ρ2.5–10) value of total PAHs decreased from 80% over in autumn and winter with colder temperature to 51.57% in summer. This behavior may be explained by higher incidence of resuspension and abrasion processes in summer [32]. The result was in agreement with Manoli et al. (2002), showing that the ρ2.5/(ρ2.5 + ρ2.5–10) value of total PAHs during cold periods was 96.1~98.4%, and in relatively warm periods slightly decreased to 92.2~97.8% in Thessaloniki [33]. However, Guo et al. (2003) observed that the proportion of PM2.5-bound total PAHs in PM10 was 72% in winter, and it was increased to 79% in summer in Hong Kong [34].
According to different molecular weight, 14 kinds of PAHs were classified into lower molecular weight PAHs (LMW, 2- and 3-rings PAHs) including Phe and Ant, middle molecular weight PAHs (MMW, 4-rings PAHs) including Flu, Pyr, BaA, Chr, and higher molecular weight PAHs (HMW, ≥5 rings of PAHs) including BbF, BkF, BeP, BaP, IcdP, BghiP, DahA, and Cor [32]. Figure 2 shows that in PM2.5, the proportion of HMW PAHs was dominant in all season, accounting for 46.61~85.13%. Especially in the autumn, the proportion reached 85.13%, while the MMW PAHs and LMW PAHs proportions reached the minimum value, 9.82% and 5.04%, respectively. The highest proportion of MMW PAHs and LMW PAHs were found in winter and summer, 30.69% and 38.02%, respectively. In PM2.5–10, the proportions of middle molecular weight PAHs did not exhibit distinct seasonality, whereas the proportions of lower molecular weight and HMW PAHs showed decreasing and increased trends, respectively, from spring to winter.
Figure 3 illustrates that the ratios of individual PAH concentrations in winter to summer (w/s) in fine particles had a wider range (from 6.61 (Phe) to 89.48 (BaA)) than that in the coarse particles (from 4.45 (Phe) to 18.75 (BkF)). This result was similar to that in Liaoning (6.5~125.8 and 1.7~37.6, respectively) and Turkish Zonguldak (7.0~70.7 and 1.5~12.0, respectively) [26]. In PM2.5 and PM2.5–10, the w/s values of BbF and BkF, which mainly existed in the particle phase, were higher than those of Phe and Ant with higher volatility, indicating different source contributions to PAHs between summer and winter. Except Ant, the w/s values of PAHs in fine particles were higher than in coarse particles, suggesting that PAHs might be transported from coarse particles to fine particles in winter [26]. In addition, the ρ2.5/(ρ2.5 + ρ2.5–10) values of Flu~Cor in summer were lower than in other season, and the ρ2.5/(ρ2.5 + ρ2.5–10) value of 4-ring PAHs in winter were greater than in other season (Table 1).

3.3. Risk Assessment of PAHs Exposure

BaP has been widely used as an indicator of total PAHs in the inhalation risk assessment due to its high carcinogenicity. The mean concentration of BaP in PM2.5 was 6.82 ng m−3, far exceeding the standard (NAAQSS GB 3095-2012, 1.0 ng m−3), and its concentration in PM2.5–10 was 0.78 ng m−3. In order to further explain the effects of PAHs exposure on human during sampling, the toxicity of PAHs was evaluated by BaP toxicity equivalent concentration (BaPeq) [23,35]:
BaPeq = ∑PAHi × TEFi
The toxic equivalent factor (TEFi) values were taken from Nisbet and LaGoy (1992) [36] and are shown in Table 2.
Whether in fine particles or coarse particles, BaPeq values in all season were greater than 1 ng m−3. The BaPeq values in PM2.5 and PM2.5–10 (1.87 ng m−3 and 2.01 ng m−3, respectively) were similar in summer. The BaPeq values in PM2.5 (10.49~84.52 ng m−3) were much higher than that in PM2.5–10 (1.15~13.33 ng m−3) in the other seasons; In winter, the BaPeq values in PM2.5 and PM2.5–10 (84.51 ng m−3 and 13.33 ng m−3, respectively) were the highest (1.87~19.97 ng m−3 and 1.16~1.72 ng m−3, respectively). During September 2010 to March 2011 in Urumqi, the mean concentration of BaPeq in PM2.5 was 5.96 ng m−3 and the higher values mostly occurred in winter [7]. The annual mean BaPeq concentration in PM2.5 (29.22 ng m−3) was higher when compared to particulate samples from other urban atmospheres, such as Guangzhou (1.93 ng m−3) [10], Nanjing (0.84 ng m−3) [13], Beijing (3~26 ng m−3) [37], and was lower than that in five cities in Liaoning province in China (40.05 ng m−3) [26]. The BaPeq value in PM2.5–10 (4.55 ng m−3) was higher than that of Lhasa (TSP + Gas, 0.1~1.6 ng m−3 (0.75 ± 0.36)) [38], Zaragoza, and Spain (0.08~4.42 ng m−3, PM) [39]. The higher BaPeq concentrations (PM2.5: 29.22 ng m−3; PM2.5–10: 4.55 ng m−3) were an alarming signal for pollution risks in relation to human health [26]. In PM2.5 and PM2.5–10, proportion ranges of BaP in the total BaPeq were 15.63~41.18% and 16.37~47.76%, respectively. Other PAHs, such as BaA, BbF, BkF, DahA, and IcdP, are also considered to be potential carcinogens [40]. The proportion ranges of several carcinogenic polycyclic aromatic hydrocarbons (CANPAHs) in total BaPeq in PM2.5 and PM2.5–10 were 56.97~82.58%, 50.17~80.81%, respectively. The results implied that HMW PAHs are also harmful to human health.
Inhalation cancer risk (ICR) was used to estimate the cancer risk from PAH exposure and calculated by multiplying BaPeq by the inhalation unit risk (IURBaP) [39]:
ICR = BaPeq × IURBaP
IURBaP was defined as the maximum theoretical increased probability of lung cancer that was caused by continuing exposure to atmospheric BaP (1 ng m−3) in the life cycle (70-year) [40]. WHO (1987) has used 8.7 × 10⁻⁵ in every ng m−3 Bap as IURBaP [41].
In PM2.5 and PM2.5–10, the ICR values ranged 1.63 × 10⁻⁴~7.35 × 10⁻³ (mean: 2.5 × 10⁻³) and 9.94 × 10⁻⁵~1.16 × 10⁻³ (mean: 3.96 × 10⁻⁴), respectively. The ICR values reached 7.35 × 10⁻³, 1.16 × 10⁻³ in winter, and which were higher than that in Guangzhou (3.94 × 10⁻⁴) [42]. According to the US-EPA (2001), it is believed that one in a million (10−6) over an average lifetime of 70 years is the risk level acceptable or inconsequential, between 10−6 and 10−4 is defined as a potential risk, whereas a one in ten thousand level (10−4) is considered serious based on the resultant BaP (1 ng m−3) [13,23,43]. However, all these values far exceeded the high level of 10−4, and indicated that Urumqi has higher inhalation cancer risk.

3.4. Sources of Particulate PAHs

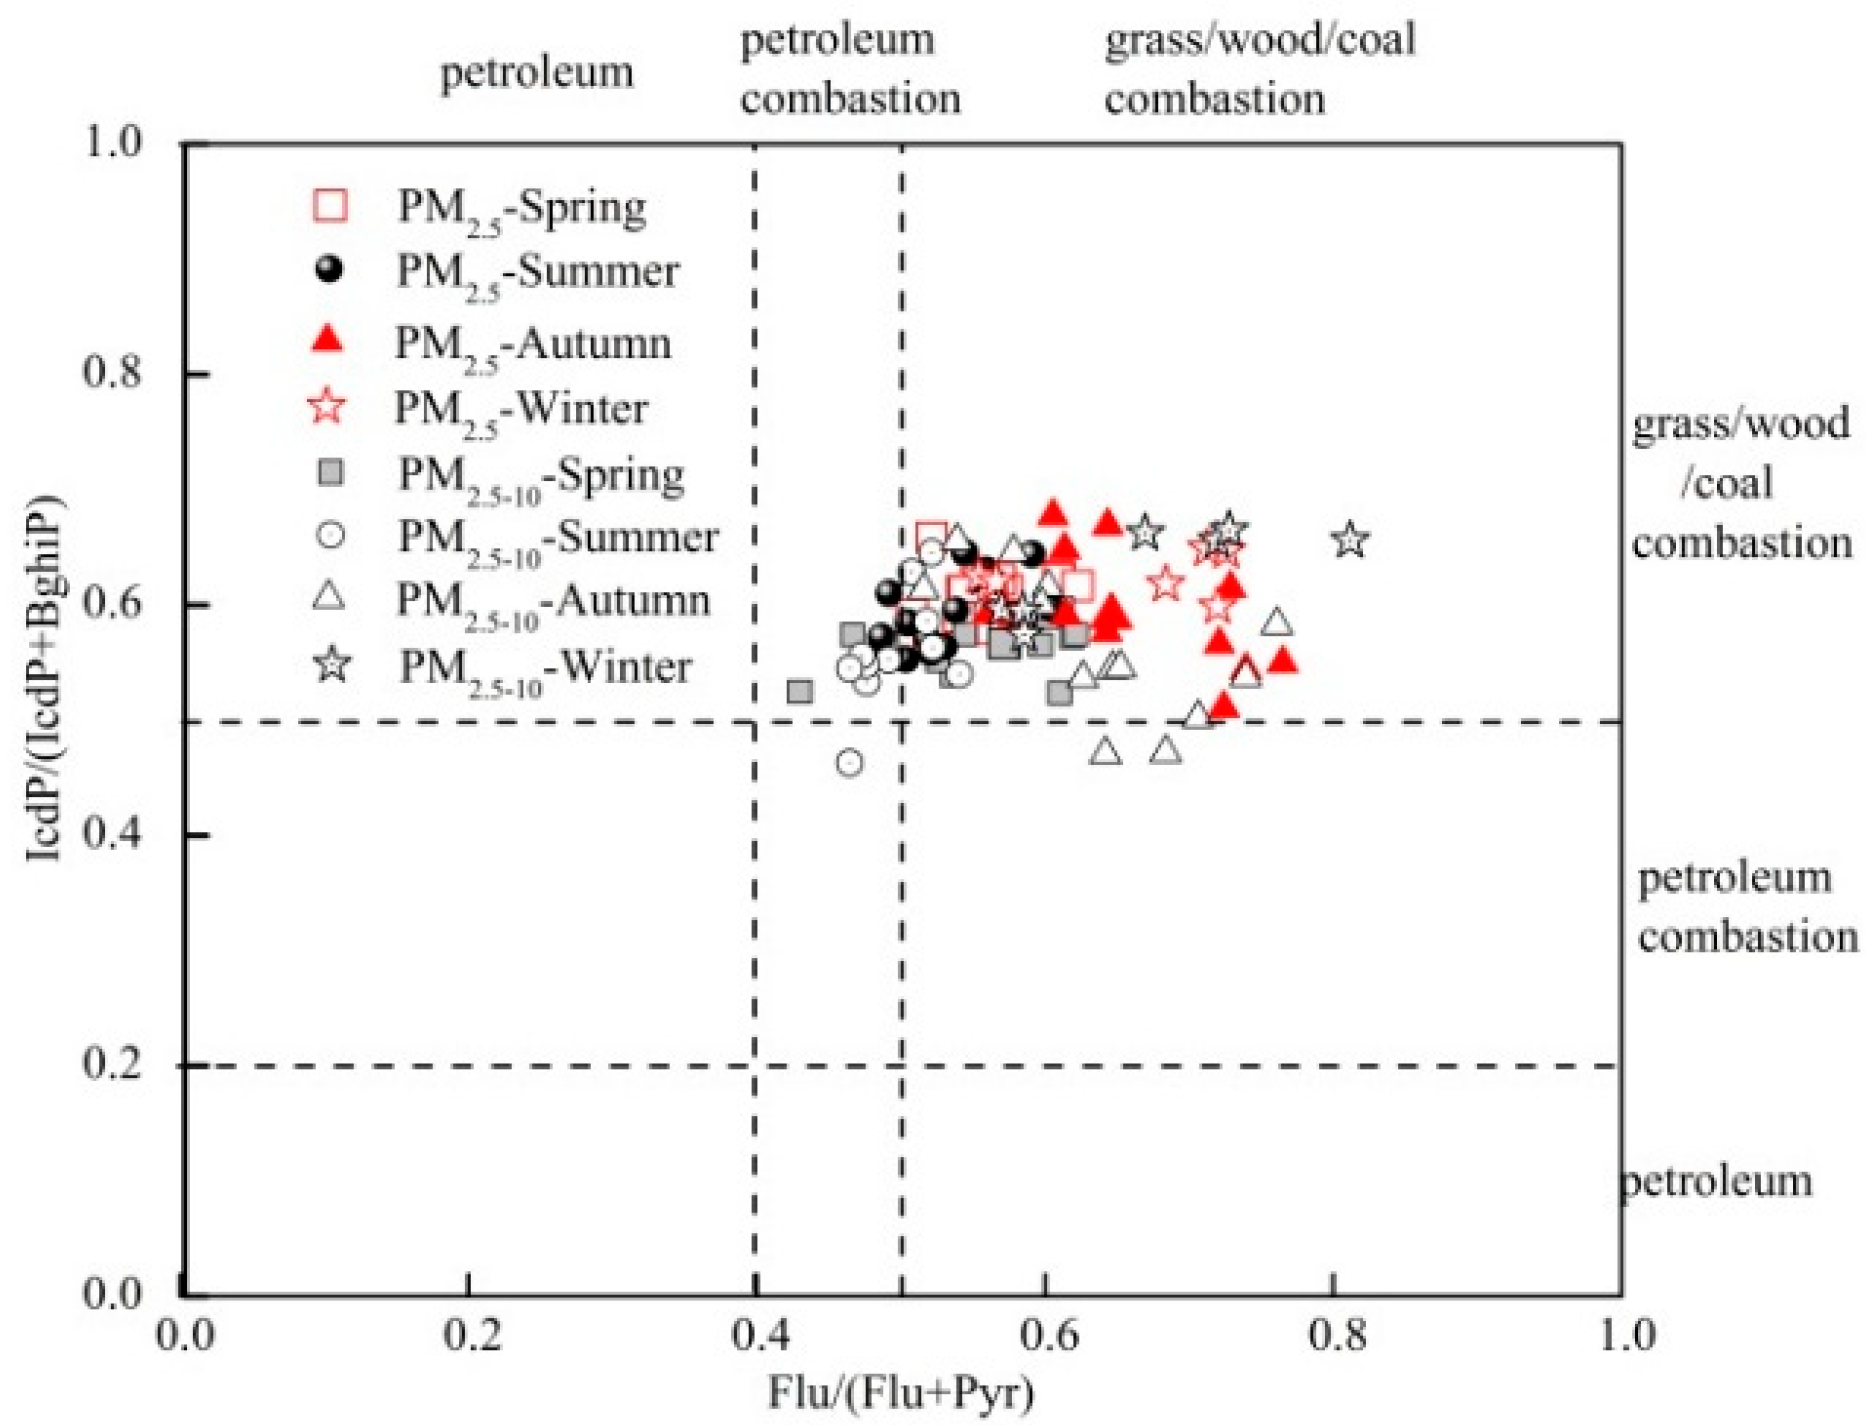
3.4.1. Diagnostic Ratios (DR) Analysis

Some of the identified components and ratios in PAHs can reflect part of the characteristics of the emission sources in the study area. The DR method was commonly utilized for identifying PAH sources by comparing ratio of pairs of frequently found PAH emissions [44]. The Flu/Pyr and IcdP/BghiP were isomer pairs. Therefore, they were photolytically degraded at comparable rates [45,46]. Thus, their ratios preserved the original compositional information during atmospheric transport. Yunker et al. (2002) summarized the results of different sources and proposed that for Flu/(Pyr + Flu), the petroleum boundary ratio appears close to 0.40, and the ratio between 0.40 and 0.50 was characteristic of petroleum combustion (liquid fossil fuel combustion), whereas a ratio >0.50 was characteristic of grass, wood, or coal combustion; for IcdP/(BghiP + IcdP), a ratio <0.20 indicates unburned petroleum (petrogenic source), 0.20~0.50 implies petroleum combustion (liquid fossil fuel combustion), and >0.50 was implies grass, wood, or coal combustion [47].
Figure 4 shows that the variation ranges of Flu/(Flu + Pyr) in PM2.5 and PM2.5–10 were 0.49~0.76 and 0.43~0.81, respectively. The variation ranges of IcdP/(IcdP + BghiP) in PM2.5 and PM2.5–10 were 0.51~0.68 and 0.46~0.66, respectively. A large number of data were mainly distributed in the grass/wood/coal combustion area, and only some of the data were distributed in petroleum combustion, which accounted for a total of 12.77%. The result indicated that the main source of PAHs in Urumqi was grass/wood/coal combustion, and the minor source was petroleum combustion. The information about the specific source was obtained by the ratio method, but it was unable to estimate the contribution from the specific source categories. However, such information can be obtained by PMF easily. Therefore, the combination of these two methods could make the analysis results more reliable.

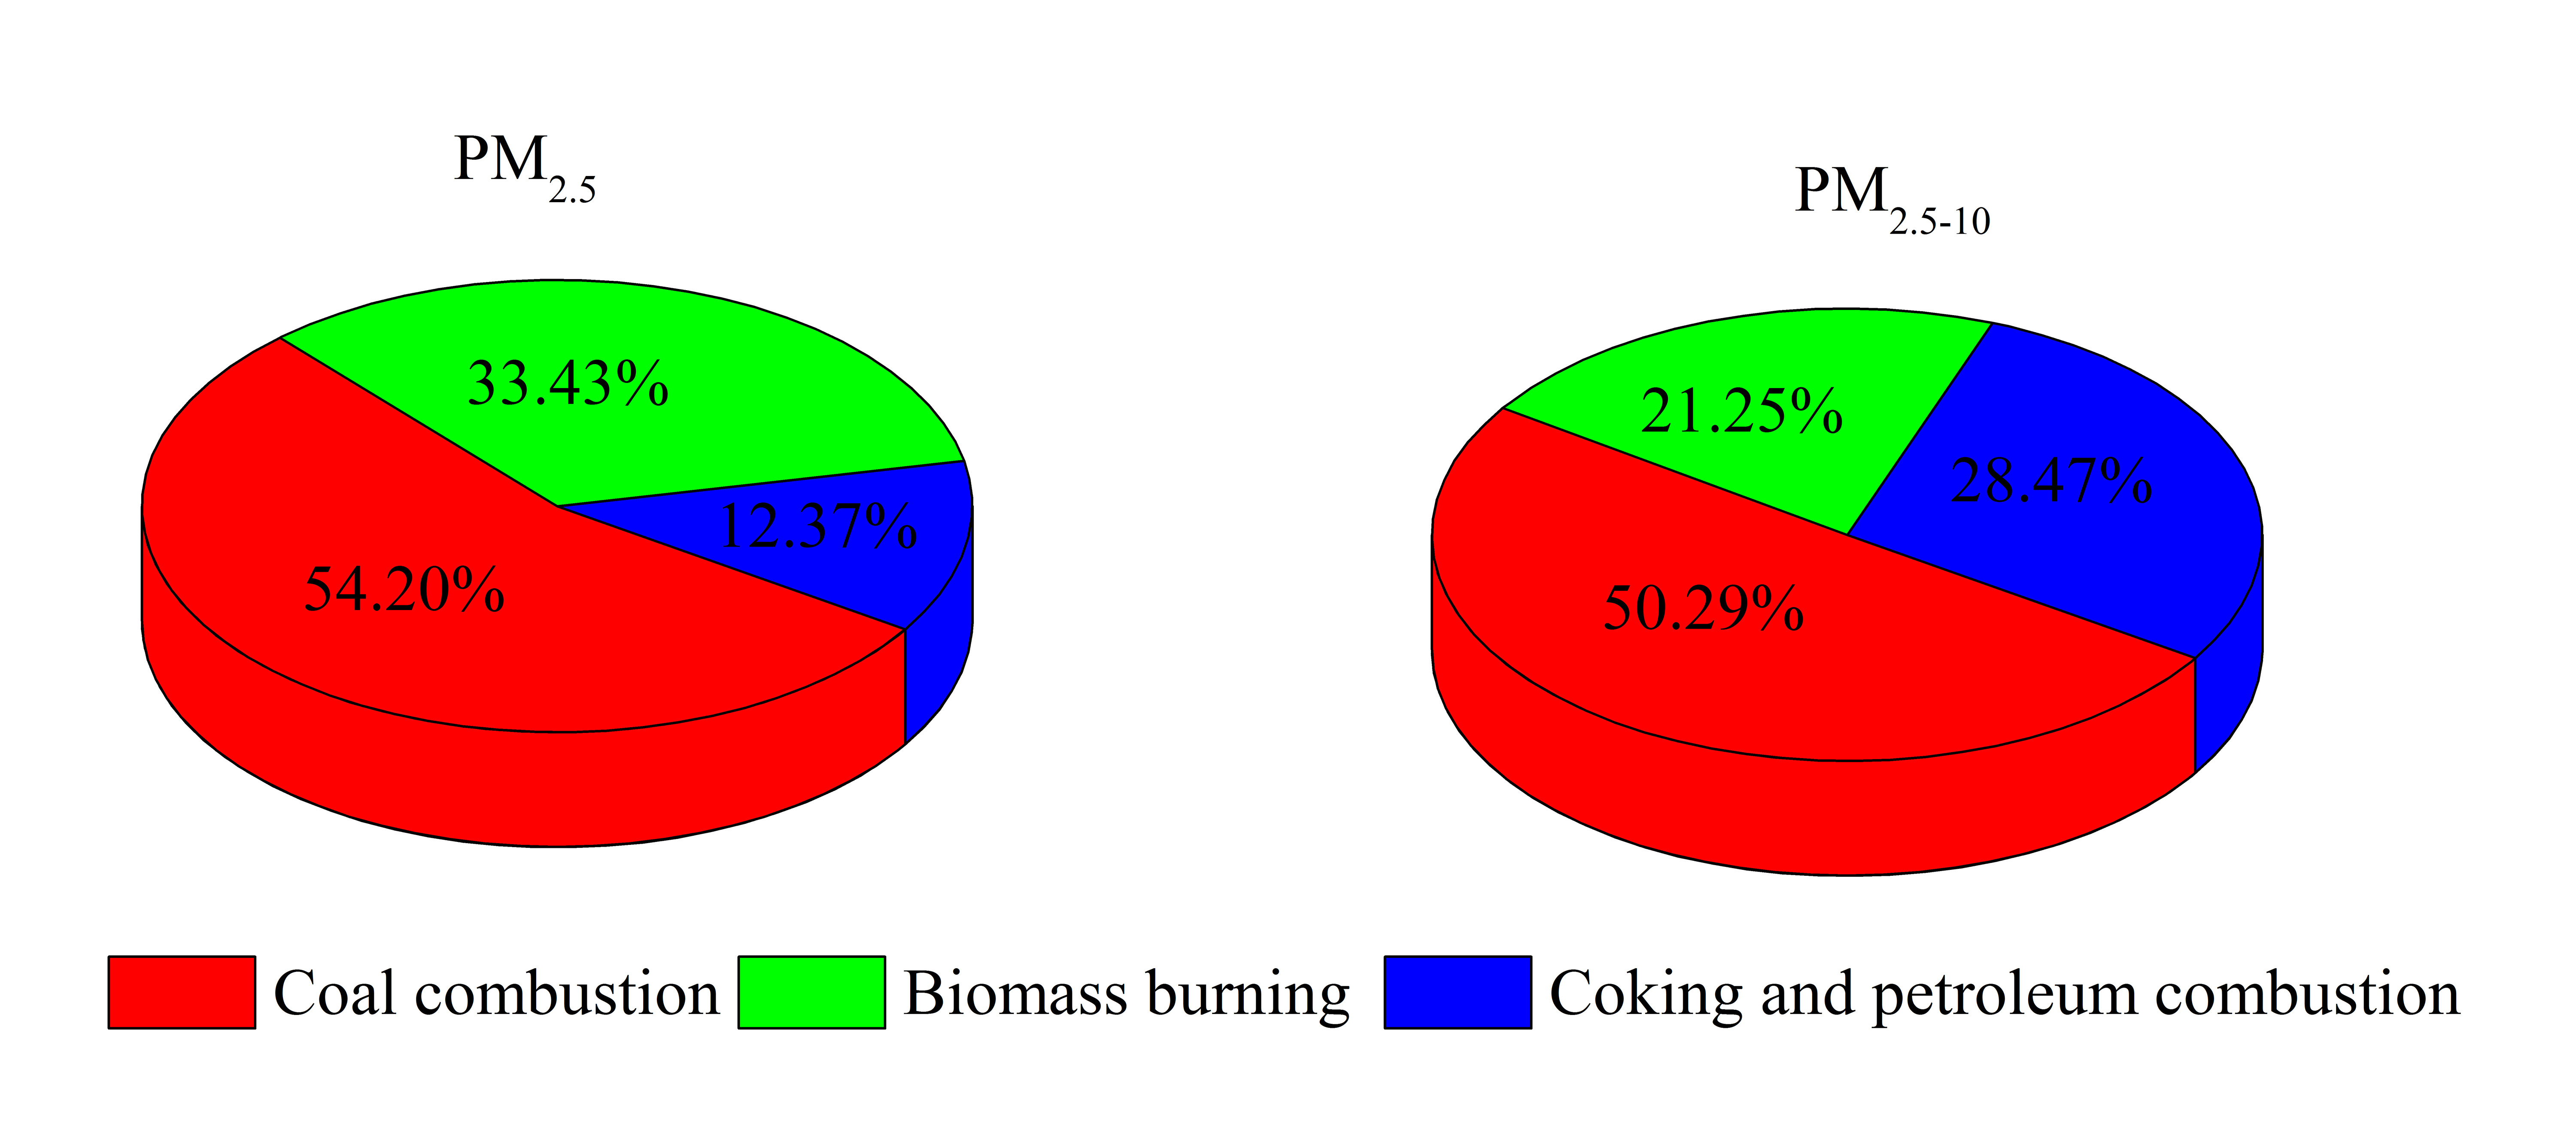
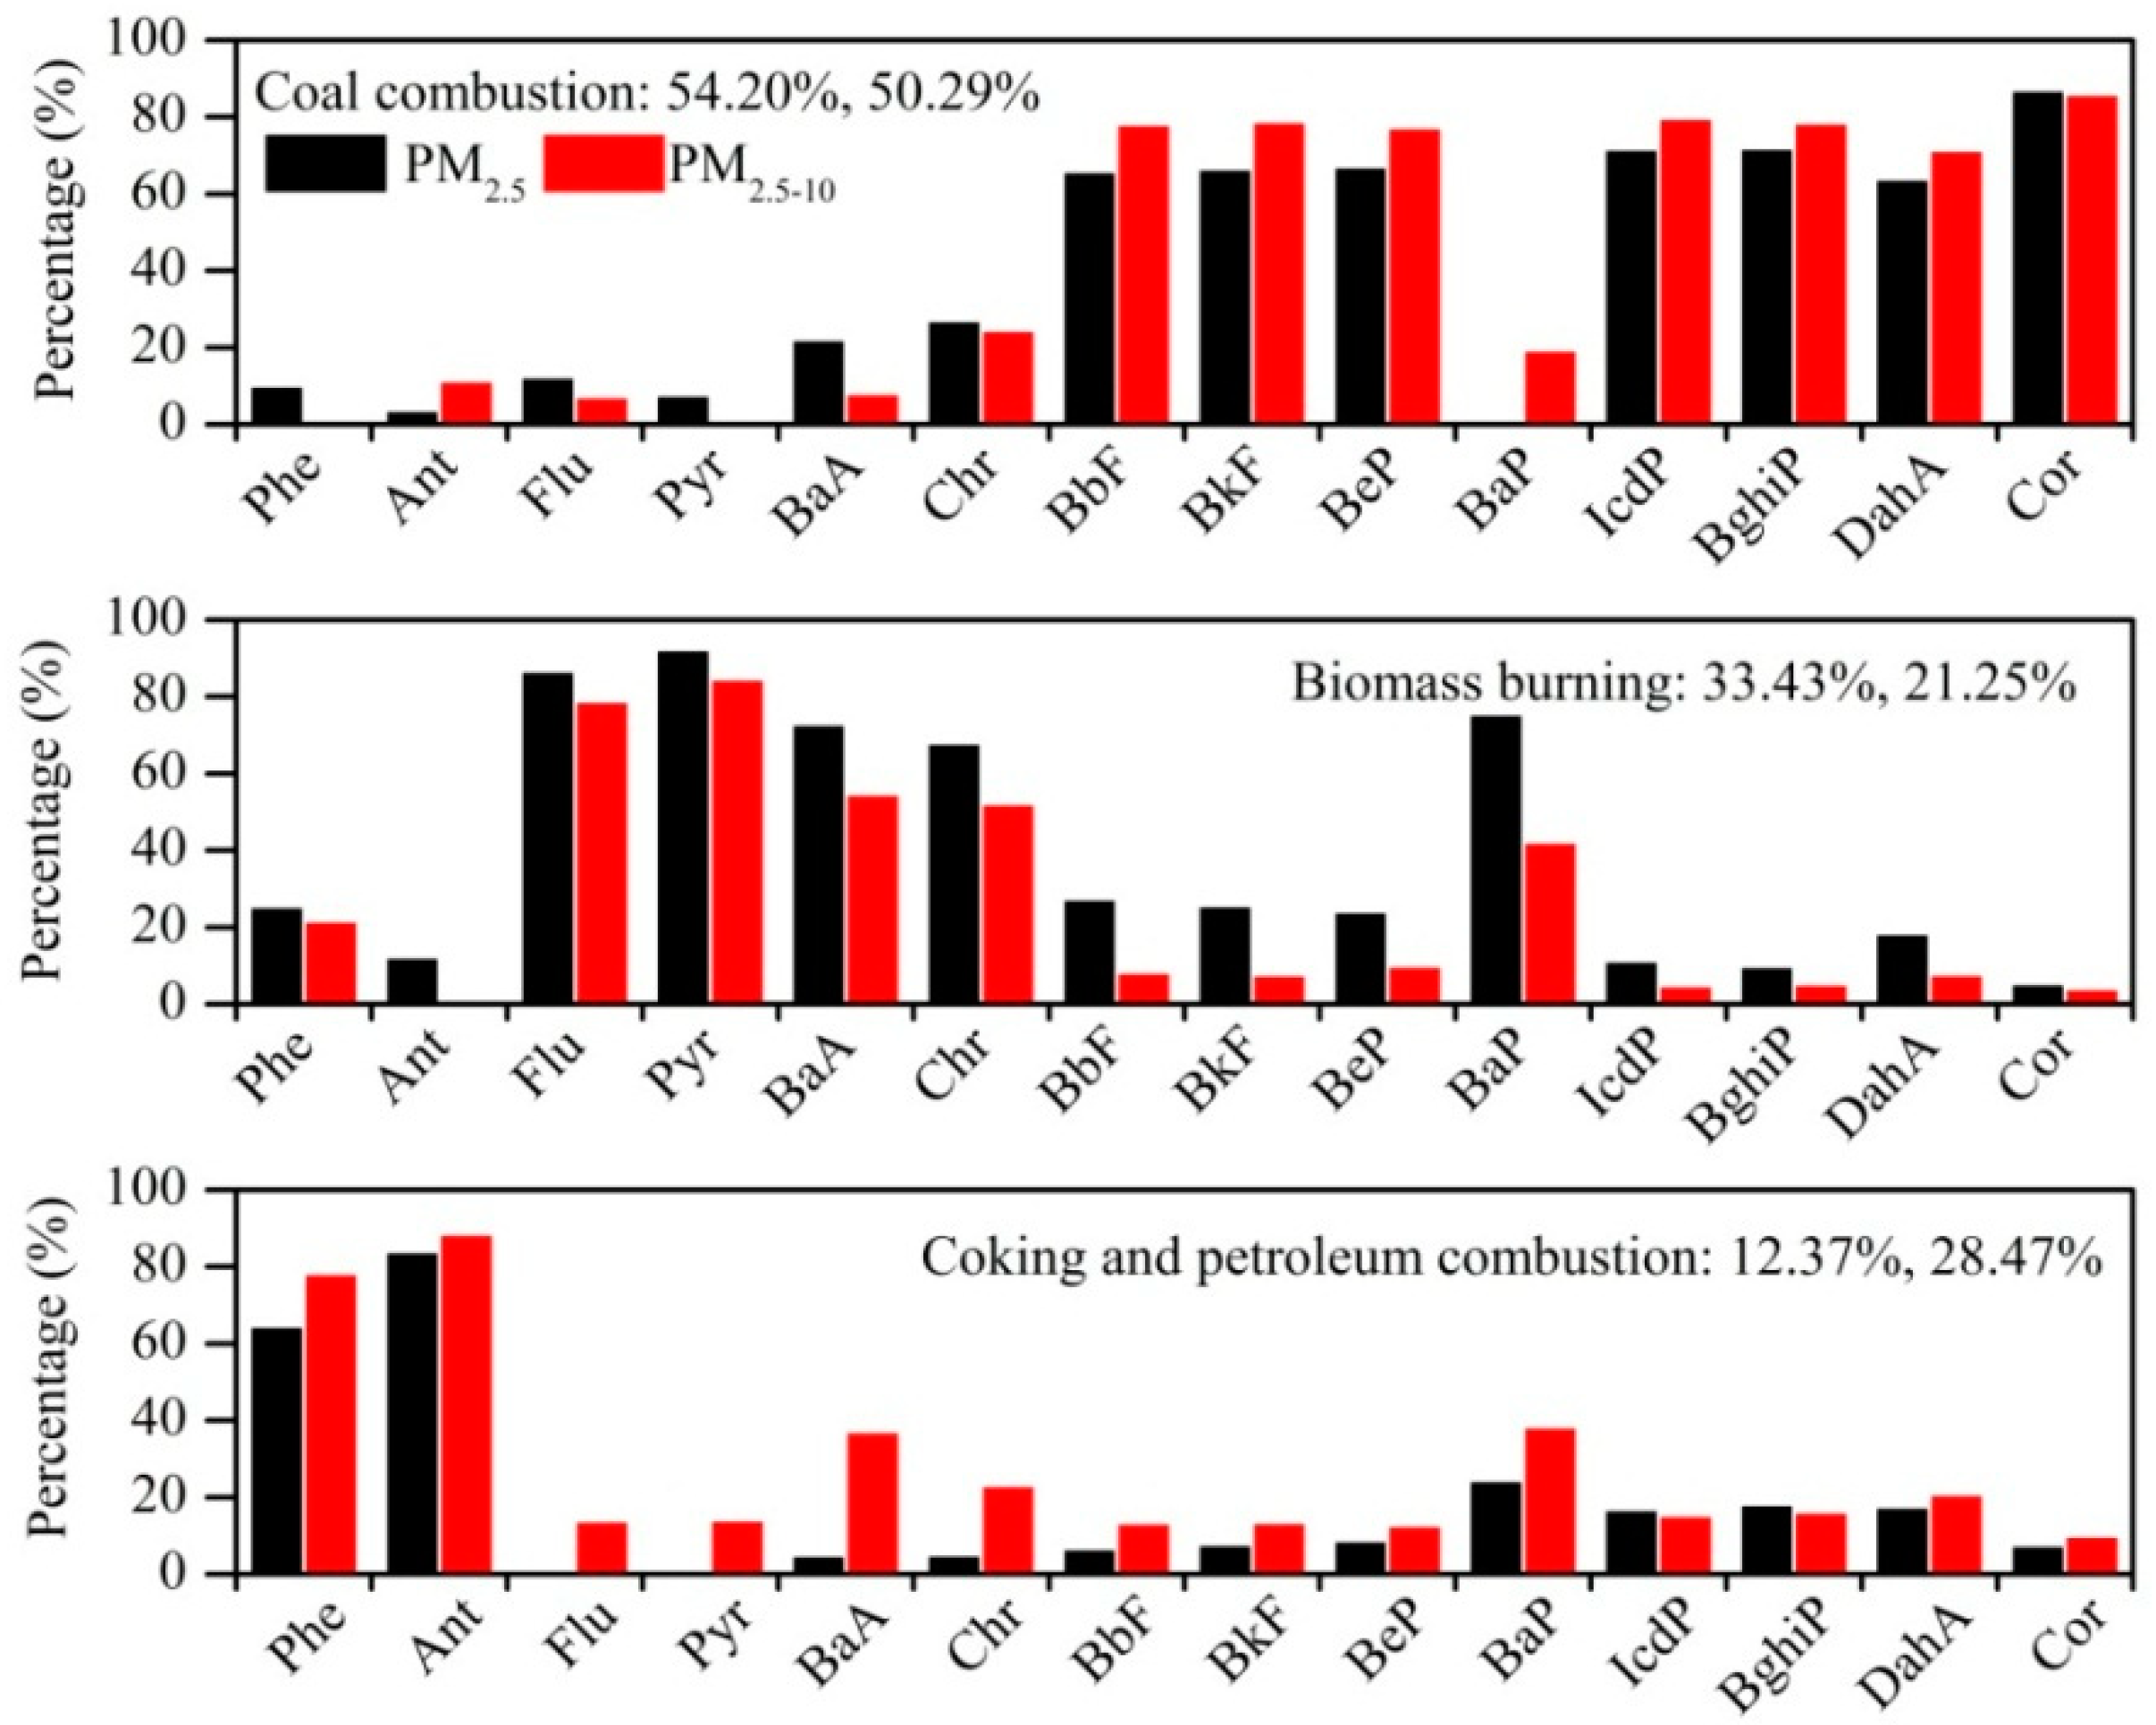
3.4.2. Sources of PAHs with Positive Matrix Factorization (PMF)

To further identify and evaluate the major sources of PAH contaminants in PM2.5 and PM2.5–10 in Urumqi, the PMF model (EPA PMF 5.0) was used. We selected 3 factors which were most stable and interpretable, as shown in Figure 5. During the process of analyzing the generated results, there were some differences in the source contribution rates of PAHs in PM2.5 and PM2.5–10, but two profiles are identified as the same sources, which have similar composition and present the same tracer species.
Factor 1 explained 54.20% and 50.29% of the total PAHs in PM2.5 and PM2.5–10, respectively, and was mainly loaded by HMW: Cor (87.10%, 85.94%), BghiP (71.88%, 78.54%), IcdP (71.72%, 79.75%), BeP (67.10%, 77.26%), BkF (66.60%, 78.82%), BbF (65.95%, 78.20%), and DahA (63.98%, 71.41%). Therefore, this factor was identified as coal combustion according to previous studies which showed similar PAH loadings [42,48,49].
Factor 2 accounted for 33.43% and 21.25% of total PAHs in PM2.5 and PM2.5–10, respectively. It was mainly loaded with Pyr (92.35%, 84.69%), Flu (86.74%, 78.84%), BaP (75.51%, 42.18), BaA (72.90%, 54.71%), and Chr (67.95%, 52.21%). Flu and Pyr are fingerprints of biomass burning [24,48,50,51]. Thus, factor 2 was classed as biomass burning.
Factor 3 was predominantly loaded with Ant (96% 88.59%) and Phe (64.56% 78.32%). In the results of Khalili et al. (1995), predominant PAHs in coke oven emissions were Nap, Acy, Phe, Fl, Ant, and Flu [50]. Ant, Phe were also used as indicative species of coking and petroleum combustion [24,52]. So factor 3 was considered as composite source of coking and petroleum combustion sources, explaining 12.37% and 28.47% of total PAHs in PM2.5 and PM2.5–10, respectively.
In the sampling period, emissions from coal combustion (54.20%, 50.29%), biomass burning (33.43%, 21.25%), and coking and petroleum combustion (12.37%, 28.47%) contributed to PAHs bound PM in Urumqi, with coal combustion being the most important source. This result was consistent with the previous results obtained before changing coal to natural gas in Urumqi [8], and we found that the contribution of coal combustion was apparently smaller than that in 2002 (84%) [20].

4. Conclusions

The concentrations of PAHs in PM2.5 and PM2.5–10 in Urumqi were measured from January to December 2011, and the mean concentration ranges of total PAHs were 20.90~844.22 ng m−3 and 19.65~176.50 ng m−3, respectively. PAHs existed predominantly in fine particles. Total PAHs had significant seasonal variation, with the highest in winter and the lowest in summer. The w/s values of the individual PAHs were 6.61~89.48 and 4.45~18.75 for PM2.5 and PM2.5–10, respectively. HMW PAHs dominated in PM2.5. In PM2.5–10, a decreasing trend of LMW PAHs was found from spring to winter. In contrast, HMW PAHs showed an increasing trend. In PM2.5 and PM2.5–10, the annual mean BaPeq concentration 29.22 and 4.55 ng m−3, and BaP accounted for 31.88% and 27.60% of the total BaPeq, respectively. The CANPAHs accounted for 66.19% and 68.07% of total BaPeq. The ICR averaged 2.5 × 10⁻³ and 3.96 × 10⁻⁴, respectively, exceeded the USEPA guideline levels. Three potential sources of PAHs were identified by combining DR and PMF, including: coal combustion, biomass burning, and coking and petroleum combustion. Coal combustion had the largest contribution to PAHs of 54.20% and 50.28%, respectively. Our results may help the environmental agency, government, and stakeholders recognize the characteristics of PAHs in PM2.5 and PM2.5–10, while providing research data on carbon aerosols in northwest China.

Author Contributions

The study was completed with cooperation between all authors. D.T., X.W., B.G. have conceived and designed the experiments; X.W. provided the laboratory apparatus and accommodation; Y.T., M.M., A.A. have provided valuable comments and suggestions for the modification of the manuscript. B.G., S.R., Y.T. have performed graphic processing and data analysis; S.R., D.T., B.G., wrote the paper and D.T., B.G. contributed grammar correcting of all text.

Funding

This research was funded by the National Natural Science Foundation of China (Grant No. 41465007/41773127) and Guangzhou Science and Technology Project (No. 201707010378) and State Key Laboratory of Organic Geochemistry (OGL-201503).

Conflicts of Interest

The authors declare no conflict of interest.

References

  1. Listed, N. Polynuclear aromatic compounds, Part 1, Chemical, environmental and experimental data. IARC Monogr. Eval. Carcinog Risk Chem. Hum. 1983, 32, 1–453. [Google Scholar]
  2. Moeller, M.; Alfheim, I.; Larssen, S.; Mikalsen, A. Mutagenicity of airborne particles in relation to traffic and air pollution parameters. Environ. Sci. Technol. 1982, 16, 221–225. [Google Scholar] [CrossRef]
  3. Seinfeld, J.I. Atmospheric Chemistry and Physics, from Air Pollution to Climate Change. Atmos. Chem. 2000, 37, 212–214. [Google Scholar] [CrossRef]
  4. Wang, C.H.; Wu, S.H.; Zhou, S.L.; Wang, H.; Li, B.J.; Chen, H.; Yu, Y.N.; Shi, Y.X. Polycyclic aromatic hydrocarbons in soils from urban to rural areas in Nanjing: Concentration, source, spatial distribution, and potential human health risk. Sci. Total Environ. 2015, 527–528, 375–383. [Google Scholar] [CrossRef] [PubMed]
  5. Haritash, A.K.; Kaushik, C.P. Biodegradation aspects of polycyclic aromatic hydrocarbons (PAHs): A review. J. Hazard. Mater. 2009, 169, 1–15. [Google Scholar] [CrossRef] [PubMed]
  6. Li, J.; Zhuang, G.; Huang, K.; Lin, Y.; Xu, C.; Yu, S. Characteristics and sources of air-borne particulate in Urumqi, China, the upstream area of Asia dust. Atmos. Environ. 2008, 42, 776–787. [Google Scholar] [CrossRef]
  7. Limu, Y.L.M.A.B.D.; Lifu, D.L.N.T.; Miti, A.B.L.Y.; Wang, X.; Ding, X. Autumn and wintertime polycyclic aromatic hydrocarbons in PM2.5 and PM2.5–10 from Urumqi, China. Aerosol Air Qual. Res. 2013, 13, 407–414. [Google Scholar] [CrossRef]
  8. Ren, Y.; Wang, G.; Wu, C.; Wang, J.; Li, J.; Zhang, L.; Han, Y.; Liu, L.; Cao, C.; Cao, J. Changes in concentration, composition and source contribution of atmospheric organic aerosols by shifting coal to natural gas in Urumqi. Atmos. Environ. 2017, 148, 306–315. [Google Scholar] [CrossRef]
  9. Ding, X.; Wang, X.M.; Xie, Z.Q.; Xiang, C.H.; Mai, B.X.; Sun, L.G.; Zheng, M.; Sheng, G.Y.; Fu, J.M.; Pöschl, U. Atmospheric polycyclic aromatic hydrocarbons observed over the North Pacific Ocean and the Arctic area: Spatial distribution and source identification. Atmos. Environ. 2007, 41, 2061–2072. [Google Scholar] [CrossRef]
  10. Gao, B.; Yu, J.Z.; Li, S.X.; Ding, X.; He, Q.F.; Wang, X.M. Roadside and rooftop measurements of polycyclic aromatic hydrocarbons in PM2.5 in urban Guangzhou: Evaluation of vehicular and regional combustion source contributions. Atmos. Environ. 2011, 45, 7184–7191. [Google Scholar] [CrossRef]
  11. Huang, B.; Liu, M.; Bi, X.; Chaemfa, C.; Ren, Z.; Wang, X.; Sheng, G.; Fu, J. Phase distribution, sources and risk assessment of PAHs, NPAHs and OPAHs in a rural site of Pearl River Delta region, China. Atmos. Pollut. Res. 2014, 5, 210–218. [Google Scholar] [CrossRef]
  12. Xu, J.P.; Sun, R.H.; Cui, H.X.; Yang, C.; Jin, J.; Chu, Y.P.; Xia, Q. Spatial-Temporal Distribution and Risk Assessment of Polycyclic Aromatic Hydrocarbons in PM2.5 of Shanghai Pudong New Area. Adm. Tech. Environ. Monit. 2017, 3. [Google Scholar] [CrossRef]
  13. Li, X.; Kong, S.; Yin, Y.; Li, L.; Yuan, L.; Li, Q.; Xiao, H.; Chen, K. Polycyclic aromatic hydrocarbons (PAHs) in atmospheric PM2.5 around 2013 Asian Youth Games period in Nanjing. Atmos. Res. 2016, 174–175, 85–96. [Google Scholar] [CrossRef]
  14. Zeng, Q.; Jeppesen, E.; Gu, X.; Mao, Z.; Chen, H. Distribution, fate and risk assessment of PAHs in water and sediments from an aquaculture- and shipping-impacted subtropical lake, China. Chemosphere 2018, 201, 612–620. [Google Scholar] [CrossRef] [PubMed]
  15. Diao, C.N. GC-MS analysis of polycyclic aromatic hydrocarbons in aerosol in Urumuqi aeras. Environ. Monit. China 2005, 21, 45–48. (In Chinese) [Google Scholar]
  16. Guzizaeri, M.; Dilinuer, T.; Wang, X.M.; Ding, X. Gaseous Polycyclic Aromatic Hydrocarbons in Southern part of Urumqi Air. Arid Environ. Monit. 2015, 29, 11–17. (In Chinese) [Google Scholar]
  17. Zhang, T.; Talip, D.; Wang, X.M.; Wang, G. Gas-Particle Partitioning of Atmospheric Polycyclic Aromatic Hydrocarbons in the Urban Area of Urumqi City, China. Res. Environ. Sci. 2016, 29, 1408–1416. (In Chinese) [Google Scholar]
  18. Ular, K.; Xue, J.; Dilinuer, T. Correlation Research on the PAHs in Particulate Matter and Specific Surface Area, meteorological parameters in Urumqi’s Aerosphere. Guangdong Chem. Ind. 2014, 41, 27–29. (In Chinese) [Google Scholar]
  19. Wulaer, H.; Dilinuer, T.; Mailikezati, M.; Wang, X.M. Source apportionment of atmospheric polycyclic aromatic hydrocarbons in inhalable particulate matter at heating and non-heating periods in Urumqi, China. Environ. Pollut. Control 2015, 37, 35–40. (In Chinese) [Google Scholar]
  20. Peng, L.; You, Y.; Zhu, T.; Bai, Z.P.; Li, J.; Feng, Y.C. Analysis of the source and the composition of PAHs carbon isotope in atmospheric particles of Urumchi city. China Environ. Sci. 2006, 26, 542–545. (In Chinese) [Google Scholar]
  21. Xia, Z.H.; Duan, X.L.; Qiu, W.X.; Liu, D.; Wang, B.; Tao, S.; Jiang, Q.J.; Lu, B.; Song, Y.X.; Hu, X.X. Health risk assessment on dietary exposure to polycyclic aromatic hydrocarbons (PAHs) in Taiyuan, China. Sci. Total. Environ. 2010, 408, 5331–5337. [Google Scholar] [CrossRef] [PubMed]
  22. Bian, Q.; Alharbi, B.; Collett, J., Jr.; Kreidenweis, S.; Pasha, M.J. Measurements and source apportionment of particle-associated polycyclic aromatic hydrocarbons in ambient air in Riyadh, Saudi Arabia. Atmos. Environ. 2016, 137, 186–198. [Google Scholar] [CrossRef]
  23. Callén, M.S.; Iturmendi, A.; López, J.M. Source apportionment of atmospheric PM2.5-bound polycyclic aromatic hydrocarbons by a PMF receptor model assessment of potential risk for human health. Environ. Pollut. 2014, 195, 167–177. [Google Scholar] [CrossRef] [PubMed]
  24. Liu, Y.; Yan, C.; Ding, X.; Wang, X.; Fu, Q.; Zhao, Q.; Zhang, Y.; Duan, Y.; Qiu, X.; Zheng, M. Sources and spatial distribution of particulate polycyclic aromatic hydrocarbons in Shanghai, China. Sci. Total. Environ. 2017, 584–585, 308–317. [Google Scholar] [CrossRef] [PubMed]
  25. Gao, B.; Guo, H.; Wang, X.M.; Zhao, X.H.; Ling, Z.H.; Zhang, Z.; Liu, T.Y. Tracer-based source apportionment of polycyclic aromatic hydrocarbons in PM2.5 in Guangzhou, southern China, using positive matrix factorization (PMF). Environ. Sci. Pollut. Res. 2013, 20, 2398–2409. [Google Scholar] [CrossRef] [PubMed]
  26. Kong, S.F.; Ding, X.; Bai, Z.P.; Han, B.; Chen, L.; Shi, J.W.; Li, Z.Y. A seasonal study of polycyclic aromatic hydrocarbons in PM2.5 and PM2.5–10 in five typical cities of Liaoning Province, China. J. Hazard. Mater. 2010, 183, 70–80. [Google Scholar] [CrossRef] [PubMed]
  27. Slezakova, K.; Castro, D.; Delerue-Matos, C.; Morais, S.; Pereira, M.D.C. Impact of vehicular traffic emissions on particulate-bound PAHs: Levels and associated health risks. Atmos. Res. 2013, 127, 141–147. [Google Scholar] [CrossRef] [Green Version]
  28. Wang, H.L.; Zhou, Y.M.; Zhuang, Y.H.; Wang, X.K.; Hao, Z.P. Characterization of PM2.5/PM2.5–10 and source tracking in the juncture belt between urban and rural areas of Beijing. Chin. Sci. Bull. 2009, 54, 2506–2515. [Google Scholar] [CrossRef]
  29. Li, X.; Wang, Y.; Guo, X.; Wang, Y. Seasonal variation and source apportionment of organic and inorganic compounds in PM2.5 and PM10 particulates in Beijing, China. J. Environ. Sci. 2013, 25, 741–750. [Google Scholar] [CrossRef]
  30. Wang, Q.; Jiang, N.; Yin, S.; Li, X.; Yu, F.; Guo, Y.; Zhang, R. Carbonaceous species in PM2.5 and PM10 in urban area of Zhengzhou in China: Seasonal variations and source apportionment. Atmos. Res. 2017, 191, 1–11. [Google Scholar] [CrossRef]
  31. Zhang, H.; Wang, R.; Xue, H.; Hu, R.; Liu, G. Characteristic and Source of Atmospheric PM10- and PM2.5-bound PAHs in a Typical Metallurgic City Near Yangtze River in China. Bull. Environ. Contam. Toxicol. 2018, 100, 303–309. [Google Scholar] [CrossRef] [PubMed]
  32. Mazquiarán, M.A.B.; Pinedo, L.C.O.D. Organic composition of atmospheric urban aerosol: Variations and sources of aliphatic and polycyclic aromatic hydrocarbons. Atmos. Res. 2007, 85, 288–299. [Google Scholar] [CrossRef]
  33. Manoli, E.; Voutsa, D.; Samara, C. Chemical characterization and source identification/apportionment of fine and coarse air particles in Thessaloniki, Greece. Atmos. Environ. 2002, 36, 949–961. [Google Scholar] [CrossRef]
  34. Guo, H.; Lee, S.C.; Ho, K.F.; Wang, X.M.; Zou, S.C. Particle-associated polycyclic aromatic hydrocarbons in urban air of Hong Kong. Atmos. Environ. 2003, 37, 5307–5317. [Google Scholar] [CrossRef]
  35. Saldarriaganoreña, H.; Lópezmárquez, R.; Murillotovar, M.; Hernándezmena, L.; Ospinanoreña, E.; Sánchezsalinas, E.; Waliszewski, S.; Montiel-Palma, S. Analysis of PAHs Associated with Particulate Matter PM2.5 in Two Places at the City of Cuernavaca, Morelos, México. Atmosphere 2015, 6, 1259–1270. [Google Scholar] [CrossRef]
  36. Nisbet, I.C.; Lagoy, P.K. Toxic equivalency factors (TEFs) for polycyclic aromatic hydrocarbons (PAHs). Regul. Toxicol. Pharmacol. 1992, 16, 290–300. [Google Scholar] [CrossRef]
  37. Jia, Y.; Stone, D.; Wang, W.; Schrlau, J.; Tao, S.; Simonich, S.L.M. Estimated Reduction in Cancer Risk due to PAH Exposures If Source Control Measures during the 2008 Beijing Olympics Were Sustained. Environ. Health Perspect. 2011, 119, 815–820. [Google Scholar] [CrossRef] [PubMed] [Green Version]
  38. Ping, G.; Wang, X.; Yao, T. Ambient distribution of particulate- and gas-phase n-alkanes and polycyclic aromatic hydrocarbons in the Tibetan Plateau. Environ. Earth Sci. 2011, 64, 1703–1711. [Google Scholar]
  39. Mastral, A.M.; López, J.M.; Callén, M.S.; García, T.; Murillo, R.; Navarro, M.V. Spatial and temporal PAH concentrations in Zaragoza, Spain. Sci. Total Environ. 2003, 307, 111–124. [Google Scholar] [CrossRef]
  40. Gao, B. Pollution Characteristics and Sources of Polycyclic Aromatic Hydrocarbons in PM2.5 in Guangzhou; University of Chinese Academy of Sciences: Beijing, China, 2013. (In Chinese) [Google Scholar]
  41. World Health Organization (WHO). Air Quality Guidelines for Europe; European Series No. 23; WHO Regional Publication: Copenhagen, Denmark, 1987. [Google Scholar]
  42. Yu, Q.; Gao, B.; Li, G.; Zhang, Y.; He, Q.; Deng, W.; Huang, Z.; Ding, X.; Hu, Q.; Huang, Z. Attributing risk burden of PM2.5-bound polycyclic aromatic hydrocarbons to major emission sources: Case study in Guangzhou, south China. Atmos. Environ. 2016, 142, 313–323. [Google Scholar] [CrossRef]
  43. Bari, M.A.; Kindzierski, W.B. Concentrations, sources and human health risk of inhalation exposure to air toxics in Edmonton, Canada. Chemosphere 2017, 173, 160–171. [Google Scholar] [CrossRef]
  44. Liu, J.; Man, R.; Ma, S.; Li, J.; Wu, Q.; Peng, J. Atmospheric levels and health risk of polycyclic aromatic hydrocarbons (PAHs) bound to PM2.5 in Guangzhou, China. Mar. Pollut. Bull. 2015, 100, 134–143. [Google Scholar] [CrossRef] [PubMed]
  45. Behymer, T.D.; Hites, R.A. Photolysis of polycyclic aromatic hydrocarbons adsorbed on simulated atmospheric particulates. Environ. Sci. Technol. 1985, 19, 1004–1006. [Google Scholar] [CrossRef]
  46. Masclet, P.; Mouvier, G.; Nikolaou, K. Relative decay index and sources of polycyclic aromatic hydrocarbons. Atmos. Environ. 1986, 20, 439–446. [Google Scholar] [CrossRef]
  47. Yunker, M.B.; Macdonald, R.W.; Vingarzan, R.; Mitchell, R.H.; Goyette, D.; Sylvestre, S. PAHs in the Fraser River basin: A critical appraisal of PAH ratios as indicators of PAH source and composition. Org. Geochem. 2002, 33, 489–515. [Google Scholar] [CrossRef]
  48. Oros, D.R.; Simoneit, B.R.T. Identification and emission rates of molecular tracers in coal smoke particulate matter. Fuel 2000, 79, 515–536. [Google Scholar] [CrossRef]
  49. Wang, X.; Shen, Z.X.; Zeng, Y.L.; Liu, F.B.; Zhang, Q.; Lei, Y.L.; Xu, H.M.; Cao, J.J.; Yang, L. Day-Night Differences, Seasonal Variations and Source Apportionment of PM10-Bound PAHs over Xi’an, Northwest China. Atmosphere 2018, 9, 62. [Google Scholar] [CrossRef]
  50. Khalili, N.R.; Scheff, P.A.; Holsen, T.M. PAH source fingerprints for coke ovens, diesel and, gasoline engines, highway tunnels, and wood combustion emissions. Atmos. Environ. 1995, 29, 533–542. [Google Scholar] [CrossRef]
  51. Wang, J.; Ho, S.S.H.; Huang, R.; Gao, M.; Liu, S.; Zhao, S.; Cao, J.; Wang, G.; Shen, Z.; Han, Y. Characterization of parent and oxygenated-polycyclic aromatic hydrocarbons (PAHs) in Xi’an, China during heating period: An investigation of spatial distribution and transformation. Chemosphere 2016, 159, 367–377. [Google Scholar] [CrossRef] [PubMed]
  52. Zakaria, M.P.; Takada, H.; Tsutsumi, S.; Ohno, K.; Yamada, J.; Kouno, E.; Kumata, H. Distribution of polycyclic aromatic hydrocarbons (PAHs) in rivers and estuaries in Malaysia: A widespread input of petrogenic PAHs. Environ. Sci. Technol. 2002, 36, 1907–1918. [Google Scholar] [CrossRef] [PubMed]
Figure 1. Location of sampling site.
Atmosphere 09 00412 g001
Figure 2. Distributions of different PAHs in fine and coarse particles.
Atmosphere 09 00412 g002
Figure 3. Winter to summer ratios of atmospheric PAHs for fine and coarse particles. The w/s was calculated by the concentration of PAHs in winter divided by concentration of PAHs in summer.
Atmosphere 09 00412 g003
Figure 4. Ratios of IcdP/(BghiP + IcdP) vs. Flu/(Pyr + Flu) for PM2.5 and PM2.5–10.
Atmosphere 09 00412 g004
Figure 5. Factor profiles (% of total) of PM2.5, PM2.5–10 obtained from the EPA PMF model.
Atmosphere 09 00412 g005
Table 1. Mean particulate PAH mass concentrations in PM2.5 and PM2.5–10 (ng m−3) and the proportion of ρ2.5/(ρ2.5 + ρ2.5–10). (n = sample number).
Spring (n = 30)Summer (n = 24)Autumn (n = 26)Winter (n = 17)
T (°C)−4~20 (8.5) a16~30 (22)3~24 (12)−20~−8 (−14)
RH (%)37~72 (53)22~83 (50)30~77 (52)77~84 (80)
NameFineCoarseρ2.5/(ρ2.5 + ρ2.5–10) (%)FineCoarseρ2.5/(ρ2.5 + ρ2.5–10) (%)FineCoarseρ2.5/(ρ2.5 + ρ2.5–10) (%)FineCoarseρ2.5/(ρ2.5 + ρ2.5–10) (%)
Phe30.4744.5040.647.584.6861.728.055.5959.0447.0719.6670.54
Ant2.073.3338.270.831.1042.962.761.4465.667.8714.8134.69
Flu10.996.1364.191.111.1050.084.891.4277.4992.7113.0787.65
Pyr7.934.0965.980.820.9745.793.190.8479.2458.376.6089.84
BaA5.761.0284.920.550.6246.824.710.7186.8348.734.2891.93
Chr8.881.7483.640.750.8945.828.271.1487.9059.256.9689.49
BbF21.521.9391.761.881.8750.1250.183.8492.90148.6834.7781.04
BkF12.451.2790.761.171.3047.3633.702.7692.4390.2924.3378.77
BeP12.381.5388.981.401.7045.0531.312.8091.8082.7320.2780.32
BaP3.580.3391.550.770.9644.373.120.2891.7331.042.3492.99
IcdP9.570.8292.132.332.16 51.8833.251.7495.0393.5016.3485.13
BghiP6.030.6190.801.511.8245.3122.611.2694.7255.888.6386.62
DahA1.760.2089.990.470.4153.094.300.4889.9013.932.6883.85
Cor0.660.0987.560.240.3341.803.990.1995.5414.171.7788.90
Σ14PAHs134.0567.5966.4820.9019.6551.57214.3024.4889.75844.22176.5082.71
a Range (mean); Note: Spring includes the samples of March, April, and May; Summer includes the samples of June, July, and August; Autumn includes the samples of September, October, and November; Winter includes the samples of January, February, and December.
Table 2. BaPeq concentrations (ng m−3) for fine and coarse particles in different seasons.
PAHTEFSpringSummerAutumnWinter
FineCoarseFineCoarseFineCoarseFineCoarse
Phe0.0010.0310.0450.0080.0050.0080.0060.0470.020
Ant0.010.0210.0330.0080.0110.0280.0150.0790.148
Flu0.0010.0110.0060.0010.0010.0050.0020.0930.013
Pyr0.0010.0080.0040.00080.0010.0040.0010.0580.007
BaA0.100.580.100.0550.0620.470.0714.870.43
Chr0.010.0890.0170.00750.0090.0830.0110.590.07
BbF0.102.150.190.190.195.020.3814.873.48
BkF0.101.250.130.120.133.370.289.032.43
BaP1.003.580.330.770.963.120.2831.042.34
IcdP0.100.960.0820.230.223.330.179.351.63
BghiP0.010.0600.0060.0150.0180.230.0130.560.086
DahA1.001.760.200.470.414.300.4813.932.68
BaPeq 10.501.141.882.0219.971.7184.5213.33
BaP/BaPeq (%) 34.1028.8741.0647.6015.6316.3836.7317.55
CANPAHs/BaPeq (%) * 63.8161.4256.7950.1782.5880.8161.5979.87
* CANPAHs/BaPeq (%) refers to the proportion of several carcinogenic polycyclic aromatic hydrocarbons (CANPAHs, such as BaA, BbF, BkF, DahA, and IcdP) in total BaPeq.

