Article

Vegetation Dynamics and Diverse Responses to Extreme Climate Events in Different Vegetation Types of Inner Mongolia

1
School of Environment, Northeast Normal University, Changchun 130024, China
2
Key Laboratory for Vegetation Ecology, Ministry of Education, Changchun 130024, China
3
School of Geographical Sciences, Northeast Normal University, Changchun 130024, China
4
Collage of Geography, Inner Mongolia Normal University, Hohhot 010022, China
*
Author to whom correspondence should be addressed.
Atmosphere 2018, 9(10), 394; https://doi.org/10.3390/atmos9100394
Submission received: 18 July 2018 / Revised: 24 September 2018 / Accepted: 26 September 2018 / Published: 11 October 2018
(This article belongs to the Special Issue Impacts of Air Quality and Climate Change on Vegetation)

Abstract

:
As the global climate has changed, studies on the relationship between vegetation and climate have become crucial. We analyzed the long-term vegetation dynamics and diverse responses to extreme climate changes in Inner Mongolia, based on long-term Global Inventory Monitoring and Modelling Studies (GIMMS) NDVI3g datasets, as well as the eight extreme precipitation indices and six extreme temperature indices that are highly correlated with the occurrence of droughts or floods, heat or cold temperature disasters, and vegetation growth in Inner Mongolia. These datasets were analyzed using linear regression analysis, the Hurst exponent index, residual analysis, and the Pearson correlation analysis. The results showed the following: (1) The vegetation dynamical changes exhibited trends of improvement during 1982 to 2015, and 68% of the vegetation growth changes in Inner Mongolia can be explained by climate changes. (2) The extreme precipitation indices exhibited a slight change, except for the annual total wet–day precipitation (PRCPTOT). The occurrence of extreme cold temperatures showed a significant decline, while the occurrence of extreme warm temperatures showed an upward trend in Inner Mongolia. (3) The typical steppe, desert steppe, and forest steppe regions are more sensitive to extreme large precipitation, and the forest regions are more sensitive to extreme warm temperatures. (4) Extreme precipitation exhibits a one-month lagged effect on vegetation that is larger than the same-month effects on the grassland system. Extreme temperature exhibits same-month effects on vegetation, which are larger than the one-month lagged effects on the forest system. Therefore, studies of the relationship between extreme climate indices and vegetation are important for performing risk assessments of droughts, floods, and other related natural disasters.

1. Introduction

Extreme climate and weather events have a significant impact on the natural ecosystem and human activity [1,2,3]. Since the last century, in the environment of global warming and drying, extreme climate events (such as hot days, cold waves, heat waves, heavy rainfall, hurricanes, and droughts) have become more frequent, more widespread, and more intense [4]. The increase of the frequency and intensity of extreme climate events occurrence poses a great challenge and serious threat to the ecological environment, as well as to sustainable economic and social development [5,6,7,8]. Inner Mongolia is an ecological barrier in northern China. It has been affected by extreme climate events, resulting in severe droughts, floods, and cold damage in some regions, exacerbating the already fragile grassland ecosystem. Previous studies have indicated that the temperature of Inner Mongolia significantly warmed from 1984 to 2006, with change rates of up to 0.45 °C/10a. The frequency of droughts increased to as high as 4.2 times/10a [9,10]. Because of the excessive concentration of precipitation, floods often occurred in Inner Mongolia, especially from late July to early August. Heavy rainstorms are the most likely cause of floods, and the frequency of floods increased to a rate of 1.9 times/10a [11]. Some extreme climatic events in the past include major floods in 1998, the regional snow disaster in winter of 2002, and the spring and summer drought in eastern Inner Mongolia in 2004 [12].
The climate is a decisive factor affecting large-scale vegetation coverage, and each type of vegetation corresponds to one type of climate condition. The effects of aspect of vegetation are the only climate events beyond the normal adaptability of vegetation and cause to changes in the ecosystem structure and function that can be defined as extreme weather events [13]. So, vegetation is one of the important indices for evaluating the response of the ecological environment to the climate changes in Inner Mongolia [14,15,16]. Therefore, analyzing how vegetation responds to extreme climate change is the key to reducing losses from extreme climate events. The normalized difference vegetation index (NDVI) is usually used to explore vegetation changes [17,18], because the NDVI can reflect the growth of vegetation very well. Presently, although a number of NDVI datasets have become available, only the Global Inventory Monitoring and Modelling Studies (GIMMS) NDVI3g time series covers the past three decades [19]. To research long time series vegetation trends in Inner Mongolia and their response to extreme climate change for different vegetation types, the NDVI3g data was chosen as an important indicator for monitoring vegetation growth.
The hydrothermal condition differs, which results in its vegetation differences in Inner Mongolia. The six vegetation types are present, in geographical order of east to west, as follows: forest, forest steppe, typical steppe, desert steppe, steppe desert, and sand desert [20]. Different biomes have different hydrothermal demands on vegetation growth for each growing period. Therefore, the response of different vegetation types to extreme climate changes is different in different growing periods. Research on the climate of Inner Mongolia in recent years has mainly included the spatial and temporal changes in the whole of China [21] and some parts of Inner Mongolia, like the eastern inland river basin [22]. There is a correlation between interannual extreme climate changes and the growing season NDVI in Inner Mongolia [23], as well as between the vegetation and climate changes in the Mongolian Plateau (containing Inner Mongolia) [24,25]. However, very few studies regarding the response of vegetation to extreme climate changes in Inner Mongolia at the biome scale and monthly scale have been performed over the past three decades, despite its significance for the ecology and geography of Inner Mongolia.
This study focused on vegetation dynamics and responses to extreme climate change in different vegetation types. The main tasks of this study are the following: (1) to reveal the vegetation dynamical change trends for different vegetation types, (2) to understand the trend of extreme climate changes for different vegetation types, (3) to identify the diverse responses of different vegetation types to extreme climate changes, and (4) to understand the same-time or the lagged-time effects of extreme climate change on different vegetation types in Inner Mongolia. Thus, this study reveals the different responses of vegetation to extreme climate changes from interannual to monthly scales, and from entire regional to biome scales in Inner Mongolia. Hopefully, knowledge of the diverse responses to extreme climate changes of different vegetation types will provide a scientific basis for the protection of the ecological environment in this area.

2. Materials and Methods
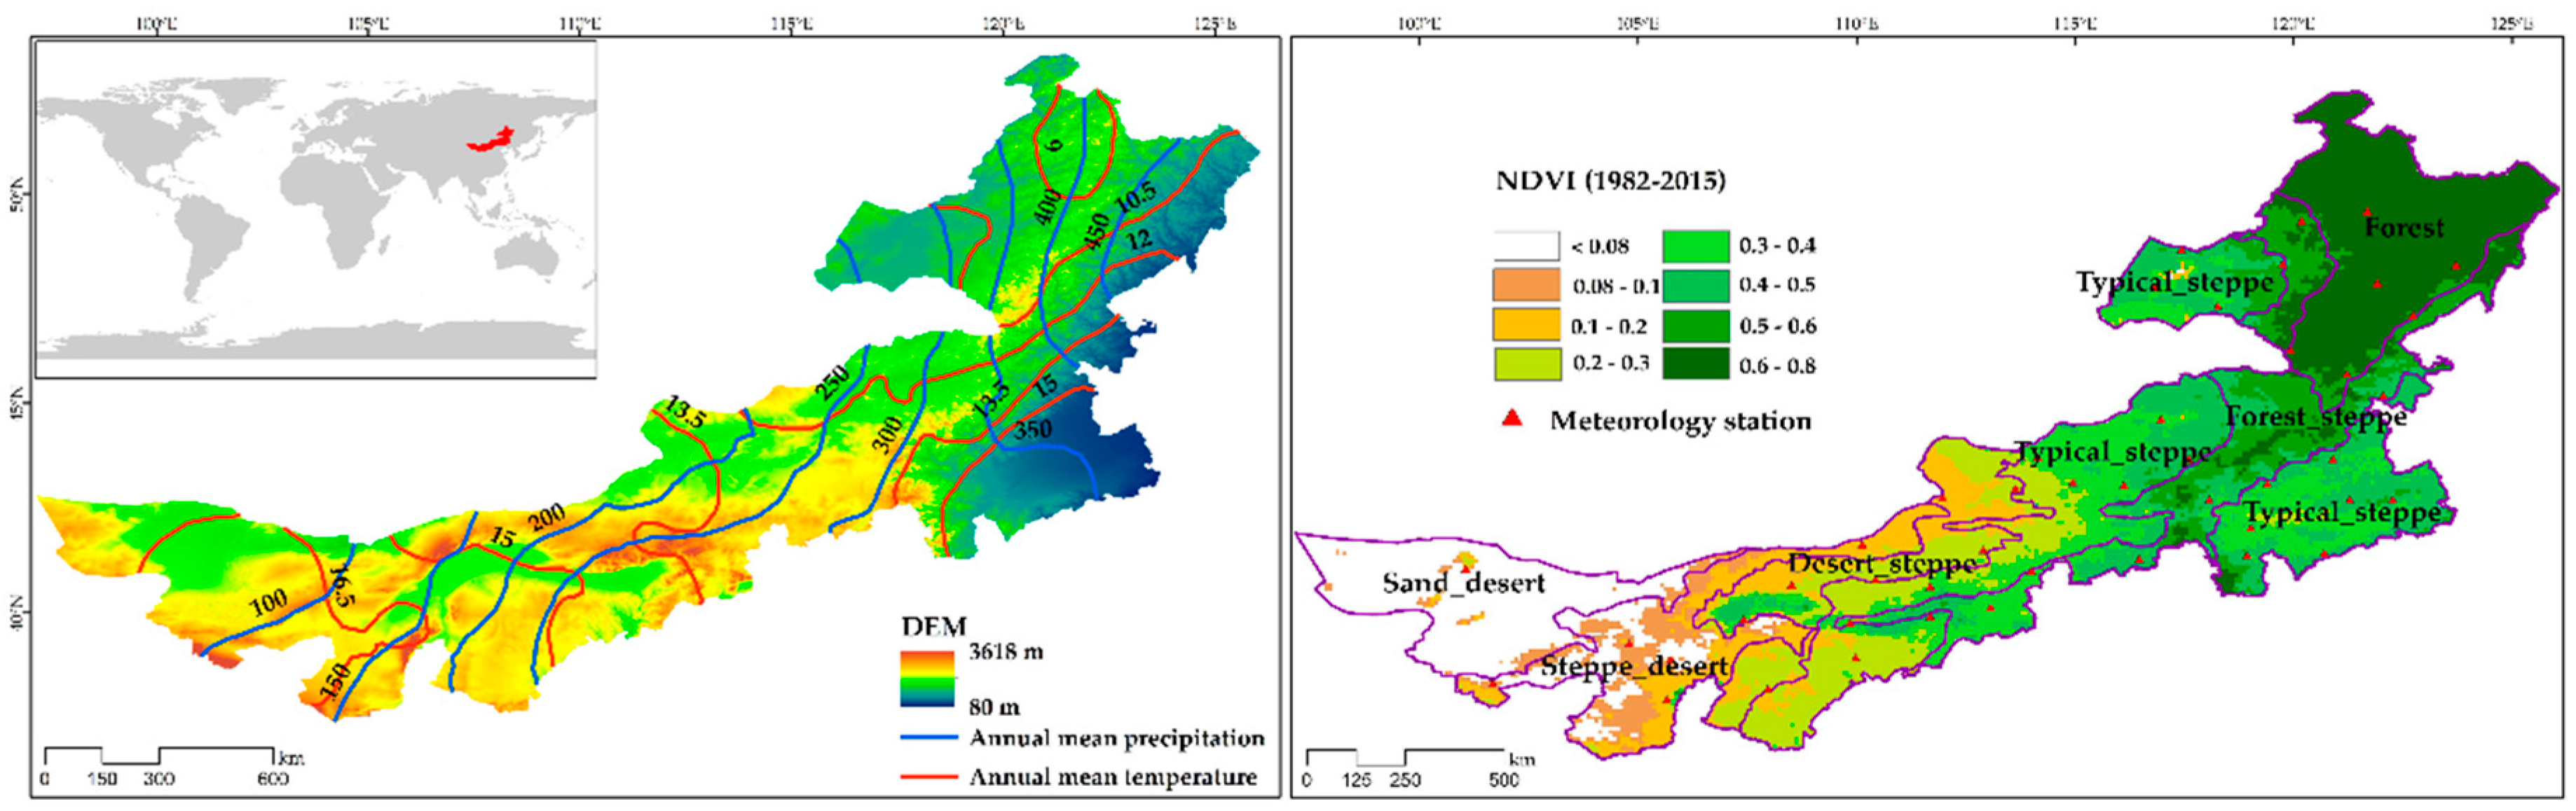
2.1. Study Area

Inner Mongolia is located in the northern part of China and stretches from approximately 37°24′–53°23′ N and 97°12′–126°04′ E (Figure 1), from the greater Khingan Mountains in the east, to Juyanhai lake in the west. The straight-line distance from east to west is about 2400 km, and the width from north to south is 1700 km, connecting Northeast, North, and Northwest China. It is an important part of the Eurasian grasslands, and it ranks first in the list of the five largest pastoral areas in China, with a total area of 0.867 billion ha (among them, the available area reaches 0.667 billion ha), nearly 22% of the total grassland area in China. This area crosses the three climate zones—semi-humid, semi-arid, and dry across temperate zones. Meanwhile, precipitation gradually decreases from east to west with the annual change of between 100 and 450 mm. The average annual temperature ranges from 9 to 16.5 °C, and the terrain slopes downward from left to right, with altitudes between 80 m to 3618 m [20,26] (Figure 1, left). It is precisely because of this special geographical location that the grassland ecological conditions in Inner Mongolia have played an irreplaceable role in the ecological security of the entire three-north region. The vegetation types in Inner Mongolia ranging from east to west are as follows: forest (area ratio 15%), forest steppe (16%), typical steppe (33%), desert steppe (10%), steppe desert (13%), and sand desert (13%) [23,27] (Figure 1, right). The annual precipitation is greater than 450 mm in the forest region. The forest steppe has a semi-humid climate with an annual precipitation of 350–450 mm and an annual accumulated temperature of ≥10 °C, between 1800 °C and 2000 °C. The typical steppe has a semi-arid climate with an annual precipitation of 200–350 mm. The desert steppe is the driest type of steppe, with an annual precipitation less than 200 mm. The steppe desert was developed in an arid area with a wetness of 0.10–0.13 and an annual precipitation of 100–150 mm. Sand desert is composed of deserted areas with very scarce plant and rain, and an annual precipitation of less than 10 mm. The study area is far from the ocean, and the continental nature of the area is extremely strong. As the climate variables vary greatly from year to year, they are prone to some abnormal abrupt changes and have extreme values. These variables show that this area has become one of the regions with a high frequency of extreme climate events.

2.2. Datasets

The GIMMS NDVI3g datasets were used in this study, because they have high quality and are used to research long-term vegetation trends [28,29]. The spatial resolution of the dataset is 0.083 degrees with a 15-day temporal interval. We obtained data from the growing seasons between 1982 and 2015, with the growing season defined as April to October [30,31,32]. To further decrease the effects of atmospheric and aerosol scattering, we used the maximum value composite (MVC) method to develop a monthly NDVI, used in a previous study [33]. The Kriging interpolation method, based on the GIMMS NDVI3g spatial resolution, is used to spatially interpolate between extreme climate indices. According to the vegetation map, the values of the NDVI and extreme climate indices were extracted for each vegetation type in order to analyze the vegetation and extreme climate dynamics for different vegetation types.
To match the span of the NDVI, the daily temperature and precipitation data (total amount of rain and snow) were collected from 1982 to 2015 so as to calculate the extreme climate indices. All of those data were collected from the China Meteorological Data Sharing Service System (CMDC), which includes 45 meteorological stations over Inner Mongolia. The fourth report of the Intergovernmental Panel on Climate Change (IPCC) defines 27 proxy climate indices, including 16 extreme temperature indices and 11 extreme precipitation indices [34]. Based on this, eight extreme precipitation indices and six extreme temperature indices, which are highly correlated with the occurrence of drought or floods, heat or low temperature disasters, and vegetation growth in the study area, were selected. The 14 extreme climate indices used in this study, as defined by the RClimDexV3 model based on R package [35], are shown in Table 1. Among them, the FD0 and TNn indices reflect the extreme low temperature events (cold extremes) and the SU25, TN90p, TX90p, and TXx indices indicate the extreme high temperature events (warm extremes). The extreme large precipitation indices consisted of the annual total wet-day precipitation (PRCPTOT), number of heavy precipitation days (R10), very wet days (R95P), simple daily intensity index (SDII), max one-day precipitation amount (RX1D), max five-day precipitation amount (RX5D), consecutive wet days (CWD), and consecutive dry days (CDD).

2.3. Methods

2.3.1. Vegetation and Extreme Climate Indices Dynamics Trend Analysis

In this study, a simple linear regression analysis was used to calculate the NDVI and the change trends of extreme climate indices, as well as the slope coefficients for each pixel. Generally, if S l o p e > 0, the variation of the NDVI or extreme climate index exhibits an upward trend, whereas if S l o p e < 0, the variables exhibit a downward trend [36]. The Mann-Kendall method was also used to test the NDVI trends. Based on results of the Mann-Kendall test, changes are categorized as insignificant (−1.96 ≤ Z ≤ 1.96) or significant (Z ≥ 1.96 or Z ≤ −1.96) [37].
To further understand the trend of vegetation change, the Hurst exponent method was used to predict the trend of the vegetation changes for Inner Mongolia. The Hurst exponent method was proposed by Hurst [38], and is often used to analyze long-term time series correlations [39,40]. It is an effective method for detecting variations in the vegetation time series. The calculation steps are as follows:
(1)
Divide the time series {NDVI (τ)} (τ = 1, 2, …, n) into τ subseries X(t), and for each series, t = 1, …, τ.
(2)
Define the long-term memory of the time series of the mean NDVI,
N D V I ¯ ( τ ) = 1 τ t = 1 τ N D V I τ           τ = 1 , 2 , ,   n
(3)
Calculate the accumulated deviation from each mean NDVI,
X ( t , τ ) = t = 1 t ( N D V I ( t ) N D V I ¯ ( τ ) )           1 t τ
(4)
Define the range sequence,
R ( τ ) = m a x 1 t τ   X ( t , τ ) m i n 1 t τ   X ( t , τ )                 τ = 1 , 2 , ,   n
(5)
Define the standard deviation sequence,
S ( τ ) = [ 1 τ t = 1 τ ( N D V I ( t ) N D V I ) 2 ( τ ) ] 1 2             τ = 1 , 2 , ,   n
(6)
Based on R ( τ ) and S ( τ ) , obtain the following:
R / S = R ( τ ) / S ( τ )
(7)
Assuming,
R / S ( τ 2 ) H
H is called the Hurst exponent with a range of values [0, 1]. When H = 0.5, the NDVI time series is random, meaning that the future trend is independent of that in the research period. H > 0.5 signifies that the NDVI time series is a consistency, meaning that the future trend will be consistent with that in the study period. H < 0.5 indicates that the NDVI time series is an inconsistency, such that the past trends most likely oppose the future trends.

2.3.2. Responses of Vegetation to Extreme Climate Indices

To understand the vegetation response to extreme climate change, the Pearson correlation analysis (significance level 0.05) was used to estimate the relationship between the NDVI and extreme climate indices. The correlation analysis was based on a pixel-by-pixel spatial correlation between the NDVI and extreme climate indices calculated for each vegetation type [41]. In this study, the correlation between the NDVI and extreme climate indices is mainly analyzed on the interannual and monthly scales in different biomes. The calculation of the correlation coefficient between the NDVI and extreme climate indices, and the significance test were both done in MATLAB.
In addition to the above methods, the residual analysis was used to separate the NDVI changes for each pixel caused by human activity or climate changes [42,43]. When the change trend of the NDVI residuals was insignificant, the changes in NDVI were explained by climatic trends. In contrast, when the change trend of the NDVI residuals was significant, the changes in NDVI were not explained by climatic trends and may have been caused by human activities.

3. Results

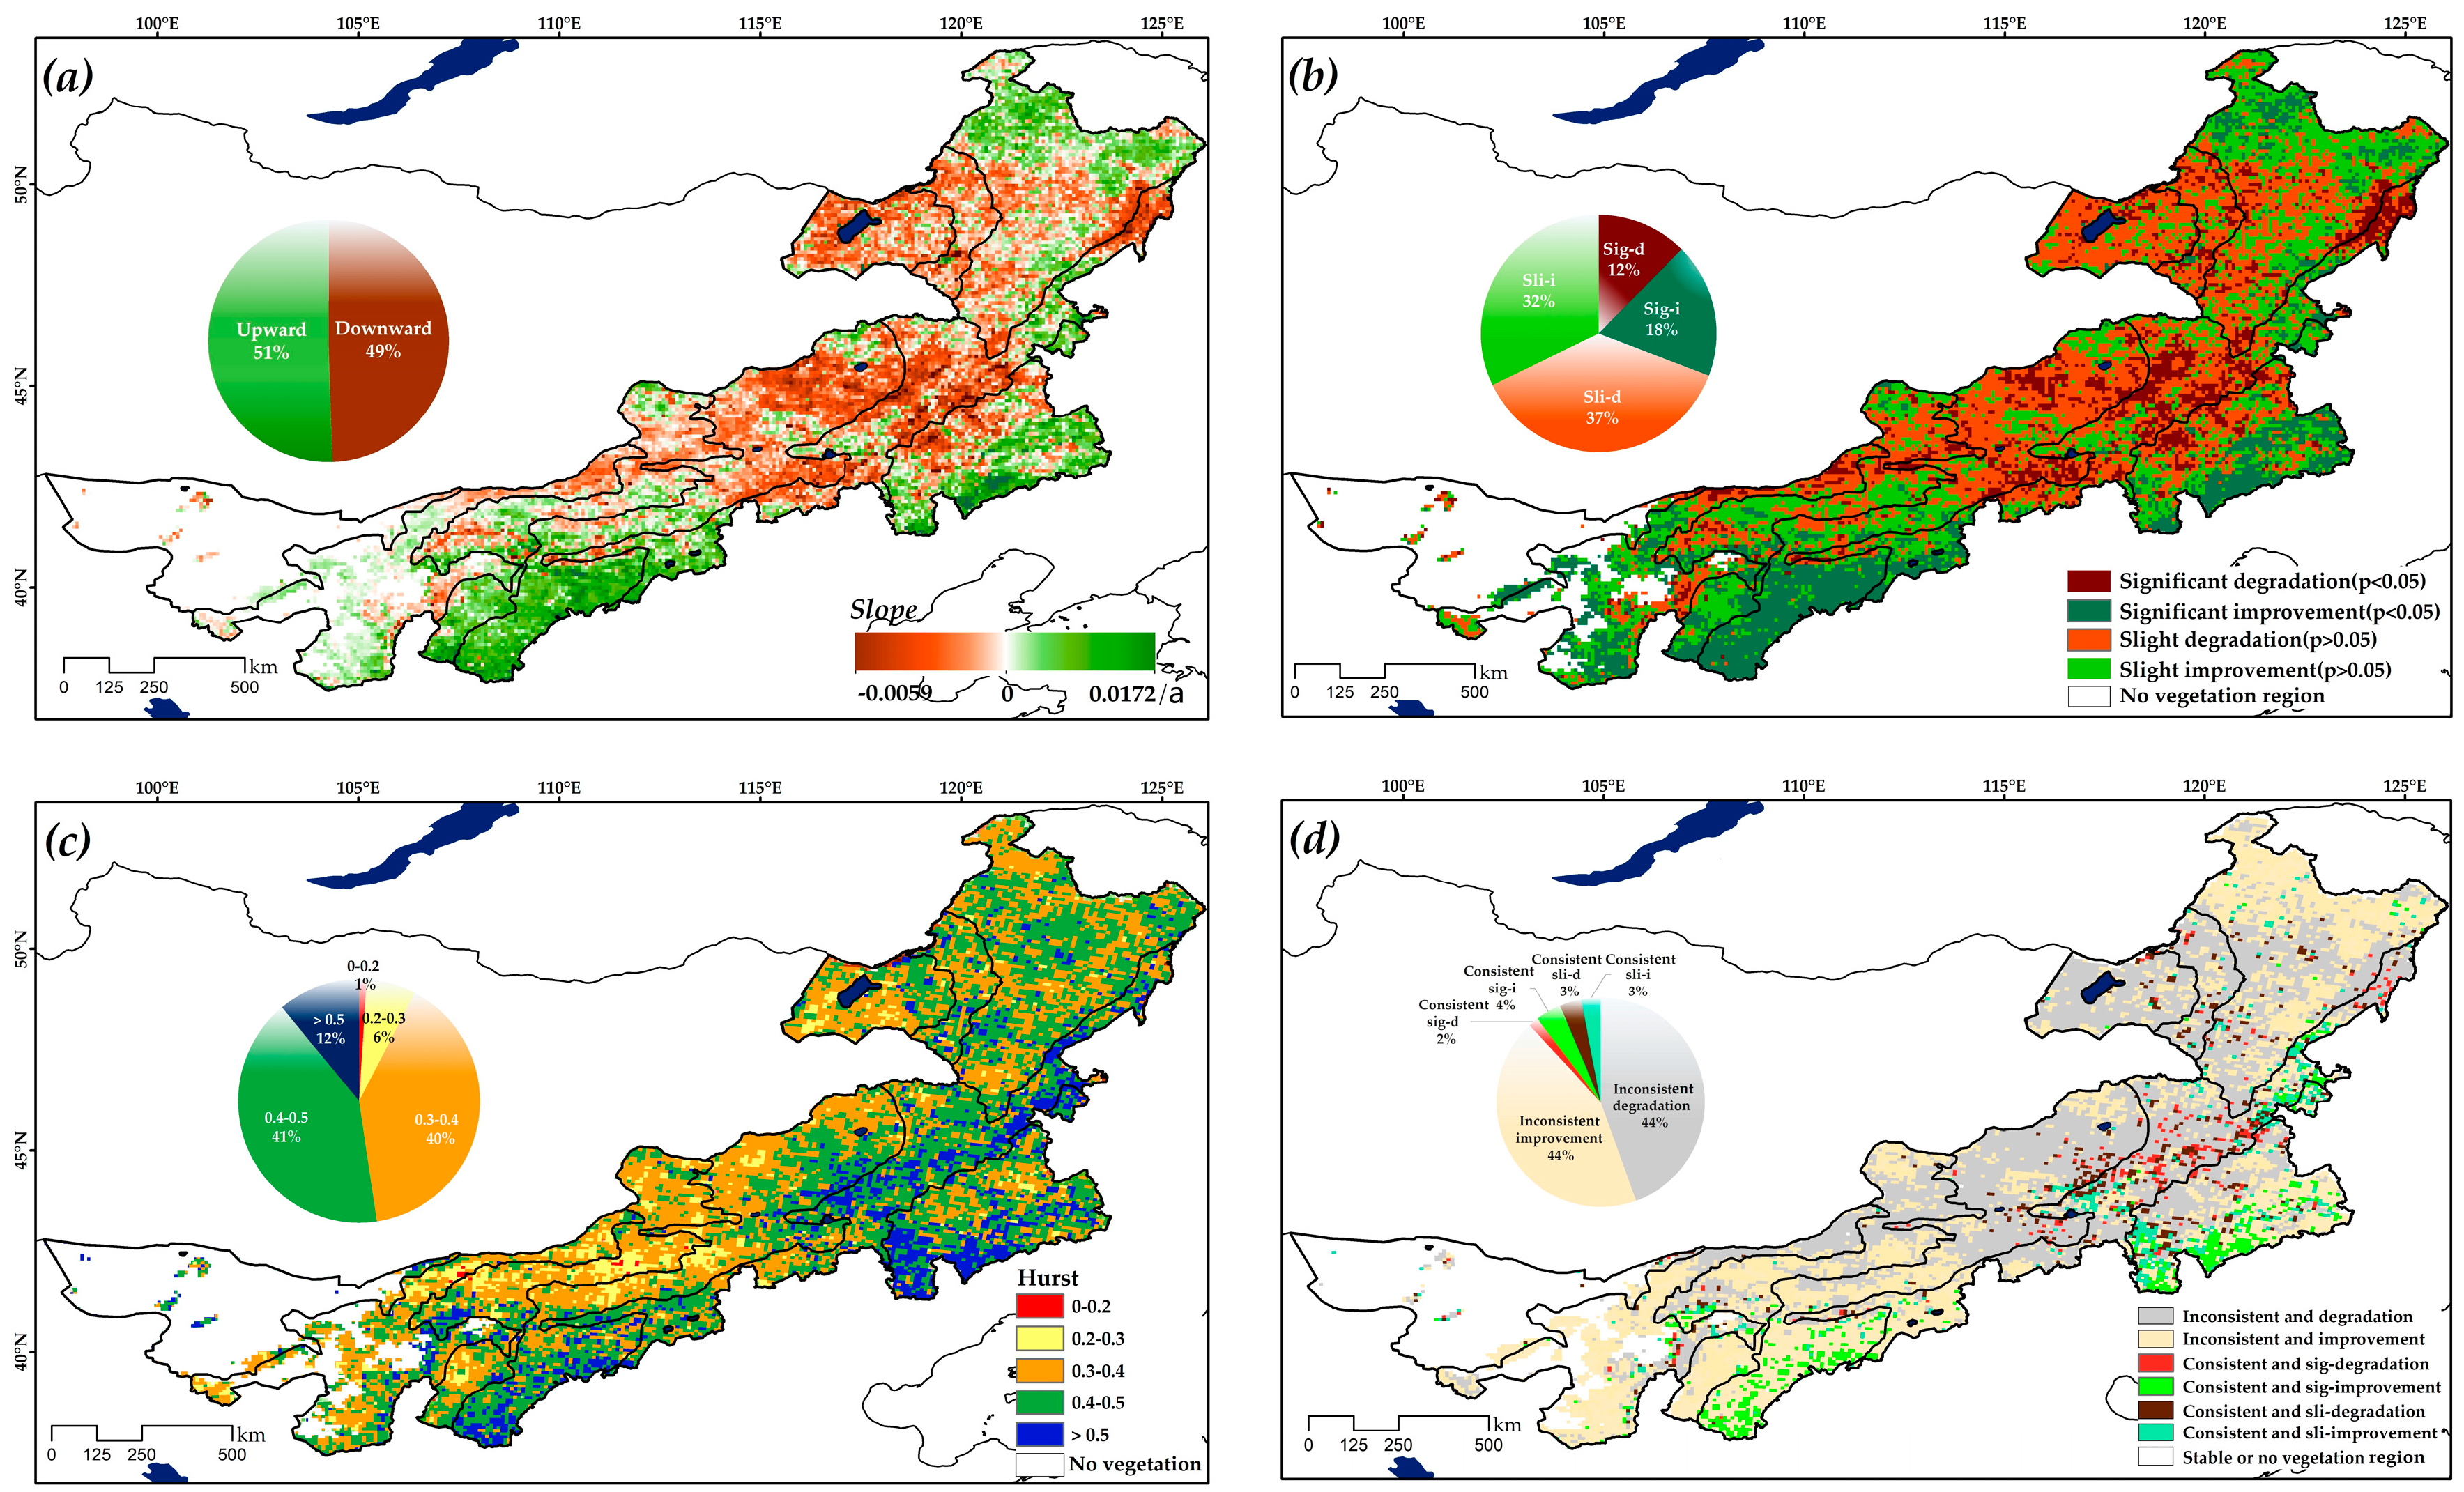
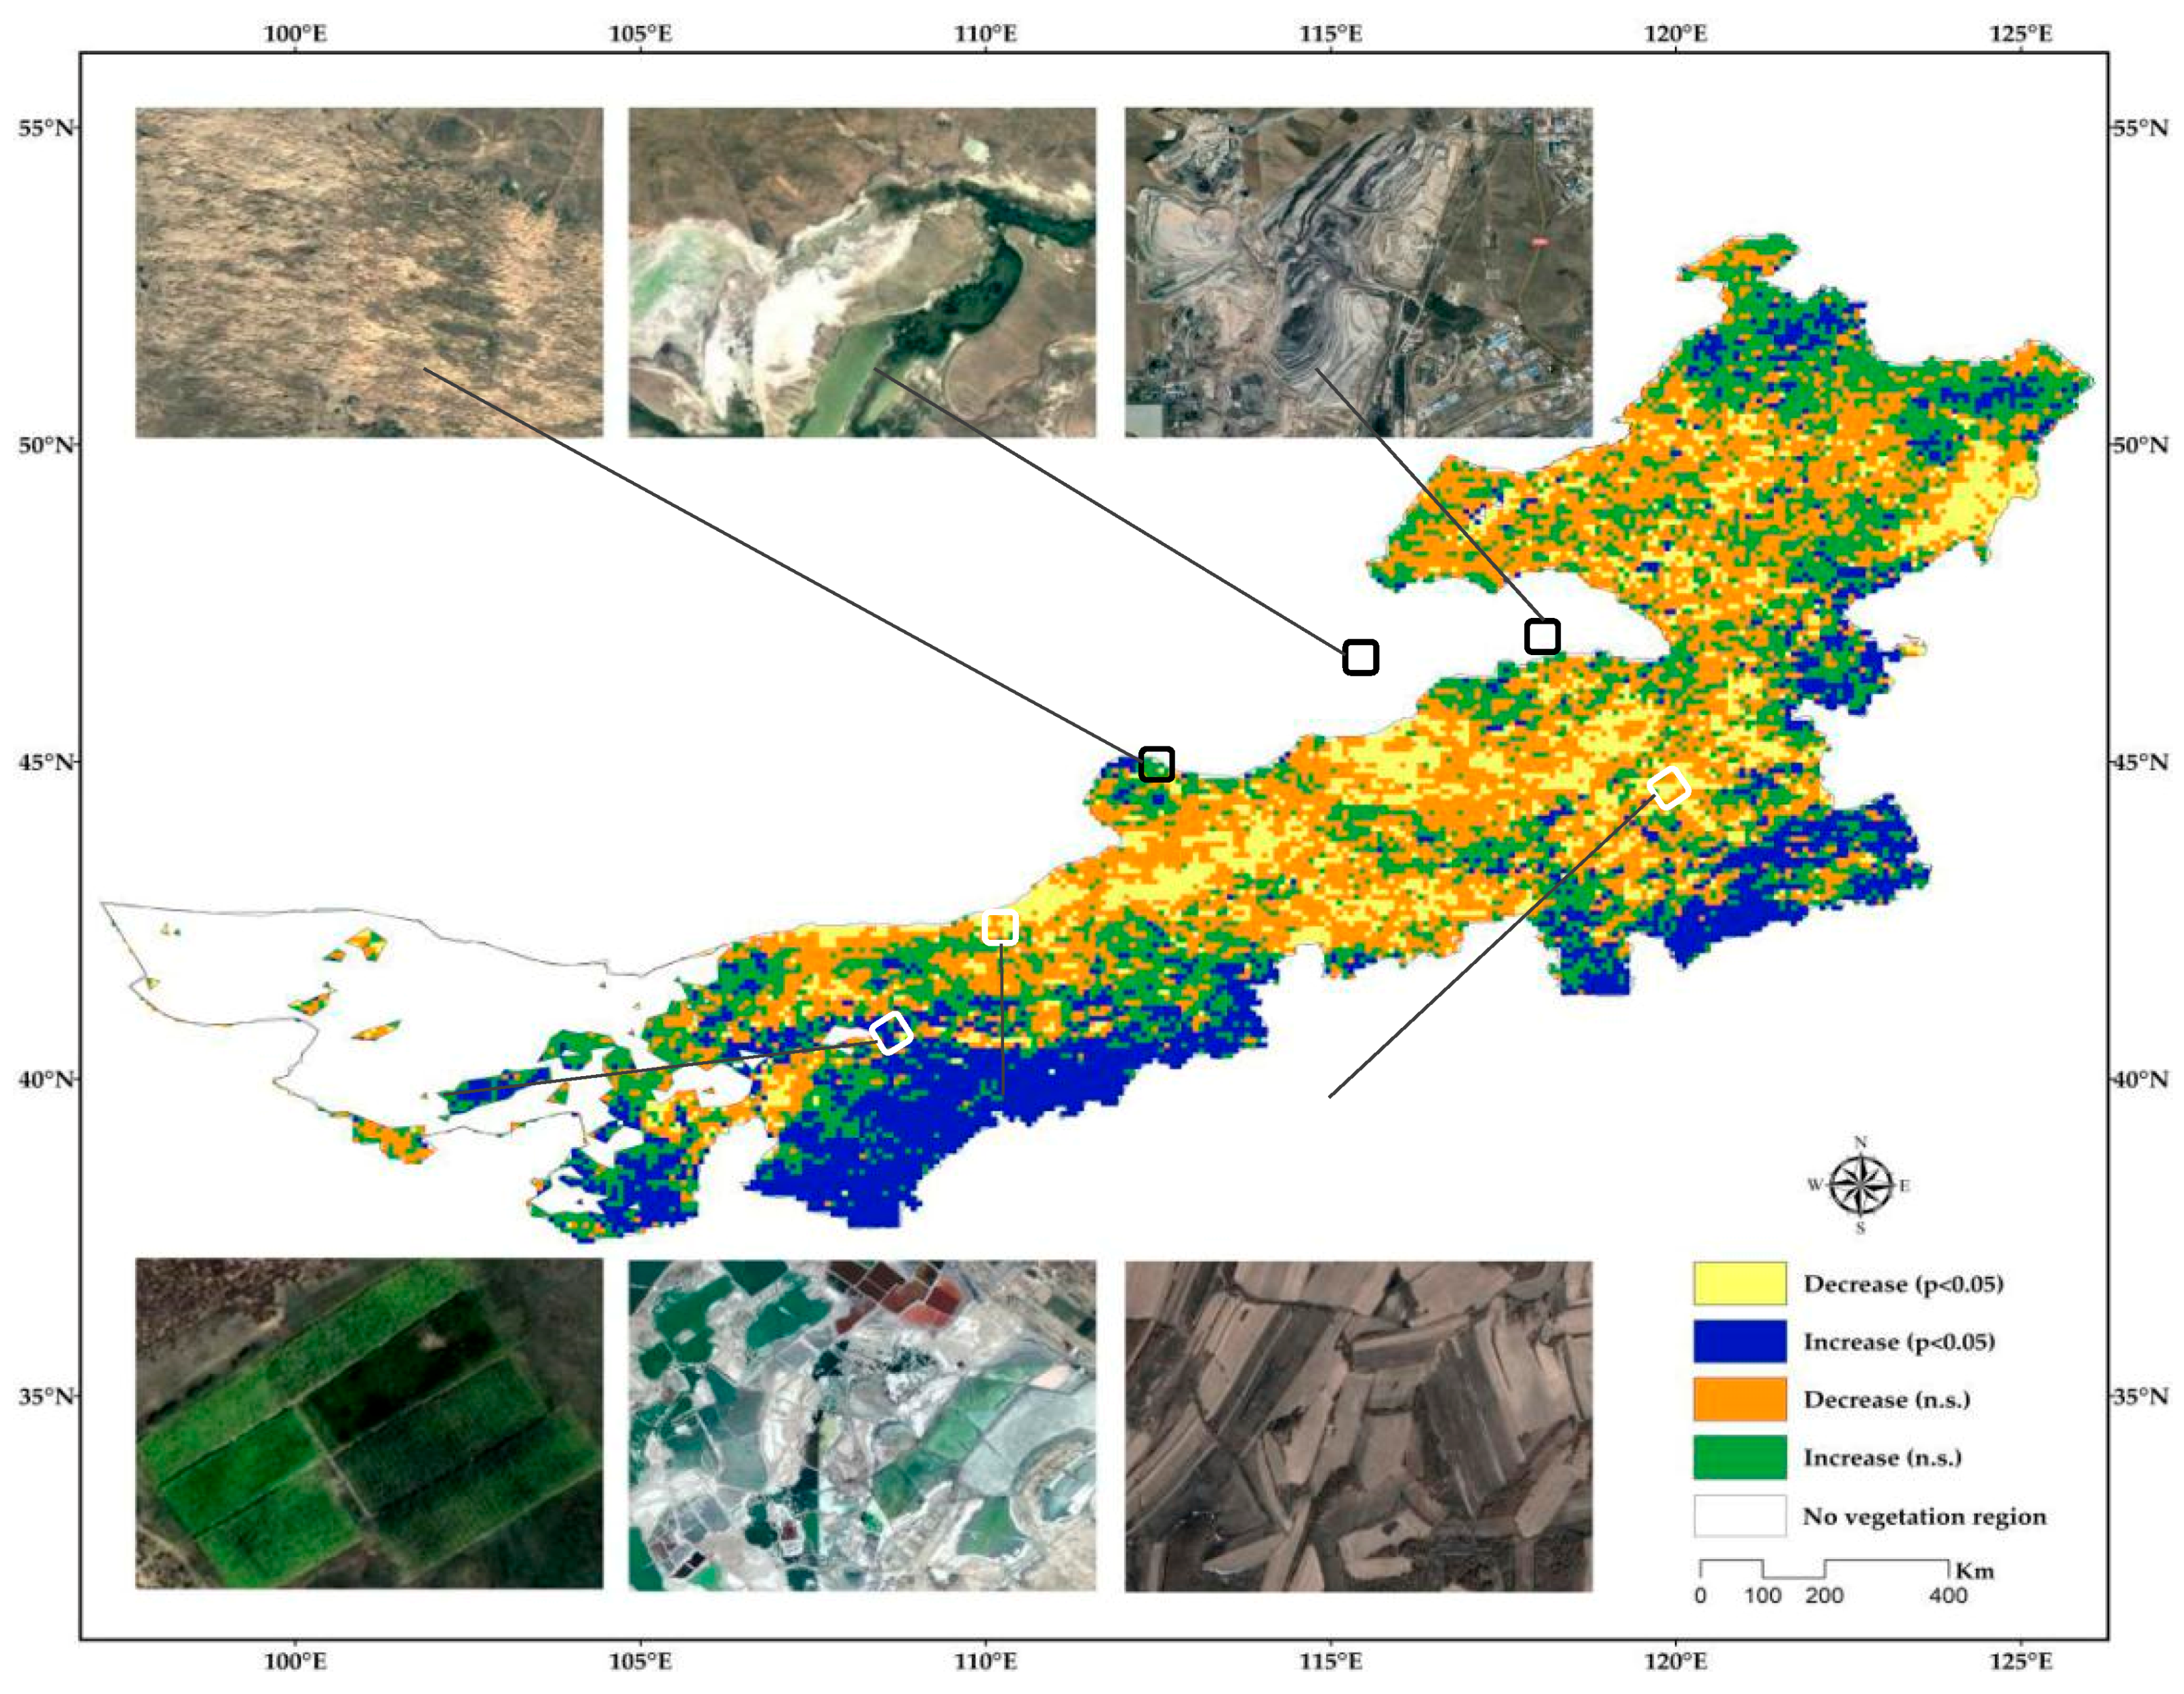
3.1. The Vegetation Dynamics Trend from 1982 to 2015, and the Consistency of Trends

Figure 2a shows that from the results of the simple linear regression analysis, the changes in the average NDVI have a slightly upward trend in the northeastern part of forest and the southeastern and southwestern parts of typical steppe regions, with annual change rates of up to 0.0172/a. A slightly downward trend in vegetation was detected in the forest steppe and center of typical steppe regions, with annual change rates as low as −0.0059/a, with the area reaching 49% of the study area. The variation in NDVI trends combined with the result of the Mann-Kendall test were classified into five classes, presented in Figure 2b and Table 2. The significant improvement areas are distributed in the northeastern part of the forest, and the southeastern and southwestern parts of typical steppe regions, with the area covering 18% of the study area. The significant degradation areas are mainly distributed in the forest steppe and the center of the typical steppe regions, with the area covering 17% of the study area. A slight improvement in vegetation was found in the sand desert, steppe desert, desert steppe, and northeastern part of the forest regions, with the total area reaching 33% of the study area. Slight degradation areas are mainly distributed in the forest steppe and typical steppe regions, with an area ratio of 37%. Over the past three decades, greater increases in the change rates for vegetation were found for the steppe desert, desert steppe, and sand desert than for typical steppe, forest steppe, and forest region. In general, the areas of significant improvement were larger than significant degradation, and areas of slight improvement were larger than slight degradation in the study area.
The predicted future vegetation growth patterns based on the Hurst exponent index are presented in Figure 2c. H ≥ 0.5 accounts for 12% of the total area, indicating consistency, and is scattered in the forest steppe, southern part of typical steppe, and desert steppe regions. Those area are mainly distributed in the cultivated land region of Inner Mongolia (such as the Hetao cultivated field), which is mainly influenced by human factors. Most of the vegetated regions had H values lower than 0.5, which indicates inconsistency, accounting for 88% of the vegetated area. H values of 0 ≤ H ≤ 0.4 are mainly distributed in the typical steppe, desert steppe, and steppe desert regions. To confirm the consistency in the dynamic trends of the mean NDVI, the results of the Hurst exponent were superimposed onto consistency and change trends, presented in Figure 2d and Table 2. The results show that consistent change trends account for 12% of the total area. Among them, the degradation area accounts for 5%, and the improvement area accounts for 7%. The regions of consistent improvement are scattered in the southwestern and southern parts of the typical steppe regions, and the consistent degradation is mainly distributed in the center part of the forest steppe regions. The inconsistent area of the NDVI change trend accounts for 88%, with areas of inconsistent improvement and inconsistent degradation accounting for 44% each. These areas are mainly distributed in the grassland system, and are more sensitive to climate factors changes. In general, most of the vegetated areas in Inner Mongolia appear to be inconsistent.

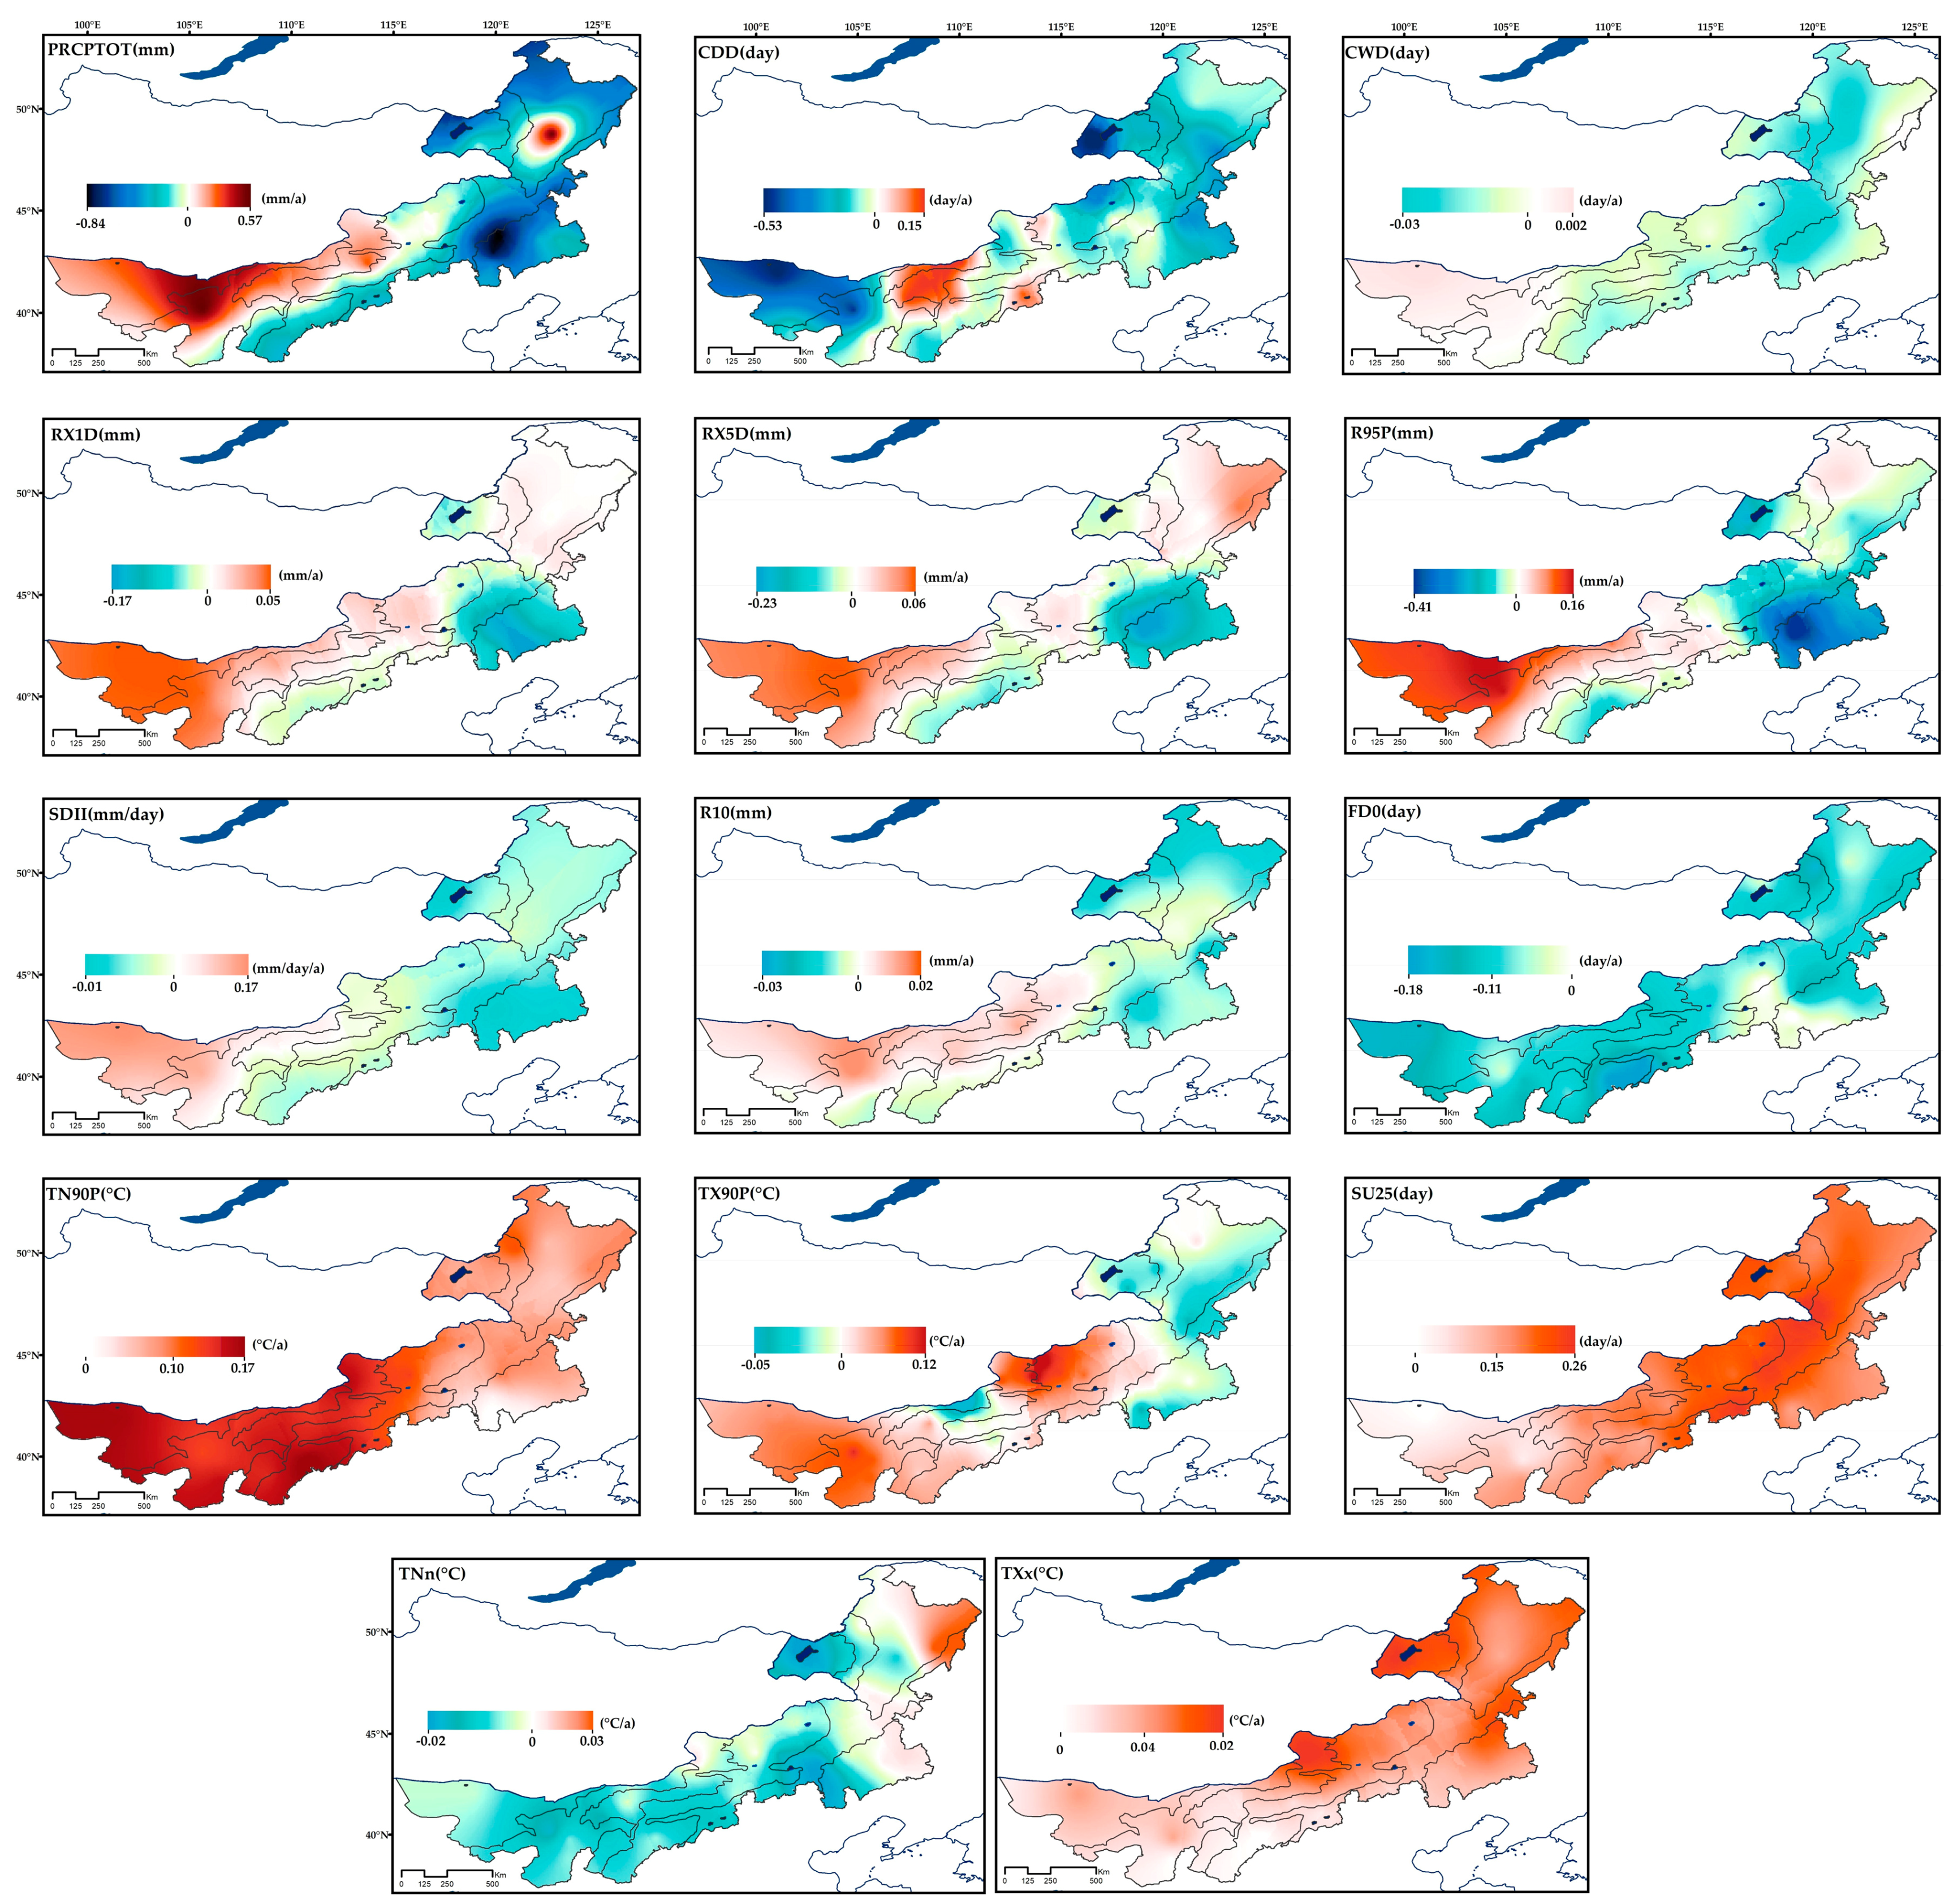
3.2. The Extreme Climate Indices Changes Trend in Different Vegetation Types

The spatial distribution of the change trends of extreme climate indices from 1982 to 2015 are shown in Figure 3. The change trends of the extreme precipitation indices show different spatial characteristics for each vegetation type, with the greatest changes observed for PRCPTOT. Changes in the annual PRCPTOT exhibit increasing trends in sand desert, steppe desert, and desert steppe regions, with annual change rates as high as 0.57 mm/a, and decreasing trends in the forest steppe and a small part of the forest and typical steppe regions, with a rate of −0.84 mm/a. In contrast, the CDD shows increasing trends in the desert steppe regions, with annual change rates as high as 0.15 day/a, and decreasing trends in the sand desert, steppe desert, forest steppe, and forest regions, with an annual change rate of −0.53 day/a. The annual CWD, SDII, R95P, and R10 indicate that the extreme large precipitation indices change rates are both slight and are about the same rate as PRCPTOT. In addition to the declining trends of RX1D and RX5D in the southeastern part of the typical steppe, the other regions show slightly increasing trends. In the overall view, the indices of extreme large precipitation have significantly increasing trends in the sand desert and steppe desert regions, and show significantly declining trends in the forest steppe and forest regions, with a slightly upward trend in the typical steppe.
The change trends of the extreme temperature indices from 1982 to 2015 have been shown to be significant in Inner Mongolia. For example, the annual summer days (SU25), max Tmin (TXx), and warm nights (TN90P) trends indicate extreme warm temperature indices exhibiting upward trends in the study area. Among them, the annual SU25 and TXx indices show significant upward trends in the forest, forest steppe, and east of typical steppe regions, with change rates up to 0.26 day/a and 0.02 °C/a, respectively; the TN90P shows a significantly upward trend in the sand desert, steppe desert, and desert steppe regions, with change rates as high as 0.17 °C/a. The annual TX90P exhibits upward trends throughout the study area, except for the eastern part of Inner Mongolia. The annual frost days (FD0) and min Tmin (TNn) indicate extreme cold temperature indices exhibiting downward trends in most of the study area. Overall, the indices of extreme warm temperatures showed a continuous upward trend, while the indices of extreme cold temperatures showed downward trends.

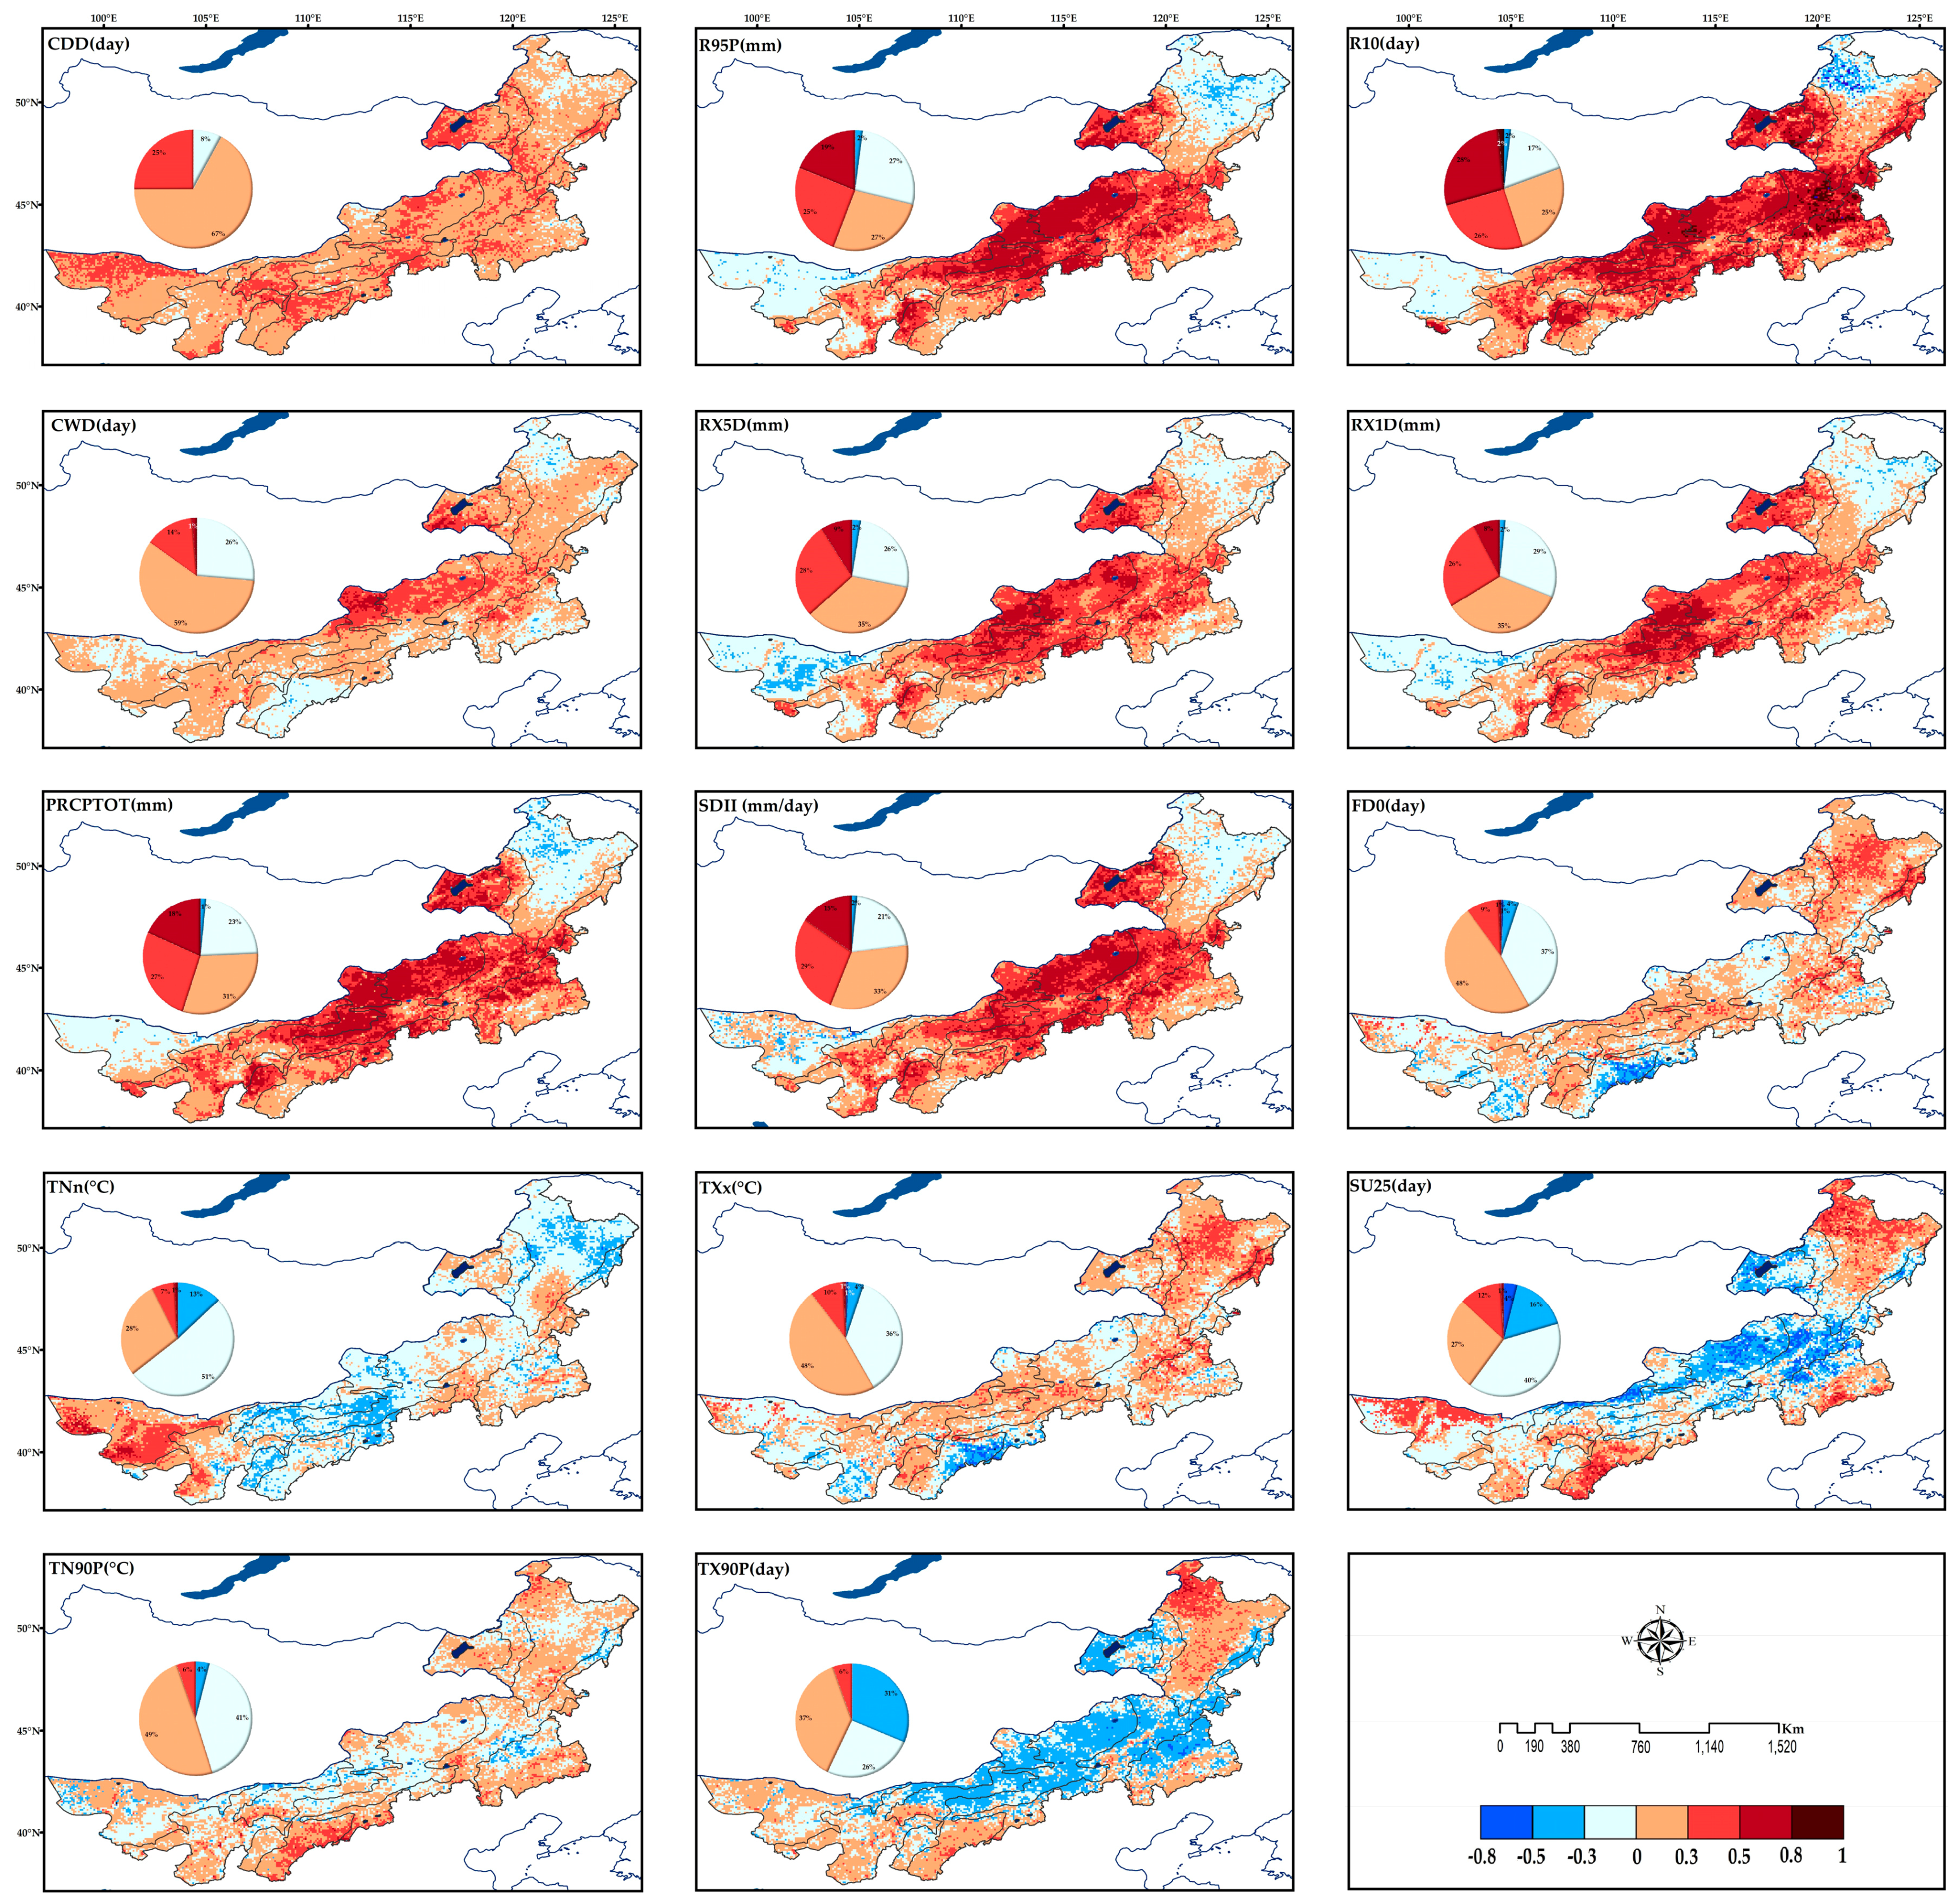
3.3. Correlation between NDVI and Extreme Climate Changes on a Yearly Basis

According to the results of the correlation between extreme climate changes and mean NDVI trends for different vegetation types during 1982 to 2015, presented in Figure 4, we found a greater correlation between the mean NDVI and the annual indices of PRCPTOT, R10, R95P, SDII, RX1D, and RX5D than for CDD and CWD. The positive correlations between the indices for extreme precipitation and NDVI were ranked as follows: R10 > R95P > PRCPTOT > SDII > RX5D > RX1D > CWD > CDD. Spatially, the positive correlation between the NDVI and annual extreme precipitation variables in the typical steppe, forest steppe, and desert steppe was significantly higher than for the other vegetation types in Inner Mongolia. In contrast, the sand desert and forest regions exhibited negative correlations between NDVI and extreme precipitation, especially in the sand desert regions. The extreme precipitation is the main factor affecting the vegetation growth of forest steppe, typical steppe, and desert steppe, especially for the extremely large precipitation indices.
Correlations between the extreme temperature indices and NDVI are negative or weakly positive (0 < r ≤ 0.3) in all of the steppe types. The correlations between NDVI and SU25, TNn, and TX90P are negative in more areas than the weakly positive. The correlations between NDVI and FD0, TXx, and TN90P are negative in fewer areas than the weakly positive correlation. Spatially, the negative correlations between the NDVI and annual SU25, TNn, and TX90P in the forest steppe, typical steppe, and desert steppe were significant, while there was significant positive correlation in the sand desert and forest regions. FD0, TXx, and TN90P exhibited a weak negative correlation (−0.3 < r ≤ 0) in the sand desert region, and the opposite correlation in the other vegetation types. Extreme temperature is the main factor affecting the vegetation growth of the forest regions, especially extreme warm temperature indices.

3.4. Correlation between NDVI and Extreme Climate Changes on a Monthly Basis

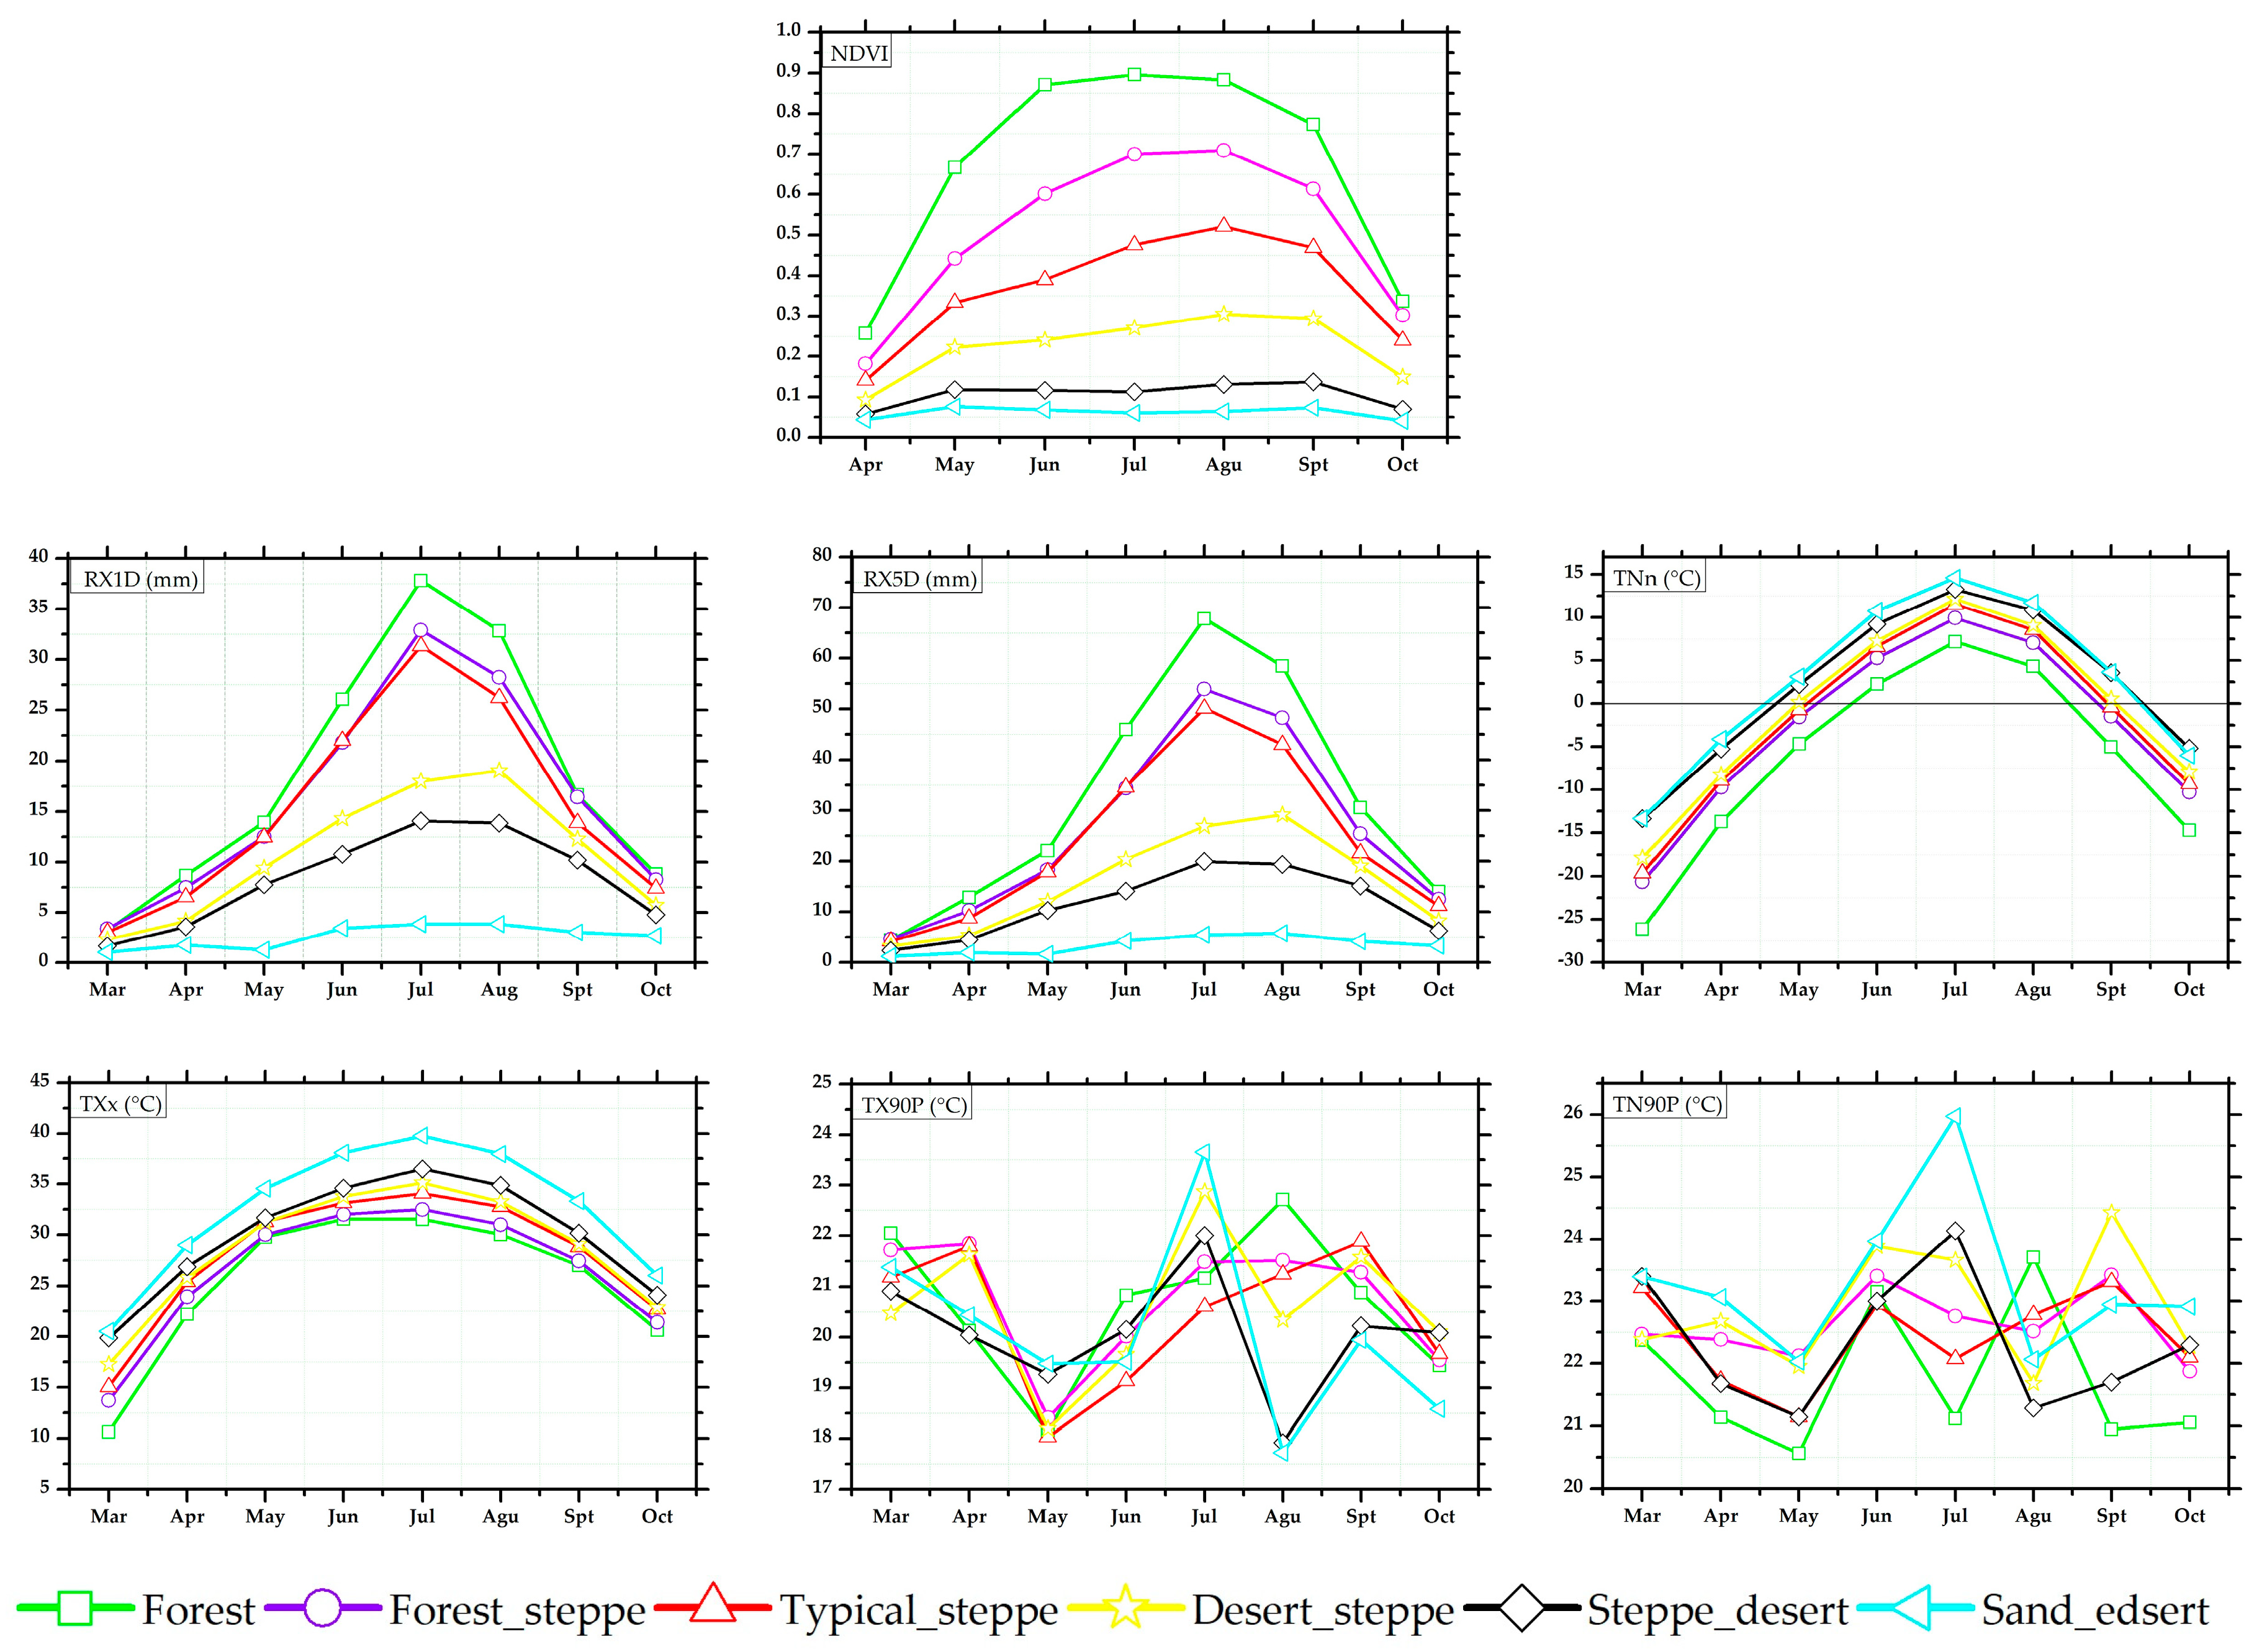
3.4.1. Variation of Mean Monthly NDVI and Extreme Climate Indices during 1982–2015

Figure 5 shows the trends of the mean monthly NDVI and extreme climate indices of the growing seasons in different vegetation types during 1982–2015. For trends of monthly NDVI, the highest values are in July for the forest region, and the lowest values are in April for the sand desert region. The NDVI values of different vegetation types ordered from high to low are as follows: forests, forest steppe, typical steppe, desert steppe, steppe desert, and sand desert. The NDVI values of each month ordered from high to low are as follows: August, July, September, June, May, October, and April. The monthly changes in NDVI values are small in the steppe desert and sand desert regions. It can be further explained that the vegetation is sparse all year round in these two areas. For the monthly extreme precipitation indices, the RX1D and RX5D values for different vegetation types ranked from high to low are as follows: forests, forest steppe, typical steppe, desert steppe, steppe desert, and sand desert. This result is consistent with the precipitation characteristics of Inner Mongolia. For extreme temperature indices, the temperature values of different vegetation types from high to low are as follows: sand desert, steppe desert, desert steppe, typical steppe, forest steppe, and forest. Those can be explained by less vegetation, leading to a decline in soil evaporation capacity, and then to drought, reduced rainfall, and hotter weather.

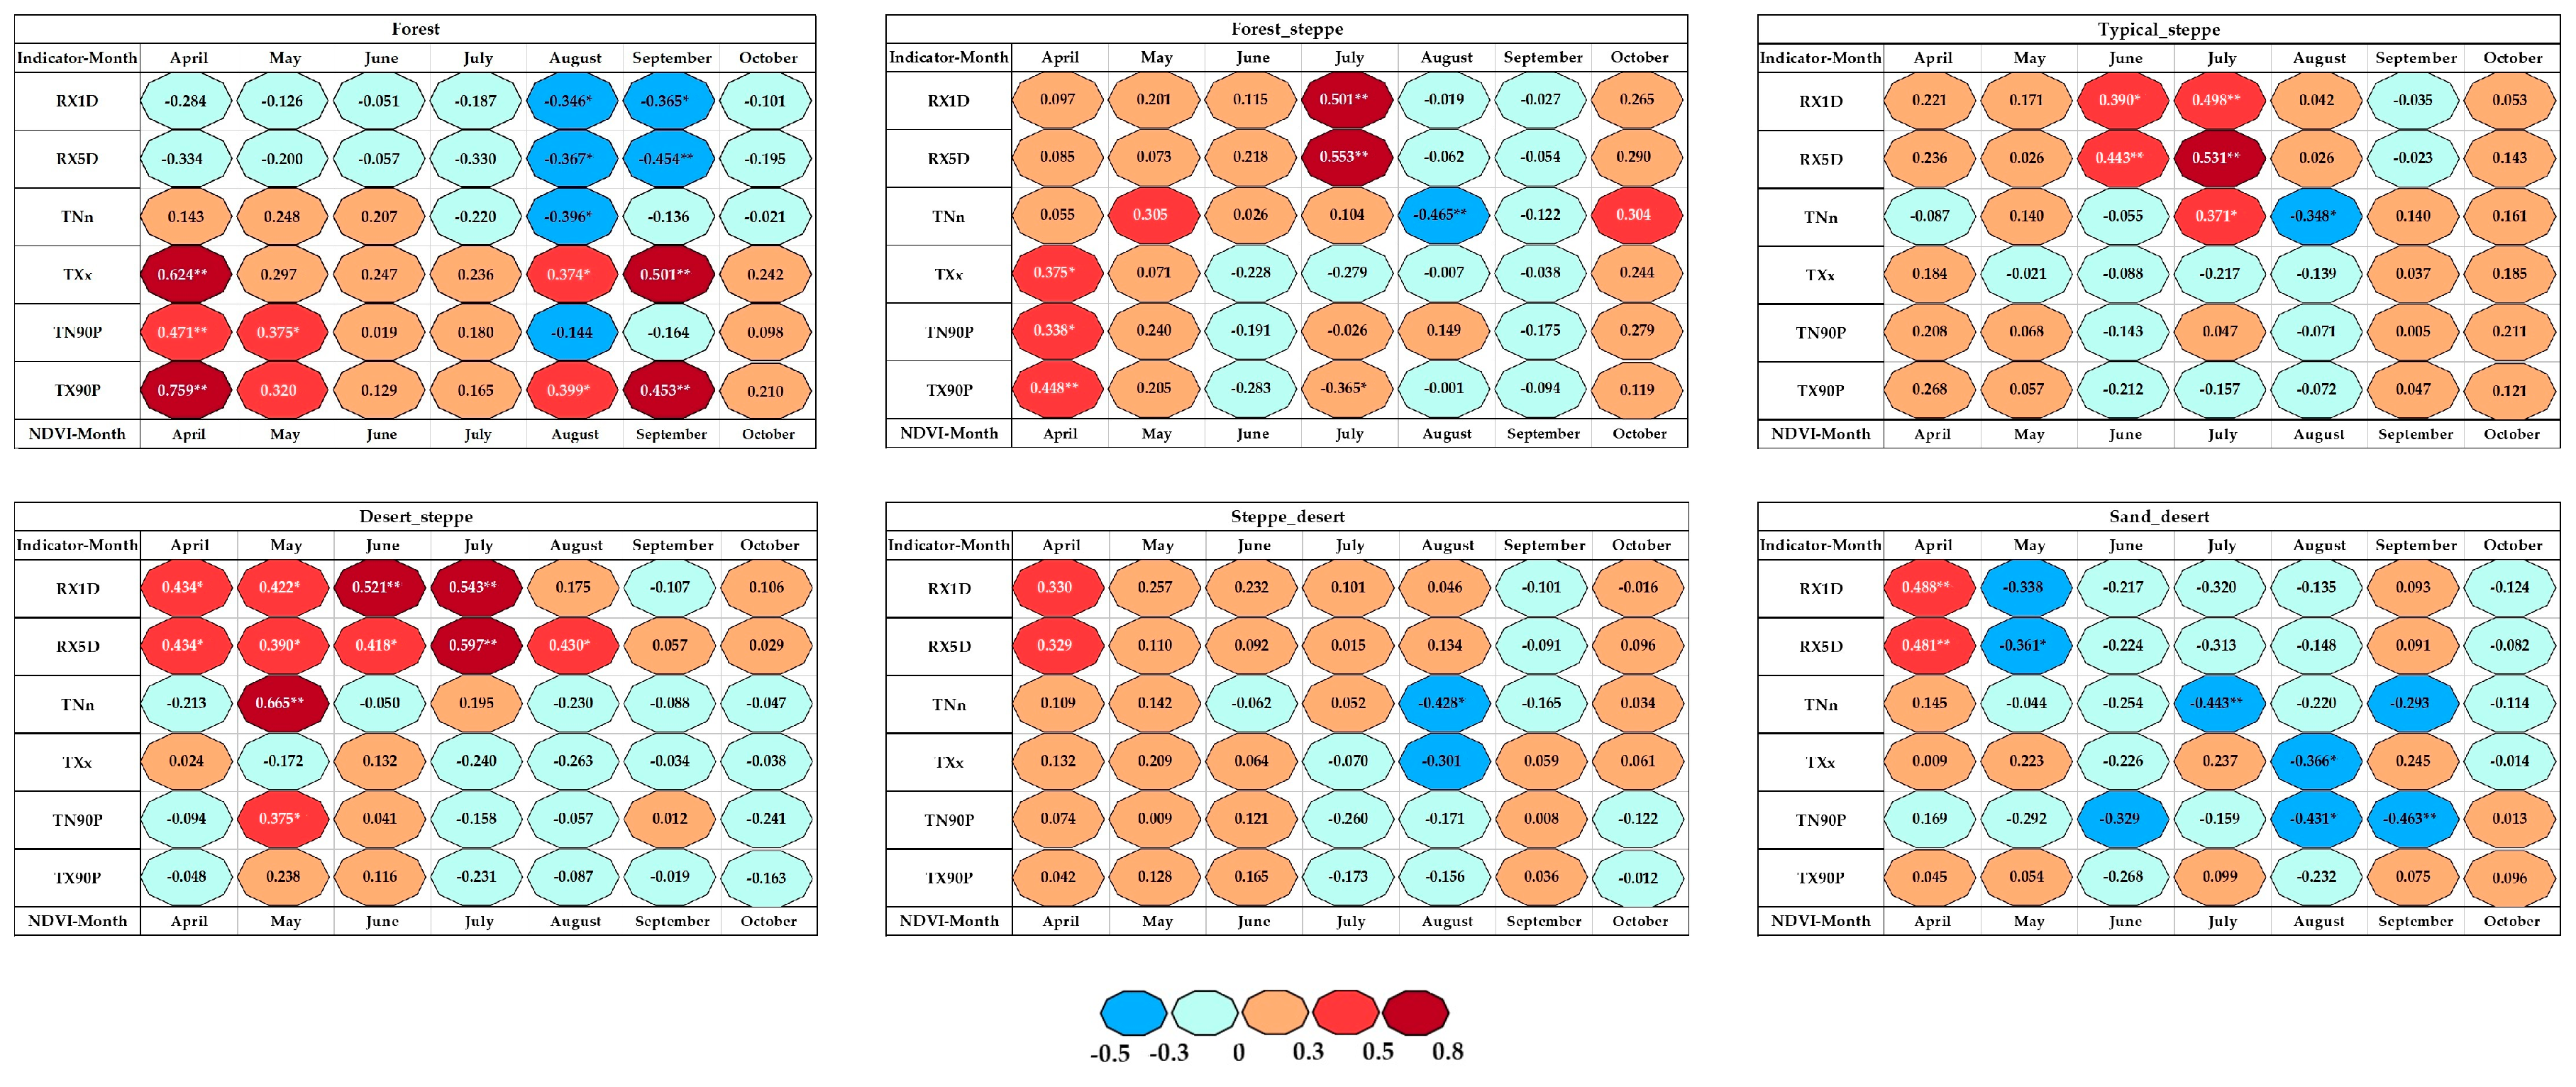
3.4.2. The Same-Time Responses of Monthly NDVI to Extreme Climate Changes

To study the response of the vegetation to extreme climate changes on a finer temporal scale, the correlations between the monthly NDVI and extreme climate indices were calculated during 1982–2015, as presented in Figure 6. For the forest region, TXx and TX90P have a significant positive correlation with NDVI in April (RTXx = 0.624, RTX90P = 0.759), August, and September (RTXx = 0.501, RTX90P = 0.453), with the p-values both lower than 0.003. The correlation between the NDVI of the forest region and the extreme precipitation indices exhibit a negative correlation for all months, especially in August (RRX1D = −0.346, RRX5D = −0.367) and September (RRX1D = −0.365, RRX5D = −0.454), with the p-values both lower than 0.045. For the forest steppe, typical steppe, desert steppe, and steppe desert regions, the NDVI was correlated positively with RX1D and RX5D for all months, except August and September. In particular, the NDVI exhibited a significantly positive correlation with RX1D and RX5D in April (R = 0.434), May (RRX1D = 0.422, RRX5D = 0.390), June (RRX1D = 0.521, RRX5D = 0.418), and July (RRX1D = 0.543, RRX5D = −0.597), with p-values both lower than 0.01, and particularly with RX5D in July, with the p-value lower than 0.000. For the forest steppe and typical steppe, the highest positive correlation with the NDVI and extreme precipitation occurred in July (forest steppe: RRX1D = 0.501, p = 0.003, RRX5D = 0.553, p = 0.001; typical steppe: RRX1D = 0.498, p = 0.003, RRX5D = 0.531, p = 0.001). The extreme temperature indices in the grass vegetation types exhibited a weak positive or negative correlation, and a consistently negative correlation in the typical steppe (June to August) and desert steppe (July to October). For the desert steppe, there was a positive correlation with extreme precipitation, except for September, with correlation coefficients of RRX1D = 0.330 and RRX5D = 0.329 in April. For the sand desert region, negative and weak positive correlations with extreme climatic indices occurred in all months, except for April.

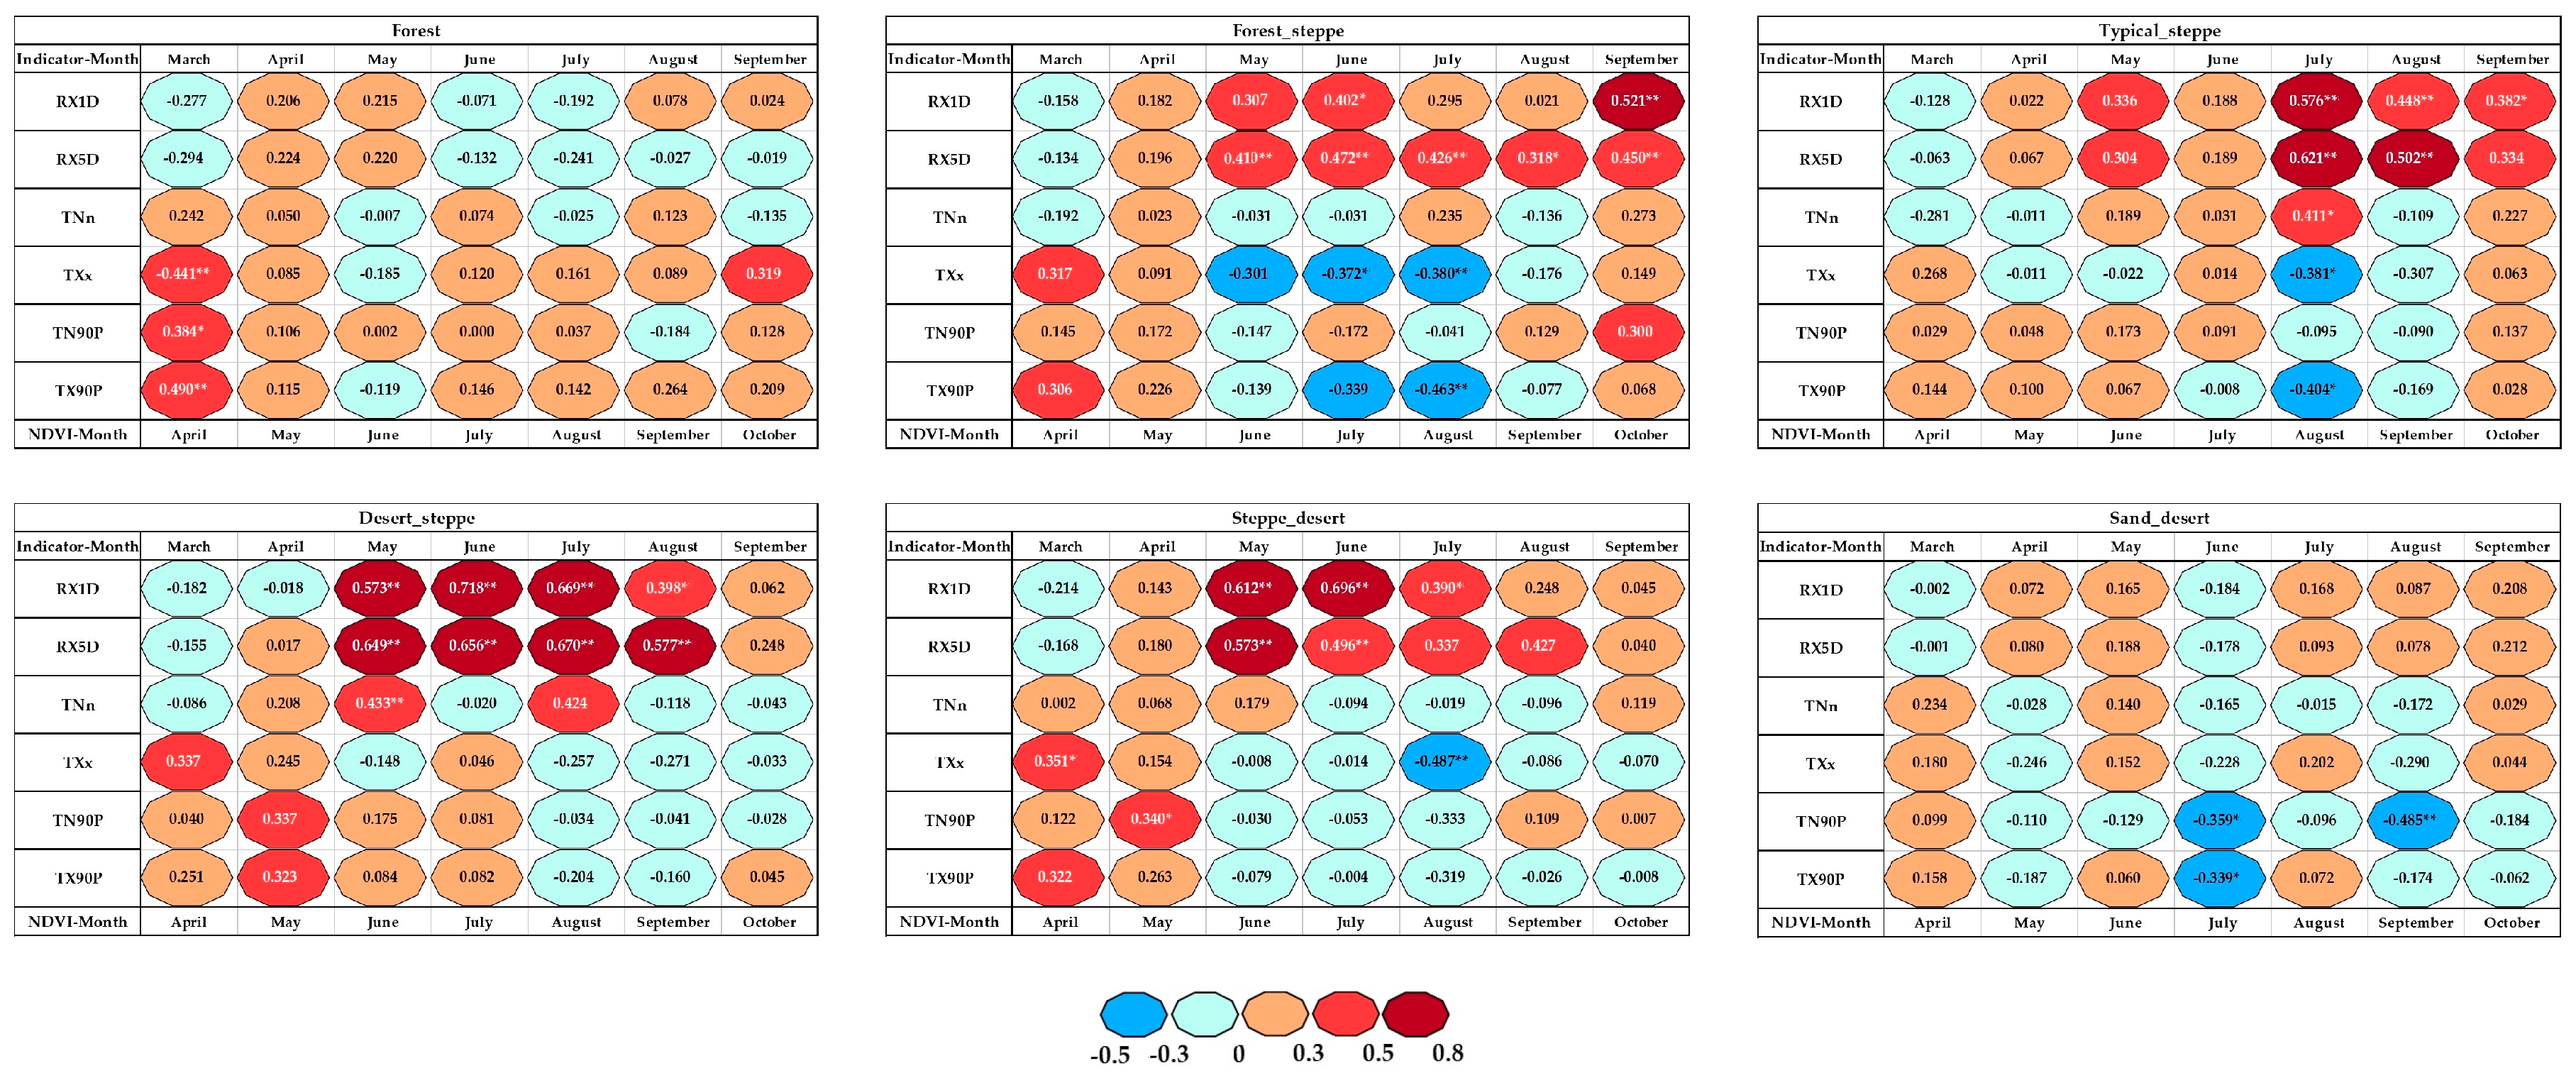
3.4.3. The Lagged-Time Responses of Monthly NDVI to Extreme Climate Changes

Figure 7 shows the correlation coefficients between the monthly NDVI and extreme climate indices in all previous months for different vegetation types during 1982–2015. For the forest region, the correlations between the NDVI and extreme temperature indices of the preceding month were significantly positive in April, except for the extreme cold temperature index for TNn. However, correlations between the NDVI and extreme precipitation indices of the preceding month were negative or weakly positive for the forest region. There was a positive response of NDVI to extreme temperature indices in the same month for the forest system, and a significantly positive response of NDVI to the extreme precipitation indices with a one-month lag for the grassland system. Among them, the best correlation with NDVI was with the desert steppe, from June to September, especially for the RX5D, exhibiting a high correlation coefficient in the desert steppe in June (R = 0.649), July (R = 0.656), August (R = 0.670), and September (R = 0.577), with a p-value of 0.0001 in all cases. Similarly, the RX5D and RX1D exhibit high correlation coefficients for the typical steppe, forest steppe, and steppe desert in June, July, August, September, and October. A one-month lag effect exists for extreme precipitation in the grassland system. However, the correlation coefficient between the extreme temperature indices and NDVI has a negative or weakly positive lagged effect for most of the vegetation types, except for the forest regions, and particularly in the forest steppe regions, the TXx and TX90P have significant negative correlations from June to August. For the sand desert regions, the TN90P and TX90P exhibit significantly negative correlations in July, as R = −0.359 and R = −0.339, respectively.

4. Discussion

4.1. The Trend and Consistency of Vegetation Dynamics in Different Vegetation Types

According to the results of the Hurst exponent analysis, most of the vegetation changes were inconsistent in Inner Mongolia. So, to analyze the reasons for the scattered evidence of consistency in the vegetation trends in Inner Mongolia, we conducted the NDVI residual analysis of Inner Mongolia. Figure 8 shows the residual trends of the NDVI in Inner Mongolia during 1982–2015, and the location of the significant changes in the NDVI residuals in Google Maps. The results of the residual analysis revealed that the significantly increased areas were mainly concentrated in southern part of the desert steppe and the southern and southeastern parts of the typical steppe regions. The areas of significant decrease were scattered in the forest steppe and typical steppe, with the area of significant change in the NDVI in Inner Mongolia accounting for 32% of the total area. Those results indicated that the NDVI changes in these areas cannot be only interpreted by climate changes, but that human activity must also be taken into consideration. Detected from Google Maps, the area of significant increase in the residual trend mainly covers crop regions with the use of chemical fertilizers and the construction of the irrigation water conservancy facilities, such as the Hetao cultivated field [25]. The residuals of the NDVI revealed areas of a significant decrease, mainly in the areas of mining, land desertification and salinization, barren cultivated land, and ecological deterioration, such as the Xilingol and Holingol regions. The area of insignificant changes in the residual trend in Inner Mongolia accounted for 68%, indicating that 68% of the vegetation growth changes in Inner Mongolia can be explained by climate change. Therefore, studying the response of vegetation to extreme climate changes is crucial in Inner Mongolia.

4.2. The Trend of the Extreme Climate Changes during 1982 to 2015

Inner Mongolia has experienced extreme climate change under the influence of global warming and drying. The extreme precipitation indices presented slight changes, except for PRCPTOT, in the whole Inner Mongolia. For extreme temperature, this study confirmed previous research, that the extreme cold temperature indices showed a significant decline, the extreme warm temperature indices showed an upward trend [23]. This will inevitably increase the need for fire protection of forests and grasslands. The decreases in the extreme low temperature events will not only help the vegetation overwinter, but will also help the pests overwinter and will increase the risk of pest disease in the region [44]. However, there are significant differences in the changes of extreme climate at different biome scales. For example, the annual total wet–day precipitation index of PRCPTOT has significant upward trends in the sand desert and steppe desert regions, and significant downward trends in the typical steppe and forest steppe regions. The consecutive dry days of CDD have significant upward trends in a part of the desert steppe. This phenomenon will cause aridification in the region.

4.3. Responses of Vegetation to Extreme Climate Changes

Different vegetation types responded differently to extreme climate changes [45]. From the interannual correlation between extreme climate changes and the mean NDVI of the growing seasons during 1982 to 2015 for different vegetation types in Inner Mongolia, we can see that the grassland system is more sensitive to extreme large precipitation than the forest region, such as the indices of R10, PRCPTOT, R95P, and SDII. On the other hand, the forest regions are more sensitive to extreme warm temperature, exhibited by the extreme warm temperature indices. These results confirmed the previous research regarding the response of vegetation to climate changes at different biomes in the Mongolian Plateau [26]. The possibility of extreme high temperature increases with the increase in temperature. This leads to the increase in glacier ablation and the evaporation of water vapor, which come from the ocean and land surface, respectively. Subsequently, the rising of water vapor in the upper air tends to cause rain, which then results in an increase in precipitation and the possibility of extreme precipitation events. So, there is a need to consider the correlation among extreme temperature and extreme precipitation indices [44].
The correlation between the monthly extreme precipitation indices of RX1D and RX5D with the same-time monthly NDVI for different vegetation types has a significant positive correlation, except for the forest and sand desert regions. This result can be interpreted as the soil of the forest area being able to hold a large amount of water that can be released for a longer time, so that it can avoid being affected by extreme precipitation events. In contrast, the soil of the grassland vegetation cannot hold water for a long duration, so the vegetation is immediately affected by extreme precipitation events [41]. In the sand desert regions, where there are large areas with no vegetation, much more precipitation does not have the same effect. The correlation between monthly TXx, TX90P, and TN90P with the same-time monthly NDVI is positive in the forest regions. It should be indicated that the extreme warm temperature in the growing season plays important roles in forest growth.
Because of lags in the adjustment of the soil moisture content and biological processes, vegetation takes time to respond to extreme climate change. The time lags most likely vary for the different extreme climate indices and different vegetation types [46,47]. The lagged effects of the extreme climate on the growing season vegetation show that the lagged effects for the desert steppe, typical steppe, and forest steppe regions exhibit a more sensitive response to extreme large precipitation than the same-month effects. In the forest region, the maximum response of the vegetation is to the extreme warm temperature in the same month. This result can be explained as the same-month extreme precipitation possibly leading to surplus water, thereby depressing vegetation growth. However, the same-time period and the one-month-lagged results of RX1D and RX5D both present a significant positive correlation with the NDVI of the desert steppe, because there is a special type of plant community in the desert steppe, which is the summer-rain-type annual grass layer. When the rain is particularly rich, this grass layer can account for much of the vegetation growth, particularly soon after a rainfall. This may be a reason for the same-month impact and lag impact of extreme precipitation being not significantly different in the desert steppe type. Previous research found that the vegetation maximally responds to a temperature lag of about 10 days and maximally responds to a precipitation lag of about 30 days [48].

5. Conclusions

This research is based on the long-term GIMMS NDVI3g datasets, as well the eight extreme precipitation indices and six extreme temperature indices that are highly correlated with drought or floods, heat or low temperature disasters, and vegetation growth in Inner Mongolia. By linear regression analysis, the Hurst exponent index, residual analysis, and the Pearson correlation analysis, the long-term vegetation dynamics and diverse responses to extreme climate change at different vegetation type scales of Inner Mongolia were analyzed. The main conclusions of the study are as follows:
(1)
The vegetation changes from 1982 to 2015 show an improvement trend and exhibit significant regional characteristics in Inner Mongolia. Most of the observed vegetation changes are inconsistent, with the consistent areas scattered in the crop, mining, barren cultivated land, and the grassland desertification and salinization regions. Therefore, for 68% of Inner Mongolia, the change in vegetation growth can be explained by climate change.
(2)
Much of the extreme precipitation exhibited increasing trends in the sand desert and steppe desert regions, showing significant declining trends in the forest steppe and forest regions, and slightly upward trends in the typical steppe, except for CDD. The extreme cold temperature trends showed a significant decline, while the extreme warm temperature trends were positive in Inner Mongolia. It should be indicated that extreme precipitation exhibited regional changes, and the study area has experienced a rapid and accelerated warming trend in the last 34 years, especially in regions with less vegetation.
(3)
The typical steppe, desert steppe, and forest steppe regions exhibit more sensitive responses to extreme large precipitation, such as indices of R10, PRCPTOT, R95P, and SDII. On the other hand, the forest regions exhibit more sensitive responses to extreme warm temperature, in indices such as TX90P, TN90P, SU25, and TXx.
(4)
There is a significant positive correlation between the monthly RX1D and RX5D, and the same-time monthly NDVI, except for the forest and sand desert regions. The correlation between the monthly TXx, TX90P, and TN90P and the same-time monthly NDVI is negative or weakly positive, except for the forest regions. Extreme precipitation exhibits a one-month lagged effect on vegetation, which is larger than the same-month effects on the grassland system. Extreme temperature, exhibits same-month effects on vegetation that are larger than the one-month lagged effects on the forest system.

Author Contributions

All of the authors contributed significantly to this manuscript. L.N. and R.N. equally contributed to this work; are the principal authors of this manuscript; and were responsible for the collection, analysis, and interpretation of the data. J.Z. is the corresponding author and is responsible for the experiment ideas. Y.S. and Y.B. assisted in the structure of the manuscript. S.T., H.Y., and X.L. contributed to the analysis tools and the reviewing of the manuscript.

Funding

This research was funded by the National Science Foundation of China (41571491, 41371495, and 41561099); the China Special Fund for Meteorological Research in the Public Interest (No. GYHY201506001-6); the National Key Technology R&D Program of China, under grant (2013BAK05B01); and the Fundamental Research Funds for the Central Universities of China (2412016KJ046).

Conflicts of Interest

The authors declare no conflict of interest.

References

  1. Coumou, D.; Rahmstorf, S. A decade of weather extremes. Nat. Clim. Chang. 2012, 7, 491–496. [Google Scholar] [CrossRef]
  2. Ross, T.F.; Lott, N. A Climatology of 1980–2003 Extreme Weather and Climate Events; Technical Report 2003-01; National Climatic Data Center: Asheville, NC, USA, 2003.
  3. Lubchenco, J.; Karl, T.R. Predicting and managing extreme weather events. Phys. Today 2012, 65, 31. [Google Scholar] [CrossRef] [Green Version]
  4. Zhao, C.; Wang, Y.; Zhou, X. Changes in climatic factors and extreme climate events in northeast China during 1961–2010. Adv. Clim. Chang. Res. 2013, 4, 92–102. [Google Scholar]
  5. Tao, F.; Zhang, Z.; Zhang, S. Variability in crop yields associated with climate anomalies in China over the past three decades. Reg. Environ. Chang. 2016, 16, 1–9. [Google Scholar] [CrossRef]
  6. Zhang, W.; Pan, S.; Cao, L. Changes in extreme climate events in eastern China during 1960–2013: A case study of the Huaihe River Basin. Quat. Int. 2015, 380, 22–34. [Google Scholar] [CrossRef]
  7. Easterling, D.R.; Evans, J.L.; Groisman, P.Y. Observed variability and trends in extreme climate events: A brief review. Bull. Am. Meteor. Soc. 2000, 81, 417–425. [Google Scholar] [CrossRef]
  8. Vogt, D.J.; Vogt, K.A.; Gmur, S.J. Vulnerability of tropical forest ecosystems and forest dependent communities to droughts. Environ. Res. 2016, 144, 27–38. [Google Scholar] [CrossRef] [PubMed] [Green Version]
  9. China’s National Climate Change Program [EB/OL]. Available online: https://www.mfa.gov.cn/ce/ceun/ eng/chinaandun/economicdevelopment/climatechange/t626117.htm (accessed on 30 June 2007).
  10. Qi, X.K.; Tang, Y.; Zhou, Y.; Li, D.L. A Comparison Study of Extreme Climate Changes in Different Areas in Northern China. J. Nat. Sci. 2017, 5, 79–87. [Google Scholar]
  11. Zhang, X.L.; Ni, N. Impact of changes of Beijing Extreme Precipitation Events on City Water Resources. Ningxia J. Agric. For. Sci. Technol. 2013, 54, 103–106. [Google Scholar]
  12. Lan, Y.K. Study on the Characteristics of Climate Change in Inner Mongolia in Recent 50 Years. Ph.D. Thesis, Chinese Academy of Agricultural Sciences, Beijing, China, 2007; pp. 1–43. [Google Scholar]
  13. Gutschick, V.P.; Bassirirad, H. Extreme events as shaping physiology, ecology, and evolution of plants: Toward a unified definition and evaluation of their consequences. New Phytol. 2010, 160, 21–42. [Google Scholar] [CrossRef]
  14. Nathalie, P.; Jon, O.V.; Atle, M.; Jean, M.G.; Compton, J. Using the satellite-derived NDVI to assess ecological responses to environmental change. Trends. Ecol. Evol. 2005, 65, 503–509. [Google Scholar]
  15. Gu, Z.; Duan, X.; Shi, Y.; Li, Y.; Pan, X. Spatiotemporal variation in vegetation coverage and its response to climatic factors in the red river basin, China. Ecol. Indic. 2018, 93, 54–64. [Google Scholar] [CrossRef]
  16. Wu, D.; Zhao, X.; Liang, S.; Zhou, T.; Huang, K.; Tang, B. Time-lag effects of global vegetation responses to climate change. Glob. Chang. Biol. 2015, 21, 3520–3531. [Google Scholar] [CrossRef] [PubMed]
  17. Myneni, R.B.; Keeling, C.; Tucker, C.; Asrar, G.; Nemani, R.R. Increased plant growth in the northern high latitudes from 1981 to 1991. Nature 1997, 386, 698–702. [Google Scholar] [CrossRef]
  18. Nemani, R.R.; Keeling, C.D.; Hashimoto, H.; Jolly, W.M.; Piper, S.C.; Tucker, C.J.; Myneni, R.B.; Running, S.W. Climate-driven increases in global terrestrial net primary production from 1982 to 1999. Science 2003, 300, 1560–1563. [Google Scholar] [CrossRef] [PubMed]
  19. Chen, B.; Xu, G.; Coops, N.C.; Ciais, P.; Innes, J.L.; Wang, G.; Myneni, R.B.; Wang, T.; Krzyzanowski, J.; Li, Q. Changes in vegetation photosynthetic activity trends across the Asia-Pacific region over the last three decades. Remote Sens. Environ. 2014, 144, 28–41. [Google Scholar] [CrossRef]
  20. Li, C.; Filho, W.L.; Yin, J. Assessing vegetation response to multi-time-scale drought across Inner Mongolia plateau. J. Clean. Prod. 2018, 179, 210–216. [Google Scholar] [CrossRef]
  21. Shi, J.; Cui, L.; Wen, K.; Tian, Z.; Wei, P.; Zhang, B. Trends in the consecutive days of temperature and precipitation extremes in china during 1961–2015. Environ. Res. 2018, 161, 381–391. [Google Scholar] [CrossRef] [PubMed]
  22. Li, W.; Duan, L.M.; Liu, T.X.; Ge, R.L.T.; Gao, R.Z.; Buren, S.; Yu, C.X. Spatio-temporal variations of extreme precipitation from 1961 to 2015. Resour. Sci. 2017, 39, 2153–2165. [Google Scholar]
  23. Yang, F.X. Trends of Extreme Daily Precipitation and Temperature and the Correlation with NDVI in Inner Mongolia. Ph.D. Thesis, Changan University, Xian, China, 2012; pp. 1–67. [Google Scholar]
  24. Bao, G.; Bao, Y.; Sanjjava, A.; Qin, Z.; Zhou, Y.; Xu, G. NDVI-indicated long-term vegetation dynamics in Mongolia and their response to climate change at biome scale. Int. J. Climatol. 2015, 35, 4293–4306. [Google Scholar] [CrossRef]
  25. Tong, S.; Zhang, J.; Bao, Y. Analyzing vegetation dynamic trend on the Mongolian Plateau based on the Hurst exponent and influencing factors from 1982–2013. J. Geogr. Sci. 2018, 28, 595–610. [Google Scholar] [CrossRef]
  26. Bao, G.; Qin, Z.; Bao, Y. NDVI-Based Long-Term Vegetation Dynamics and Its Response to Climatic Change in the Mongolian Plateau. Remote Sens. 2014, 6, 8337–8358. [Google Scholar] [CrossRef] [Green Version]
  27. Liu, S.L.; Kang, W.P.; Wang, T. Drought variability in Inner Mongolia of northern China during 1960-2013 based on standardized precipitation evapotranspiration index. Environ. Earth Sci. 2016, 75, 145. [Google Scholar] [CrossRef]
  28. Gao, J.B.; Jiao, K.W.; Wu, S.H.; Ma, D.Y.; Zhao, D.S.; Yin, Y.H.; Dai, E.F. Past and future influence of climate change on spatially heterogeneous vegetation activity in China. Earth’s Future 2017, 1–20. [Google Scholar] [CrossRef] [Green Version]
  29. Xu, G.; Zhang, H.; Chen, B.; Zhang, H.; Innes, J.L.; Wang, G.; Yan, J.; Zheng, Y.; Zhu, Z.; Myneni, R.B. Changes in vegetation growth dynamics and relations with climate over China’s land mass from 1982–2011. Remote Sens. 2014, 6, 3263–3283. [Google Scholar] [CrossRef]
  30. Wang, Z.P.; Han, X.G.; Wang, G.G. Aerobic methane emission from plants in the Inner Mongolia steppe. Environ. Sci. Technol. 2008, 42, 62–68. [Google Scholar] [CrossRef] [PubMed]
  31. Cho, M.; Lim, G.H.; Song, H.J. Changes in satellite-derived vegetation growth trend in spring over Siberia from 1982 to 2006. J. Health Polit. Policy Law 2011, 14, 41–55. [Google Scholar]
  32. Peng, S.; Chen, A.; Xu, L. Recent change of vegetation growth trend in China. Environ. Res. Lett. 2011, 6, 044027. [Google Scholar] [CrossRef]
  33. Holben, B. Characteristics of maximum-value composite images from temporal AVHRR data. Int. J. Remote Sens. 1986, 7, 1417–1434. [Google Scholar] [CrossRef] [Green Version]
  34. IPCC. Climate Change 2007. In The Physical Science Basis; Solomon, S., Qin, D., Manning, M., Eds.; Cambridge University Press: Cambridge, UK; New York, NY, USA, 2007. [Google Scholar]
  35. Liu, G.X.; Zhuo, Y.; Yu, F.M.; Jiang, C.L. Study on effect of drought based on time series on grassland vegetation in eastern Inner Mongolia. Adv. Mater. Res. 2012, 518–523. [Google Scholar] [CrossRef]
  36. Chatfield, C. The Analysis of Time Series: An Introduction; CRC Press: Florida, FL, USA, 1980. [Google Scholar]
  37. Jiang, L.; Jiapaer, G.; Bao, A. Vegetation dynamics and responses to climate change and human activities in Central Asia. Sci. Total Envrion. 2017, 967, 599–600. [Google Scholar] [CrossRef] [PubMed]
  38. Hurst, E.H. Long-term storage capacity of reservoirs. Trans. Am. Soc. Civ. Eng. 1951, 116, 70–808. [Google Scholar]
  39. Granero, M.A.S.; Segovia, J.E.T.; Pérez, J.G. Some comments on Hurst exponent and the long memory processes on capital markets. Physica A 2008, 387, 5543–5551. [Google Scholar] [CrossRef]
  40. Kendziorski, C.M.; Bassingthwaighte, J.B.; Tonellato, P.J. Evaluating maximum likelihood estimation methods to determine the Hurst coefficient. Physica A 1999, 273, 3–4. [Google Scholar] [CrossRef]
  41. Wang, X.L. Variation of Extreme Climate and Its Impact on NDVI in the Coastal Area of China. Master’s Thesis, Chinese Academy of Sciences, Yantai, China, 2017; pp. 1–195. [Google Scholar]
  42. Evans, J.; Geerken, R. Discrimination between climate and human-induced dryland degradation. J. Arid Environ. 2004, 57, 535–554. [Google Scholar] [CrossRef]
  43. Herrmann, S.M.; Anyamba, A.; Tucker, C.J. Recent trends in vegetation dynamics in the African Sahel and their relationship to climate. Glob. Environ. Chang. 2005, 15, 394–404. [Google Scholar] [CrossRef]
  44. Siqin, T.; Xiangqian, L.; Jiquan, Z.; Yuhai, B.; Yongbin, B.; Li, N.; Alu, S. Spatial and temporal variability in extreme temperature and precipitation events in Inner Mongolia (China) during 1960–2017. Sci. Total Environ. 2019, 649, 75–89. [Google Scholar]
  45. Chuai, X.W.; Huang, X.J.; Wang, W.J.; Bao, G. NDVI, temperature and precipitation changes and their relationships with different vegetation types during 1998–2007 in Inner Mongolia, China. Int. J. Climatol. 2012, 33, 1696–1706. [Google Scholar] [CrossRef] [Green Version]
  46. Braswell, B.; Schimel, D.; Linder, E.; Moore, B. The response of global terrestrial ecosystems to interannual temperature variability. Science 1997, 278, 870–873. [Google Scholar] [CrossRef]
  47. Davenport, M.; Nicholson, S. On the relation between rainfall and the normalized difference vegetation index for diverse vegetation types in East Africa. Int. J. Remote Sens. 1993, 14, 2369–2389. [Google Scholar] [CrossRef]
  48. Cui, L.; Shi, J.; Yang, Y.; Fan, W. Ten-day Response of vegetation NDVI to the Variations of Temperature and Precipitation in Eastern China. Acta Geograph. Sin. 2009, 64, 850–860. [Google Scholar]
Figure 1. Spatial distribution of annual precipitation and mean temperature (left), and different vegetation types and mean normalized difference vegetation index (NDVI) in Inner Mongolia during 1982–2015 (right).
Atmosphere 09 00394 g001
Figure 2. (a) Change trends of the mean NDVI in the growing season from1982 to 2015. Annual change trends in NDVI; (b) significant or insignificant (Z-value) and overall change trends of the mean NDVI classified into four types, namely: significant improvement, significant degradation, slight improvement, and slight degradation; (c) spatial distribution of the Hurst exponent; and (d) consistency of the mean NDVI in the growing season in Inner Mongolia from 1982 to 2015.
Atmosphere 09 00394 g002
Figure 3. Spatial distribution of extreme climate indices changes in different vegetation types during 1982–2015.
Atmosphere 09 00394 g003
Figure 4. Correlation between mean NDVI and extreme climate indices in different vegetation types during 1982–2015.
Atmosphere 09 00394 g004
Figure 5. Trends of mean monthly NDVI and extreme climate indices of growing seasons in different vegetation types during 1982–2015.
Atmosphere 09 00394 g005
Figure 6. Correlation between monthly NDVI of growing season and extreme climatic indicators from the same-months by different vegetation types during 1982–2015. ** and * indicate p < 0.01 and p < 0.05, respectively.
Atmosphere 09 00394 g006
Figure 7. Correlation between monthly NDVI of growing season and extreme climatic indicators from all previous months by different vegetation types during 1982–2015. ** and * indicate p < 0.01 and p < 0.05, respectively.
Atmosphere 09 00394 g007
Figure 8. Residual trends of NDVI in Inner Mongolia during 1982–2015, and the location of the significant changes of NDVI residuals in Google map.
Atmosphere 09 00394 g008
Table 1. Extreme climate indices defined by RClimDexV3 (IPCC, 2007).
IndicatorDescriptive NameDefinitionsUnit
RX1DMax one-day precipitation amountMonthly maximum one-day precipitationmm
RX5DMax five-day precipitation amountMonthly maximum consecutive five-day precipitationmm
R95PVery wet daysAnnual total PRCP when RR >99th percentilemm
R10Number of heavy precipitation daysAnnual count of days when PRCP ≥10 mmDays
SDIISimple daily intensity indexAnnual total precipitation divided by the number of wet days (defined as PRCP ≥1.0 mm) in the yearmm/day
CDDConsecutive dry daysMaximum number of consecutive days with RR <1 mmDays
CWDConsecutive wet daysMaximum number of consecutive days with RR ≥1 mmDays
PRCPTOTAnnual total wet-day precipitationAnnual total PRCP in wet days (RR ≥ 1 mm)mm
SU25Summer daysAnnual count when TX (daily maximum) >25 °CDays
FD0Frost daysAnnual count when TN (daily minimum) <0 °CDays
TN90PWarm nightsPercentage of days when TN >90th percentileDays
TX90PWarm daysPercentage of days when TX >90th percentileDays
TNnMin TminMonthly minimum value of daily minimum temp°C
TXxMax TmaxMonthly maximum value of daily maximum temp°C
Table 2. Vegetation change trends and division of the variation types.
SNDVIZNDVI TrendHVariation Types
≥0.001≥1.96Significant improvement>0.5Consistent and significant improvement
0.000~0.0011.96~1.96Slight improvement>0.5Consistent and slight improvement
≥0.00011.96~1.96---<0.5Inconsistent and changed from degradation to improvement
0.0001~0.00011.96~1.96Stable or no-vegetation---Stable or no-vegetation area
≤−0.0001−1.96~1.96---<0.5Inconsistent and changed from improvement to degradation
−0.001~0.0001−1.96~1.96Slight degradation>0.5Consistent and slight degradation
<−0.001<−1.96Significant degradation>0.5Consistent and significant degradation

