Article

A Two-Decade Anthropogenic and Biogenic Isoprene Emissions Study in a London Urban Background and a London Urban Traffic Site

by
M. Anwar H. Khan
1,
Billie-Louise Schlich
1,
Michael E. Jenkin
2,
Beth M. A. Shallcross
3,
Katherine Moseley
1,
Catherine Walker
1,
William C. Morris
1,
Richard G. Derwent
4,
Carl J. Percival
5 and
Dudley E. Shallcross
1,6,*
1
Biogeochemistry Research Centre, School of Chemistry, University of Bristol, Cantock’s Close, Bristol BS8 1TS, UK
2
Atmospheric Chemistry Services, Okehampton, Devon EX20 4QB, UK
3
School of Pharmacy, The University of Manchester, Oxford Road, Manchester M13 9PL, UK
4
Rdscientific, Newbury, Berkshire RG14 6LH, UK
5
Jet Propulsion Laboratory, California Institute of Technology, 4800 Oak Grove Dr, Pasadena, CA 91109, USA
6
Department of Chemistry, University of Western Cape, Bellville 7535, South Africa
*
Author to whom correspondence should be addressed.
Atmosphere 2018, 9(10), 387; https://doi.org/10.3390/atmos9100387
Submission received: 24 July 2018 / Revised: 30 August 2018 / Accepted: 29 September 2018 / Published: 3 October 2018
(This article belongs to the Special Issue Biogenic Emissions to the Atmosphere)

Abstract

:
A relationship between isoprene and 1,3-butadiene mixing ratios was established to separate the anthropogenic and biogenic fractions of the measured isoprene in London air in both urban background (Eltham) and urban traffic (Marylebone Road) areas over two decades (1997–2017). The average daytime biogenic isoprene mixing ratios over this period reached 0.09 ± 0.04 ppb (Marylebone Road) and 0.11 ± 0.06 ppb (Eltham) between the period of 6:00 to 20:00 local standard time, contributing 40 and 75% of the total daytime isoprene mixing ratios. The average summertime biogenic isoprene mixing ratios for 1997–2017 are found to be 0.13 ± 0.02 and 0.15 ± 0.04 ppb which contribute 50 and 90% of the total summertime isoprene mixing ratios for Marylebone Road and Eltham, respectively. Significant anthropogenic isoprene mixing ratios are found during night-time (0.11 ± 0.04 ppb) and winter months (0.14 ± 0.01 ppb) at Marylebone Road. During high-temperature and high-pollution events (high ozone) there is a suggestion that ozone itself may be directly responsible for some of the isoprene emission. By observing the positive correlation between biogenic isoprene levels with temperature, photosynthetically active radiation and ozone mixing ratios during heatwave periods, the Cobb-Douglas production function was used to obtain a better understanding of the abiotic factors that stimulate isoprene emission from plants. Other reasons for a correlation between ozone and isoprene are discussed. The long-term effects of urban stressors on vegetation were also observed, with biogenic isoprene mixing ratios on Marylebone Road dropping over a 20-year period regardless of the sustained biomass levels.

1. Introduction

Isoprene emissions of 600 Tg year−1 originate from biogenic sources in the main, which can contribute a larger fraction of the total global volatile organic hydrocarbons (VOCs) [1]. Isoprene is also emitted from vehicular exhaust [2,3,4,5,6] and human exhalation [7,8,9,10], but these emissions are currently estimated to contribute only approximately 15% (~100 Tg year−1) of the total global isoprene emissions [11,12]. In urban areas, the isoprene concentrations can build-up with a large proportion being of anthropogenic origin but with some biogenic emission sources [13,14,15,16]. With populations rising, cities expanding and an increase in global industry, the anthropogenic percentage contribution to global isoprene is expected to increase. The impact of anthropogenic isoprene emissions in terms of reactivity and life-time can be significant at night and in winter. The boundary layer height is lower at night and in winter than that at day and in summer, thus the anthropogenic isoprene mixing ratios in night and winter-time are higher because the same level of emissions is being mixed into smaller volume of air. However, the anthropogenic contribution to isoprene concentration in specific regions such as Europe may have decreased during the last 20 years because of the imposed legislation on VOC emissions especially from motor vehicles [17]. von Schneidemesser et al. found a significant fraction of biogenic isoprene in London and Paris urban sites during their study on the importance of isoprene for ozone formation through the contribution to OH reactivity [14]. Thus, the biogenic isoprene emissions have become more important nowadays in urban areas especially in summer months as these emissions are strongly dependent on light exposure [18,19] and cannot be controlled.
A better understanding of isoprene’s interaction with the urban atmosphere is required, as these areas where much of the world’s population live may have high levels of isoprene. In urban areas (i.e., high NOx environments) where the anthropogenic isoprene emissions are non-negligible, the oxidation of isoprene can contribute to the production of ozone [20,21] and secondary organic aerosol [22,23,24]. Incidence of these species in the troposphere pose serious health concerns and negative environmental impacts. Ozone has been shown to damage the photosynthetic apparatus in plants, with an increase in external isoprene concentrations counteracting the detrimental effect [25,26]. If the triggers to isoprene release are known, conclusions could be drawn about how the changing atmosphere could be damaging to plants, and in turn humans. Thus, a better understanding of the emission estimates of isoprene from biogenic sources would be important in terms of environmental impact examinations. The biogenic isoprene emission estimates which form the basis of representations in models are reported to be highly uncertain by a factor of about 4 [12]. Thus, the separation of the anthropogenic and biogenic isoprene emissions and their temporal and spatial variation will be valuable to revise the estimates of isoprene emissions rates in urban areas.
1,3-butadiene and its 2-methyl analogue, isoprene, are structurally very similar, though differ in their emission sources and chemical risks. Both possess a threat to health in their subsequent photochemical reaction products, but only 1,3-butadiene is considered a priority hazardous air pollutant in its unreacted form [27]. 1,3-butadiene is a product of incomplete combustion from both natural sources (such as forest fires) and human activity, with city-wide levels being attributed to vehicle exhaust emissions [28]. Isoprene too has synthetic combustion sources, the significance of which increases greatly over the winter time and in urban areas [4]. 1,3-butadiene is widely used as a vehicle exhaust tracer which is suitable to act as a tracer for anthropogenic isoprene emissions. The relationship between anthropogenic isoprene and 1,3-butadiene emissions has been investigated in many previous data analyses, with molar ratio values reported of 0.4–0.5 between the two respectively [3,4]. The present work is to assess the anthropogenic and biogenic contribution to measured isoprene mixing ratios and their seasonal, diurnal, and long-term variations in the urban background and traffic sites of UK over two decades (1997–2017).

2. Experimental

2.1. Measurement Locations

The sources of the 1,3-butadiene, isoprene, and ozone hourly mass concentration data (in μg m−3) for the years 1997 to 2017 are measurements made as part of Department for Environment, Food and Rural Affairs (Defra’s) Automatic Urban and Rural Network (AURN) which are available in the National Air Quality Information Archive (http://uk-air.defra.gov.uk/). In accordance with European Commission (EC) reporting procedures, the data are archived in μg m−3 concentration units, which are derived from the measured mixing ratios for assumed reference ambient conditions of 20 °C and 101.3 kPa, using the conversion factors 1 ppb = 2.83 μg m−3 for isoprene, 1 ppb = 2.25 μg m−3 for 1,3-butadiene and 1 ppb = 2.00 μg m−3 for ozone. For the present analysis, the data were converted into ppb (parts per billion) mixing ratios. Marylebone Road and Eltham, two contrasting locations in London [14] were chosen as the measurement sites for the London urban isoprene study. London Marylebone Road can be treated as an urban traffic site and a strong anthropogenic contribution to total isoprene is expected here, as the site sits on a busy road which carries upwards of 70,000 vehicles on it per day [29,30]. The proximity of this monitoring station to two of London’s larger public parks, Regent’s Park and Hyde Park, can make a large contribution from biogenic isoprene sources. London Eltham can be treated as a suburban background site of London. This site is situated in the London Borough of Greenwich and surrounded by several parks and 25 m away from major roads, leads to a significant contribution from biogenic isoprene sources. The extensive hourly VOC and ozone data are available from these two monitoring sites which can be regarded as part of the air quality networks in the UK. The temperature and photosynthetically active radiation (PAR) data was taken from the London Air Quality Network-King’s College London (https://www.londonair.org.uk/LondonAir/) for the whole measurement period.

2.2. In-Situ Measurement Technique

At UK Automatic Urban and Rural Network sites, the instrument used to measure isoprene and 1,3-butadiene was a Chrompack CP9000 Volatile Organic Compounds Air Analyser (VOCAIR) system, a Gas Chromatography (GC) fitted with an automated thermos-desorption/cryogenic trapping system. A calibration standard used was supplied by the National Physical Laboratory (NPL). The detailed description of the network, the VOCAIR system and the data handling and analysis can be found in Dollard et al. [31]. The ozone data was also collected from both sites which was measured by ultraviolet photometry. The average uncertainty of the dataset for the species and sites was around 10%. There are some missing data in the National Air Quality Information Archive (53% isoprene and 77% 1,3-butadiene hourly data for Marylebone Road and 64% isoprene and 72% 1,3-butadiene hourly data for Eltham are available over 1997–2017) because of the instrument malfunctioning, instrumental maintenance, and routine calibration. There is random data missing at the Marylebone Road site, but a more consistent data series are found for Eltham except the missing data from January 2001 to October 2003.

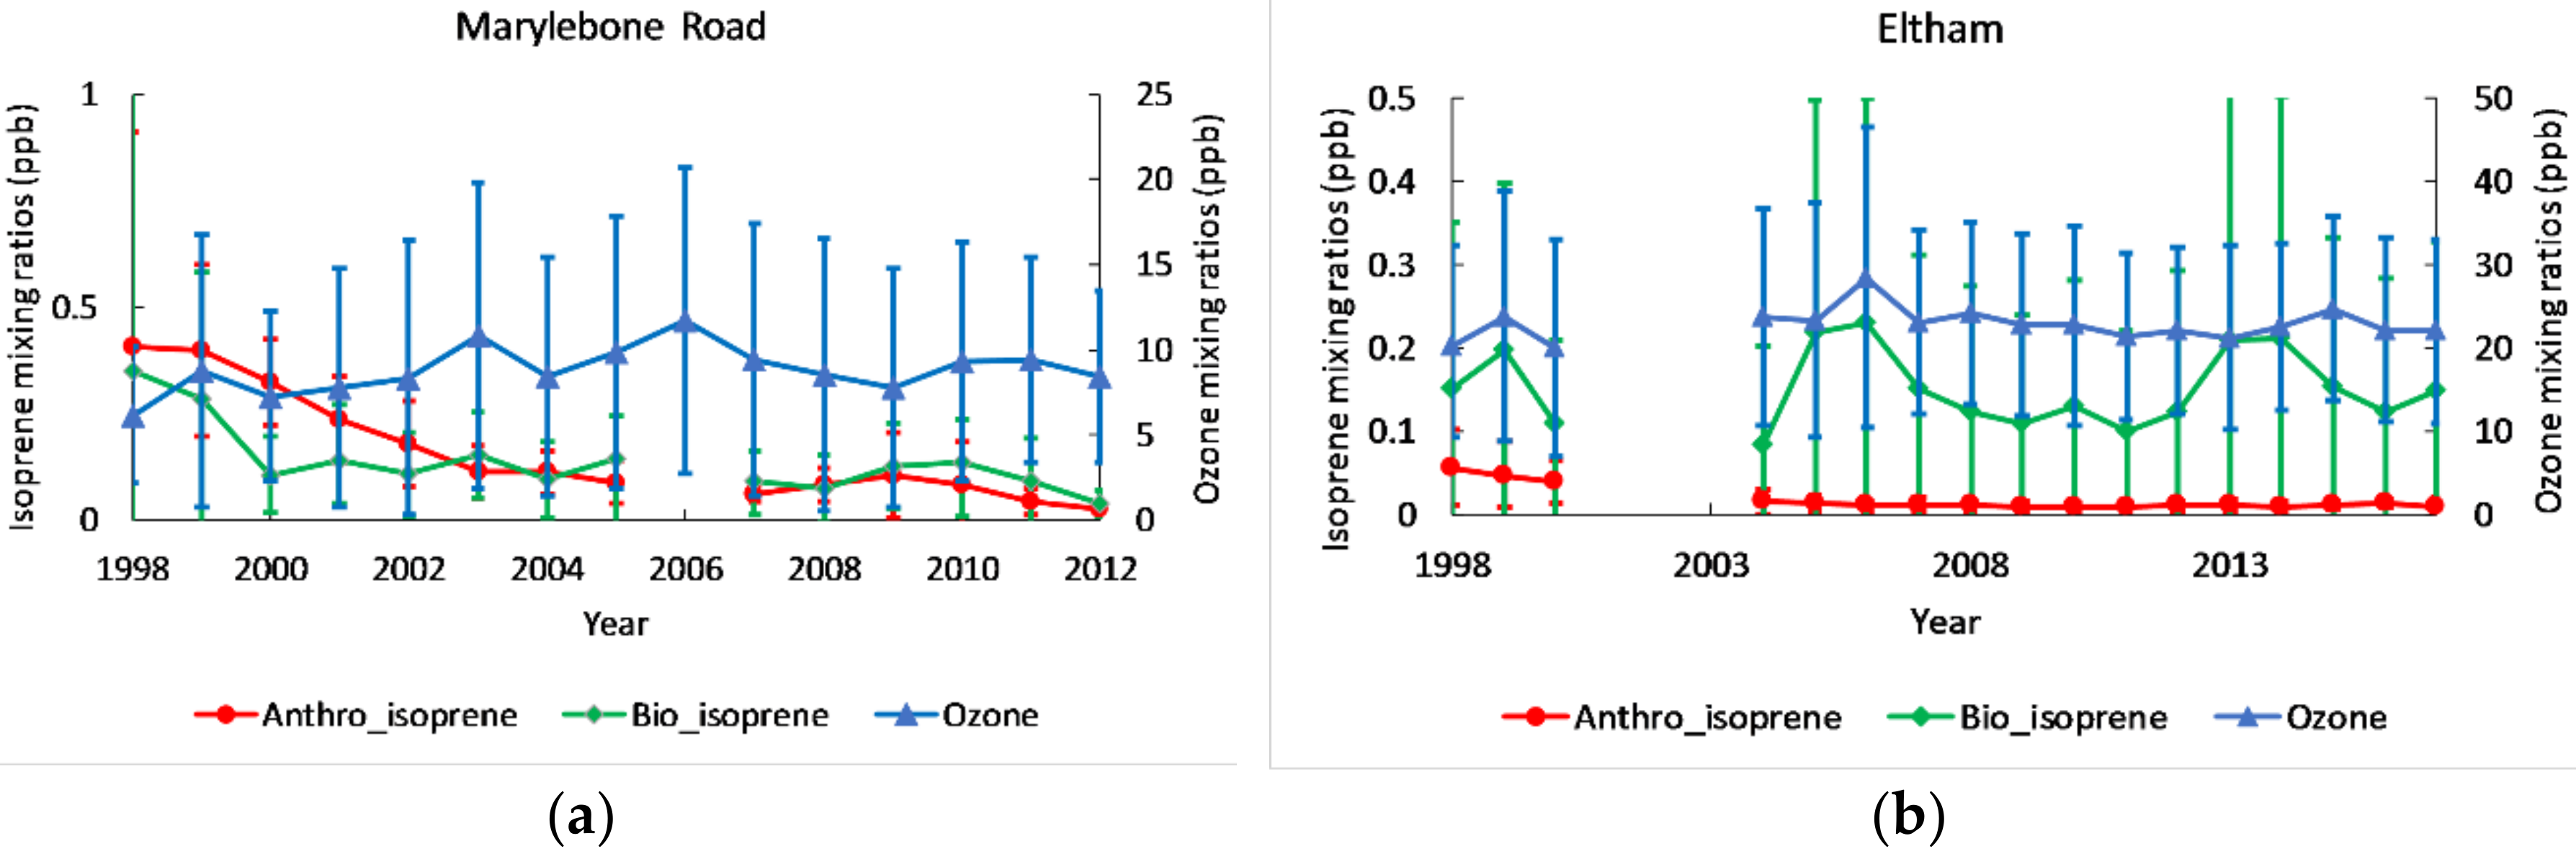
2.3. Method for Distinguishing Biogenic and Anthropogenic Isoprene

Having identified a convenient tracer, 1,3-butadiene for anthropogenic isoprene, the molar ratio between the measured isoprene and 1,3-butadiene mixing ratios at the measuring site in the winter time (when the biogenic emission is negligible) is treated as the ratio between anthropogenic isoprene and 1,3-butadiene. Using this ratio for the winter preceding the summer studied, it is possible to separate the total isoprene measured as:
  [ isoprene ] a n t h r o = x [ 1 , 3 butadiene ]  
  [ isoprene ] b i o = [ isoprene ] [ isoprene ] a n t h r o  
where [isoprene]anthro is the mixing ratios of anthropogenic isoprene, x is the molar ratio between 1,3-butadiene and isoprene calculated for the winter months, [1,3-butadiene] is the mixing ratios of 1,3-butadiene, [isoprene]bio is the mixing ratios of biogenic isoprene and [isoprene] is the mixing ratios of total isoprene.
Using Equation (1), the exploration into the exact ratio between 1,3-butadiene and isoprene year by year was conducted. These molar ratio values were calculated over the winter months preceding the year, for example for the year 2003, the ratio was found using the ratio of the 3-month average [isoprene]/3-month average [1,3-butadiene] observed in December 2002 to February 2003. Over these winter months it is assumed that the biogenic isoprene emission potential is zero [3,32]. This is an appropriate assumption to make as at the Harwell observation point, a rural site only 50 miles away from London Marylebone, there were negligible isoprene values experienced over the same winter months; frequently measuring zero values or levels of an order of magnitude smaller than those experienced in the London site.

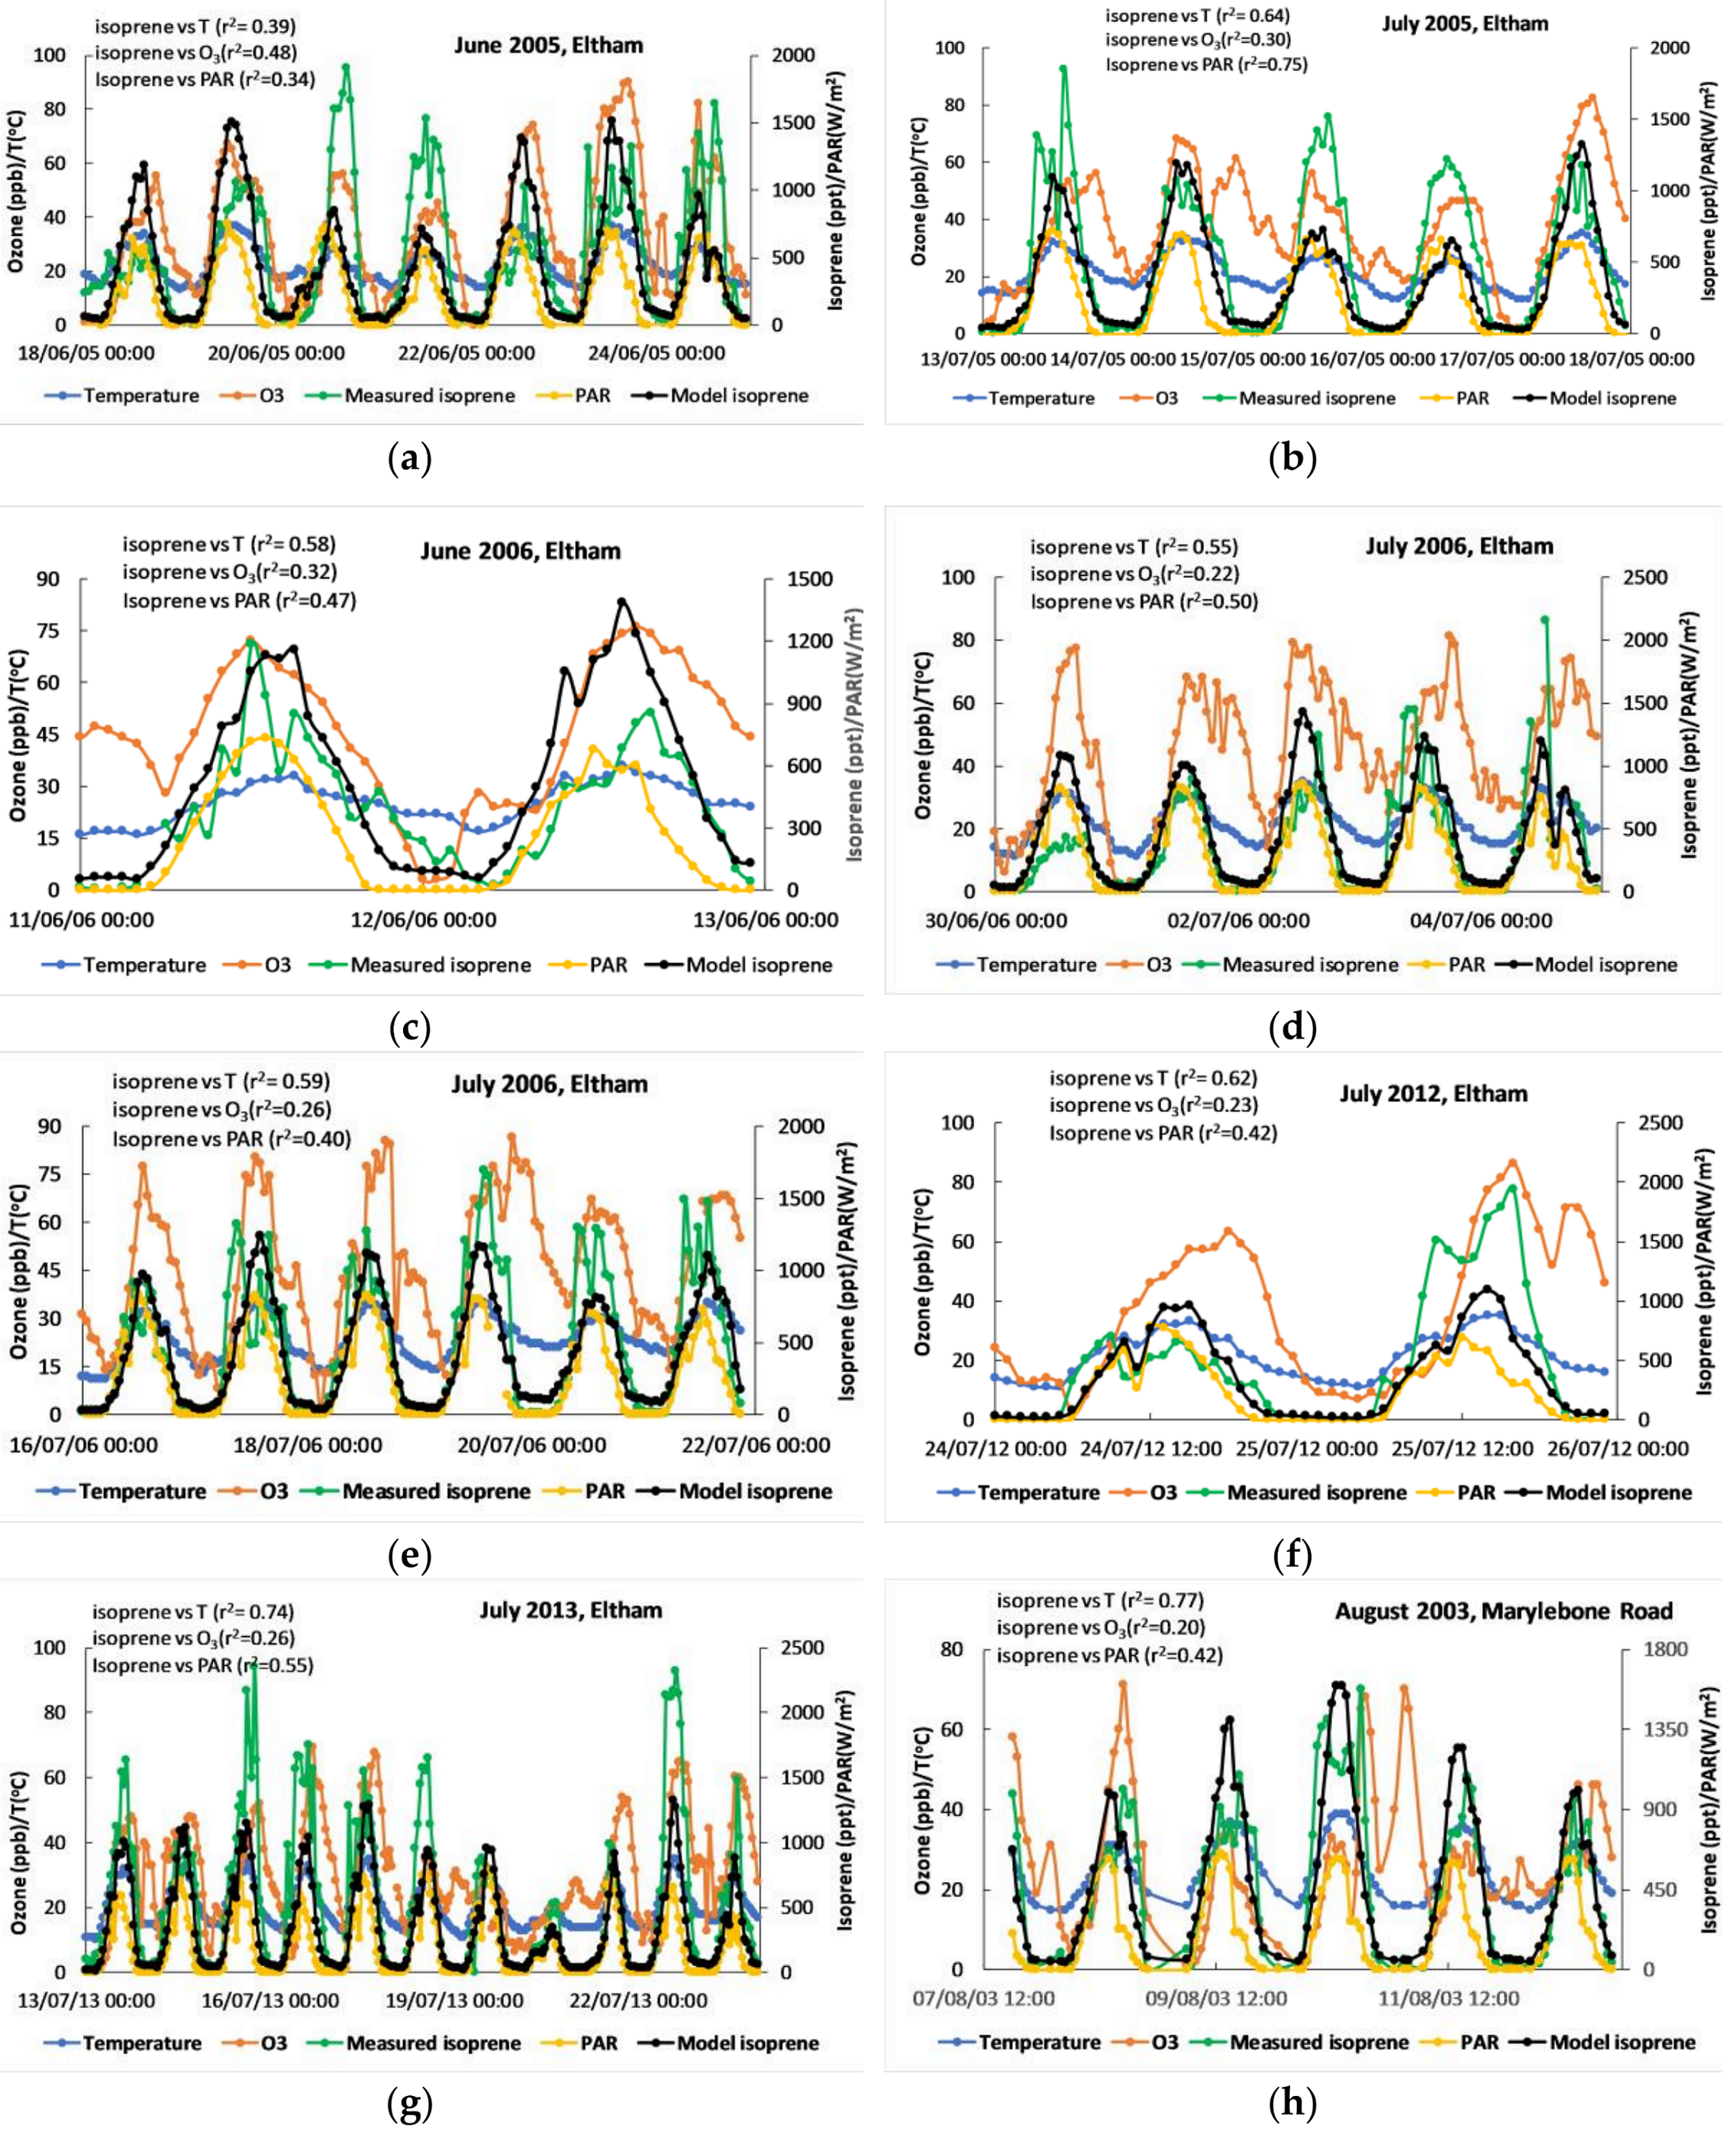
2.4. Modelling Biogenic Isoprene Emissions Versus Temperature, PAR and Ozone

The effect of surface temperature, PAR and ozone was modelled based on the Cobb-Douglas production function [33] which includes damage of plants (i.e., isoprene emissions from plants) due to climate change as a function of surface temperature, PAR, and ozone.
[biogenic isoprene] = f (A, T, P, O)
= ATαPβOγ
Where A is the constant coefficient, T is the surface temperature, P is the PAR, O is the ozone mixing ratios, α, β and γ are the regression coefficients of temperature, PAR, and ozone, respectively. Equation (3) was estimated by calculating A, α, β and γ using regression analysis.

3. Results and Discussion

The seasonal variations in the mixing ratios of 1,3-butadiene and isoprene over the period of 1997–2017 for both London Marylebone Road and Eltham (Figure 1) show very different trends with an isoprene maximum in summer months (June-July-August) and 1,3-butadiene maximum in winter months (December-January-February). The molar ratio of isoprene and 1,3-butadiene over winter months confirm a limiting anthropogenic ratio of around 0.4 for both urban sites and the variable excess contribution especially in the summer months is attributed to background biogenic sources. The isoprene/1,3-butadiene molar ratios in autumn (September-October-November) and spring (March-April-May) are higher than winter months for both Marylebone Road (0.54 ± 0.12 in spring and 0.57 ± 0.10 in autumn) and Eltham (0.87 ± 0.34 in spring and 1.84 ± 1.76 in autumn). Moreover, the summer months’ isoprene/1,3-butadiene molar ratios are found to be one order higher for the Eltham site (8.2 ± 2.5) than that for the Marylebone Road site (0.92 ± 0.09), this is due to the higher local anthropogenic emissions at Marylebone Road. The separation between biogenic and anthropogenic isoprene mixing ratios for the Marylebone Road and Eltham sites (Figure 1) show that the contribution of anthropogenic isoprene mixing ratios is close to 100% (0.14 ± 0.01 ppb for Marylebone Road and 0.045 ± 0.003 ppb for Eltham) with insignificant biogenic contributions during winter months. However, in the summer months when photosynthesis rates are high, the anthropogenic isoprene mixing ratios are lowest and the biogenic mixing ratios of isoprene emitted from nearby vegetation outweigh it (Figure 1). The anthropogenic isoprene mixing ratios in Marylebone Road (0.13 ± 0.003 ppb) are about a factor of 6 higher than that in Eltham (0.02 ± 0.002 ppb) which lead to the significance of their contributions of 50 and 10% to total summer isoprene mixing ratios. The average summertime biogenic isoprene mixing ratios for 1997–2017 are found to be similar for Marylebone Road (0.13 ± 0.02 ppb) and Eltham (0.15 ± 0.04 ppb), suggesting that the biogenic isoprene source is probably having similar impacts at both sites. For Marylebone Road, there are large potential sources of biogenic isoprene upwind at the large parts of Regents park and Hyde park that provide diffuse biogenic sources. However, the Eltham site is in the park and experiences more direct biogenic emissions resulting in increased mixing ratios of biogenic isoprene than that in Marylebone Road during summer months.
The characteristic molar ratios of isoprene and 1,3-butadiene for the winter months of each year are shown in Figure 2. The average ratio values for Marylebone Road and Eltham for the time period of 1997–2017 are found to be 0.47 ± 0.13 and 0.46 ± 0.15, respectively, which is supported by the correlation plots (see Figure S1 in the supplementary information) between the mixing ratios of 1,3-butadiene and isoprene for the winter months of the whole data series (slope = 0.47 and r2 = 0.89 for Marylebone Road, slope = 0.47 and r2 = 0.92 for Eltham). The values are in reasonable agreement with the previous studies [2,3,4,14,34,35,36,37]. Although isoprene/1.3-butadiene molar ratios of London Marylebone Road and Eltham sites for some of the years are very consistent with the literature, the averages for some years are found to be higher than expected. The surprisingly lower ratio value (0.10 ± 0.08) for Eltham in 2016 was found because of many data points with isoprene concentrations close to the detection limit. These values would amplify any small offset there might be in the absolute values leading to a systematic error in the ratio.
The molar ratios of isoprene and 1,3-butadiene clearly demonstrate seasonal (Figure 1) and diurnal (Figure 3) variations in the contribution of biogenic emissions to isoprene concentrations at London Marylebone Road and Eltham sites. The diurnal plots of isoprene mixing ratios for the whole data series (1997–2017) show that the biogenic contribution is at a minimum during the night-time and maximum in daytime, with a 1- to 2-order increase in mixing ratios in the middle of the day (Figure 3). The anthropogenic mixing ratios reach their maximum during the morning and in the evening hours which agrees with the traffic peaks at these urban sites [14]. The trend is more significant for the Marylebone Road site as it is an urban traffic site, thus the contribution of anthropogenic isoprene mixing ratios is much higher than that of biogenic mixing ratios during the traffic hours. The average daytime (assuming 6:00 to 20:00 LST) biogenic isoprene mixing ratios are found to be 0.09 ± 0.04 and 0.11 ± 0.06 ppb which contributes 40 and 75% to the total daytime isoprene mixing ratios for Marylebone Road and Eltham sites, respectively. Compared to daytime anthropogenic isoprene mixing ratios (0.14 ± 0.03 ppb for Marylebone Road and 0.03 ± 0.01 ppb for Eltham), the night-time anthropogenic isoprene mixing ratios are significant, reaching 0.11 ± 0.04 and 0.03 ± 0.01 ppb for Marylebone Road and Eltham, respectively.
The closer inspection of the hourly biogenic isoprene mixing ratios shows a prominent peak concentration of ~2 ppb on the 10th of August 2003, with elevated levels surrounding this date for approximately 3 days either side. On this day, a heatwave with temperatures of about 37–38 °C recorded over a widespread region across south-east England, this demonstrates a dominance of the background biogenic contribution under these favorable conditions, even at a busy roadside location of Marylebone Road. This sparked interest in the abiotic factors and stressors such as temperature that lead to isoprene release. The analysis of long-term VOCs measurement at an urban site in Lille, northern France also showed that the sources of isoprene can be both anthropogenic (e.g., motor vehicle exhaust) particularly in winter and biogenic (e.g., vegetation) particularly in summer [38]. A positive correlation between temperature and ozone concentrations for cities in France and London are reported during the heatwave period in mid-August of 2003 [39,40], the increased ozone levels are attributed to enhanced biogenic emissions, accelerated photochemical reaction rates associated with warmer temperature, stagnation of air masses and thermal decomposition of peroxyacetylnitrate (PAN) [41,42,43].
Having observed the effect of the 2003 heatwave on a major increase in biogenic emissions, we made the correlation plots between biogenic/anthropogenic isoprene mixing ratios, temperature, and ozone for both urban sites (Figure 4). The secondary variable plot shows that the anthropogenic isoprene mixing ratios have no correlation with either ozone or temperature because the anthropogenic emissions are accompanied by local NOx which leads to local removal of ozone through oxidant partitioning and night-time titration [44] and the higher ambient temperature is unlikely to lead to increased emissions from vehicular sources of the VOCs of interest in this study. However, the secondary variable plot shows the positive correlations between biogenic isoprene mixing ratios with temperature and ozone (r2 = 0.6 with temperature and r2 = 0.3 with ozone for Eltham and r2 = 0.3 with temperature and r2 = 0.1 with ozone for Marylebone Road) for the whole set of data series.
The inspection of the isoprene mixing ratios during high surface temperatures at UK urban sites reveals that the biogenic isoprene mixing ratios increase significantly with increasing temperature (Figure 5). The ozone mixing ratios also increase in a similar fashion as biogenic isoprene mixing ratios. We averaged the mixing ratios of ozone and biogenic isoprene for temperature ranges of 31–36 °C and 26–30 °C and found that ~5 °C increase in temperature results in 40% (~0.30 ppb) and 94% (~0.29 ppb) increment of isoprene mixing ratios and 30% (~16.0 ppb) and 40% (~5.9 ppb) increment of ozone mixing ratios for Eltham and Marylebone Road, respectively. The results are very consistent with the model simulation results of Vieno et al. [45] who found a doubled biogenic isoprene emission and an increment of O3 by up to 10 ppb due to 5 °C increase in surface temperature during the heatwave periods. The missing isoprene data at the Eltham site during the strongest heatwave period (August 2003) in UK give limited data for this analysis for Eltham.
Further investigation of the biogenic isoprene emissions due to the environmental stresses (such as high temperature when atmospheric O3 builds up), leads to time-series plots of the biogenic isoprene and ozone mixing ratios and temperature for a series of heatwave periods are shown in Figure 6. Isoprene emission is unique among the biogenic hydrocarbon emissions because of its direct relationship to photosynthetic activity of plants [46], thus the PAR data was also included in the time series plots (Figure 6). The trends of the variation of biogenic isoprene mixing ratios, temperature, PAR, and ozone mixing ratios are very similar with moderate to good relationships between them (r2 = 0.39–0.77 for isoprene vs temperature, r2 = 0.22–0.48 for isoprene vs ozone, r2 = 0.34–0.75 for isoprene vs PAR) (See Figure 6). These relationships suggest that the increased biogenic emissions of isoprene (and probably other unmeasured biogenic hydrocarbons, e.g., monoterpenes) at higher temperature and PAR are expected to play a role in regional and local-scale urban photo-oxidation processes [47], and to have contributed to the increased levels of ozone monitored during the heatwave period [48]. However, the increase in temperature, PAR, and ozone (all act as plant stressors) can also favor isoprene-emitting species over non-emitting species because of the protective role of isoprene on these stressors [49,50,51,52,53,54]. During heatwave periods and high-pollution events (high ozone) for both urban areas, it can be suggested that the temperature and PAR can increase isoprene emissions leading to increased ozone production which can also act as plant stressors and stimulate isoprene release.
Considering, temperature, PAR and ozone as plant stressors, the Cobb-Douglas model reveals a range of constant coefficient, A, and regression coefficients, α, β and γ (See Table S1 in supplementary information) for the time-series plots shown in Figure 6. The averaging of these coefficient values gives a best estimate of biogenic isoprene mixing ratios as a function of temperature, PAR, and ozone as:
biogenic isoprene mixing ratios (in ppt)
= (0.11 ± 0.12) × (T)2.16 ± 0.64 × (PAR)0.23 ± 0.07 × (Ozone)0.06 ± 0.02
The biogenic isoprene mixing ratios calculated using equation (4) show a good agreement (r2 > 0.7) with the measured biogenic isoprene mixing ratios (see Figure 6) for the heatwave periods. A reasonable agreement between calculated and measured biogenic isoprene mixing ratios is found for the whole data series of Eltham (r2 = 0.55) and Marylebone Road (r2 = 0.25) (see Figure S2 in the supplementary information).
Having separated the biogenic isoprene emissions from the anthropogenic for the summer months of every year from 1997 to 2017, these data were compiled into one plot to assess the changes in concentration and trends for the long-term (Figure 7). Only summer months data are included, as biogenic emissions are negligible over winter months, and a substantial ratio between anthropogenic isoprene and 1,3-butadiene cannot be accurately extracted during Autumn and Spring. Trends from Figure 7 show that summer anthropogenic isoprene levels have decreased from 0.41 ppb in 1998 to 0.03 ppb in 2012 for Marylebone Road and 0.06 ppb in 1998 to 0.01 ppb in 2017 for Eltham. The anthropogenic isoprene trends can be explained in terms of reductions in the emissions of anthropogenic volatile organic compounds (VOCs) by the government legislation and policies, which have been driven, in particular, by Europe-wide controls on the emissions from petrol-engine motor vehicles through the fitting of catalytic convertors to reduce exhaust emissions, and canisters to reduce petrol evaporation emissions [31]. There is a significant fall in yearly anthropogenic isoprene concentrations from 1998 onwards. This can be attributed to the stricter emission limits required to pass Ministry of Transport (MOT) testing from 1998. 6% of the 22 million light duty vehicles failed MOT inspection (during 1998/1999) due to excessive emissions [55], removing these vehicles that contributed a disproportionally large amount of emissions would have had a big effect on the overall vehicular combustion emissions of isoprene. The decline in the anthropogenic contribution from 1998 to 2006, which is 18% and 16% per year on average over this ten-year period for Marylebone Road and Eltham, respectively. The reduction of anthropogenic isoprene for Eltham site after 2008 is insignificant, but the reduction is pronounced in Marylebone Road from 2009 to 2017 (9% per year) which could be due to a change in composition of the vehicle fleet as a direct consequence of the Low Emission Zone (LEZ) legislature, already having been shown to have a positive effect on air quality [56]. However, these data for biogenic isoprene mixing ratios especially for Marylebone Road show a decreasing trend over time (0.35 ppb in 1998 and 0.04 ppb in 2012), which is less expected. There are no significant tree planting or tree felling schemes that have taken place over the years (Personal communication, The Royal Parks, https://www.royalparks.org.uk), so a reduction in plant number was not the reason for this decrease in biogenic emissions. Urban plants come under stress from many factors such as very high ozone concentrations [51,52] or drought [57] that could lead to decreased foliage density or wilting and hence decreased biomass and ability to emit isoprene. During drought conditions with decreasing soil water levels, an increase in isoprene emissions are observed [58]. Plants can use reserves of carbon in the form of sugars and starch to support this sudden increase in emissions, but over time as conditions deteriorate and photosynthesis rates decreases, isoprene emissions can also plummet [59]. When under such stress, energy and carbon priorities within the plant’s metabolism may change to focus on other necessary processes, therefore perhaps an unidentified affliction is the reason for this trend.

4. Conclusions

The anthropogenic isoprene emissions were separated from biogenic isoprene in an urban data study focusing on the London Marylebone Road and Eltham air quality sites using the 20-years (1997–2017) UK Air Quality isoprene and 1,3-butadiene data. To separate the isoprene sources, a ratio between anthropogenic isoprene and 1,3-butadiene was established with an average value of 0.46–0.47, in reasonable agreement with the literature. The average daytime biogenic isoprene concentrations are found to be 0.09 ± 0.04 ppb (Marylebone Road) and 0.11 ± 0.06 ppb (Eltham) and the average summertime biogenic isoprene concentrations are 0.13 ± 0.02 ppb (Marylebone Road) and 0.15 ± 0.04 ppb (Eltham). By observing possible causal factors on biogenic isoprene emissions, conclusions could be drawn in relation to the abiotic stressors (high surface temperature, PAR, and ozone induced oxidative stress) that stimulate isoprene release which was consistent for both urban sites. The presence of high concentrations of ozone may lead to release of the hydrocarbon from plants, and in turn isoprene’s atmospheric chemistry will respond by decreasing the harmful concentrations of ozone located near the plant. These relationships attracted wide speculation in the literature, although the exact causes of isoprene emissions from plants are still debated as many proposed mechanisms are not considered substantial. More in depth tests would need to be conducted to demonstrate a cause and effect of the relationship. However, there is strong evidence from some recent studies [60,61] that higher ozone can trigger a biogenic emission including isoprene, monoterpenes and sesquiterpenes response. If other biogenic VOCs (e.g., monoterpenes and sesquiterpenes) can be measured in both urban sites (which are currently absent in Defra’s AURN data series), a change in emission level and type at the same time can be observed which may support the case. The two decades trend showing the decrease in both anthropogenic and biogenic isoprene in London Marylebone Road. The reasons for the reduction in biogenic emissions may be a result of decreased biomass or a decline in plant health which highlights the importance of further study into plant stressors in urban environments.
There is no doubt that further work is required to confirm the relationship between biogenic isoprene emissions and ozone under high ozone conditions. The high temperature would lead to elevated isoprene emissions and at the same time accelerate photochemical production of ozone, the ‘heatwave’ conditions may produce other factors (e.g., herbivores) that correlate with both ozone and isoprene, but the correlation is not connected and other physical parameters such as wind speed and dispersion may be contributory factors. However, studies highlighted in this work would support the hypothesis suggested in this work and if true would have important implications for urban photochemistry under these extreme conditions.

Supplementary Materials

The following are available online at https://www.mdpi.com/2073-4433/9/10/387/s1, Figure S1: The correlation plots between isoprene and 1,3-butadiene during winter months of the period 1997–2017, (a) Marylebone Road, (b) Eltham, Figure S2: The relationship between calculated and measured biogenic isoprene mixing ratios (a) Marylebone Road, (b) Eltham, Table S1: Cobb-Douglas model analysis results for a series of heatwave periods.

Author Contributions

Dudley E. Shallcross, M. Anwar H. Khan and Carl J. Percival conceived and designed the study; Billie-Louise Schlich, M. Anwar H. Khan, Beth M. A. Shallcross, Katherine Moseley, Catherine Walker and William C. Morris analyzed the data; M. Anwar H. Khan and Billie-Louise Schlich wrote the paper; Dudley E. Shallcross, Michael E. Jenkin and Richard G. Derwent helped with discussion to improve the paper.

Funding

We thank NERC (grant code-NE/K004905/1) and Bristol ChemLabS under whose auspices various aspects of this work was funded.

Acknowledgments

We thank the Department for Environment, Food and Rural Affairs (Defra) and London Air Quality Network-King’s College London for supporting UK monitoring network and data.

Conflicts of Interest

The authors declare no conflict of interest.

References

  1. Guenther, A.; Karl, T.; Harley, P.; Wiedinmyer, C.; Palmer, P.I.; Geron, C. Estimates of global terrestrial isoprene emissions using MEGAN (Model of Emissions of Gases and Aerosols from Nature). Atmos. Chem. Phys. 2006, 6, 3181–3210. [Google Scholar] [CrossRef] [Green Version]
  2. Borbon, A.; Fontaine, H.; Veillerot, M.; Locoge, N.; Galloo, J.C.; Guillermo, R. An investigation into the traffic-related fraction of isoprene at an urban location. Atmos. Environ. 2001, 35, 3749–3760. [Google Scholar] [CrossRef]
  3. Reimann, S.; Pierluigi, C.; Hofer, P. The anthropogenic fraction contribution to isoprene concentrations in a rural atmosphere. Atmos. Environ. 2000, 34, 109–115. [Google Scholar] [CrossRef]
  4. Derwent, R.G.; Middleton, D.R.; Field, R.A.; Golgstone, M.E.L.; Lester, J.N.; Perry, R. Analysis and interpretation of air quality data from an urban roadside location in central London over the period from July 1991 to July 1992. Atmos. Environ. 1995, 29, 923–946. [Google Scholar] [CrossRef]
  5. Derwent, R.G.; Davies, T.J.; Delaney, M.; Dollard, G.J.; Field, R.A.; Dumitrean, P.; Nason, P.D.; Jones, B.M.R.; Pepler, S.A. Analysis and interpretation of the continuous hourly monitoring data for 26 C2-C8 hydrocarbons at 12 United Kingdom sites during 1996. Atmos. Environ. 2000, 34, 297–312. [Google Scholar] [CrossRef]
  6. Christensen, C.S.; Skov, H.; Palmgren, F. C5-C8 non-methane hydrocarbon measurements in Copenhagen: Concentrations, sources and emission estimates. Sci. Total Environ. 1999, 236, 163–171. [Google Scholar] [CrossRef]
  7. Diskin, A.M.; Španêl, P.; Smith, D. Time variation of ammonia, acetone, isoprene and ethanol in breath: A quantitative SIFT-MS study over 30 days. Physiol. Meas. 2003, 24, 107–119. [Google Scholar] [CrossRef] [PubMed]
  8. Kinoyama, M.; Nitta, H.; Watanabe, A.; Ueda, H. Acetone and isoprene concentrations in exhaled breath in healthy subjects. J. Health Sci. 2008, 54, 471–477. [Google Scholar] [CrossRef]
  9. Kushch, I.; Arendacká, B.; Štolc, S.; Mochalski, P.; Filipiak, W.; Schwarz, K.; Schwentner, L.; Schmid, A.; Dzien, A.; Lechleitner, M.; et al. Breath isoprene—Aspects of normal physiology related to age, gender and cholesterol profile as determined in a proton transfer reaction mass spectrometry study. Clin. Chem. Lab. Med. 2008, 46, 1011–1018. [Google Scholar] [CrossRef] [PubMed]
  10. Veres, P.R.; Faber, P.; Drewnick, F.; Lelieveld, J.; Williams, J. Anthropogenic sources of VOC in a football stadium: Assessing human emissions in the atmosphere. Atmos. Environ. 2013, 77, 1052–1059. [Google Scholar] [CrossRef]
  11. Kansal, A. Sources and reactivity of NMHCs and VOCs in the atmosphere: A review. J. Hazard. Mater. 2009, 166, 17–26. [Google Scholar] [CrossRef] [PubMed]
  12. Stewart, H.E.; Hewitt, C.N.; Bunce, R.G.H.; Steinbrecher, R.; Smiatek, G.; Schoenemeye, T. A highly spatially and temporally resolved inventory of biogenic isoprene and monoterpene emissions: Model description and application to Great Britain. J. Geophys. Res. Atmos. 2003, 108, 4644. [Google Scholar] [CrossRef]
  13. Park, C.; Schade, G.W.; Boedeker, I. Characteristics of the flux of isoprene and its oxidation products in an urban area. J. Geophys. Res. Atmos. 2011, 116, D21303. [Google Scholar] [CrossRef]
  14. von Schneidemesser, E.; Monks, P.S.; Gros, V.; Gauduin, J. How important is biogenic isoprene in an urban environment? A study in London and Paris. Geophys. Res. Lett. 2011, 38, L19804. [Google Scholar] [CrossRef]
  15. Hellén, H.; Tykkä, T.; Hakola, H. Importance of monoterpenes and isoprene in urban air in northern Europe. Atmos. Environ. 2012, 59, 59–66. [Google Scholar] [CrossRef]
  16. Wagner, P.; Kuttler, W. Biogenic and anthropogenic isoprene in the near-surface urban atmosphere—A case study in Essen, Germany. Sci. Total Environ. 2014, 475, 104–115. [Google Scholar] [CrossRef] [PubMed]
  17. Commission of the European Communities CEC. Council directive amending directive 70/220/EEC on the approximation of the laws of member states relating to the measures to be taken against air pollution by emissions from motor vehicles. 91/441/EEC. Off. J. Eur. Communities 1991, 24, L242/1–L242/106. Available online: https://www.as-sl.com/pdf/homolog/91-441-CEE-en.pdf (accessed on 4 June 2018).
  18. Loreto, F.; Sharkey, T.D. A gas-exchange study of photosynthesis and isoprene emission in Quercus rubra L. Planta 1990, 182, 523–531. [Google Scholar] [CrossRef] [PubMed]
  19. Wildermuth, M.C.; Fall, R. Light-dependent isoprene emission. Characterization of a thylakoid-bound isoprene synthase in Salix discolor chloroplasts. Plant Physiol. 1996, 112, 171–182. [Google Scholar] [CrossRef] [PubMed]
  20. Carter, W.P.L. Development of ozone reactivity scales for volatile organic compounds. J. Air. Waste Manage. Assoc. 1994, 44, 881–899. [Google Scholar] [CrossRef]
  21. Atkinson, R. Atmospheric chemistry of VOCs and NOx. Atmos. Environ. 2000, 34, 2063–2101. [Google Scholar] [CrossRef]
  22. Claeys, M.; Graham, B.; Vas, G.; Wang, W.; Vermeylen, R.; Pashynska, V.; Cafmeyer, J.; Guyon, P.; Andreae, M.O.; Artaxo, P.; et al. Formation of secondary organic aerosols through photooxidation of isoprene. Science 2004, 303, 1173–1176. [Google Scholar] [CrossRef] [PubMed]
  23. Kroll, J.H.; Ng, N.L.; Murphy, S.M.; Flagan, R.C.; Seinfeld, J. H. Secondary organic aerosol formation from isoprene photooxidation under high-NOx conditions. Geophys. Res. Lett. 2005, 32, L18808. [Google Scholar] [CrossRef]
  24. Paulot, F.; Crounse, J.D.; Kjaergaard, H.G.; Kroll, J.H.; Seinfeld, J.H.; Wennberg, P.O. Isoprene photooxidation: New insights into the production of acids and organic nitrates. Atmos. Chem. Phys. 2009, 9, 1479–1501. [Google Scholar] [CrossRef]
  25. Navakoudis, E.; Lütz, C.; Langebartels, C.; Lütz-Meindl, U.; Kotzabass, K. Ozone impact on the photosynthetic apparatus and the protective role of polyamines. BBA Gen. Subj. 2003, 1621, 160–169. [Google Scholar] [CrossRef]
  26. Loreto, F.; Velikova, V. Isoprene produced by leaves protects the photosynthetic apparatus against ozone damage, quenches ozone products and reduces lipid peroxidation of cellular membranes. Plant Physiol. 2001, 127, 1781–1787. [Google Scholar] [CrossRef] [PubMed]
  27. Doyle, M.; Sexton, K.G.; Jeffries, H.; Bridge, K.; Jaspers, I. Effects of 1,3-butadiene, isoprene and their photochemical degradation products on human lung cells. Environ. Health Perspect. 2004, 112, 1488–1495. [Google Scholar] [CrossRef] [PubMed]
  28. Hughes, K.; Meek, M.; Walker, M. 1,3-Butadiene: Human Health Aspects. World Health Organization, Geneva. 2001. Available online: http://www.who.int/ipcs/publications/cicad/en/cicad30.pdf (accessed on 4 June 2018).
  29. Harrison, R.M.; Shi, J.P.; Xi, S.; Khan, A.; Mark, D.; Kinnersley, R.; Yin, J. Measurement of number, mass and size distribution of particles in the atmosphere. Philos. Trans. R. Soc. Lond. A Math. Phys. Eng. Sci. 2000, 358, 2567–2580. [Google Scholar] [CrossRef]
  30. Arnold, S.J.; ApSimon, H.; Barlow, J.; Belcher, S.; Bell, M.; Boddy, J.W.; Britter, R.; Cheng, H.; Clark, R.; Colville, R.N.; et al. Introduction to the DAPPLE Air Pollution Project. Sci. Total Environ. 2004, 332, 139–153. [Google Scholar] [CrossRef] [PubMed]
  31. Dollard, G.J.; Dumitrean, P.; Telling, S.; Dixon, J.; Derwent, R.G. Observed trends in ambient concentrations of C2-C8 hydrocarbons in the United Kingdom over the period from 1993 to 2004. Atmos. Environ. 2007, 41, 2559–2569. [Google Scholar] [CrossRef]
  32. Biesenthal, T.A.; Shepson, P.B. Observations of anthropogenic inputs of the isoprene oxidation products methyl vinyl ketone and methacrolein to the atmosphere. Geophys. Res. Lett. 1997, 24, 1375–1378. [Google Scholar] [CrossRef] [Green Version]
  33. Cobb, C.W.; Douglas, P.H. A theory of production. Am. Econ. Rev. 1928, 18, 139–165. [Google Scholar]
  34. Burgess, R.A.; Penkett, S.A. Ground-based non-methane hydrocarbon measurements in England. In Proceedings of the EUROTRAC’92; Borell, P., Ed.; Academic Publishing: The Hague, The Netherlands, 1993; pp. 165–169. [Google Scholar]
  35. Wang, J.L.; Chew, C.; Chang, C.Y.; Liao, W.C.; Lung, S.C.C.; Chen, W.N.; Lee, P.J.; Lin, P.H.; Chang, C.C. Biogenic isoprene in subtropical urban settings and implications for air quality. Atmos. Environ. 2013, 79, 369–379. [Google Scholar] [CrossRef]
  36. McLaren, R.; Singleton, D.L.; Lai, J.Y.K.; Knouw, B.; Singer, E.; Wu, Z.; Niki, H. Analysis of motor vehicle sources and their contribution to ambient hydrocarbon distributions at urban sites in Toronto during the Southern Ontario oxidants study. Atmos. Environ. 1996, 30, 2219–2232. [Google Scholar] [CrossRef] [Green Version]
  37. Chang, C.-C.; Wang, J.-L.; Lung, S.-C.C.; Chang, C.-Y.; Lee, P.-J.; Chew, C.; Liao, W.-C.; Chen, W.-N.; Ou-Yang, C.-F. Seasonal characteristics of biogenic and anthropogenic isoprene in tropical-subtropical urban environments. Atmos. Environ. 2014, 99, 298–308. [Google Scholar] [CrossRef]
  38. Borbon, A.; Fontaine, H.; Locoge, N.; Veillerot, M.; Galloo, J.C. Developing receptor-oriented methods for non-methane hydrocarbon characterisation in urban air-Part I: Source identification. Atmos. Environ. 2003, 37, 4051–4064. [Google Scholar] [CrossRef]
  39. Lee, J.D.; Lewis, A.C.; Monks, P.S.; Jacob, M.; Hamilton, J.F.; James, R.; Watson, N.; Saxton, J.; Ennis, C.; Carpenter, L.J.; et al. Ozone photochemistry during the UK heat wave of August 2003. Atmos. Environ. 2006, 40, 7598–7613. [Google Scholar] [CrossRef]
  40. Tressol, M.; Ordonez, C.; Zbinden, R.; Brioude, J.; Thouret, V.; Mari, C.; Nedelec, P.; Cammas, J.P.; Smit, H.; Patz, H.W.; et al. Air pollution during the 2003 European heat wave as seen by MOZAIC airliners. Atmos. Chem. Phys. 2008, 8, 2133–2150. [Google Scholar] [CrossRef] [Green Version]
  41. Fu, T.-M.; Zheng, Y.; Paulot, F.; Mao, J.; Yantosca, R.M. Positive but variable sensitivity of August surface ozone to large-scale warming in the southeast United States. Nat. Clim. Chang. 2015, 5, 454–458. [Google Scholar] [CrossRef]
  42. Rasmussen, D.J.; Fiore, A.M.; Naik, V.; Horowitz, L.W.; McGinnis, S.J.; Schultz, M.G. Surface ozone-temperature relationships in the eastern US: A monthly climatology for evaluating chemistry-climate models. Atmos. Environ. 2012, 47, 142–153. [Google Scholar] [CrossRef]
  43. Pinho, P.G.; Lemos, L.T.; Pio, C.A.; Evtyugina, M.G.; Nunes, T.V.; Jenkin, M.E. Detailed chemical analysis of regional-scale air pollution in western Portugal using an adapted version of MCM v3.1. Sci. Tot. Environ. 2009, 407, 2024–2038. [Google Scholar] [CrossRef] [PubMed]
  44. Colette, A.; Granier, C.; Hodnebrog, Ø.; Jakobs, H.; Maurizi, A.; Nyiri, A.; Bessagnet, B.; D’Angiola, A.; D’Isidoro, M.; Gauss, M.; et al. Air quality trends in Europe over the past decade: A first multi-model assessment. Atmos. Chem. Phys. 2011, 11, 11657–11678. [Google Scholar] [CrossRef] [Green Version]
  45. Vieno, M.; Dore, A.J.; Stevenson, D.S.; Doherty, R.; Heal, M.R.; Reis, S.; Hallsworth, S.; Tarrason, L.; Wind, P.; Fowler, D.; et al. Modelling surface ozone during the 2003 heat-wave in the UK. Atmos. Chem. Phys. 2010, 10, 7963–7978. [Google Scholar] [CrossRef] [Green Version]
  46. Seinfeld, J.H.; Pandis, S.N. Atmospheric Chemistry and Physics from Air Pollution to Climate Change, 2nd ed.; John Wiley & Sons: New York. NY, USA, 2006. [Google Scholar]
  47. Li, G.; Zhang, R.; Fan, J.; Tie, X. Impacts of biogenic emissions on photochemical ozone production in Houston, Texas. J. Geophys. Res. Atmos. 2007, 112, D10309. [Google Scholar] [CrossRef]
  48. Solberg, S.; Hov, Ø.; Søvde, A.; Isaksen, I.S.A.; Coddeville, P.; De Backer, H.; Forster, C.; Orsolini, Y.; Uhse, K. European surface ozone in the extreme summer 2003. J. Geophys. Res. Atmos. 2008, 113, D07307. [Google Scholar] [CrossRef]
  49. Singsaas, E.L.; Lerdau, M.; Winter, K.; Sharkey, T.D. Isoprene increases thermotolerance of isoprene-emitting species. Plant Physiol. 1997, 115, 1413–1420. [Google Scholar] [CrossRef] [PubMed]
  50. Singsaas, E.L.; Sharkey, T.D. The effects of high temperature on isoprene synthesis in oak leaves. Plant Cell Environ. 2000, 23, 751–757. [Google Scholar] [CrossRef] [Green Version]
  51. Fares, S.; Barta, C.; Brilli, F.; Centritto, M.; Ederli, L.; Ferranti, F.; Pasqualini, S.; Reale, L.; Tricoli, D.; Loreto, F. Impact of high ozone on isoprene emission, photosynthesis and histology of developing Populus alba leaves directly or indirectly exposed to the pollutant. Physiol. Plant. 2006, 128, 456–465. [Google Scholar] [CrossRef] [Green Version]
  52. Velikova, V.; Tsonev, T.; Pinelli, P.; Alessio, G.A.; Loreto, F. Localized ozone fumigation system for studying ozone effects on photosynthesis, respiration, electron transport rate and isoprene emission in field-grown Mediterranean oak species. Tree Physiol. 2005, 25, 1523–1532. [Google Scholar] [CrossRef] [PubMed] [Green Version]
  53. Lerdau, M. A positive feedback with negative consequences. Science 2007, 316, 212–213. [Google Scholar] [CrossRef] [PubMed]
  54. Vickers, C.E.; Gershenzon, J.; Lerdau, M.T.; Loreto, F. A unified mechanism of action for volatile isoprenoids in plant abiotic stress. Nature Chem. Biol. 2009, 5, 283–291. [Google Scholar] [CrossRef] [PubMed]
  55. McCrae, I.S.; Latham, S.; Boulter, P.G. A Review of Roadside Emission Testing by Local Authorities in the United Kingdom. Available online: https://trl.co.uk/sites/default/files/PPR107.pdf (accessed on 4 June 2018).
  56. Ellison, R.B.; Greaves, S.P.; Hensher, D.A. Five years of London’s low emission zone: Effects on vehicle fleet composition and air quality. Trans. Res. Part D Trans. Environ. 2013, 23, 25–33. [Google Scholar] [CrossRef]
  57. Jiang, X.; Guenther, A.; Potosnak, M.; Geron, C.; Seco, R.; Karl, T.; Kim, S.; Gu, L.; Pallardy, S. Isoprene emission response to drought and the impact on global atmospheric chemistry. Atmos. Environ. 2018, 183, 69–83. [Google Scholar] [CrossRef]
  58. Potosnak, M.J.; LeStourgeon, L.; Pallardy, S.G.; Hosman, K.P.; Gu, L.; Karl, T.; Geron, C.; Guenther, A.B. Observed and modeled ecosystem isoprene fluxes from an oak-dominated temperate forest and the influence of drought stress. Atmos. Environ. 2014, 84, 314–322. [Google Scholar] [CrossRef] [Green Version]
  59. Niinemets, Ü. Mild versus severe stress and BVOCs: Thresholds, priming and consequences. Trends Plant Sci. 2010, 15, 145–153. [Google Scholar] [CrossRef] [PubMed]
  60. Miyama, T.; Tobita, H.; Uchiyama, K.; Yazaki, K.; Ueno, S.; Saito, T.; Matsumoto, A.; Kitao, M.; Izuta, T. Differences in monoterpene emission characteristics after ozone exposure between three clones representing major gene pools of Cryptomeria japonica. J. Agric. Meteorol. 2018, 74, 102–108. [Google Scholar] [CrossRef]
  61. Kanagendran, A.; Pazouki, L.; Niinemets, Ü. Differential regulation of volatile emission from Eucalyptus globulus leaves upon single and combined ozone and wounding treatments through recovery and relationships with ozone uptake. Environ. Exp. Bot. 2018, 145, 21–38. [Google Scholar] [CrossRef] [PubMed]
Figure 1. The monthly average mixing ratios of isoprene and 1,3-butadiene and their ratios for the period of 1997–2017 (a) London Marylebone Road (n = 93,483 for isoprene and n = 137,462 for 1,3-butadiene), (b) Eltham (n = 112,595 for isoprene and n = 127,360 for 1,3-butadiene). The biogenic and anthropogenic isoprene mixing ratios (in ppb) are shown in the subplots. Note: The error bar represents ± 1 SD of the whole data series.
Atmosphere 09 00387 g001
Figure 2. Yearly variation of the limiting anthropogenic molar ratio of isoprene and 1,3-butadiene based on winter-time data (see text). Note: There are no available winter data of the time series of 2000–2002 and 2012–2017 for Eltham and Marylebone Road, respectively. The error bar represents ± 1 SD of the whole data series.
Atmosphere 09 00387 g002
Figure 3. The diurnal average mixing ratios of anthropogenic and biogenic isoprene for the period of 1997–2017 (a) London Marylebone Road, (b) London Eltham. Note: The error bar represents ± 1 SD of the whole data series.
Atmosphere 09 00387 g003aAtmosphere 09 00387 g003b
Figure 4. The correlation plots between anthropogenic/biogenic isoprene emissions, temperature, and ozone for (a,b) Marylebone Road, (c,d) Eltham. The units in x-axis and y-axis are °K and ppb, respectively.
Atmosphere 09 00387 g004
Figure 5. The mixing ratios of ozone, biogenic and anthropogenic isoprene with the variation of temperature from 26–36 °C for London urban areas (a) Marylebone Road, (b) Eltham.
Atmosphere 09 00387 g005
Figure 6. The time series plots of biogenic isoprene and ozone mixing ratios along with temperatures and PAR for the heatwave periods. The estimated isoprene concentrations using Cobb-Douglas model (black line) are also shown in the figure (ah).
Atmosphere 09 00387 g006
Figure 7. Trends in summertime anthropogenic isoprene, biogenic isoprene, and ozone over the time for (a) Marylebone Road, (b) Eltham. Note: There are no data for the period of 2001–2003 for Eltham and 2013–2017 for Marylebone Road. The isoprene data for 2006 at Marylebone Road is omitted because of the very limited isoprene data (only part of June month data available). The error bar represents ± 1 SD of the whole data series.
Atmosphere 09 00387 g007

