Article

The Characteristics of Greenhouse Gas Emissions from Heavy-Duty Trucks in the Beijing-Tianjin-Hebei (BTH) Region in China

1
School of Civil and Environmental Engineering, University of Science and Technology Beijing, Beijing 100083, China
2
China Automotive Technology and Research Center Beijing Operations, Beijing 100083, China
3
The International Council on Clean Transportation, Washington, DC 20005, USA
*
Author to whom correspondence should be addressed.
Atmosphere 2016, 7(9), 121; https://doi.org/10.3390/atmos7090121
Submission received: 24 July 2016 / Revised: 8 September 2016 / Accepted: 13 September 2016 / Published: 21 September 2016

Abstract

:
This paper aims to study the characteristics of greenhouse gas (GHG) emissions from heavy-duty trucks in the Beijing-Tianjin-Hebei (BTH) region, which is located in Northern China. The multiyear emissions of GHG (CO2, CH4 and N2O) from heavy-duty trucks fueled by diesel and natural gas during the period of 2006–2015 were compared and analyzed. The results show that the GHG emissions from heavy-duty trucks increase with time, which is consistent with the trend of the population growth. The total amount of carbon dioxide equivalence (CO2e) emissions in the BTH region was about 5.12 × 10⁶ t in 2015. Among the three sub-regions, Hebei possesses the largest number of heavy-duty trucks due to the size of its heavy-duty industries. As a consequence, the GHG emissions are about 10 times compared to Beijing and Tianjin. Tractor trailers account for the major proportion of heavy-duty trucks and hence contribute to about 74% of GHG emissions. Diesel- and liquefied natural gas (LNG)-powered heavy-duty trucks can reduce GHG emissions more effectively under current national standard IV than can the previous standard. The widespread utilization of the alternative fuel of LNG to mitigate emissions must be accompanied with engine technology development in China. This study has provided new insight on management methods and the policy-making as regards trucks in terms of environmental demand.

1. Introduction

Worldwide population growth and industrialization have resulted in increasing demand for energy. As a result, air pollution and anthropogenic GHG emissions have become major global issues [1,2,3,4]. In an effort to improve the environmental quality, the 21st session of the United Nations (UN) Climate Change Conference was held in Paris from 30 November to 11 December of 2015 [5,6]. During this session, the participating countries made an agreement on carbon emission reduction. In China, these measures and regulations on carbon emission reduction were included in its 13th Five Year Plan.
With rapid economic growth, the population of motor vehicles in China has been expanding since the 1990s, from 5.5 million in 1990 to 264 million in 2014 [7]. This increase has posed substantial challenges to air quality, energy security, and public health [8,9]. In order to minimize the impact of emissions from the transportation sector, consumers and manufacturers are seeking viable low-carbon alternatives to gasoline and diesel vehicles [10,11,12]. The use of alternative fuels, mainly biodiesel, gasoline-alcohol blends, natural gas, and liquefied petroleum gas has been growing in recent years in many countries, such as European Union countries, the United States, Canada, Japan, Iran, Italian, and Brazil [13,14,15,16,17,18]. Among these, vehicles fueled by liquefied natural gas (LNG) have been considered as one of the most promising alternatives to conventional gasoline- and diesel-powered heavy-duty vehicles and can significantly reduce emissions from the transportation sector. Two studies that compared LNG and gasoline engines have shown significant reductions in all combustive emissions [19]. Lars Rose et al. performed a comparative life cycle assessment of diesel- and natural-gas-powered refuse collection vehicles in a Canadian city and found that a 24% reduction of GHG emissions (CO2-equivalent) was achieved by switching from diesel to natural gas [20]. However, Aslam et al. [21] observed an increase in NOx emissions for the natural-gas-powered vehicles, which has also been observed in another study comparing natural gas and diesel fuel [22].
In China, a series of technologies and policies have been implemented by the government, including emission limit improvement [23], the elimination of vehicles pre-National Standard I, clean energy replacement [24], and the use of electric and hybrid electric buses and taxis [25,26]. All these technologies and policies aim to improve fuel economy and promote pollution control. As a vehicle power, China possesses a large number of heavy-duty vehicles, and this has a significant influence on the global GHG emissions. In addition, diesel vehicles have major impacts on the near-road air quality [27] and have been identified as a Group I “carcinogenic to humans” in 2012 [28]. Therefore, it is necessary to understand the emission characteristics of heavy-duty vehicles powered by an alternative fuel (i.e., natural gas) compared with those powered by conventional fuels (i.e., diesel). The objective of this study was to characterize the GHG emissions from trucks powered by diesel and LNG in the Beijing-Tianjin-Hebei (BTH) during the period of 2006 to 2015.
The Beijing-Tianjin-Hebei (BTH) region is located in Northern China, which includes two municipalities (Beijing and Tianjin) and one province (Hebei). As one of the most economically vibrant regions in China, the BTH region covers only 2.28% of the Chinese territory but generates over 10% of the total national GDP in 2015 [7]. Beijing is the capital as well as the center of politics, economics, and culture in China. Tianjin is one of the four directly governed municipalities of China. Hebei is an important industrial province in Northern China. During the past decade, Beijing, Tianjin, and Hebei have experienced rapid growth in vehicle population. Particularly, there is high demand for heavy-duty trucks because the BTH region is an area in which a number of hi-tech heavy-duty industries are located such as the automotive industry, the electronic industry, the machinery industry, and the iron and steel industry. While this region is becoming a major source with high GHG emissions, relevant studies on GHG emissions from heavy-duty trucks remain limited. In China, diesel-fueled heavy-duty trucks are dominant among all heavy-duty trucks. In recent years, natural-gas-fueled heavy-duty trucks have become attractive options in response to environment concerns.
In this paper, the varying trend of the heavy-duty truck population classified by different regions, fuels, and applications in the last 10 years are presented and discussed. Characteristics of GHG emissions from heavy-duty trucks were compared using a GHG emission factor model. The findings of this study will assist local policy makers in the BTH area in making important policy decisions regarding the mitigation of GHG emissions in the future.

2. Methodology

2.1. Calculation Method

The GHG emissions were calculated based on the population of heavy-duty trucks using different fuels, different GHG emission factors, and the average annual mileage traveled in different areas, according to the following formula [29]:
E Q m , n = i j ( P m , i × M j × E F i , n ) × 10 6
where m represents the three areas (Beijing, Tianjin, and Hebei); n represents the pollutants considered in this study (CH4, CO2, and N2O); i represents the type of fuels, including natural gas and diesel, and j represents the types of heavy-duty trucks, which include tractor trailers, pickup trucks, special trucks, and dump trucks. EQm,n represents the emissions (tons) of pollutant n in area m; Pm,i is the population of heavy-duty trucks powered by fuel type i in area m; Mi represents the average of annual mileage traveled (km) for type j trucks; EFi,n is the emission factor (g/km) of pollutant n emitted from heavy-duty trucks powered by fuel type i.

2.2. Population and Average Annual Mileage

The retirement coefficient and average annual travel mileage are very important parameters for heavy-duty trucks. Currently, there is no exact approach to estimate the value, so we need investigate the value from professional and empirical organizations or individuals. In this paper, data from the China Automotive Technology and Research Center, Beijing Operations, are used.
China Automotive Technology and Research Center, Beijing Operations, is an authoritative data research institute, and they publish the China Automobile Development Report every year. They obtained data from four companies that are the main producers of heavy-duty trucks in China—Shaanxi Automobile Group Co., Ltd. (Xi’an, China), Faw Jiefang Automotive Company (Changchun, China), Dong Feng Commercial Vehicle Company (Wuhan, China), and China National Heavy Duty Truck Group Co. (Ji’nan, China)—and they accounted for about 70% of the market share in 2015. The heavy-duty trucks are mainly divided into four types, according to their applications: tractor trailers, pickup trucks, special trucks, and dump trucks. The retirement coefficient and average annual travel mileage of heavy-duty trucks from these four companies for the different application types are listed in Table 1.
In this section, we calculated the population of heavy-duty trucks based on a vehicle fleet model [30], which requires both estimates of the average retirement coefficient and new registration numbers. Detailed truck registration numbers of various types of trucks by calendar year in Beijing-Tianjin-Hebei were provided by the Vehicle Administration Region. Meanwhile, based on the principle of minimum displacement, the average annual travel mileage selects the minimum value in Table 1.

2.3. The Emission Factor

Accurate motor vehicle emission factors are essential for estimating air pollutant emissions from the vehicles of a given country. In this paper, we use the normalization method to process the data from the survey and calculate using the COPERT IV model. The COPERT model was a European road transport emission inventory calculation model that is similar to the emission standard profile of China [31,32,33]. The emission factors of CO2, CH4, and N2O of heavy-duty vehicles powered by diesel and natural gas under different Chinese National standards of emission are listed in Table 2.

3. Results and Discussion

3.1. Population Analysis of Heavy-Duty Trucks

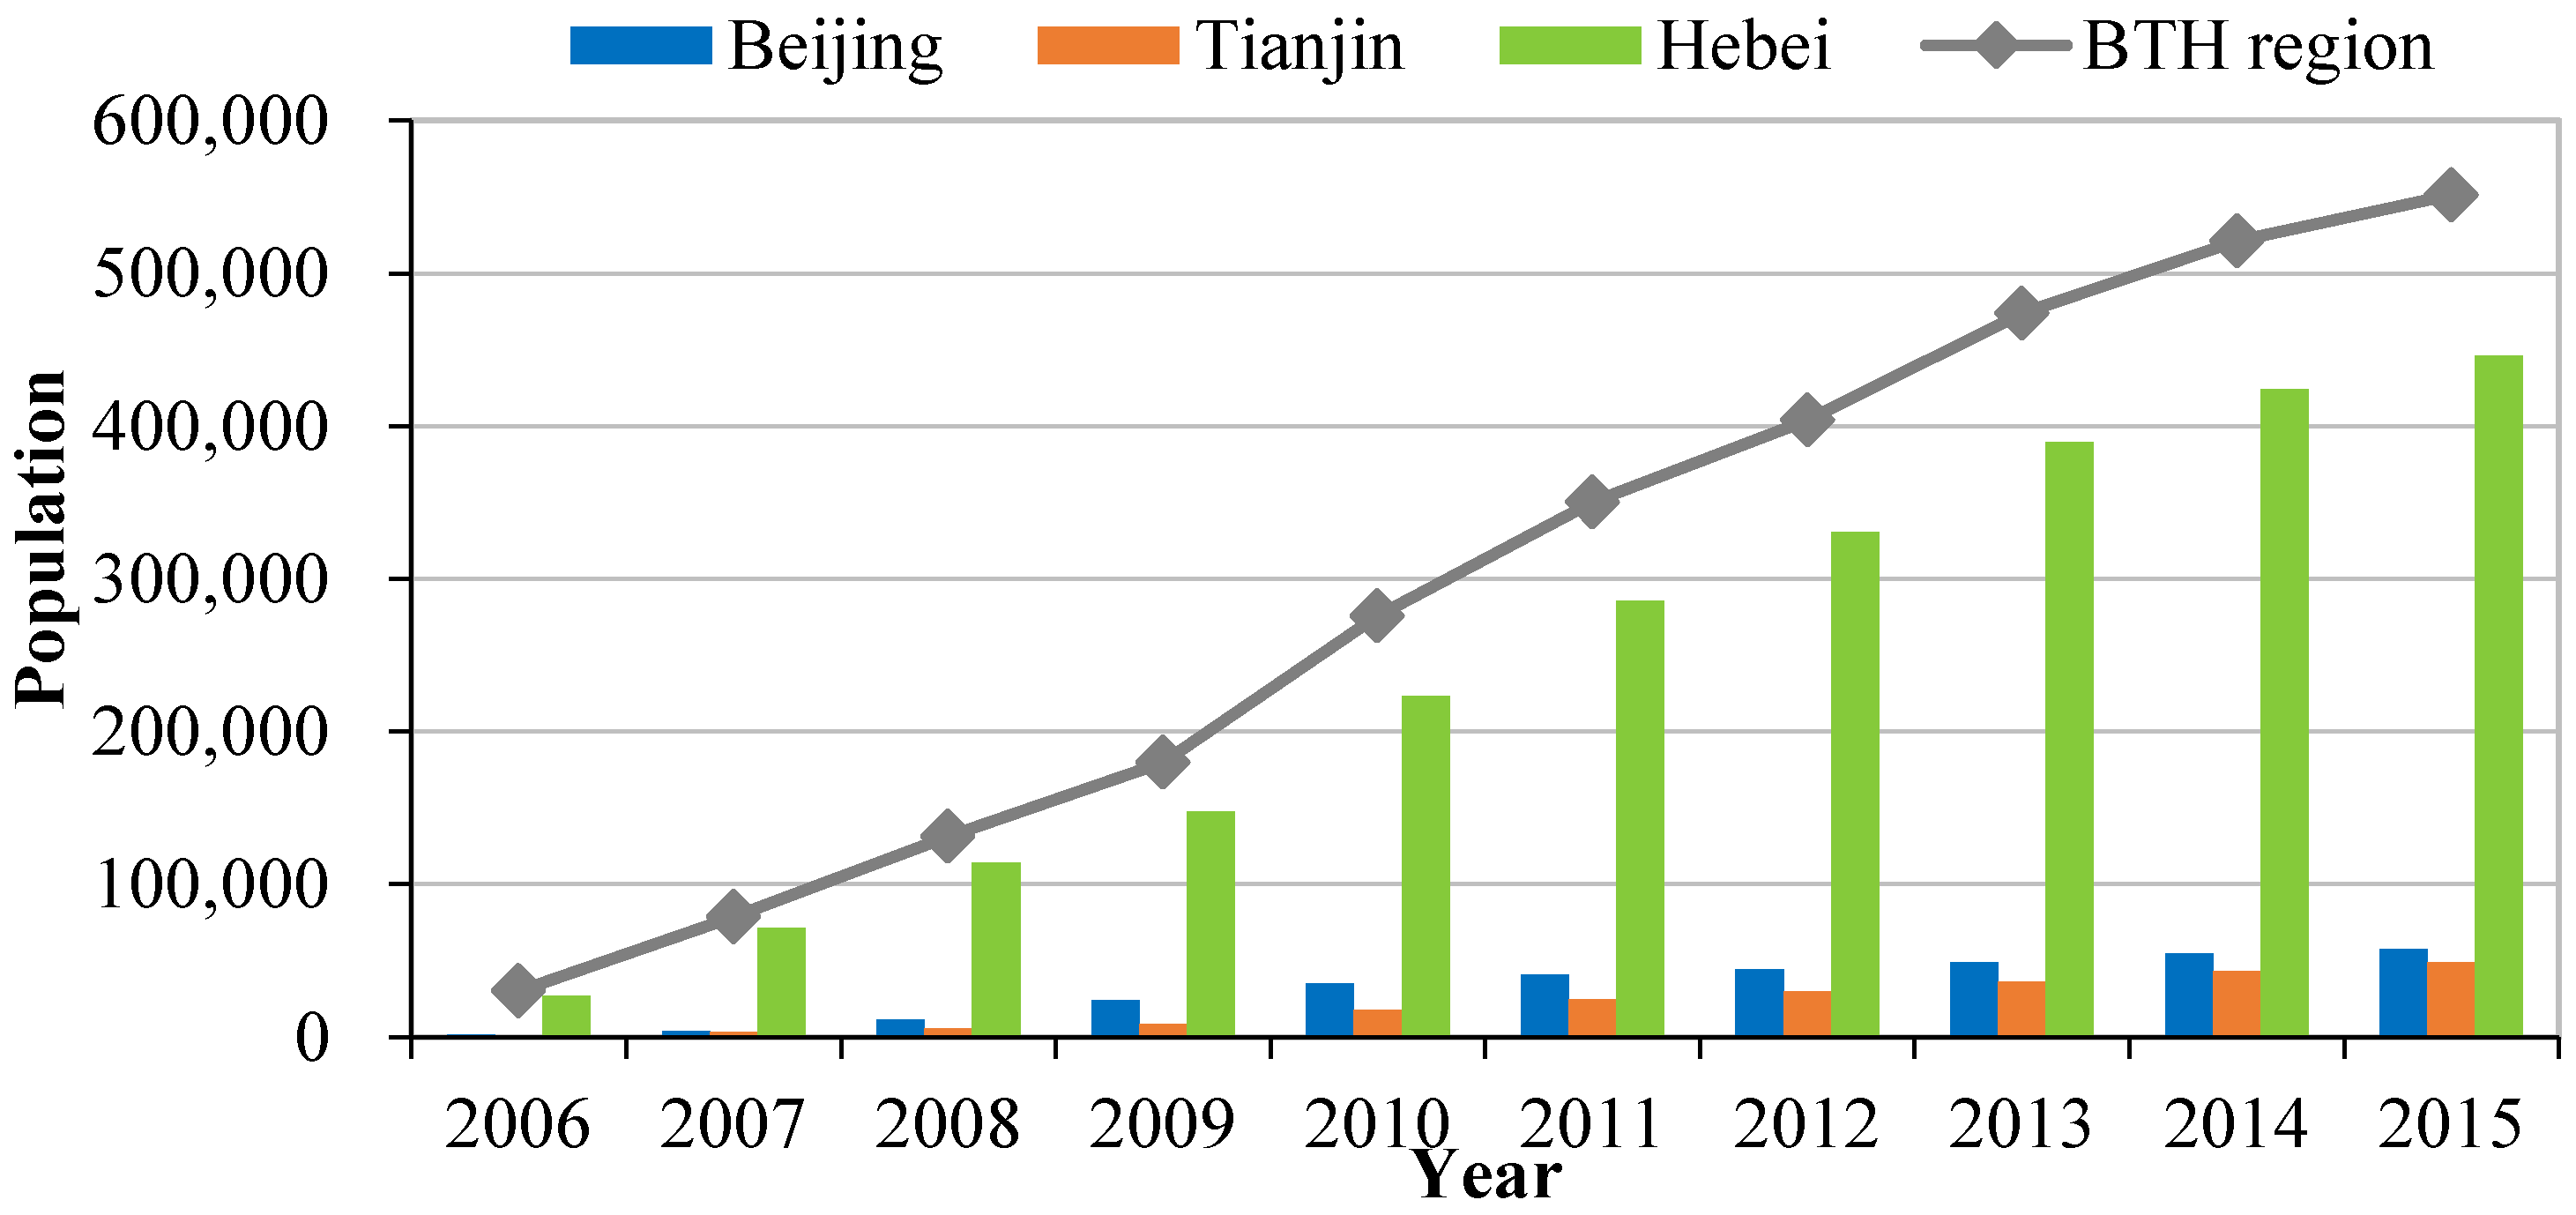
3.1.1. The Population of Heavy-Duty Trucks in Different Regions

Figure 1 shows the population of heavy-duty trucks in Beijing-Tianjin-Hebei from 2006 to 2015. It can be seen that the total heavy-duty trucks population increased for ten consecutive years and reached a record high level of 551,000 in 2015. The population of heavy-duty trucks in Beijing, Tianjin, and Hebei exhibits a similar increasing trend. Nevertheless, the population varies with different regions. In 2015, the population of heavy-duty trucks in Beijing, Tianjin, and Hebei were 57,000, 48,000 and 446,000, respectively. The population of heavy-duty trucks in Hebei province is much higher than that in the other two regions, being eight times greater than that of Beijing and nine times greater than that of Tianjin, accounting for 81% of the whole BTH region.

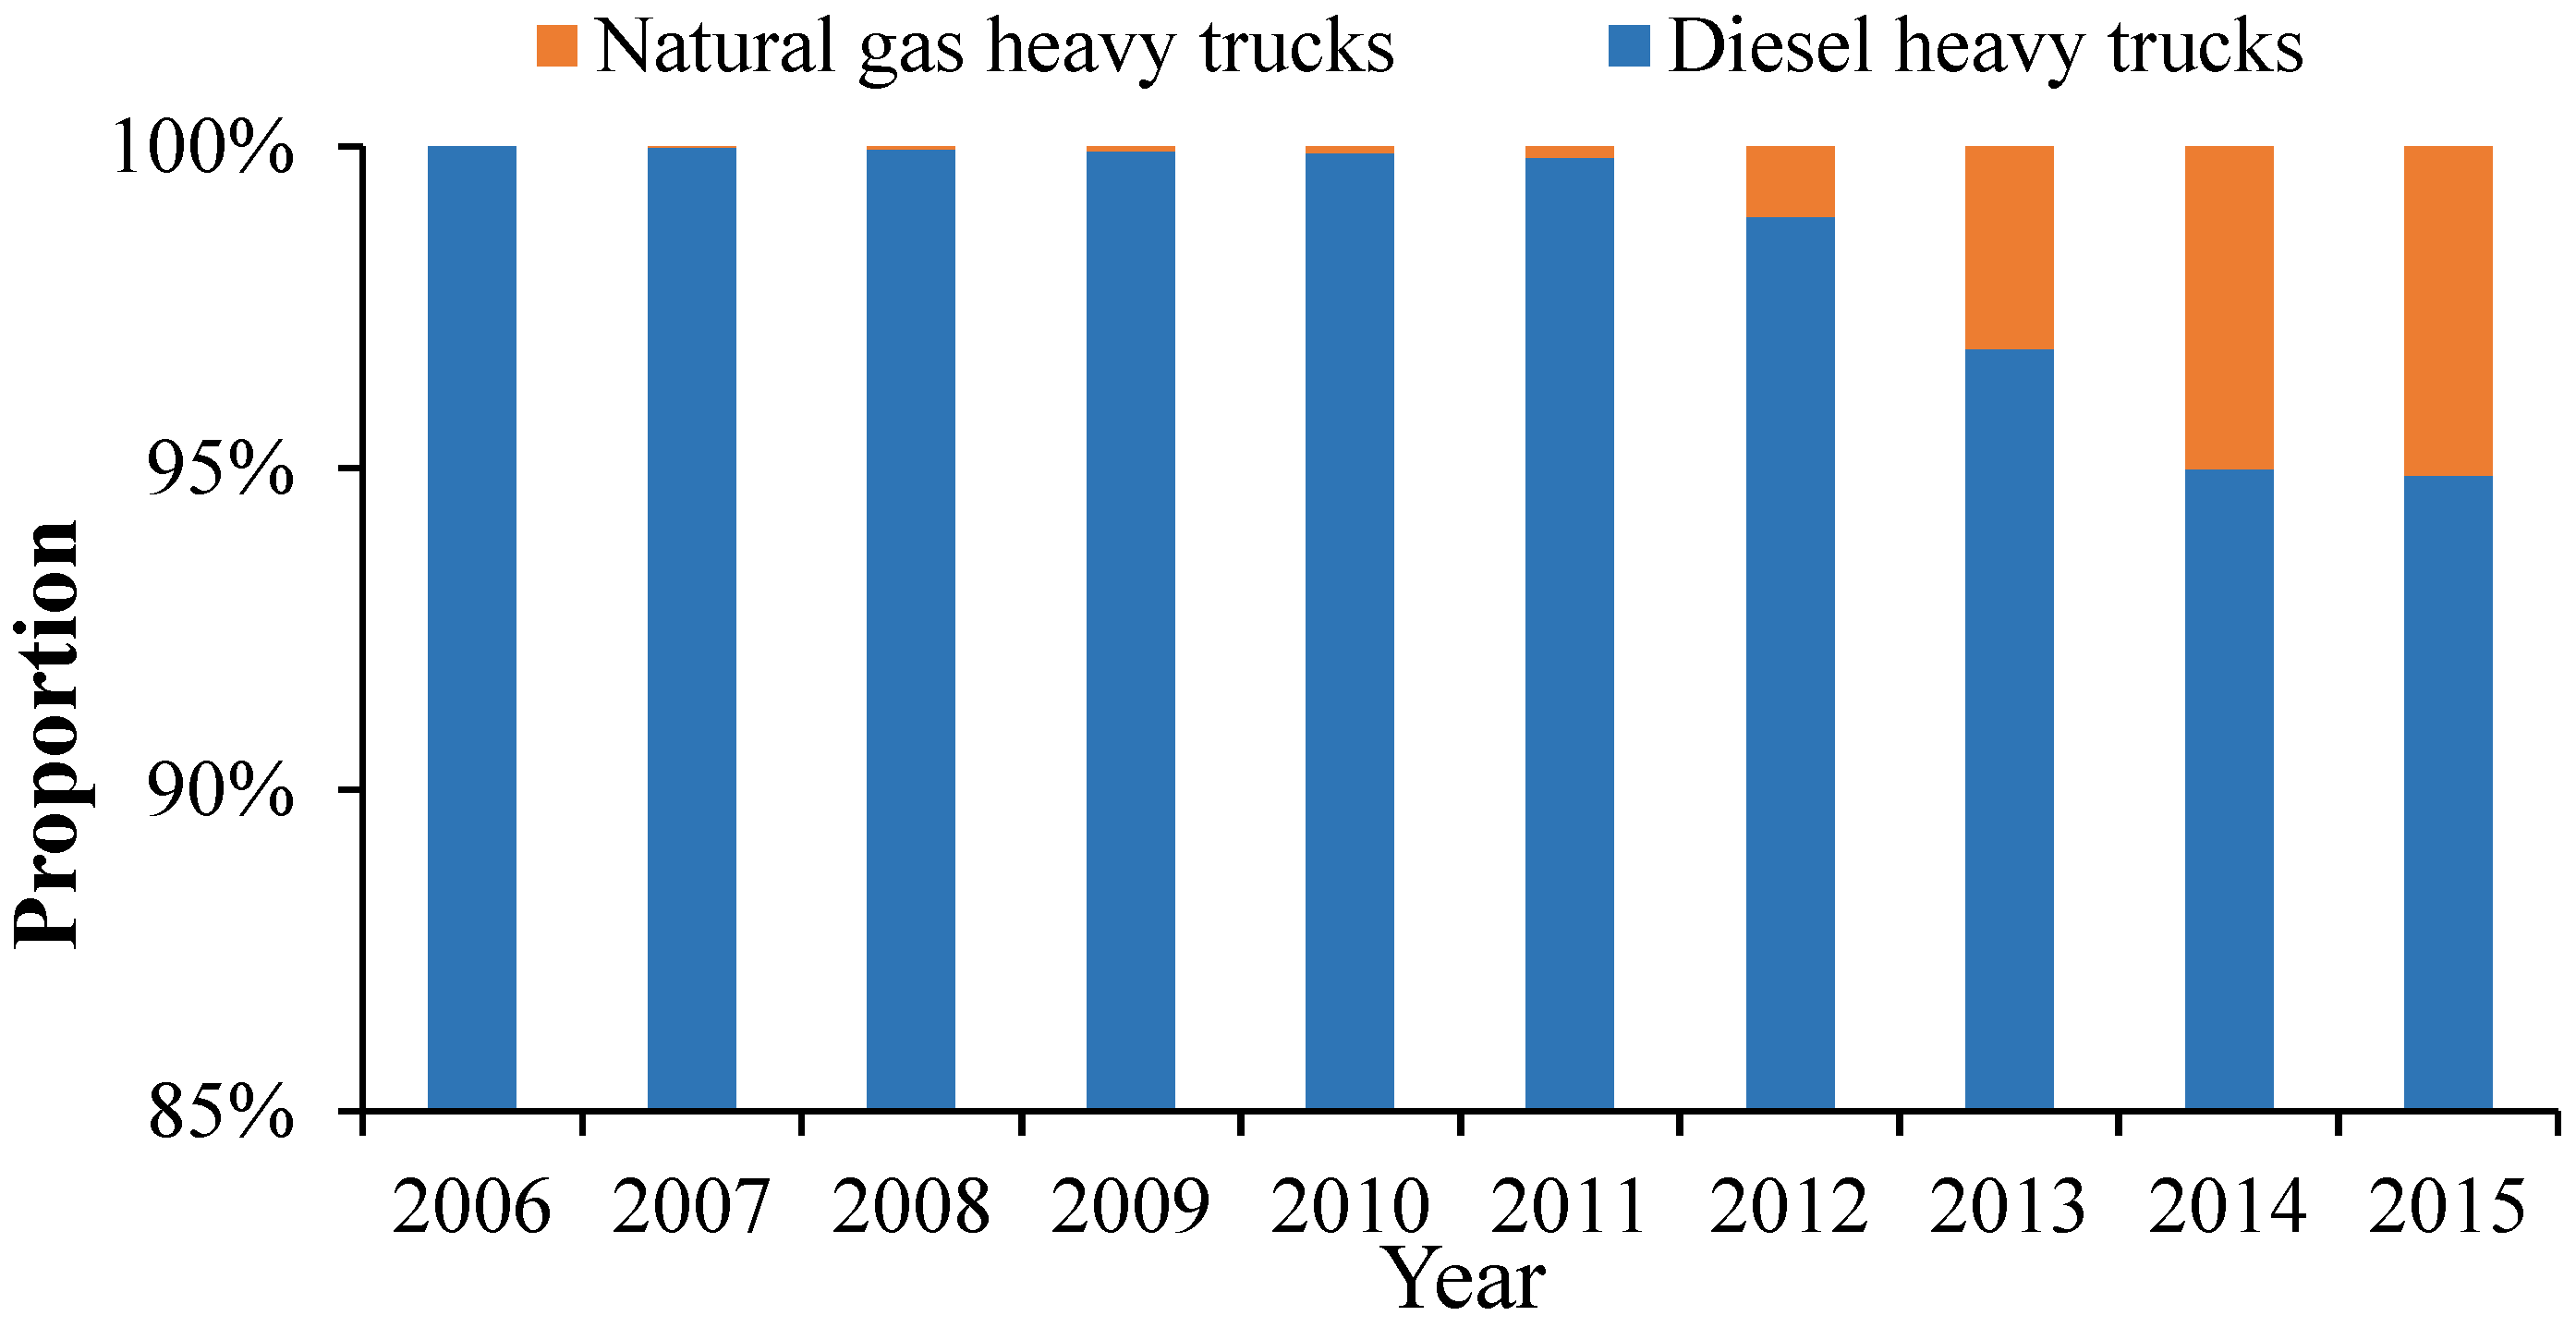
3.1.2. The Population of Heavy-Duty Trucks Powered by Different Fuels

Figure 2 shows the population proportion of heavy-duty trucks powered by different fuels in Beijing–Tianjin–Hebei from 2006 to 2015. The population of heavy-duty trucks powered by diesel is much larger than natural-gas-powered heavy-duty trucks. The percentage of natural-gas-powered heavy-duty trucks remained at a low level (less than 1%) until 2012. From 2013, this percentage increased to 3.1%, 5.0% and 5.1% in the years 2013, 2014, and 2015, respectively. The natural gas price is the major factor that affects the natural-gas-powered heavy-duty truck market development.
As can be seen in Figure 1, the population of diesel-fueled heavy-duty trucks expanded from 30,000 to 523,000 from 2006 to 2015. Similarly, the natural-gas-fueled heavy-duty truck population exhibits a continuous increasing trend. The major expansion of the natural-gas-fueled truck population did not occur until 2011, but this population rapidly increased from 4400 in 2012 to 28,000 in 2015.

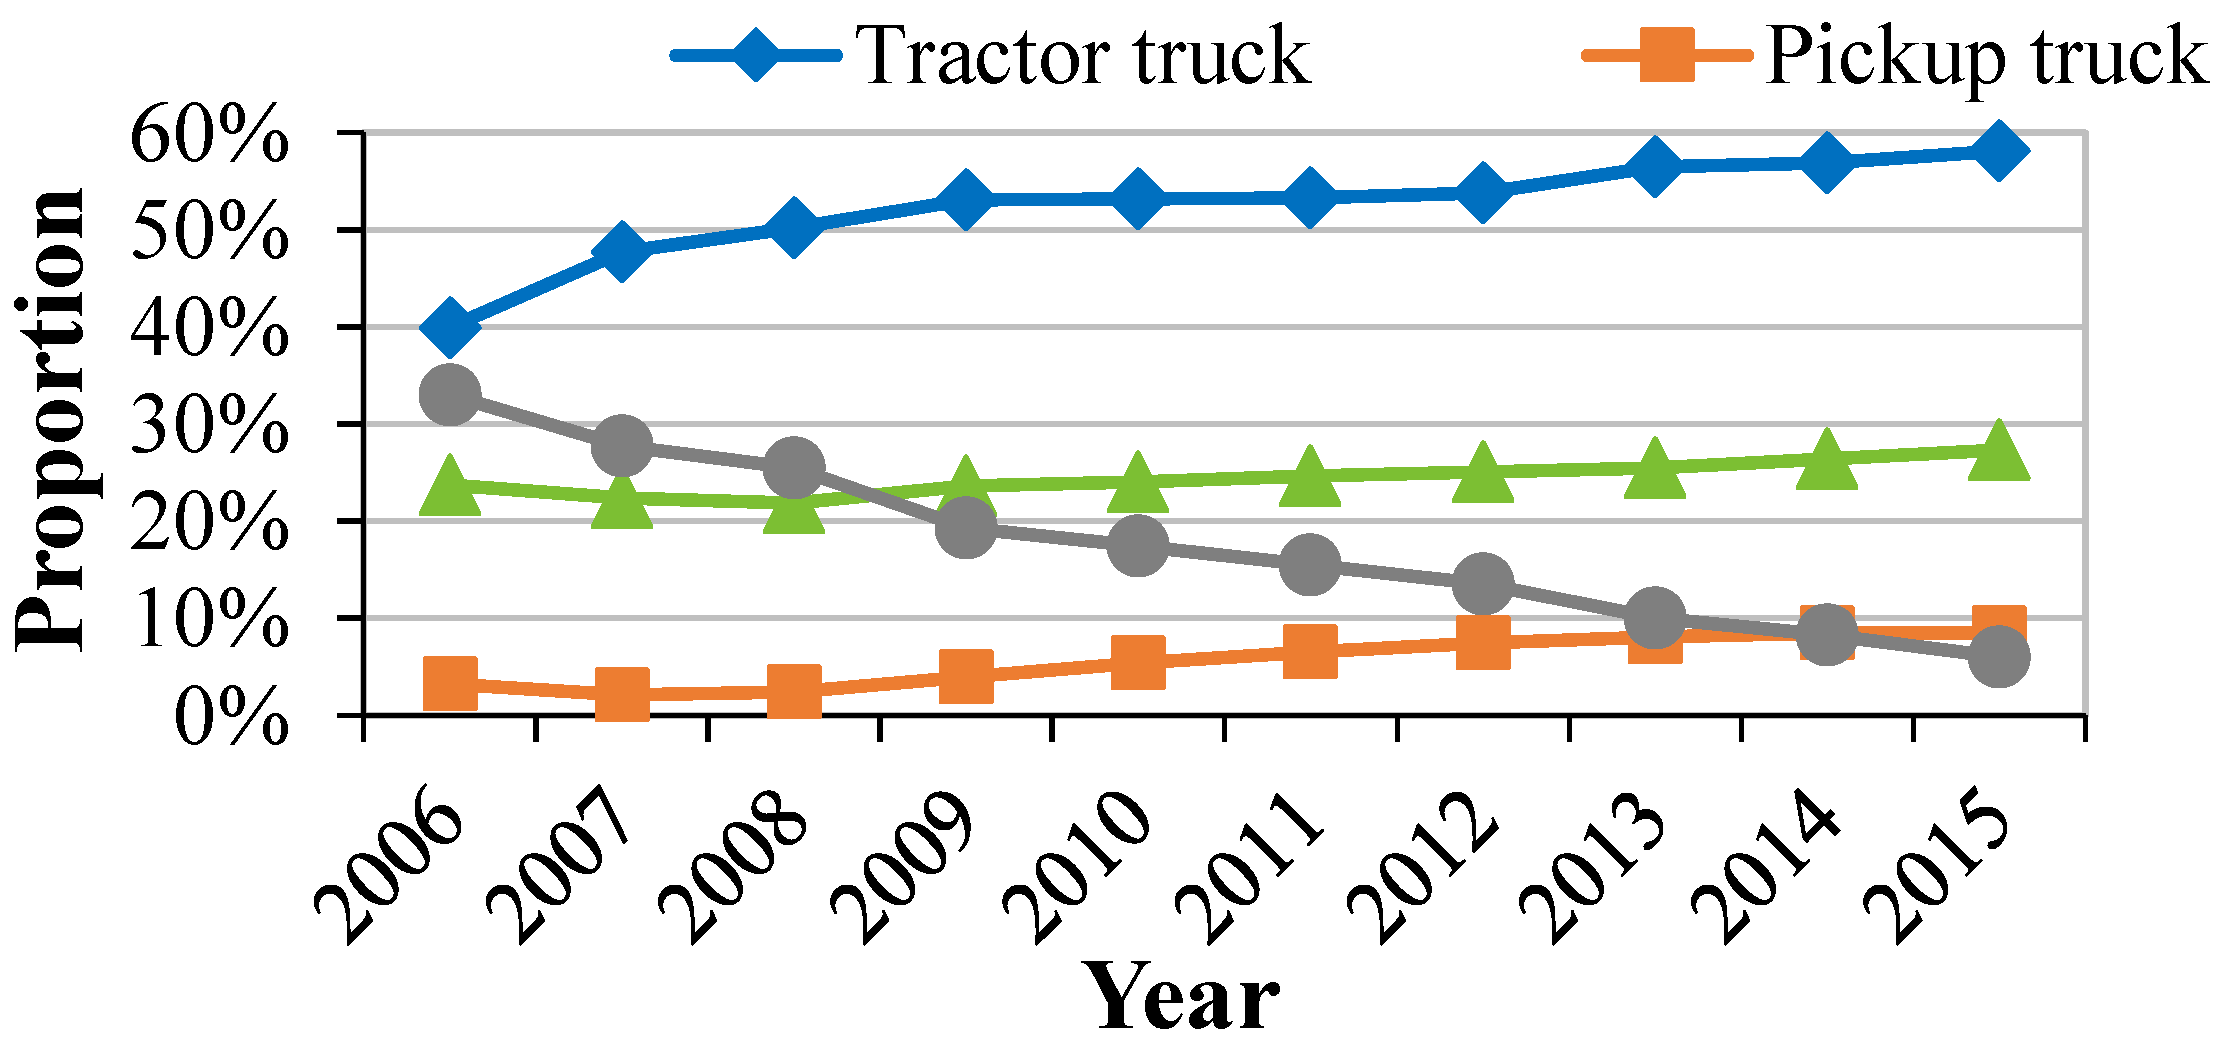
3.1.3. The Population of Different Types by Heavy-Duty Trucks

Figure 3 displays the population proportion of different types of heavy-duty trucks in Beijing-Tianjin-Hebei from 2006 to 2015. We found that the population of tractor trailers and pickup and special trucks presented a growth trend from 40.0%, 3.3%, and 24% in 2006 to 58.1%, 8.5%, and 27.3% in 2015, respectively. Further, the growth rate was 45.4%, 158.7%, and 15.3%, respectively. The dump vehicle shows an opposite trend over the last 10 years. In 2015, the population of the four types of heavy-duty trucks was 320,000, 47,000, 151,000, and 33,000, respectively, an increase compared with 2006, which saw population values of 308,000, 46,000, 144,000, and 23,000, respectively. Tractor trailers account for most of the market share of heavy-duty trucks, which is responsible for the growth.

3.2. GHG Emissions from Heavy-Duty Trucks

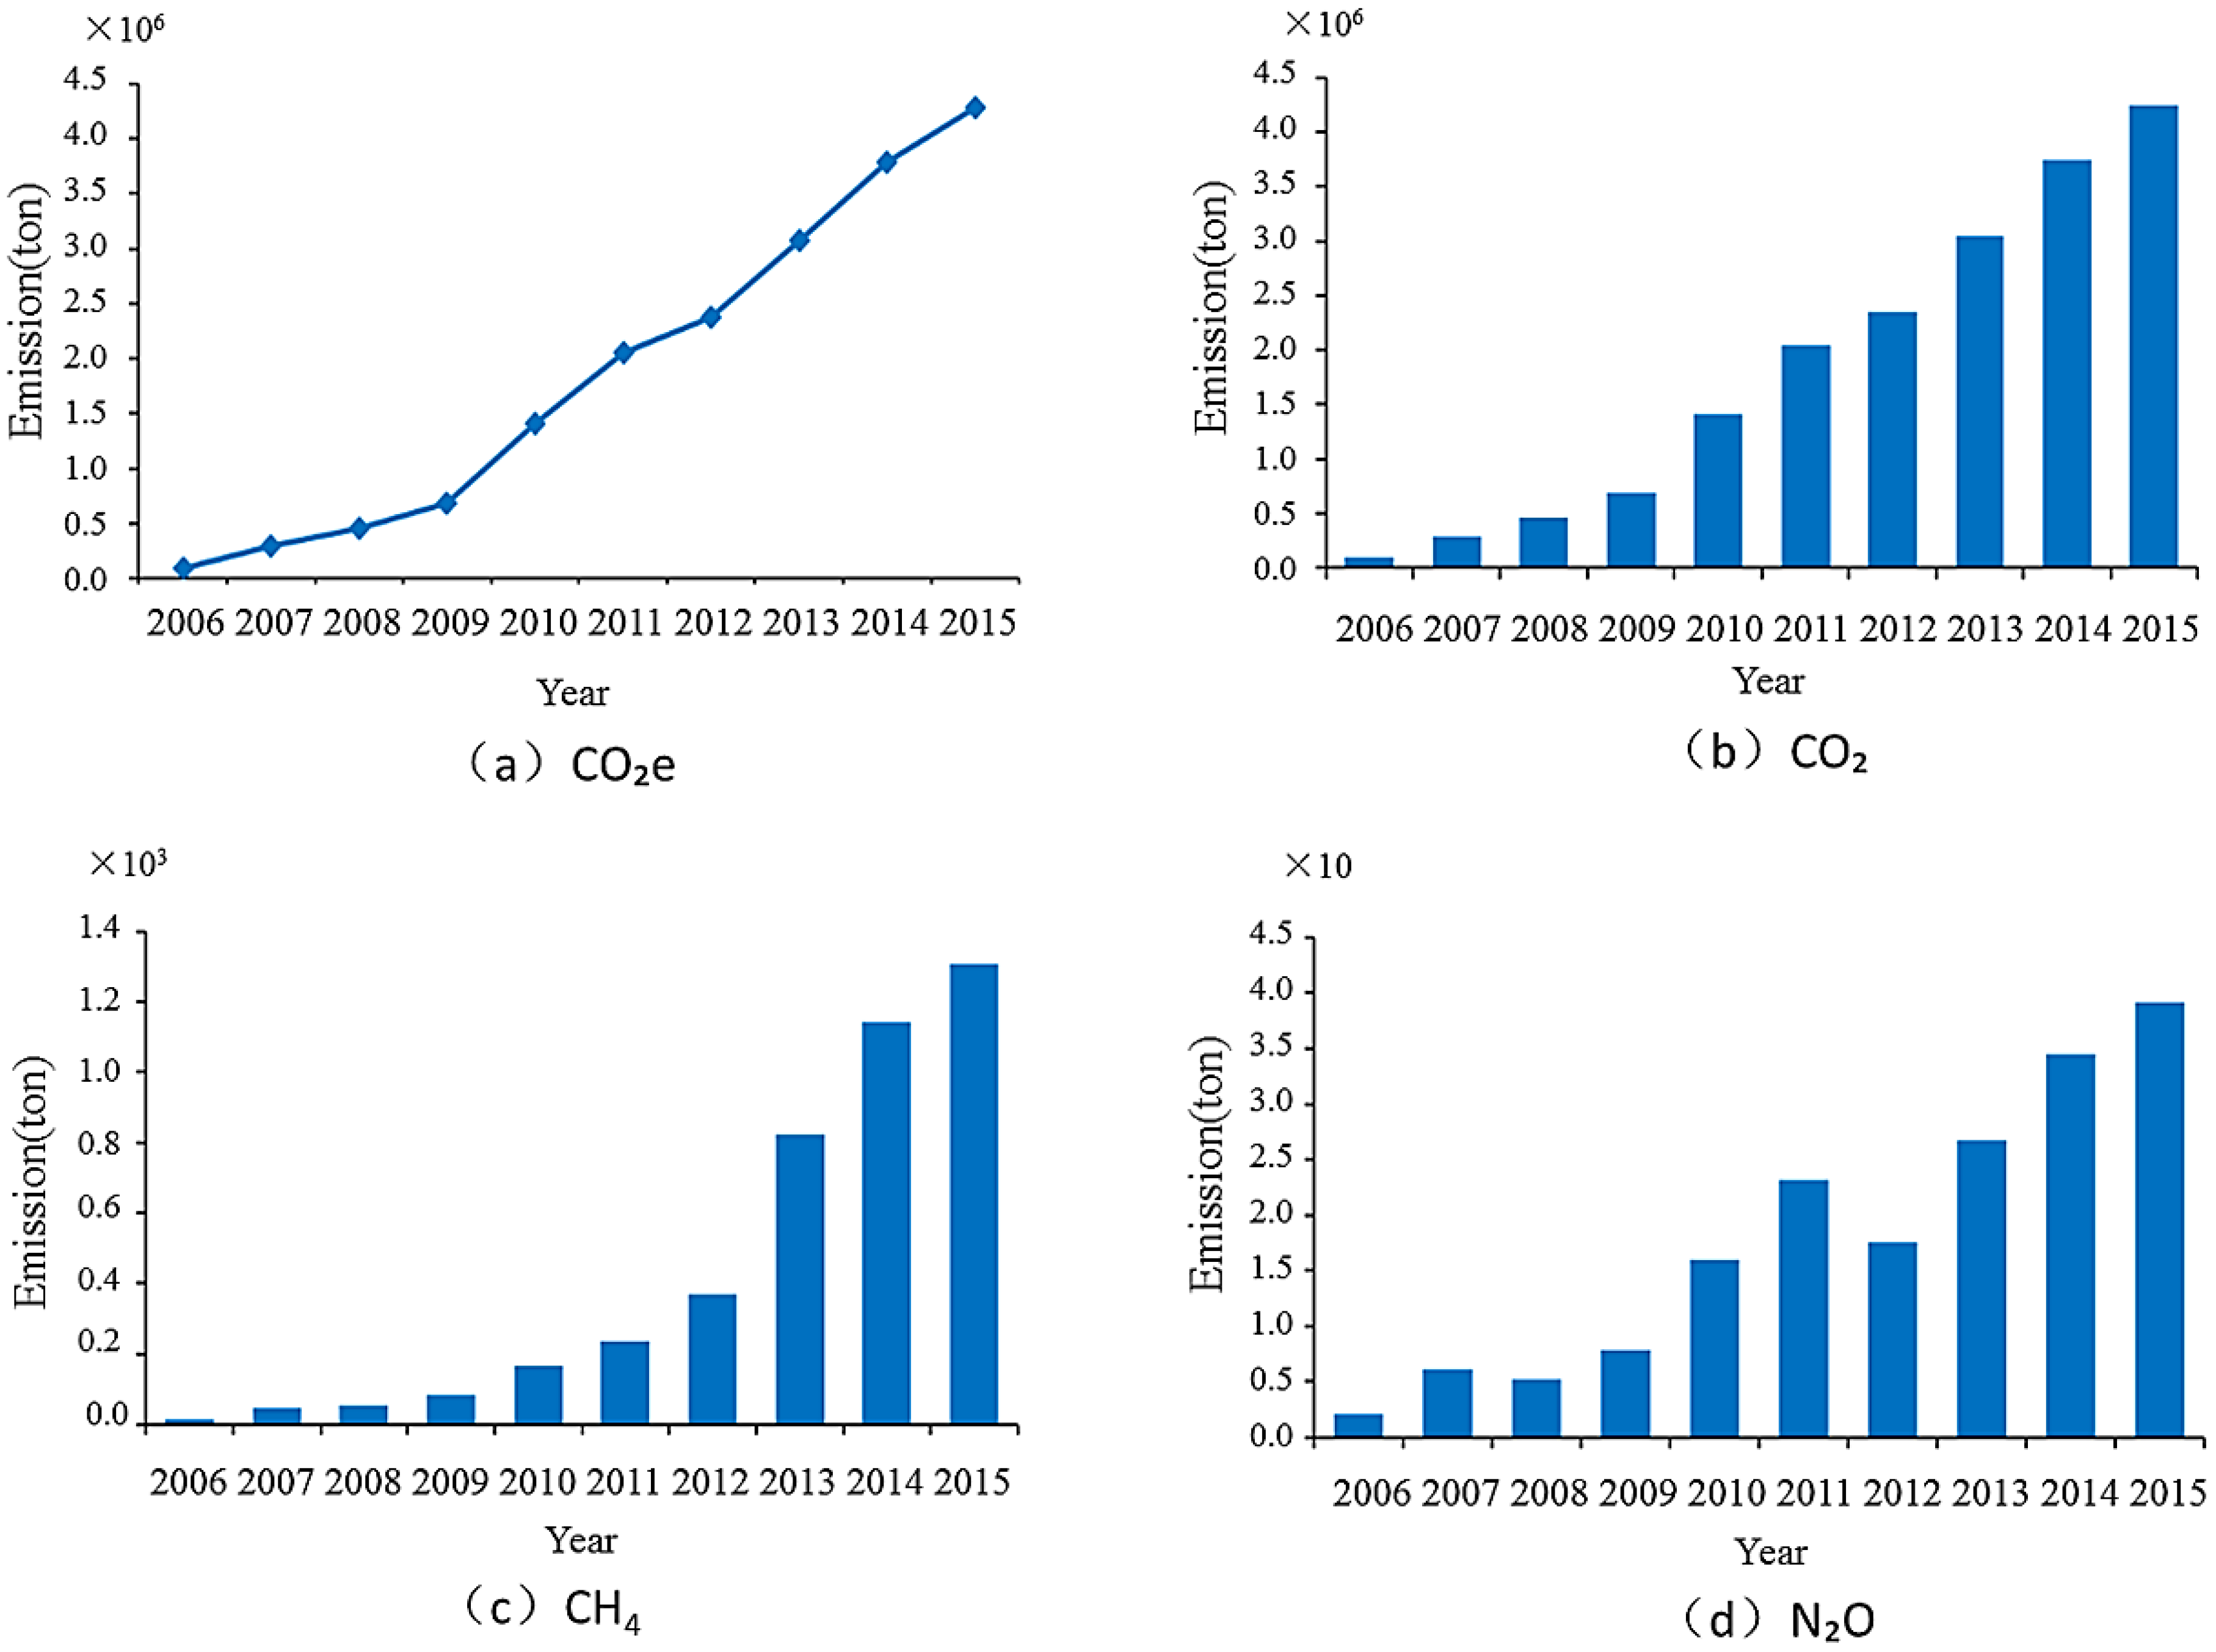
3.2.1. GHG Emissions from Heavy-Duty Trucks in Beijing

The emission trends of CO2e, CO2, CH4, and N2O in Beijing from 2006 to 2015 are shown in Figure 4. The CO2e is a measurement unit used to compare different greenhouse gases. To report GHG emissions on a CO2e basis, the resultant emissions for each of the GHGs are multiplied by their individual GWP (global warming potentials) and added. Further, the global warming potentials (GWPs) of CH4 and N2O are 25 and 298, respectively. A sharp increase can be observed between the years 2006 and 2011 (Figure 4a). During the year 2012, emissions slightly decreased from 3.3 × 10⁶ t to 3.1 × 10⁶ t. However, they started to increase again after 2012, and the emission amount reached 3.8 × 10⁶ t in the year 2015. The CO2 emissions show a similar trend with CO2e, experiencing three stages of increase, decrease, and increase, reaching 3.8 × 10⁶ t in the year 2015. As for the other two types of greenhouse gases, CH4 and N2O, annual emissions are also depicted in Figure 4c,d, respectively.
The data from Figure 4 indicate that the major contributor to GHG emissions could be CO2, and CH4 and N2O have little influence on the general emission trend of CO2e. It is obvious that the emission reduction occurs for both CH4 and N2O from 2011 to 2012, followed by an increasing trend from 2012 to 2015. The reason for this phenomena is the implementation of the higher-level and strict emission standard, national standard IV, in 2012. Moreover, the GHG emissions increased again with the population of heavy-duty trucks from 2012 to 2015 under the current standard.

3.2.2. GHG Emissions of Heavy-Duty Trucks in Tianjin

Different from the GHG emission trend in Beijing, a continuous increase of GHG emissions was observed in Tianjin. As show in Figure 5a, the emission amount of CO2e from heavy-duty trucks increases from 1.0 × 10⁶ t to 3.8 × 10⁶ t during the 2006–2015 period. The growth rate is about 37 times higher than that of the last decade. As a primary source for GHG emission, the emission of CO2 also presents a similar increasing trend compared to that of CO2e. The emission amount increased from 1.0 × 10⁶ t to 4.2 × 10⁶ t from 2006 to 2015. From Figure 5c, it can be observed that the emission amount of CH4 also exhibits a sharp increase with time, and the growth rate is about 80 times higher than that in the past ten years. There has been a dramatic increase in the emission of N2O from 2006 to 2015 that Figure 5d exhibits, despite the fluctuation. For example, the N2O emissions in 2015 is about 18 times higher than the emissions in 2006.

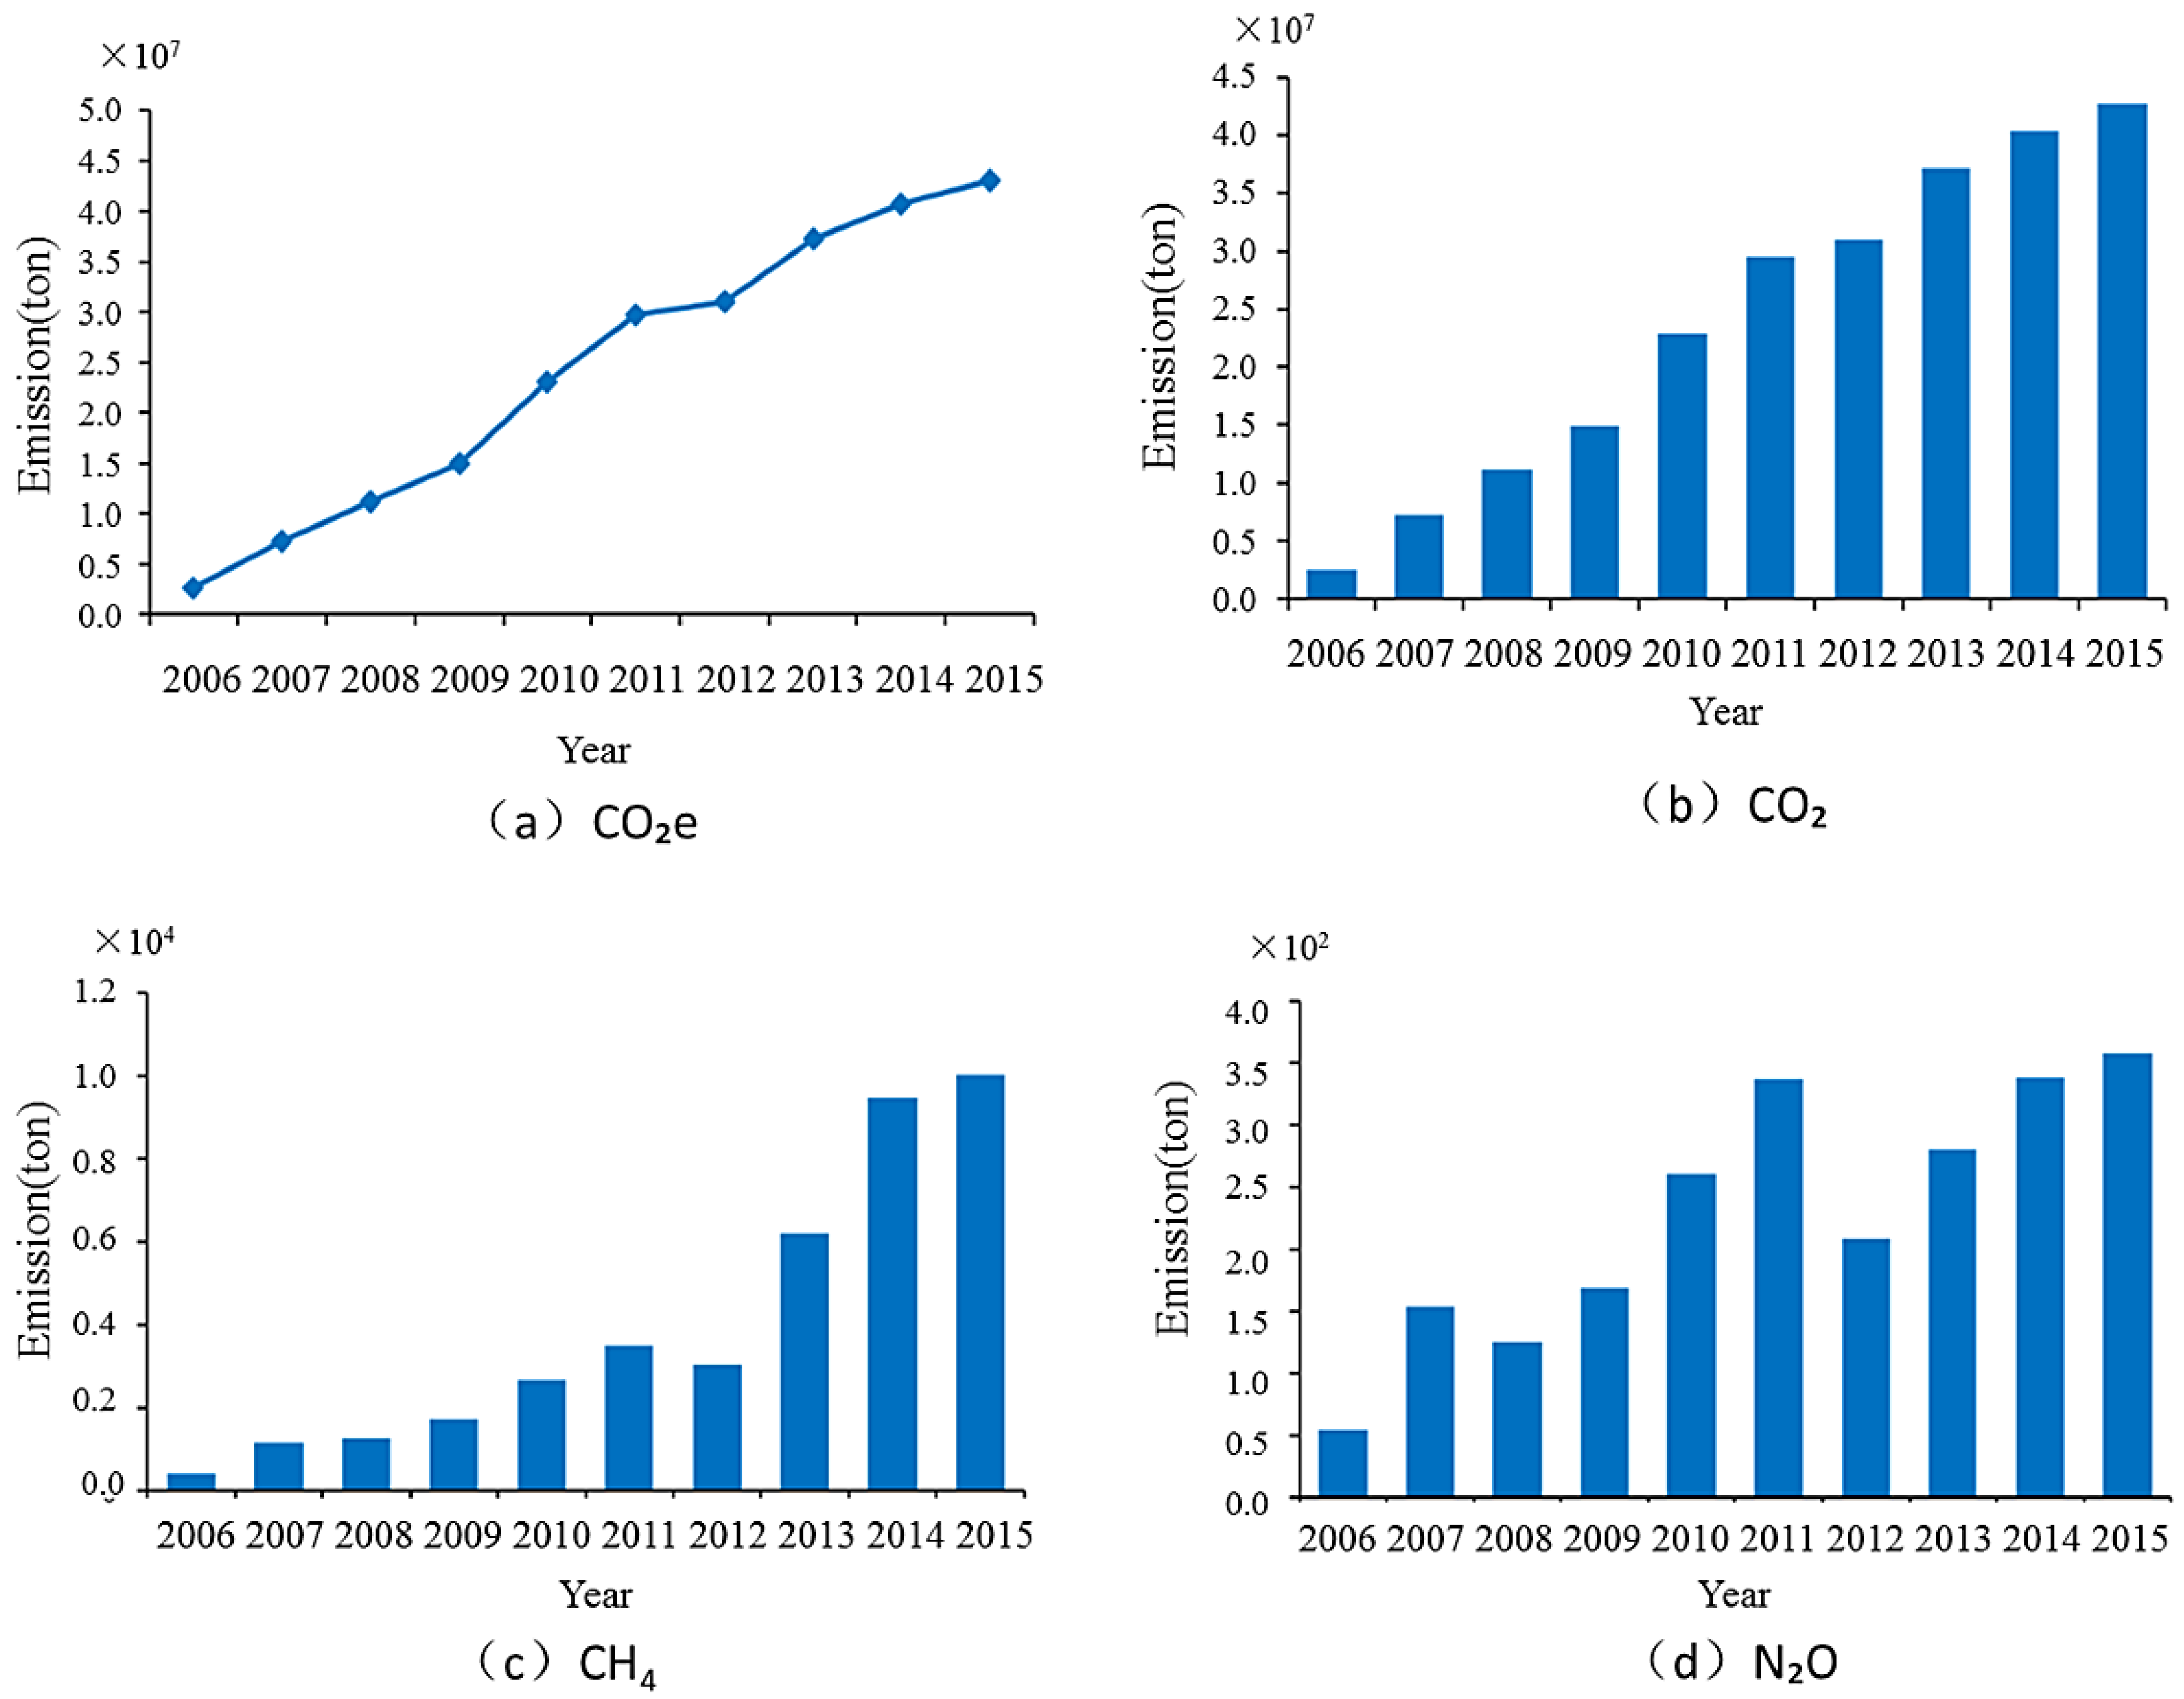
3.2.3. GHG Emissions of Heavy-Duty Trucks in Hebei

The emission trends of CO2e, CO2, CH4, and N2O from heavy-duty trucks in Hebei province are depicted in Figure 6. It can be seen that the emission amount of CO2e can be divided into two regimes: the fast growth period and the slow growth period. The emissions (CO2e) increased 11-fold, from 2.6 × 10⁶ t in 2006 to 3.0 × 10⁷ t in 2011. However, the emitted CO2e was up to 4.3 × 10⁶ t in 2015, which is only 1.4 times the emissions of the previous year. The emission of CO2 from the heavy-duty trucks in Hebei shows a similar trend to that of CO2e, and it also contributed more than 99% of total GHG emissions. Figure 6c shows the CH4 emission amount from heavy-duty trucks in Hebei province, which increased from 4.1 × 10⁵ t to 1.0 × 10⁷ t from 2006 to 2015. Different from CO2 and CH4, the emission amounts of N2O vary with time, and the annual average emission is about 2.28 × 10⁵ t.

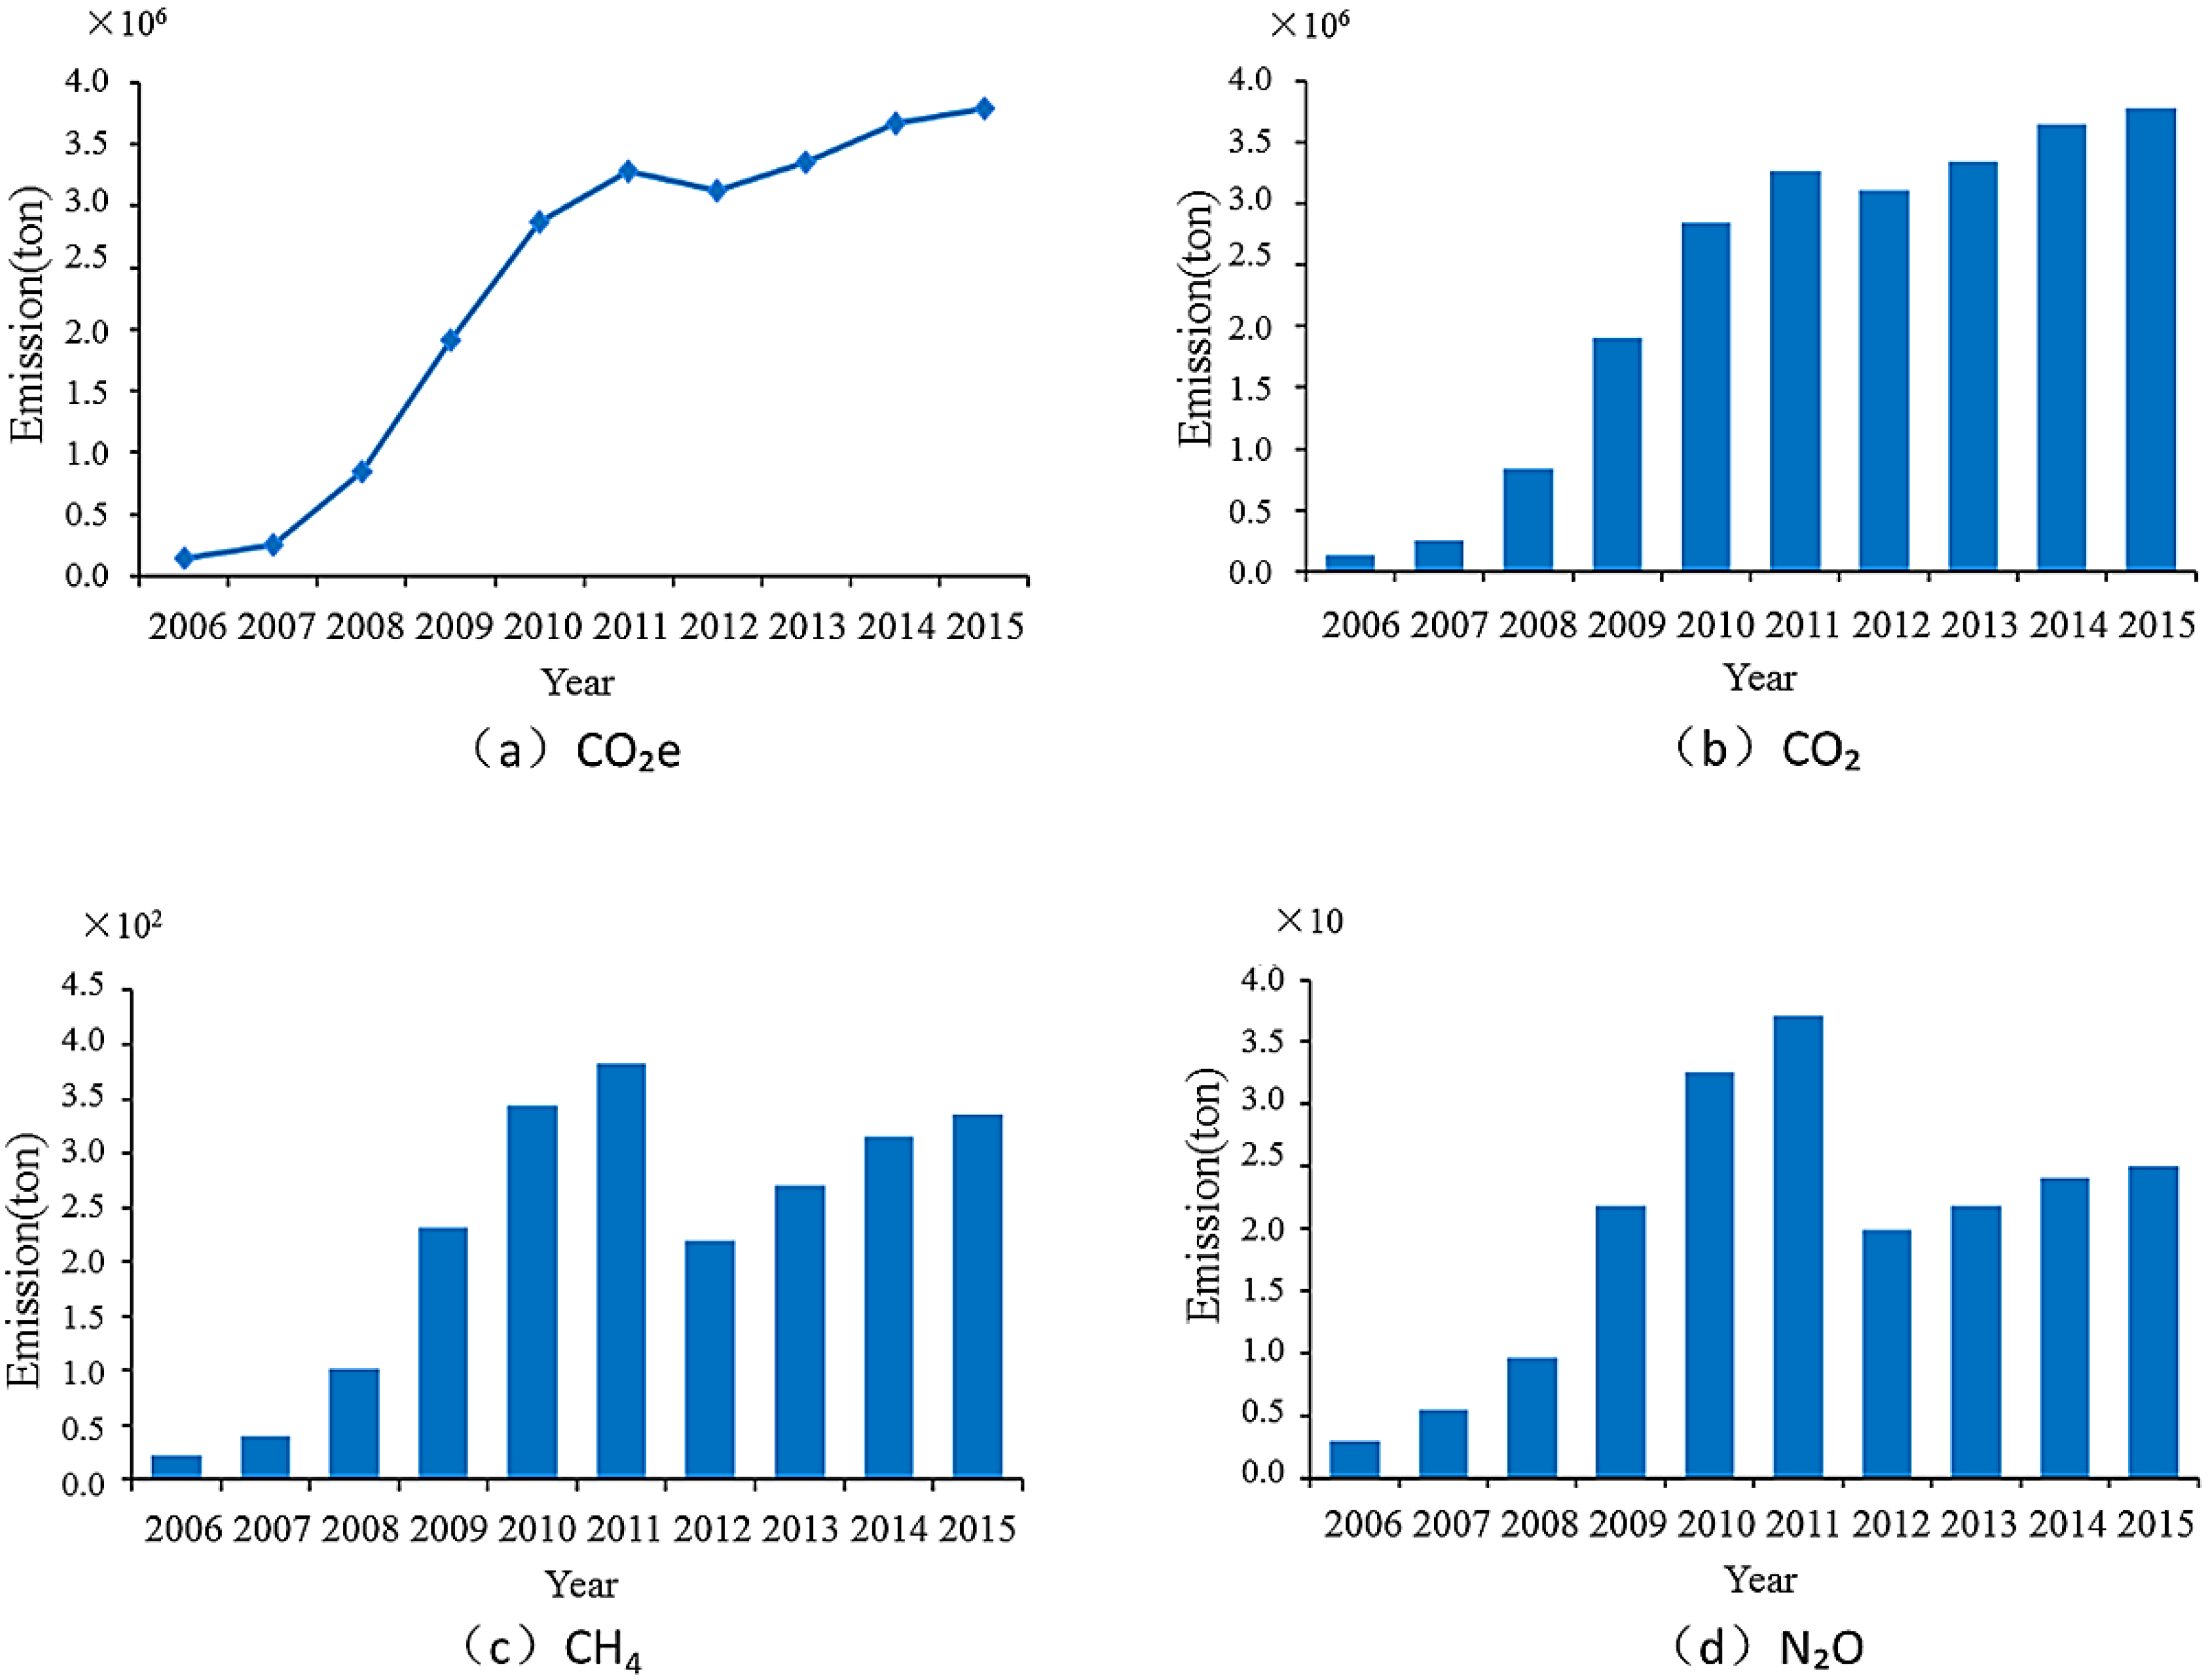
3.3. CO2e Emissions from Heavy-Duty Trucks

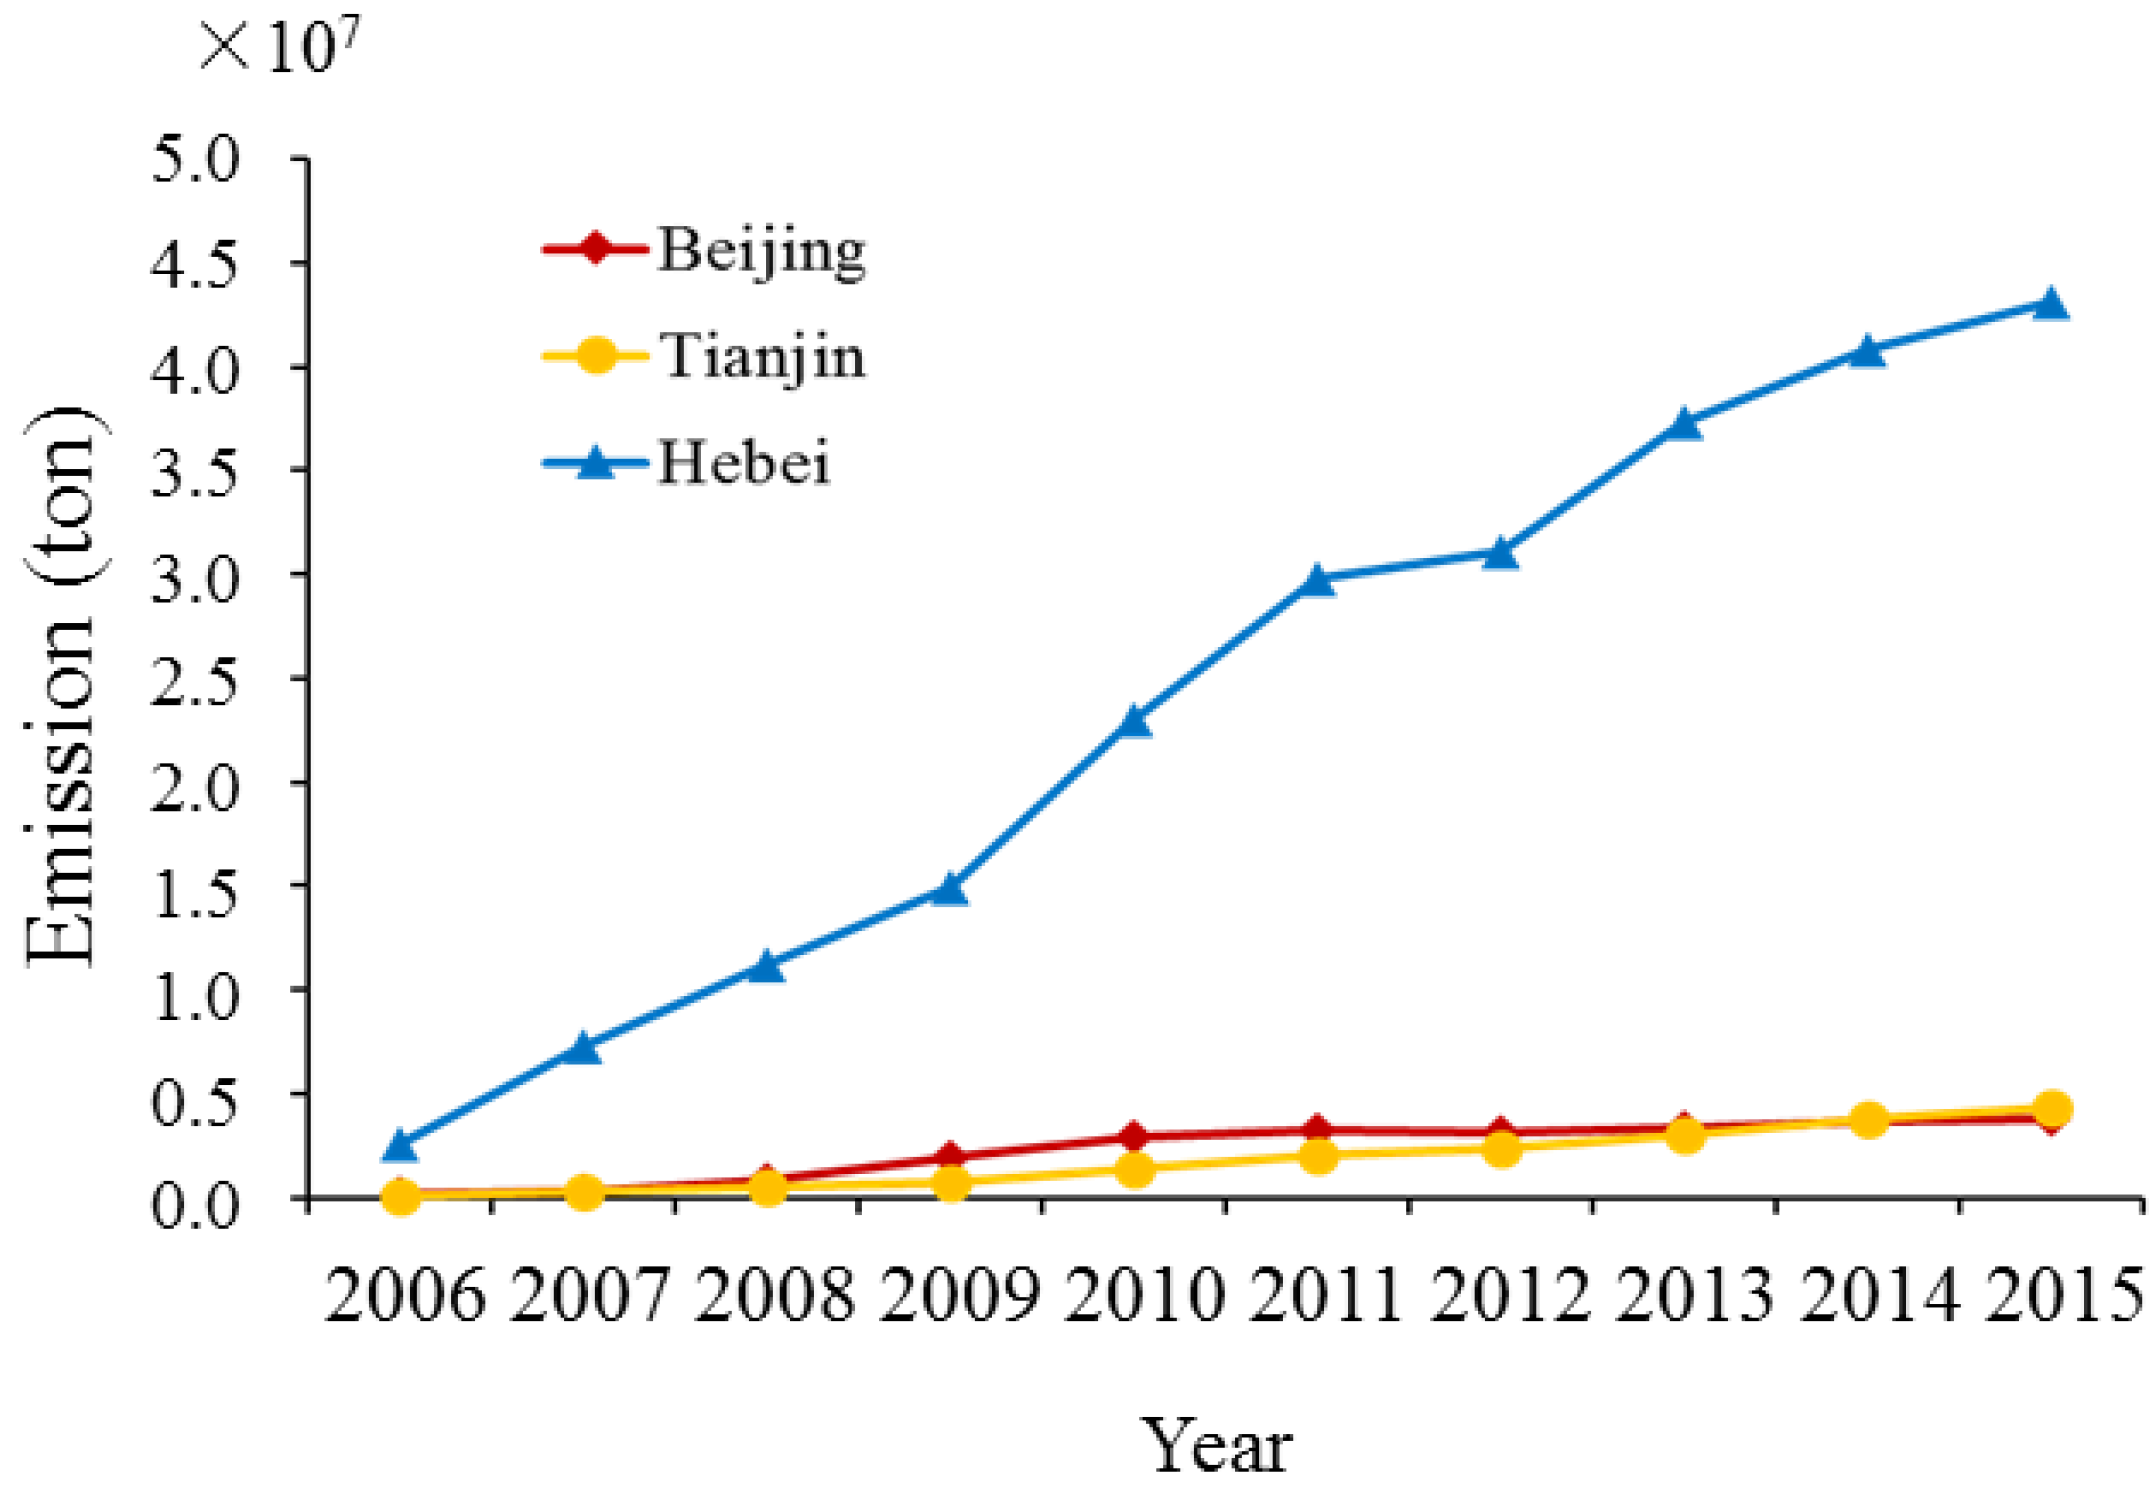
3.3.1. CO2e Emissions from Heavy-Duty Trucks in Different Regions

The CO2e emission trends in three different regions are shown in Figure 7. It can be observed that the total CO2e emission amount in the BTH region was about 5.1 × 10⁷ t in 2015. Hebei province has much higher GHG emissions than that of the other two regions. In the last five years, the CO2e emission amount average 3.6 × 10⁷ t in Hebei province, which is about 10 times higher than that in Beijing (3.4 × 10⁶ t) and Tianjin (3.4 × 10⁶ t). These results indicate that the major source of GHG emissions from heavy-duty trucks in the BTH region is in Hebei province, which is consistent with the population of heavy-duty trucks.

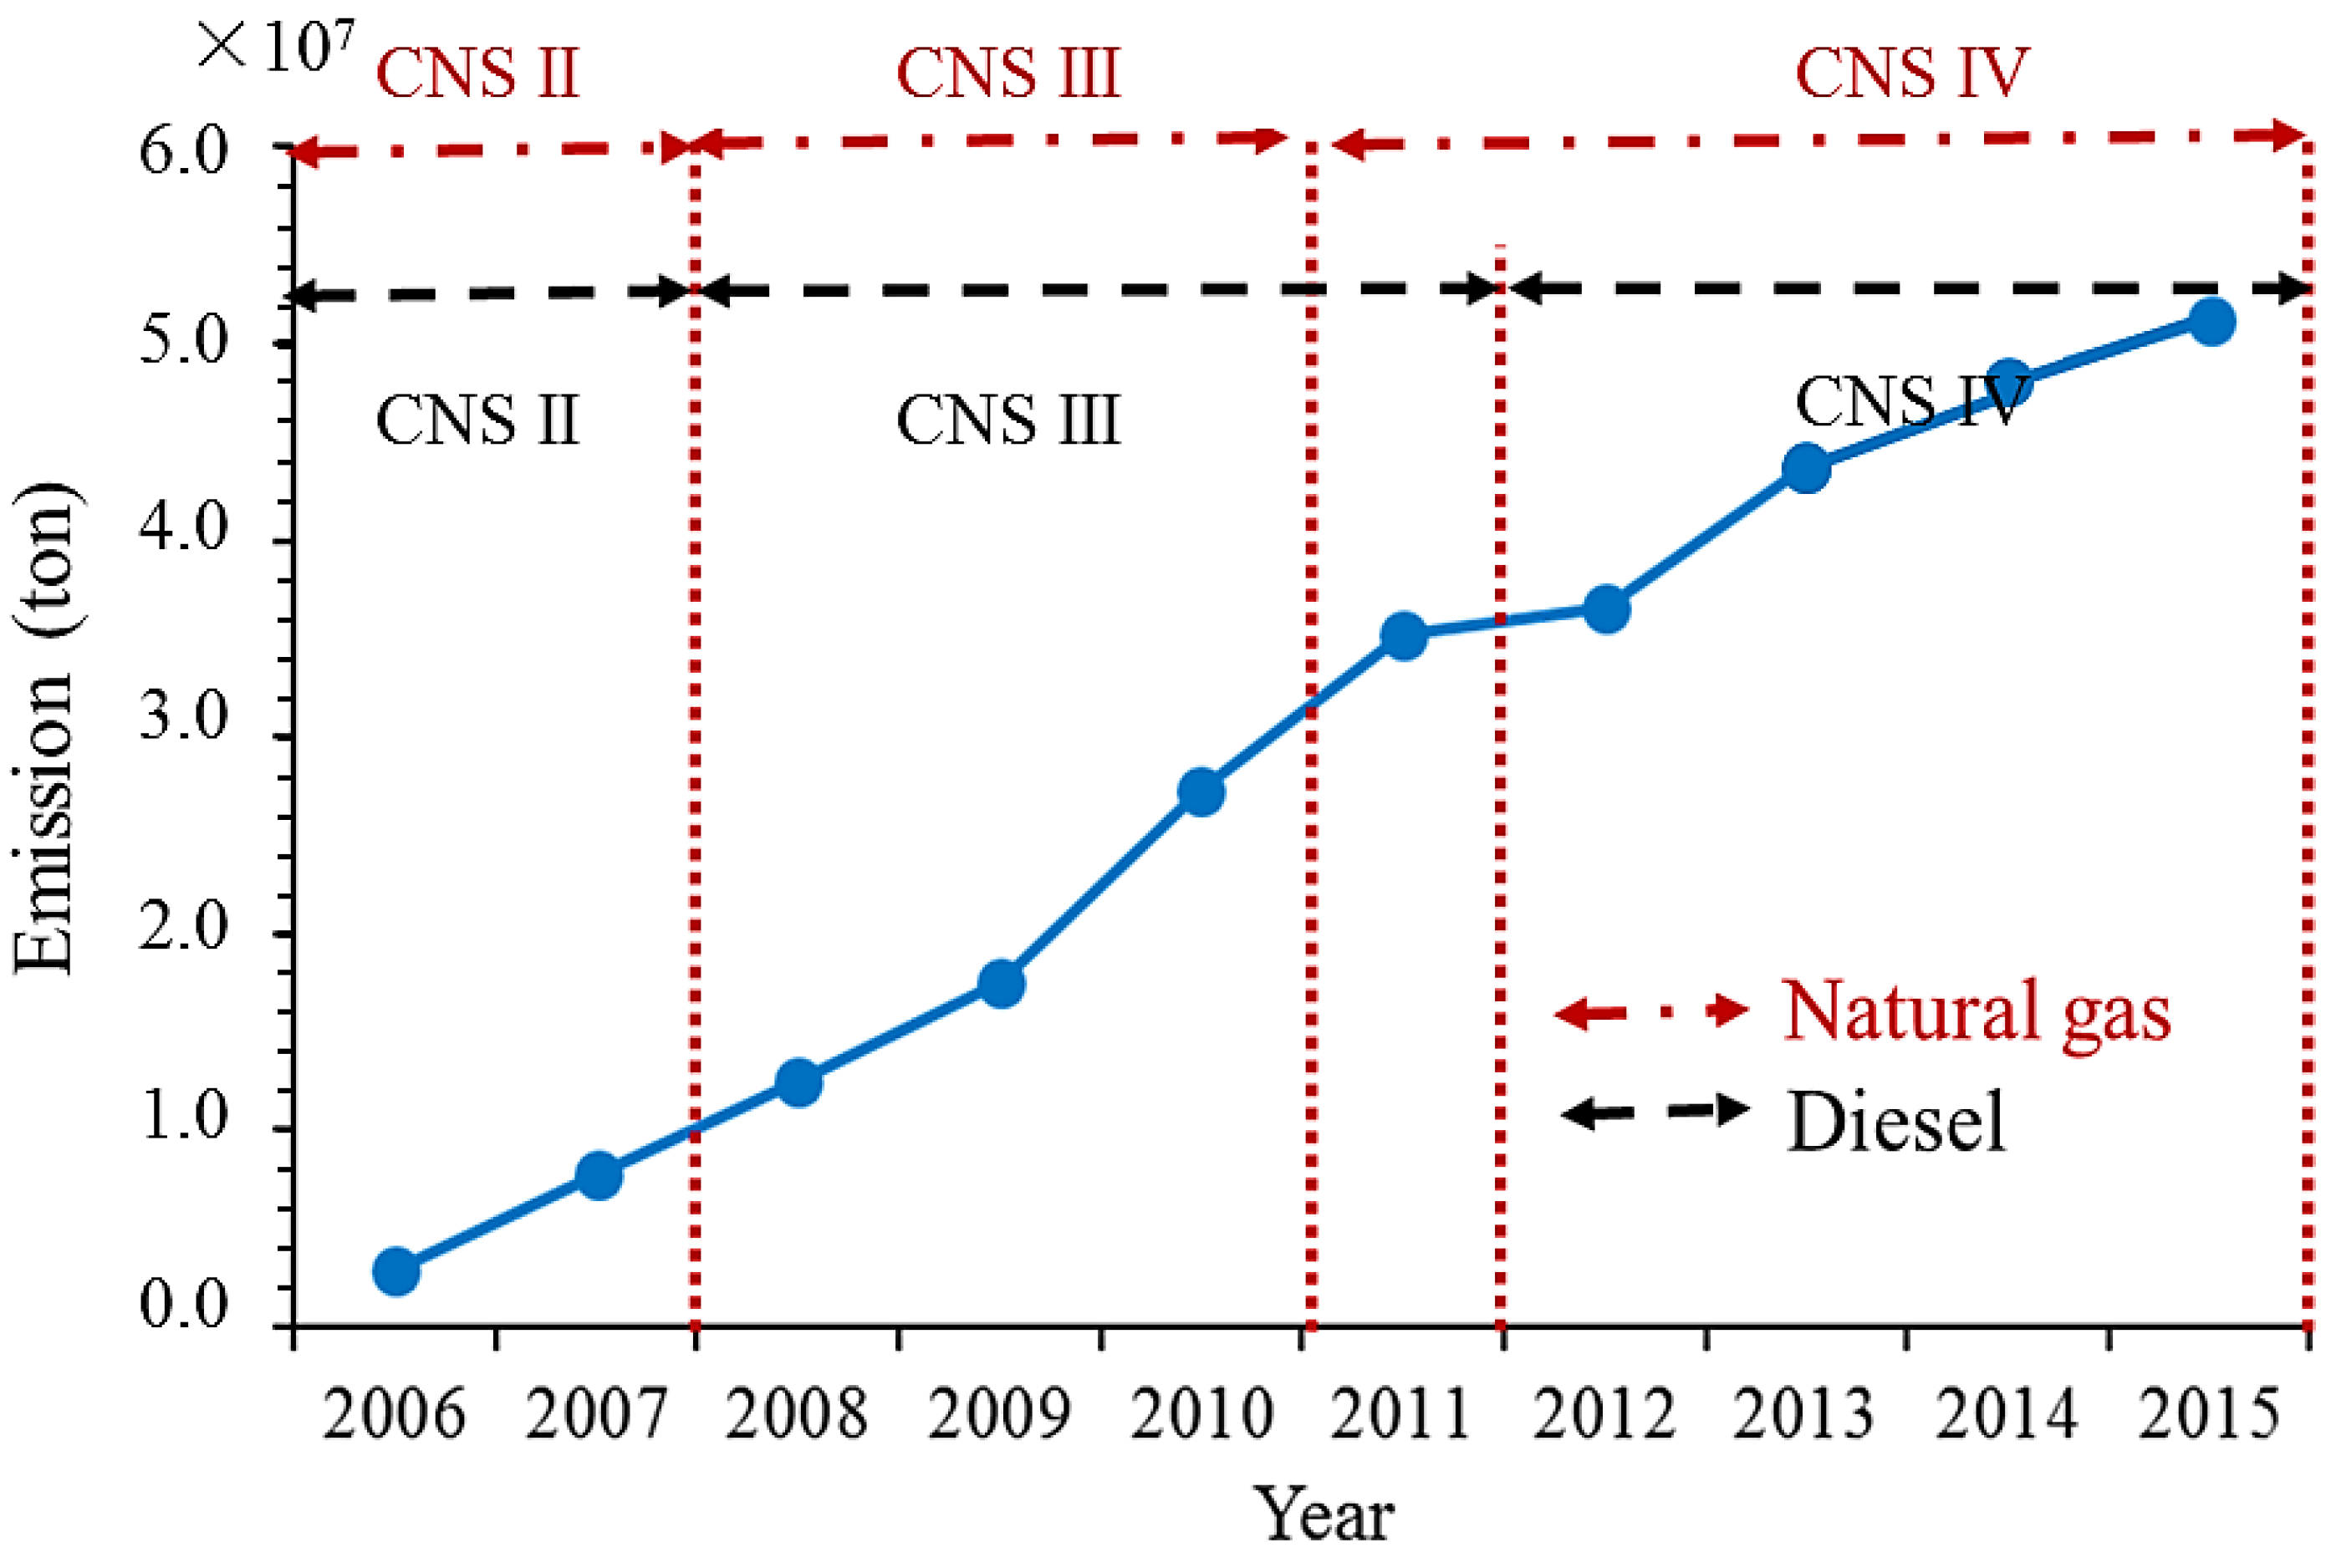
3.3.2. CO2e Emissions from Heavy-Duty Trucks under Different Emission Standards

The results of CO2e emissions from heavy-duty trucks under different emission standards in China (CNS) were calculated in terms of emission factors shown in Table 3.
Figure 8 shows the CO2e emissions of heavy-duty trucks under different emission standards in the BTH region. Under the national policy of CNS II to CNS IV, the emission factors of GHG from heavy-duty trucks powered by diesel and natural gas decline. From Figure 8, it can be observed that the CO2e emissions of heavy-duty trucks in the BTH region exhibits a significant increase from 2006 to 2011, and the difference is about 3.5 × 10⁷ t. It should be noted that the heavy-duty trucks fueled by LNG have been implemented by CNS IV in 2011. Nevertheless, the LNG-fueled heavy-duty trucks took only a small proportion (<0.2%) among all heavy-duty trucks and therefore had no significant impact on the CO2e emission. By contrast, the diesel-fueled heavy-duty trucks took a major proportion among all heavy-duty trucks and have greatly significant CO2e emissions. All these results demonstrate that it is practical and effective for the government to raise heavy-duty truck emission standards and eliminate low emission standard heavy-duty trucks to achieve the goal of GHG emission reductions.

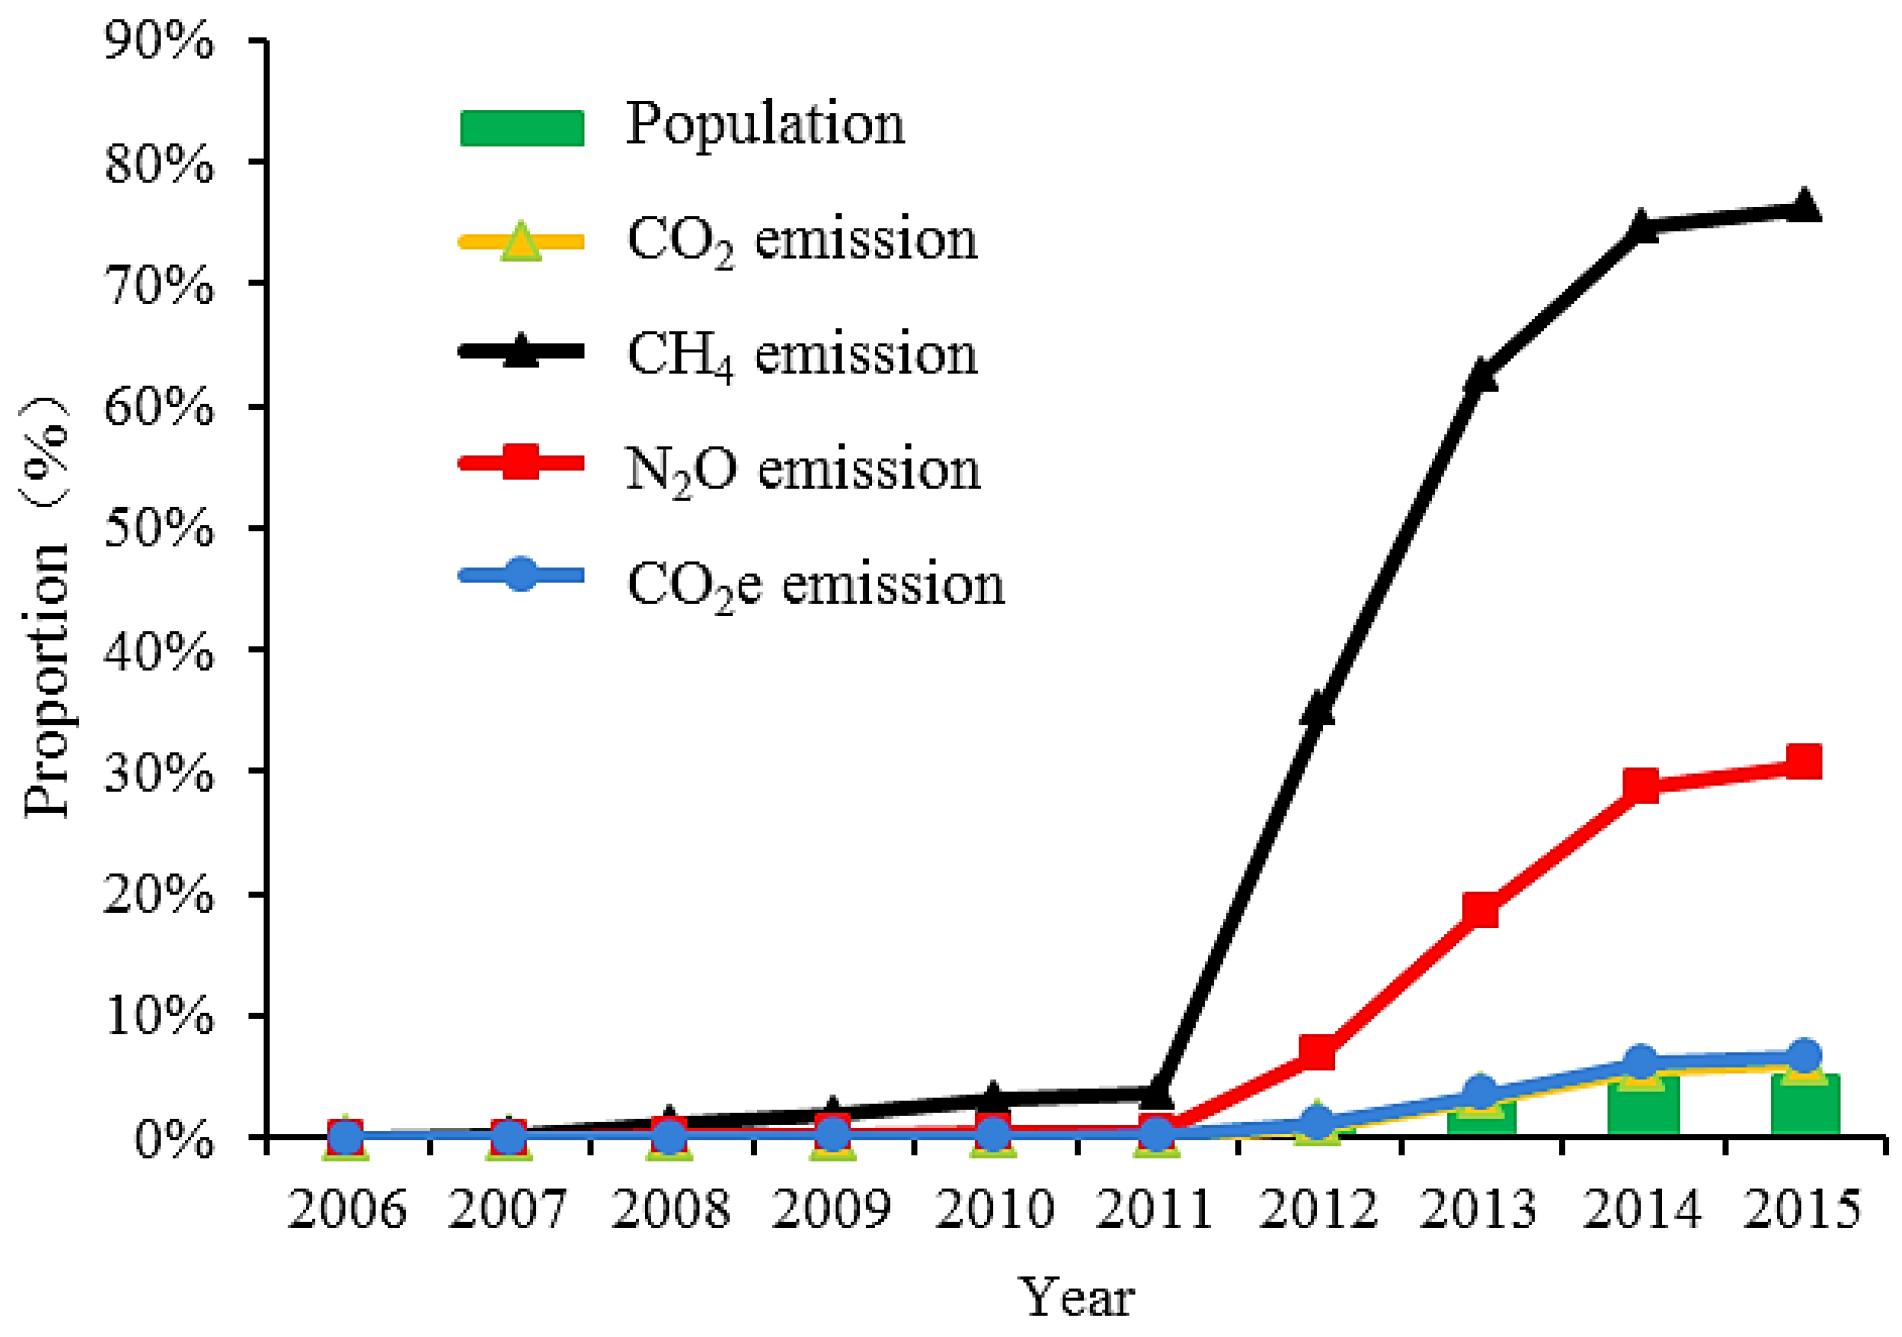
3.3.3. CO2e Emissions from Heavy-Duty trucks Powered by Natural Gas

Figure 9 illustrates the proportion of population, CO2, CH4, N2O, and CO2e emissions from heavy-duty trucks powered by natural gas in the BTH region. It was found that the CH4 and N2O emissions presented a remarkable increase with the heavy-duty truck population.
At the same time, CO2 and CO2e emissions show similar trends with population. For example, the population proportion of natural-gas-powered heavy-duty trucks is 1.1% in 2012, 3.1% in 2013, 5.0% in 2014, and 5.1% in 2015, respectively. Correspondingly, the CO2e emission proportion in these years is 1.2%, 3.4%, 5.4%, and 5.5%, respectively.
We can deduce that the fuel of LNG does not completely combust with the current engine technology, which leads to more exhaust methane emissions than does diesel. Additionally, the greenhouse effect of methane is 25 times more than carbon dioxide. Although carbon dioxide has been significantly reduced with alternative fuels such as LNG, the CO2e emissions cannot correspondingly decline in terms of more methane emissions and its greenhouse effect. Therefore, we can conclude that the widespread utilization of the alternative fuel of LNG to mitigate emissions must be accompanied with engine technology development.

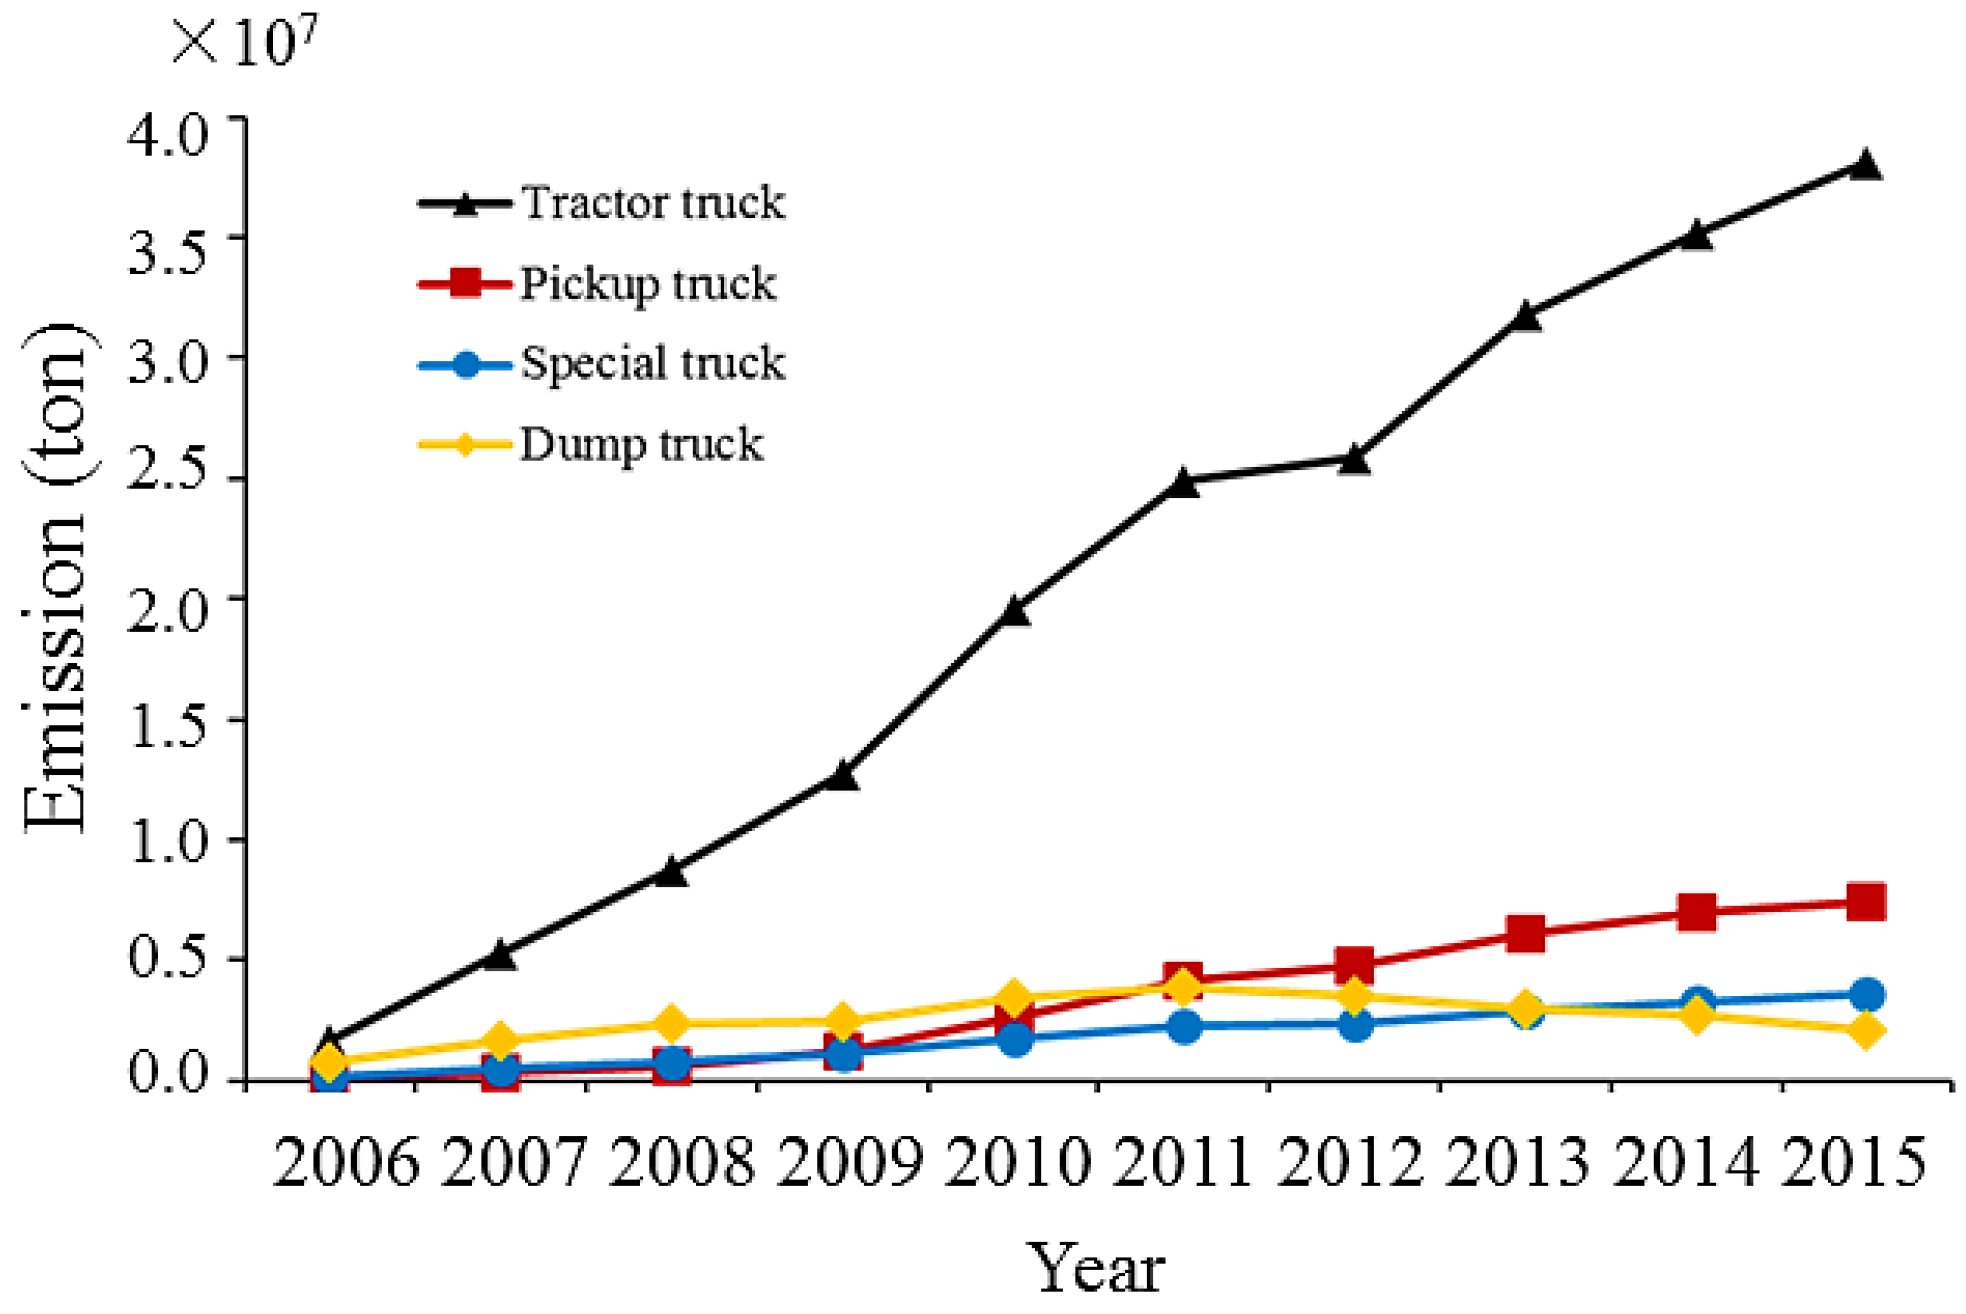
3.3.4. CO2e Emissions from Different Types of Heavy-Duty Trucks

The CO2e emissions from the four types of heavy-duty trucks were compared in Figure 10. It is evident that the CO2e emissions from the four types of heavy-duty trucks present increasing trends with time. Particularly, the emissions from tractor trailers represent a great proportion of all CO2e emissions—about 74% in the year 2015. In comparison, the CO2e emissions from pickup trucks, special trucks and dump trucks only represents a proportion of 15%, 7%, and 4%, respectively.

3.4. Uncertainty Analysis

The uncertainty analysis is needed because of different activity levels and emission factors for each species under each standard. The estimated average annual mileage is from a practical investigation of four companies that are together the main producers of heavy-duty trucks in China and set as constant. Emission factors are from the survey and calculation results are via the COPERT IV model. Therefore, we set them as variables.
There are three procedures for calculating the uncertainty of each emission species. At first, the probability density function of emission factor is obtained by Equations (2) and (3).
f ( x | μ , σ ) = 1 σ 2 π exp ( ( ln x μ ) 2 2 σ 2 ) x
μ = ln ( x ¯ )
where x is the probability value of emission factor, x ¯ is the value of the calculated emission factor, f is the probability of x , μ is the logarithmic mean of input information, and σ is the standard deviation of logarithmic x . In addition, a Monte Carlo simulation with a 95% confidence interval was carried out with the input of the probability density function of the emission factor [43]. At last, we output the probability density function of each emission species after 10,000 calculations.
The results show that the relative error for the uncertainty of CO2 emissions is −12.42%~12.71% with diesel and −51.37%~53.58% with LNG. The relative error for the uncertainty of CH4 emissions is −8.75%~8.09% with diesel and −75.73%~74.55% with LNG. The relative error for the uncertainty of N2O emissions is −6.76%~6.96% with diesel and −10.16%~10.09% with LNG.
The relative errors with LNG are generally higher than with those with diesel because there are gaps between the values of the LNG emission factor from different sources. Moreover, the uncertainties of the CO2 and CH4 emissions with LNG are remarkable due to the difficulties of data acquisition. As long as accuracy increases for the CH4 and CO2 emission factor with LNG in the future, the results will become more reliable and credible.

4. Conclusions

In recent years, the BTH region has been seriously affected by air pollution, and there has been significant pressure to improve the urban environment quality and mitigate vehicle emission. In this study, the population as well as the GHG emission inventories from 2006 to 2015 in Beijing, Tianjin, and Hebei were estimated and analyzed.
It was found that the population of heavy-duty trucks in the BTH region increased for ten consecutive years, from 30,000 in 2006 to 551,000 in 2015. The population of heavy-duty trucks in Hebei province is much higher than the other two regions, which is eight times that of Beijing and nine times that of Tianjin. As a result, the GHG emissions in Hebei province is also about 10 times higher than that of Beijing and Tianjin. Among these GHG emissions, CO2 emissions are the primary source.
The population of natural-gas-powered heavy-duty trucks exhibits a marked increase since 2012 in meeting global energy demand. The analysis of GHG emissions from diesel- and LNG-powered heavy-duty trucks under different emission standards demonstrates that the implementation of more and stringent emission standards can effectively reduce GHG emissions. Under the current national standard IV, the widespread utilization of the alternative fuel of LNG to mitigate emissions must be accompanied with engine technology development.
The population of tractor trailers, pickup trucks, and special trucks have risen every year since 2008 and reached 58.1%, 8.5%, and 27.3% in 2015, respectively. The emissions from tractor trailers represent the most significant proportion of total CO2e emissions, which is about 74%.
In general, this study provides quantitative and scientific support for the management of trucks and more effective strategies of emission control.

Acknowledgments

We gratefully acknowledge the National Nature Science Foundation of China under Grant 51404024 for financial support.

Author Contributions

Yi Xing and Mingxu Yu were in charge of data analysis and drafting. Hongqing Song proposed this topic and supervised the work. Cheng Wang, Yang Zhou and Guanghui Liu collected and provided the actual data. Li Du polished the manuscript. All authors read and approved the final manuscript.

Conflicts of Interest

The authors declare no conflict of interest.

References

  1. Kadiyala, A.; Kumar, A. An examination of the sensitivity of sulfur dioxide, nitric oxide, and nitrogen dioxide concentrations to the important factors affecting air quality inside a public transportaion bus. Atmosphere 2012, 3, 266–287. [Google Scholar] [CrossRef]
  2. Rafaj, P.; Cofala, J.; Kuenen, J.; Wyrwa, A.; Zyśk, J. Benefits of European climate policies for mercury air pollution. Atmosphere 2014, 5, 45–59. [Google Scholar] [CrossRef] [Green Version]
  3. Liu, D.; Lei, L.P.; Guo, L.J.; Zeng, Z.C. A cluster of CO2 change characteristics with GOSAT observations for viewing the spatial pattern of CO2 emission and absorption. Atmosphere 2015, 6, 1695–1713. [Google Scholar] [CrossRef]
  4. Hetem, I.G.; Andrade, M.F. Characterization of fine particulate matter emitted from the resuspension of road and pavement dust in the metropolitan area of São Paulo, Brazil. Atmosphere 2016. [Google Scholar] [CrossRef]
  5. Robbins, A.J. How to understand the results of the climate change summit: Conference of Parties21 (COP21) Paris 2015. J. Public Health Policy 2016. [Google Scholar] [CrossRef] [PubMed]
  6. Klimenko, V.V.; Mikushina, O.V.; Tereshin, A.G. The 2015 Paris climate conference: A turning point in the world’s energy history. Dokl. Phys. 2016, 61, 301–304. [Google Scholar] [CrossRef]
  7. National Bureau of Statistics of China (NBSC). China Statistical Yearbook; China Statistics Press: Beijing, China, 2015. (in Chinese)
  8. Progiou, A.G.; Ziomas, I.C. Road traffic emissions impact on air quality of the greater Athens area based on a 20year emissions inventory. Sci. Total Environm. 2011, 410, 1–7. [Google Scholar] [CrossRef] [PubMed]
  9. Wang, H.; Chen, C.; Huang, C.; Fu, L. On-road vehicle emission inventory and its uncertainty analysis for Shanghai, China. Sci. Total Environm. 2008, 398, 60–67. [Google Scholar] [CrossRef] [PubMed]
  10. Arteconi, A.; Polonara, F. LNG as vehicle fuel and the problem of supply: The Italian case study. Energy Policy 2013, 62, 503–512. [Google Scholar] [CrossRef]
  11. Babaee, S.; Nagpure, A.S.; DeCarolis, J.F. How much do electric drive vehicles matter to future U.S. emissions? Environm. Sci. Technol. 2014, 48, 1382–1390. [Google Scholar] [CrossRef] [PubMed]
  12. Engerer, H.; Horn, M. Natural gas vehicles: An option for Europe. Energy Policy 2010, 38, 1017–1029. [Google Scholar] [CrossRef]
  13. Askin, A.C.; Barter, G.E.; West, T.H.; Manley, D.K. The heavy-duty vehicle future in the United States: A parametric analysis of technology and policy tradeoffs. Energy Policy 2015, 81, 1–13. [Google Scholar] [CrossRef]
  14. Bielaczyc, P.; Woodburn, J.; Szczotka, A. An assessment of regulated emissions and CO2 emissions from a European light-duty CNG-fueled vehicle in the context of European 6 emissions regulations. Appl. Energy 2014, 117, 134–141. [Google Scholar] [CrossRef]
  15. Curran, S.J.; Wagner, R.M.; Graves, R.L.; Keller, M.; Green, J.B. Well-to-wheel analysis of direct and indirect use of natural gas in passenger vehicles. Energy 2014, 75, 194–203. [Google Scholar] [CrossRef]
  16. Kakaee, A.H.; Paykani, A. Research and development of natural-gas fueled engines in Iran. Renew. Sustain. Energy Rev. 2013, 26, 805–821. [Google Scholar] [CrossRef]
  17. Kirk, J.L.; Bristow, A.L.; Zanni, A.M. Exploring the market for compressed natural gas light commercial vehicles in the United Kingdom. Transp. Res. Part D: Transp. Environ. 2014, 29, 22–31. [Google Scholar] [CrossRef] [Green Version]
  18. Martins, A.A.; Rocha, R.A.D.; Sodré, J.R. Cold start and full cycle emissions from a flexible fuel vehicle operating with natural gas, ethanol and gasoline. J. Nat. Gas Sci. Eng. 2014, 17, 94–98. [Google Scholar] [CrossRef]
  19. Zhang, C.; Xie, Y.; Wang, F.; Ma, Z.; Qi, D.; Qiu, Z. Emission comparison of light-duty in-use flexible-fuel vehicles fuelled with gasoline and compressed natural gas based on the ECE 15 driving cycle. J. Automob. Eng. 2011, 225, 90–98. [Google Scholar] [CrossRef]
  20. Rose, L.; Hussain, M.; Ahmed, S.; Malek, K.; Costanzo, R.; Kjeang, E. A comparative life cycle assessment of diesel and compressed natural gas powered refuse collection vehicles in a Canadian city. Energy Policy 2013, 52, 453–461. [Google Scholar] [CrossRef]
  21. Aslam, M.; Masjuki, H.; Kalam, M.; Abdesselam, H.; Mahlia, T.; Amalina, M. An experimental investigation of CNG as an alternative fuel for a retrofitted gasoline vehicle. Fuel 2006, 85, 717–724. [Google Scholar] [CrossRef]
  22. Jayaratne, E.; Ristovski, Z.; Meyer, N.; Morawska, L. Particle and gaseous emissions from compressed natural gas and ultralow sulphur diesel-fuelled buses at four steady engine loads. Sci. Total Environ. 2009, 407, 2845–2852. [Google Scholar] [CrossRef] [PubMed] [Green Version]
  23. China Ministry of Environmental Protection General Office (CMEPGO). Reply by Letter of Implement Date of National IV Emission Limit of Vehicle. Available online: http://www.caam.org. cn/xiehuidongtai/20101227/1705050480.html2010 (accessed on 13 September 2016).
  24. Pan, X.; Yue, W.; He, K.; Tong, S. Health benefit evaluation of the energy use scenarios in Beijing, China. Sci. Total Environ. 2007, 374, 242–251. [Google Scholar] [CrossRef] [PubMed]
  25. Tang, B.; Zheng, Q. Analysis of economy prompting policy for hybrid power vehicles of China. Chin. Energy 2011, 33, 24–29. (In Chinese) [Google Scholar]
  26. Si, K. Developing diesel vehicles in China is very important to abate energy usage and reduce air pollution emission. Transpoworld 2008, 16, 22–25. [Google Scholar]
  27. Song, S.; Wu, Y.; Jiang, J.; Yang, L.; Cheng, Y.; Hao, J. Chemical characteristics of size-resolved PM2.5 at a roadside environment in Beijing, China. Environ. Pollut. 2012, 161, 215–221. [Google Scholar] [CrossRef] [PubMed]
  28. Benbrahim-Tallaa, L.; Baan, R.A.; Grosse, Y.; Lauby-Secretan, B.; El Ghissassi, F.; Bouvard, V.; Guha, N.; Loomis, D.; Straif, K.; International Agency for Research on Cancer Monograph Working Group. Carcinogenicity of diesel-engine and gasoline-engine exhausts and some nitroarenes. Lancet Oncol. 2012, 13, 663–664. [Google Scholar] [CrossRef]
  29. Lang, J.L.; Cheng, S.Y.; Wei, W.; Zhou, Y.; Wei, X.; Chen, D.S. A Study on the trends of vehicular emissions in the Beijing-Tianjin-Hebei (BTH) region, China. Atmos. Environ. 2012, 62, 605–614. [Google Scholar] [CrossRef]
  30. Yan, F.; Winijkul, E.; Jung, S.; Bond, T.C.; Streets, D.G. Global emission projections of Particulate Matter (PM): I. exhaust emissions from on-road vehicles. Atmos Environ. 2011, 45, 4830–4844. [Google Scholar] [CrossRef]
  31. Ekström, M.; Sjödin, A.K. Evaluation of the COPERT Ⅲ emission model with on road optical remote sensing measurements. Atmos Environ. 2004, 38, 6631–6641. [Google Scholar] [CrossRef]
  32. Wang, H.K.; Fu, L.X.; Zhou, Y.; Du, X.; Ge, W.H. Trends in vehicular emissions in China’s Mega cities from 1995 to 2005. Environ. Pollut. 2010, 158, 394–400. [Google Scholar] [CrossRef] [PubMed]
  33. Puttipong, C.; Panida, T.; Kamphol, P.; Pornphimol, W.; Bundit, L. Low carbon transportation in Thailand: CO2 mitigtion strategy in 2050. SpringerPlus 2015. [Google Scholar] [CrossRef]
  34. He, K.; Huo, H.; Zhang, Q.; He, D.; An, F.; Wang, M.; Walsh, M. Oil consumption and CO2 emissions in China’s road transport: Current status, future trends, and policy implications. Energy Policy 2005, 33, 1499–1507. [Google Scholar] [CrossRef]
  35. Huo, H.; He, K.; Wang, M.; Yao, Z. Vehicle technologies, fuel-economy policies, and fuel-consumption rates of chinese vehicles. Energy Policy 2012, 43, 30–36. [Google Scholar] [CrossRef]
  36. Cai, H.; Xie, S. Determination of emission factors from motor vehicles under different emission standards in China. Acta Sci. Nat. Univ. Pekin. 2010, 46, 319–326. (In Chinese) [Google Scholar]
  37. Huo, H.; Wang, M.; Zhang, X.; He, K.; Gong, H.; Jiang, K.; Jin, Y.; Shi, Y.; Yu, X. Projection of energy use and greenhouse gas emissions by motor vehicles in China: Policy options and impacts. Energy Policy 2012, 43, 37–48. [Google Scholar] [CrossRef]
  38. Beer, T.; Grant, T.; Williams, D.; Watson, H. Fuel-cycle greenhouse gas emissions from alternative fuels in Australian heavy vehicles. Atmos. Environ. 2002, 36, 753–763. [Google Scholar] [CrossRef]
  39. Graham, L.A.; Rideout, G.; Rosenblatt, D.; Hendren, J. Greenhouse gas emissions from heavy-duty vehicle. Atmos. Environ. 2008, 42, 4665–4681. [Google Scholar] [CrossRef]
  40. D’Angiola, A.; Dawidowski, L.E.; Gómez, D.R.; Osses, M. On-road traffic emissions in a megacity. Atmos. Environ. 2010, 44, 483–493. [Google Scholar] [CrossRef]
  41. Nam, E.; Jensen, T.; Wallington, T. Methane emissions from vehicles. Environ. Sci. Technol. 2004, 38, 2005–2010. [Google Scholar] [CrossRef] [PubMed]
  42. Yao, Z.; Wang, Q.; Wang, X.; Zhang, Y.; Shen, X.; Yin, H.; He, K. Emission inventory of unconventional pollutants from vehicles in typical cities. Environ. Pollut. Contr. 2011, 33, 96–101. (In Chinese) [Google Scholar]
  43. Streets, D.G.; Bond, T.C.; Carmichael, G.R.; Fernandes, S.D.; Fu1, Q.; He, D.; Klimont, Z.; Nelson, S.M.; Tsai, N.Y.; Wang, M.Q.; et al. An inventory of gaseous and primary aerosol emissions in Asian in the year 2000. J. Geophys. Res. 2003, 108, 8809–8830. [Google Scholar] [CrossRef]
Figure 1. The population of different regions of heavy-duty trucks from 2006 to 2015.
Atmosphere 07 00121 g001
Figure 2. The population proportion of heavy-duty trucks powered by different fuels from 2006 to 2015.
Atmosphere 07 00121 g002
Figure 3. The population proportion of different types of heavy-duty trucks from 2006 to 2015.
Atmosphere 07 00121 g003
Figure 4. The emission trends of GHG from heavy-duty trucks in Beijing (a) CO2e emission (b) CO2 emission (c) CH4 emission (d) N2O emission.
Atmosphere 07 00121 g004
Figure 5. The emission trends of GHG from heavy-duty trucks in Tianjin (a) CO2e emission (b) CO2 emission (c) CH4 emission (d) N2O emission.
Atmosphere 07 00121 g005
Figure 6. The emission trends of GHG from heavy-duty trucks in Hebei province (a) CO2e emission (b) CO2 emission (c) CH4 emission (d) N2O emission.
Atmosphere 07 00121 g006
Figure 7. The comparison of CO2e emissions from heavy-duty trucks in Beijing, Tianjin, and Hebei.
Atmosphere 07 00121 g007
Figure 8. The emission trends of CO2e from heavy-duty trucks under different emission standards in the BTH region.
Atmosphere 07 00121 g008
Figure 9. The proportion of population, CO2, CH4, N2O, and CO2e emissions from natural gas heavy-duty trucks in the BTH region.
Atmosphere 07 00121 g009
Figure 10. The comparison of CO2e emissions from different types of heavy-duty trucks in the BTH region.
Atmosphere 07 00121 g010
Table 1. The key parameters of heavy-duty trucks.
Tractor
Atmosphere 07 00121 i001
Pickup
Atmosphere 07 00121 i002
Special
Atmosphere 07 00121 i003
Dump
Atmosphere 07 00121 i004
Characteristics of usageFixed routes, good maintain etc.Used by logistics company, high-frequency operation etc.Short distance, use within city etc.Short distance, emergency shutdown, harsh working condition etc.
Average retirement coefficient (year)810103
Annual average kilometer (km)150,000~200,000≥200,00030,000~60,00080,000~100,000
Table 2. Emission factors from heavy-duty trucks powered by diesel and natural gas.
GHGChinese National Standard (CNS)Diesel (g/km)Natural Gas (g/km)
CO2Before CNS I12411033
CNS I1025845
CNS II936819
CNS III884774
CNS IV791707
References[34,35,36,37][36,37]
CH4Before CNS I0.28.1
CNS I0.185.67
CNS II0.154.05
CNS III0.13.6
CNS IV0.052.2
References[36,38,39,40,41,42][36,38,39]
N2OBefore CNS I0.025
CNS I0.020.19
CNS II0.020.13
CNS III0.010.06
CNS IV0.0050.03
References[36,38,40][38,39,40]
Table 3. Emission factors from heavy-duty trucks powered by diesel and natural gas under different emission standards in China (CNS).
Types of fuelsGreenhouse gasCNS II(g/km)CNS III (g/km)CNS IV (g/km)
DieselCO2936884791
CH40.150.10.05
N2O0.020.010.005
Natural gasCO2819774707
CH44.053.62.2
N2O0.130.060.03

