Article

Source Apportionment of Sulfate and Nitrate over the Pearl River Delta Region in China

1
Division of Environment, Hong Kong University of Science & Technology, Clear Water Bay, Hong Kong, China
2
Department of Mathematics, Hong Kong University of Science & Technology, Clear Water Bay, Hong Kong, China
*
Author to whom correspondence should be addressed.
Atmosphere 2016, 7(8), 98; https://doi.org/10.3390/atmos7080098
Submission received: 3 March 2016 / Revised: 9 July 2016 / Accepted: 14 July 2016 / Published: 27 July 2016
(This article belongs to the Special Issue Air Quality and Source Apportionment)

Abstract

:
In this work, the Weather Research Forecast (WRF)–Sparse Matrix Operator Kernel Emission (SMOKE)–Comprehensive Air Quality Model with Extensions (CAMx) modeling system with particulate source apportionment technology (PSAT) module was used to study and analyze the source apportionment of sulfate and nitrate particulate matter in the Pearl River Delta region (PRD). The results show that superregional transport was an important contributor for both sulfates and nitrates in all 10 cities in this region in both February (winter) and August (summer). Especially in February, the average super-regional contribution of sulfate and nitrate reached up to 80% and 56% respectively. For the local and regional source category, power plant emissions (coal-fired and oil-fired) and industry emissions were important for sulfate formation in this region. Industry emissions and mobile emissions are important for nitrate formation in this region. In August, the sum of these two sources contributed around over 60% of local and regional nitrate. The contributions from power plant emissions and marine emissions became important in August due to the southerly prevailing wind direction. Area sources and biogenic emissions were negligible for sulfate and nitrate formation in this region. Our results reveal that cross-province cooperation is necessary for control of sulfates and nitrates in this region.

Graphical Abstract

1. Introduction

Rapid and continuous economic growth has brought great wealth to China, and the material living conditions of its citizens have improved greatly. However, the large-scale urbanization process is modifying the landscape and turning more and more forests and wetlands into concrete surfaces. The urbanization process has also played a role in clustering vehicles and industrial factories, which leads to worsening environmental conditions. Since the implementation of the openness policy, the Pearl River Delta (PRD) region has become China’s major engine for economic growth and one of the world’s main manufacturing hubs. Although the incomes and convenience of living of the local residents have greatly improved, more and more people have complained about the smell of waste water, poor visibility, and inhalation of high levels of air pollutants. PM2.5, NO2, and O3 are the three major ambient pollutants in this region. According to the observation data, the peak ozone concentration exceeded 100 ppb in 15 days during August 2011 at the Guangzhou Luhu station. In Hong Kong, the average NO2 concentration surpassed 80 ppb in February 2011 at Causeway Bay, a roadside station. At the Nansha station, the PM2.5 concentrations reached 150 μg/m3 during four episodes with high levels of particulate matter (PM) in January 2011. Once emitted or formed in the atmosphere, these pollutants can also be deposited onto the ground via wet deposition and dry deposition. Acid rain is another important problem caused by substantial emissions of SO2 and NOx in this region [1].
The air quality issues mentioned above have inspired many studies of these problems over this region. In the meteorological model MM5 simulation study, Lo et al. [2] found that urbanization played a significant role in trapping pollutants by influencing the land-sea breezes around the PRD region. Li et al. [3] applied the CAMx model coupled with ozone source apportionment technology (OSAT) to study the sources of ozone during episode days and found that superregional transport is an important source of ozone in this region. Wu et al. [4] also used the chemical transport model CAMx coupled with particulate source apportionment technology (PSAT) to study the source apportionment of fine PM and found that local mobile emissions and superregional transport were the dominant contributors of PM over this region. Yao et al. [5] found that the mountains to the north of the PRD region trapped pollutants and further worsened the air quality. Lu et al. [6] recently applied CAMx-OSAT to study the source apportionment of ambient NOx in this region and found that heavy duty diesel vehicles are the major contributor to this pollutant. Many observation-based studies have also been launched in this region. For example, Yuan et al. [7] applied a positive matrix factorization method to identify the major sources of PM10 in Hong Kong and found that vehicle emissions were the greatest contributor. Xue et al. [8] claimed that the liquid water content could determine the sulfate and nitrate abundance in PM2.5 at polluted sites in Hong Kong. With all of these studies, the generation mechanism and cause of episodes for related pollutants have been relatively well described in the PRD region.
PM2.5 is liquid or solid matter suspended in the air with a particle aerodynamic diameter of less than 2.5 μm. Long-term exposure to this pollutant may increase the risk of cardiovascular disease, respiratory disease, lung cancer, and other disorders. PM2.5 has several components, including sulfates, nitrates, biogenic components, and crustal dust. Wu et al. [4] performed a detailed source apportionment analysis for this pollutant over this region during April and December. However, this pollutant has several important components that may come from different regions or processes. Therefore, to further understand these sources, it is necessary to study the sources of its major components. Unlike some primary gaseous pollutants (NOx and SO2), PM2.5 cannot be merely reduced by simply controlling specific single source. Sulfates and nitrates are the two important anthropogenic components of PM2.5 in this region and they can be controlled effectively once their sources are identified. Therefore, the PM2.5 concentration can be reduced gradually if the local government can first focus on controlling sulfate and nitrate. According to Huang et al. [9], PM2.5 in western Hong Kong consisted of 31% secondary sulfate and 13% secondary nitrate. Zhang et al. [10] studied sulfate and nitrate sources throughout China with the CMAQ model at a 36-km grid resolution and found that power plant and mobile emissions were the dominant sources of these two components. In this study, we applied a Weather Research Forecast (WRF)–Sparse Matrix Operator Kernel Emission (SMOKE)–Comprehensive Air Quality Model with Extensions (CAMx) modeling system and PSAT to study the source apportionment of sulfates and nitrates in the PRD region with a 3-km model resolution, which is sufficiently fine to analyze local contribution, regional transport (from other cities within the PRD region), and superregional transport (from outside the PRD region). We chose February and August 2011 to represent both winter (northerly prevailing winds) and summer (southerly prevailing winds) conditions in this region.
The remainder of this article is organized as follows. Section 2 describes the model domain setting, the choice of the parameterization scheme, the emission inventory, and the PSAT module. Section 3 contains the model evaluation and a discussion of the source apportionment results; and the overall study is summarized in Section 4.

2. Model and Methods

2.1. Model Description

Weather Research Forecast v3.2 (WRF) was used to simulate the meteorology field in this study. The WRF scheme selection is listed as follows. We chose Grell-Devenyi ensemble cumulus parameterization for cumulus scheme, WRF single-moment six-class scheme for microphysics, the Yonsei University PBL scheme, Dudhia’s shortwave radiation scheme, the rapid radiative transfer model for long-wave radiation and the Noah land-surface model. The observation data (wind and temperature) from Hong Kong Observatory were nudged to domain 3. The ambient pollutant concentration was simulated by CAMx v6.00, and Euler backward iterative (EBI) was used for chemical solver, the RADM scheme for aqueous phase chemistry, the K-theory for vertical diffusion, CB05 for gas phase chemistry, ISORROPIA v1.7 for the inorganic aerosol scheme, and SOAP for the secondary organic scheme.
The domain setting is shown in Figure 1. In general, our simulation had three nested domains with resolutions of 27 km, 9 km, and 3 km. The boundary conditions for domain 1 were generated from GEOS-Chem to better match the Asian pollutant background [11]. The outer domain covered a large part of China and some other countries, such as Korea, Japan, and Thailand. Domain 2 covered the entire Guangdong province, and domain 3 included all of the important cities in the PRD region. One should note that the domain for the meteorology model (in black) was intentionally larger than that for the air quality model (in red) because it can help to minimize the boundary effect for air quality simulation.
The emission inventory for domains 1 and 2 was based on the INTEX-B 2006 regional emission inventory with some updates according to the study from Zhang et al. [12]. For domain 3, the PRD region, a highly resolved emission inventory in this region for 2006 was implemented [13]. The PRD emission mapping for SO2 and NOx is shown in Figure 2. The emissions in this region are clustered in Shenzhen, Hong Kong, and Guangzhou. The emissions in some cities, such as Huizhou, Jiangmen, and Zhaoqing (see Figure 2), were much lower than those in the center of this region. The biogenic emissions were generated with the Model of Emission of Gases and Aerosols from Nature (MEGAN v2.04). The MEGAN inputs, such as the leaf area index and plant functional type, were all generated from MODIS satellite data. All emissions were processed and combined with the SMOKE (v2.4) system.

2.2. Particulate Source Apportionment Technology (PSAT)

As a CAMx module, PSAT has been developed to track the sources (geographic regions and source categories) of PM components. PSAT can be used to track particulate sulfates, nitrates, ammonium, secondary organic aerosols, and six categories of primary PM. The locations at which secondary PM forms may not be the same as the locations at which the precursors are emitted into the atmosphere, and PSAT is able to track such process [14].
In this study, we separated the source into six categories and 10 regions. The categories include mobile sources, industrial point sources, power plant point sources, area sources, marine sources, and biogenic sources in the PRD region. As shown in Figure 3, we separated the region into 10 cities: Guangzhou (GZ), Shenzhen (SZ), Huizhou (HZ), Dongguan (DG), Jiangmen (JM), Zhuhai (ZH), Zhongshan (ZS), Zhaoqing (ZQ), Foshan (FS), and Hong Kong (HK). In addition to the source categories and source regions, the PSAT can automatically track pollutants at the southern, northern, western, and eastern boundaries. The source apportionment of sulfates and nitrates in the region can be expressed by Equation (1).
S u l f a t e / N i t r a t e ( n ) = i = 1 10 j = 1 6 S ( i ,   j ) + B C E + W + S + N + I C
where sulfate/nitrate (n) is the sulfate and nitrate concentration in city n, S(i,j) represents the sulfates or nitrates from city i and source j, BC is the boundary source from each of the four directions, and IC is the initial condition. We used local sources, regional sources, and superregional sources to analyze the results. A local source indicates that the source is a local city, a regional source indicates that the source is another city within the PRD region, and a superregional source indicates that the source is outside the PRD region.

3. Results and Discussion

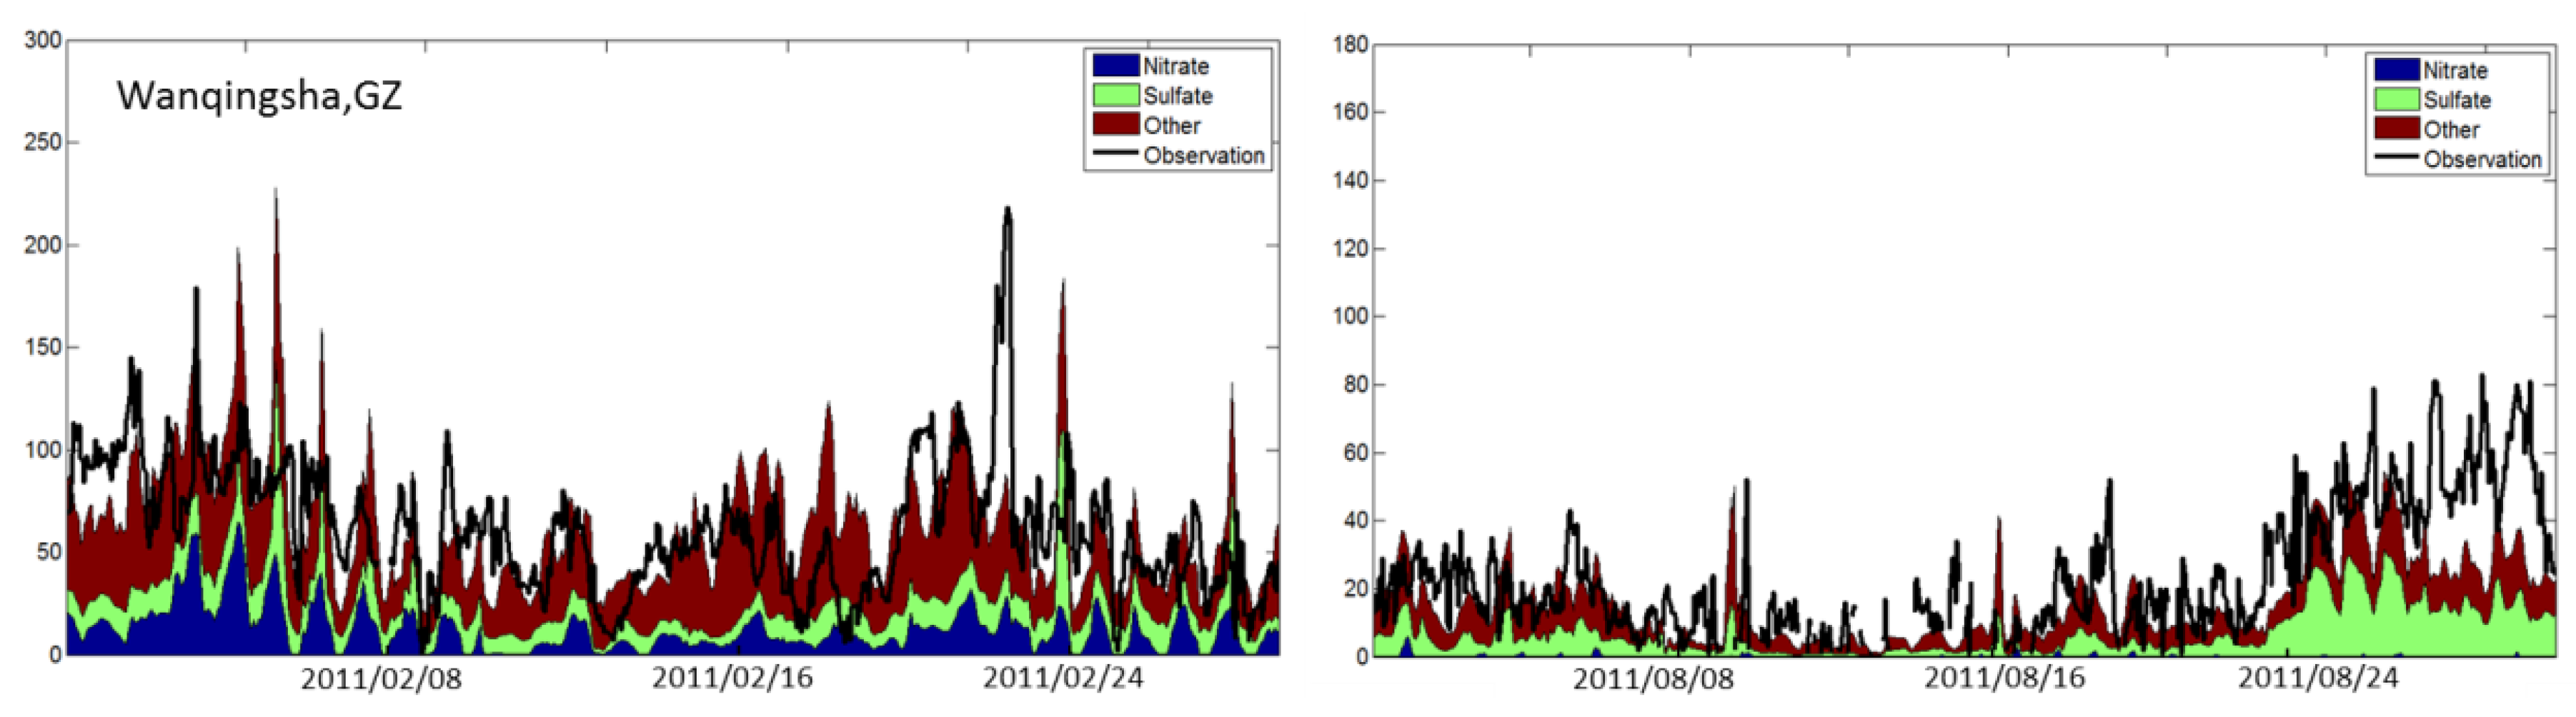
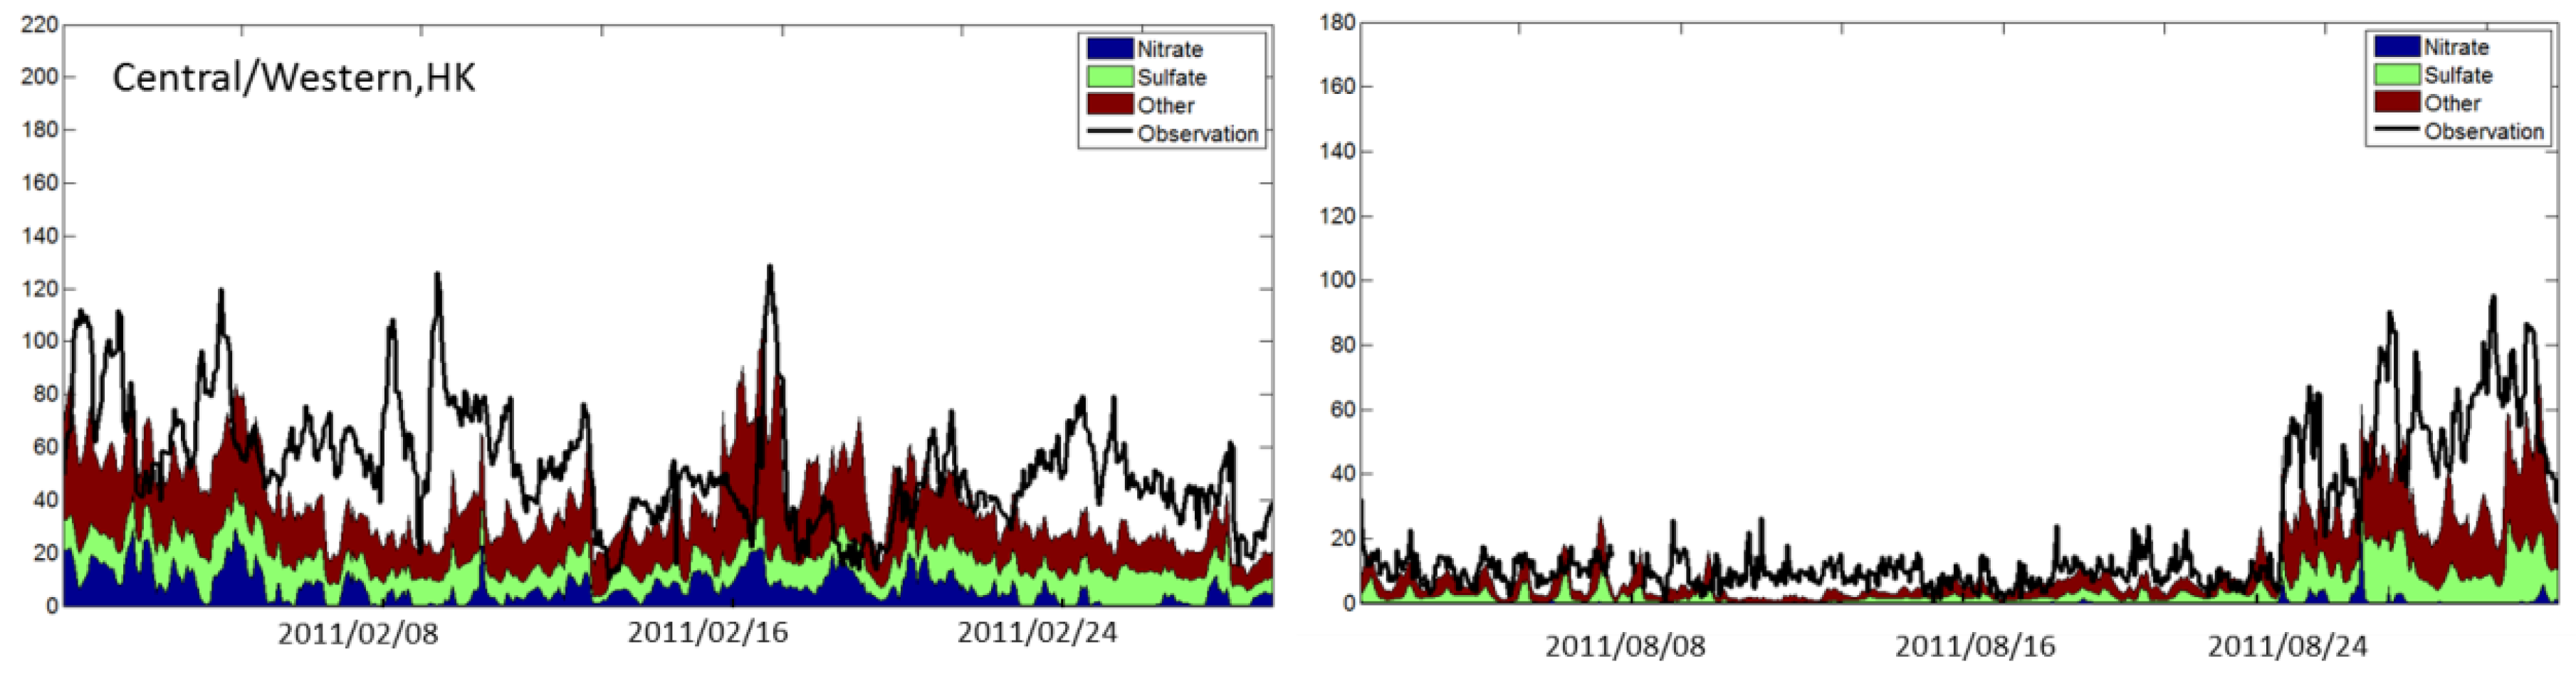
3.1. Model Evaluation

Observation data from 37 meteorology stations in the PRD region were used in our evaluation. Table 1 presents the evaluation (37 stations on average) of the 2-m temperature, wind speed, and wind direction as simulated by WRF. The index of agreement (IOA) formula used for wind direction in this study differs from the formulation for scalar variables; it follows that introduced by Kwok et al. [9]. For the wind speed simulation results, the root-mean-square error (RMSE) ranged from 1.4 to 1.8, the normalized mean bias (NMB) ranged from 0.29 to 0.37, and the IOA ranged from 0.68 to 0.7. The IOA for wind speed was better than 0.88 for both February and August. For the 2-m temperature, the NMB was 0.12 for February and −0.009 for August, which indicates that the temperature was slightly overestimated in winter and underestimated in summer. The simulated meteorology field can reveal the difference between rural area and urban area. The spatial wind mapping can be found in [6]. The results were good and acceptable for further use to drive the air quality model.
Table 2 shows the model evaluation statistics matrix for the hourly CAMx results for PM2.5, sulfates, and nitrates. We used 14 stations in the PRD region to evaluate the PM2.5 simulation; the station locations are shown in Figure 1. For sulfates and nitrates, we have only the hourly data from the Hong Kong University of Science and Technology supersite (22.34°N, 114.27°E). Figure 4 shows the PM2.5 time series comparison between the simulation and the observations. In general, the model yielded a reasonable PM2.5 simulation; the RMSE ranged from 17.1 to 20.1, the IOA ranged from 0.68 to 0.76, and the NMB ranged from −0.24 to −0.012. The sulfate simulation was also acceptable; the RMSE, IOA, and NMB ranged from 4.9 to 6.1, 0.60 to 0.81, and −0.35 to −0.19, respectively. However, the nitrate simulation was not as good as those for sulfates and PM2.5. This nitrate simulation discrepancy has also been noted in other studies [15], probably this is due to (1): the discrepancy in HNO3 and NH3 dry deposition velocity simulation [16]; (2): the emission of ammonium and NOx had significant room for improvement from the spatial and temporal aspects; (3): the imperfect simulation for the chemical reaction involving Ca2+, Na+ and HNO3 since these reactions are important for the coarse mode nitrate formation [17]. Nonetheless, the nitrate simulation by the CAMx model can catch the magnitude of the observation data in both August and February, as shown in Table 2.

3.2. Local, Regional and Super-Regional Contribution

Table 3 shows the local, regional, and superregional contributions of sulfates and nitrates in the 10 PRD cities during February and August. Table 4 shows the regional contribution to a specific city by other cities (the top 3 contributors are shown) in the PRD region. The superregional contribution is the dominant sulfate source in February over the 10 cities, ranging from 66.8% (Foshan) to 94.0% (Huizhou), mainly because the northerly prevailing winds blew this pollutant from northern China into the PRD region during winter. Huizhou is in the northwestern part of the PRD region and has low local emissions. It is the first station reached by pollutants entering the PRD region; as a result, the superregional contribution of sulfates reached almost 100% in this city. The local contribution and regional contribution in Foshan were relatively higher than those in the other nine cities, mainly due to the substantial emissions from this city, as shown in Figure 2, and because Foshan is immediately adjacent to Guangzhou, which is the largest city in the region and also has substantial emissions. As shown in Table 4, Guangzhou contributed 49% of the regional sulfate to Foshan in February. The superregional contributions for Shenzhen and Hong Kong were 82.4% and 91.6%, respectively. During August, the superregional contribution of sulfate decreased to half the level in February, mainly due to the southerly prevailing winds during summer in this region. In August, the superregional contributions ranged from 59.9% (Shenzhen) to 77.4% (Zhuhai). The local contributions from Shenzhen and Guangzhou were the highest—21.6% and 18.6%, respectively—partly due to the large number of vehicles in these two major cities. In 2014, the number of vehicles in Guangzhou and Shenzhen reached 2.7 million and 2.9 million, respectively. From the analysis mentioned above and from Table 3, it can be seen that sulfates came mainly from sources outside the local city; hence, the pollutant issue cannot be solved by local government alone.
The average nitrate concentration in August in the PRD region was only 0.6 μg/m3. This low concentration was mainly a result of the partitioning of particulate nitrates to a gas phase at high temperatures. Due to the southerly prevailing winds, the regional contribution of nitrates from other cities in the PRD region was greater than the superregional contribution, except for in Jiangmen. In February, the superregional contribution of nitrate ranged from 42.2% in Foshan to 84.5% in Huizhou. As with sulfates, the high superregional nitrate contribution in Huizhou was mainly a result of its geographic location and the wind direction. There were relatively fewer nitrates from superregional sources. One reason for this finding is the rapid transformation of NOx into HNO3, which increased the levels of locally and regionally generated nitrates [18]. The regional contribution ranged from 3.6% in Huizhou to 49.5% in Zhongshan. The northerly prevailing winds prevent much of the nitrates generated in the PRD (Shenzhen and Hong Kong) from entering Huizhou. In February, Hong Kong is downwind from Shenzhen and Huizhou; hence, the regional nitrates were mainly contributed by these two cities, whose contributions were 47% and 34%, respectively, as shown in Table 4. As with sulfates, a substantial amount of nitrates came mainly from regional and superregional sources; therefore, the control policy for this pollutant requires intergovernmental cooperation. However, one should note that there exists uncertainty for the model simulation results. The uncertainty derived from emission inventory, meteorology field, and the chemical reaction mechanism. The overestimation of wind speed may lead to the possible overestimation of regional and super-regional transport contribution. Since not all the chemical reactions are included in the model, the uncertainty is not small for the source apportionment results. In the future, more observation data is needed to quantify the gap between the model simulation and true condition.

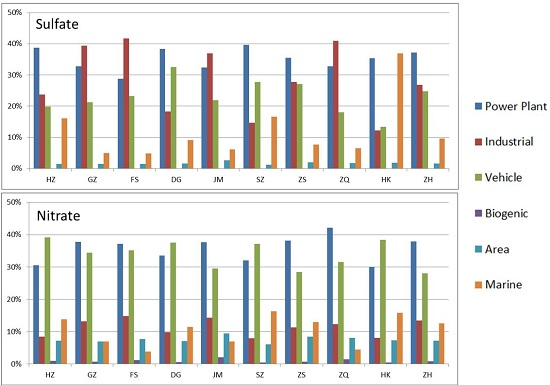
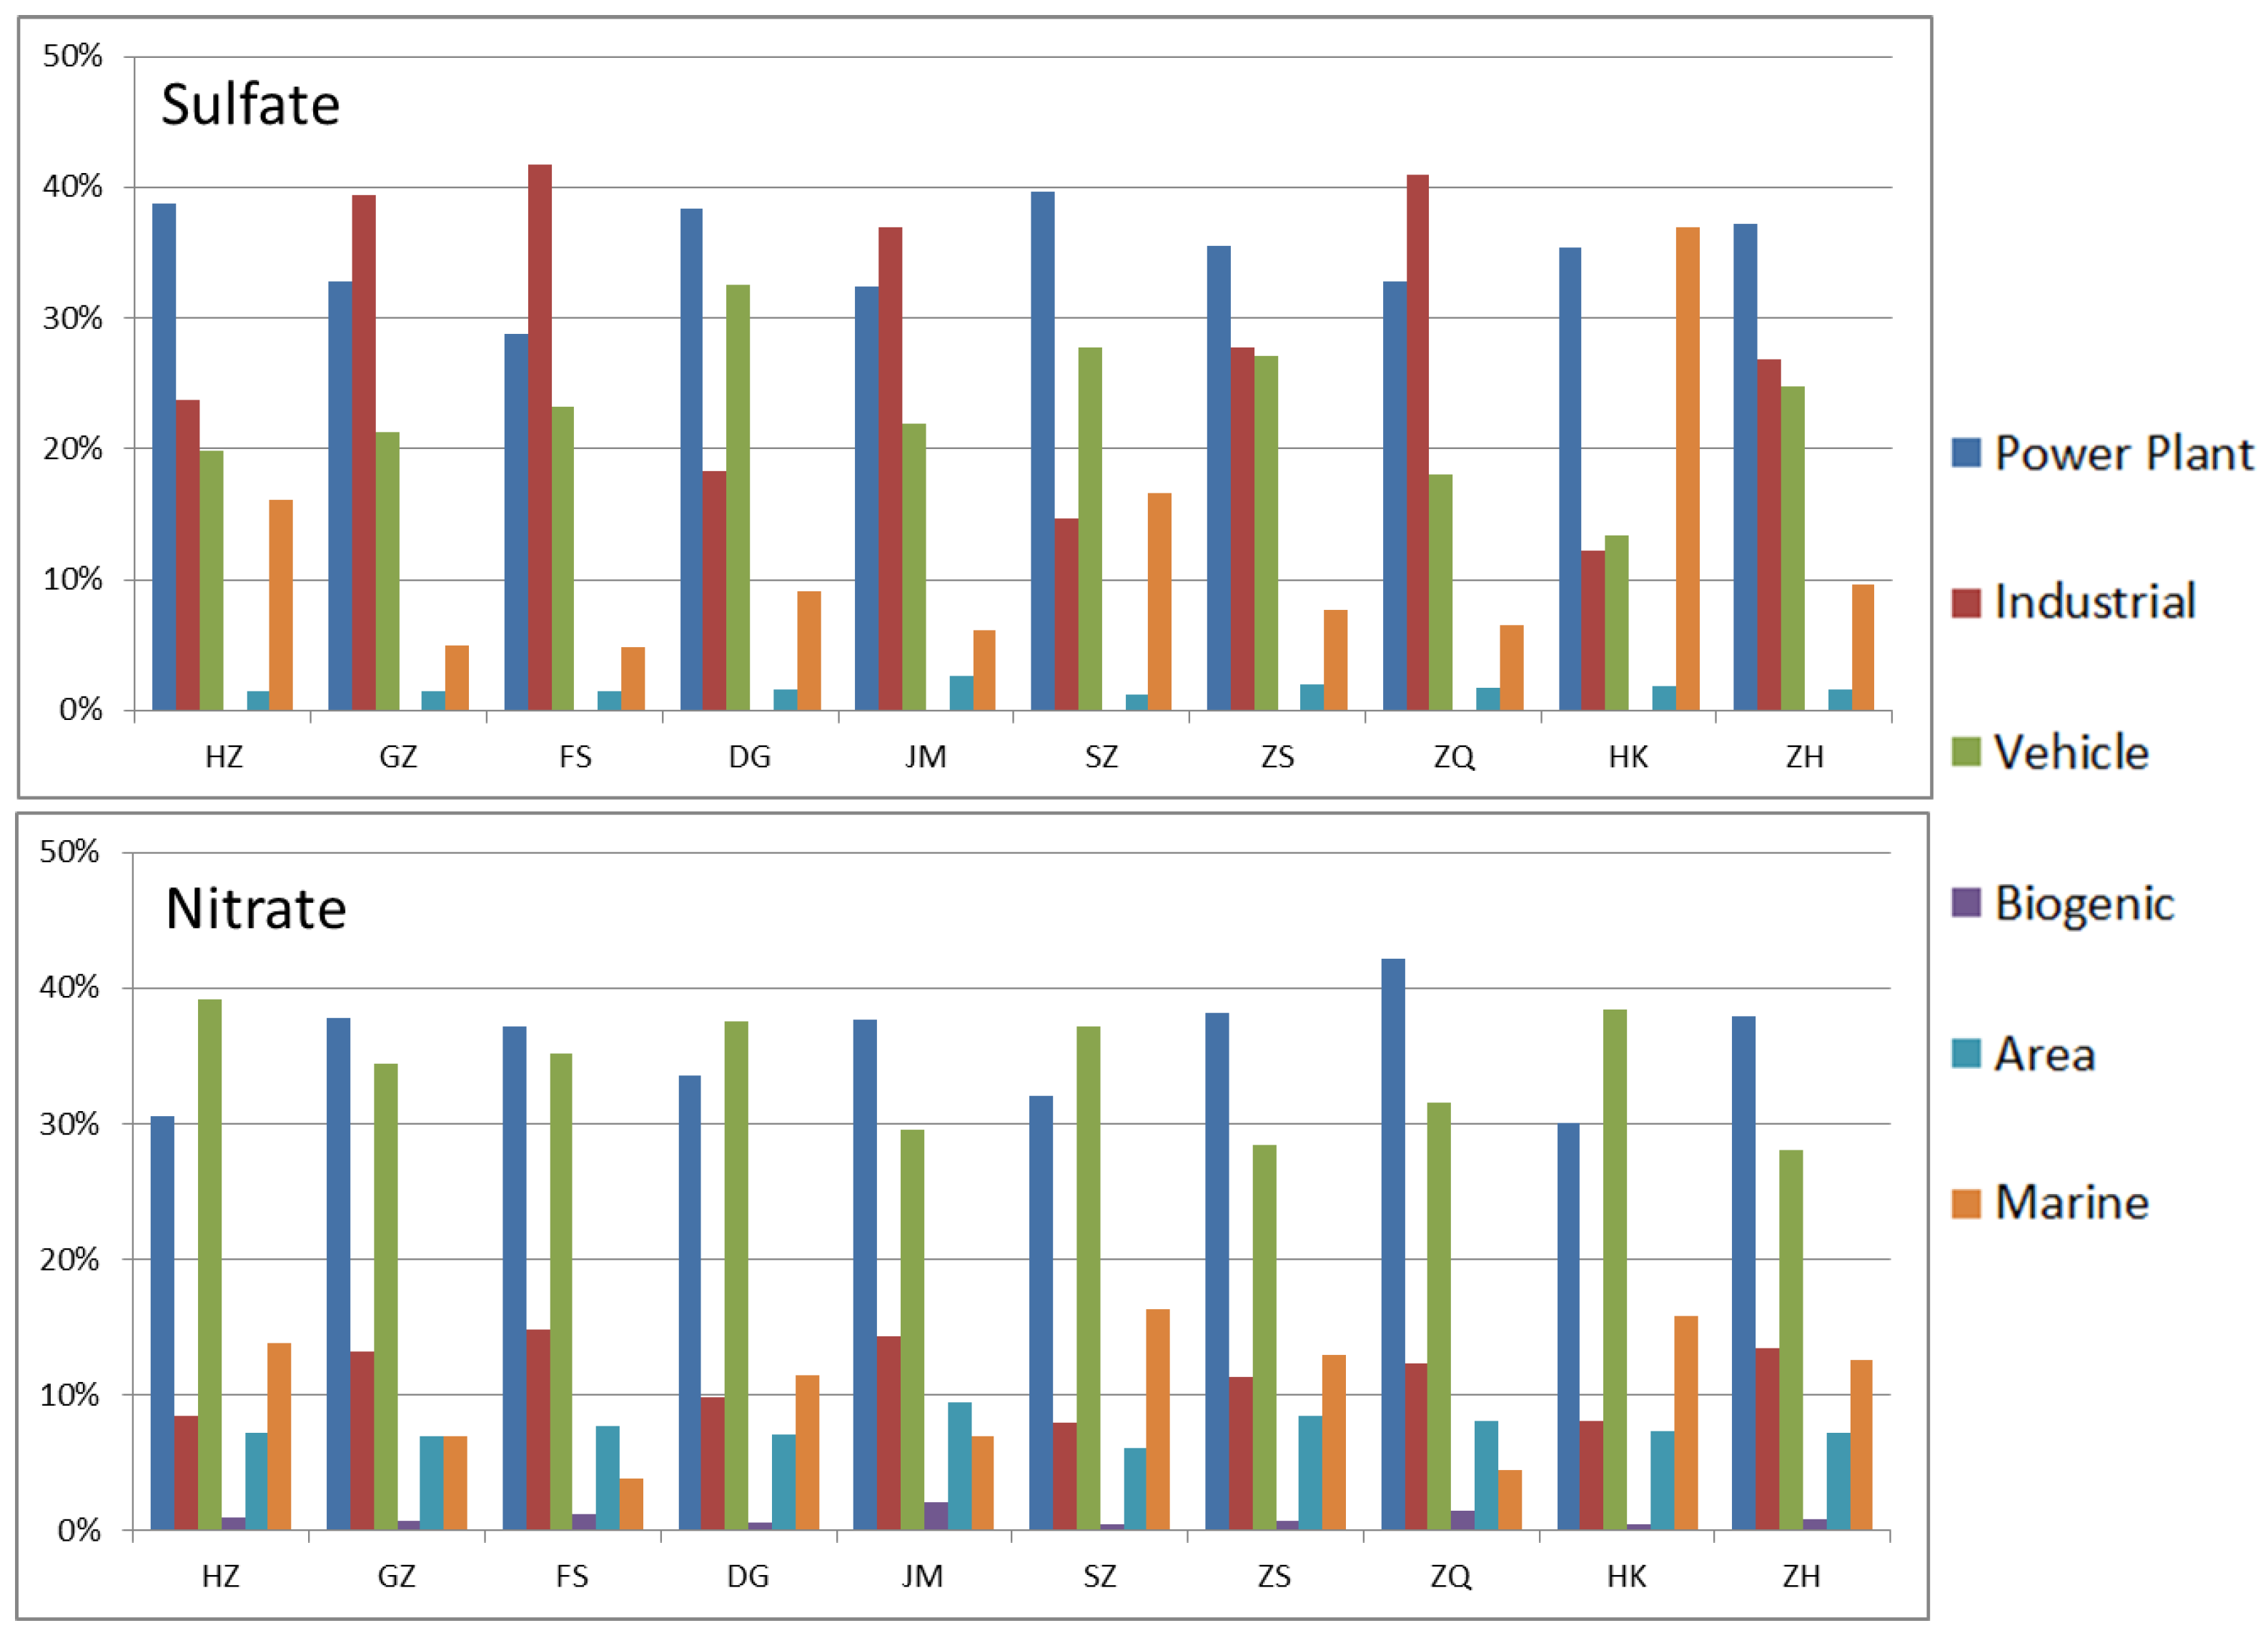
3.3. Source Category Contribution

Figure 5 shows the source categories of sulfates and nitrates for local and regional sources over the PRD region in August. As shown in Table 3, in February, most of the sulfate and nitrate are from the super-regional source. Therefore, we only show the source category for August in this part. In this month, power plants were the dominant regional and local sulfate source, followed by industrial sources. Because of the seasonal wind effect, the pollutants emitted from the power plants are blown to the north by the southerly winds, and the sulfate contribution from this source therefore became important. Contini et al. [19] also found that power plant emission can contribute to the sulfate emission in Italy. At the same time, the wind pattern can also influence the contribution of the marine sources. For example, as seen in Figure 2, the ocean channel is located at the southeastern part of this region, and the marine contribution of sulfates in Hong Kong exceeded 30% under southerly wind conditions. The importance of marine emissions for the sulfate formation can also be found in European cities [20,21]. The sulfate contribution from mobile emissions is shown to be relatively large in this work when compared to another study which used the INTEX-B as the only emission inventory [10]. The reason for this is because the SO2 emitted by vehicles in the emission inventory we used [13] was relatively larger than that in INTEX-B [12]. In the PRD 2006 emission inventory, the ratio of mobile emitted SO2 over the power plant emitted SO2 was 10.5%; while in INTEX-B, this ratio was only around 0.7%. The area sources and biogenic sources contributed only a negligible amount of sulfates over this region in this month.
The main contributors of nitrates in August were mobile (average 33.9%) and power plant (average 35.7%) emissions. The sum of mobile and power plant contributions in all the cities is above 60%. In this month, industrial and marine emissions also contributed a substantial amount of nitrate. As with sulfates, biogenic emissions of nitrates were also negligible over this region. Due to the southerly winds, marine sources contributed over 15% of nitrate in Shenzhen and Hong Kong (including aged sea-spray sodium nitrate). In order to control the nitrate in this region, the local government should focus on two points: (1) take action to control mobile emissions (e.g., odd-even number restriction); (2) reduce the industrial emission by establishing stricter supervision regulation. However, as is the case with sulfate, super-regional contribution is of great importance and therefore cross regional cooperation is highly important.

3.4. Source Apportionment in City Center

The city center of an urban area is the commercial and geographical heart of the city. It has a high population density, and its air quality has important effects on the health of local citizens. Hence, to protect public health, it is also important for city government to formulate a specific control policy for these areas. In this study, we further analyzed the city centers in Guangzhou (23.13°N, 113.26°E), Shenzhen (22.55°N, 114.10°E) and Hong Kong (22.28°N, 114.16°E), which are the three most densely populated cities in the PRD region. Table 5 shows the source apportionment results for sulfates and nitrates in the city centers of the three major cities mentioned above. In February, the superregional contribution of sulfates in the city center of Hong Kong was similar to the average value for the whole city. However, the super-regional contribution in the city center of the other two cities was lower than the average value for the whole cities. In the INTEX-B emission inventory, the SO2 from power plants and industrial emissions represented 59% and 31% of total SO2 emission respectively. Hence, most of the sulfate in this region is coming from power plants and industrial sources. In Guangzhou, the contributions from regional and local sources made up 32% and 9% of total sulfates, respectively. In the city center of Shenzhen, the regional contribution of sulfate formation is 6% and the local sulfate contribution is 16%. The regional contribution is low in the city center during February. One of the main reasons for this was that in February the predominant wind is in north-east direction and an important power plant is located in the southern part of this region. In August, the superregional contribution of sulfates decreased due to the southerly prevailing wind direction. In this month, the super-regional contribution of sulfate in the city centers of Shenzhen, Guangzhou and Hong Kong were 55%, 47% and 67%. The regional and local source contribution increased due to the southern prevailing wind that brought the sulfate from the power plant to the city centers. In February, the superregional contribution of nitrates comprised more than 70% of the levels in the city centers of Hong Kong and Shenzhen, but only 39% of the level in Guangzhou. Compared to the sulfate in February, the sum of regional and local sources of nitrate is larger. One main reason for this was that a substantial amount of nitrate is from mobile emissions and large number of vehicles were clustering in the city center. Hence, it is anticipated that traffic control policy should be effective in controlling the urban nitrate level. In August, super regional contributions of nitrate in the three city centers were all below 50%, which is due to the southern prevailing wind, as noted above. As with the average value for the whole city, the superregional contribution was the most important source of sulfates and nitrates in the city center. This result further indicates that cooperation with other provinces is necessary for sulfate and nitrate control over the PRD region.

4. Conclusions

In this study, we applied the WRF-SMOKE-CAMx modeling system with PSAT to study the source apportionment of sulfates and nitrates in the PRD region. In both August and February, the superregional contribution was the dominant source of sulfates and nitrates in this region, although it was lower in August due to the southerly prevailing wind direction. The level of nitrates from superregional sources was lower than that of sulfates. The process and influencing conditions for this include: (1) the excess ammonia amount that can be reacted with nitric acid; (2) the temperature that is low enough to prevent the HNO3 vaporization [22]; (3) the wetness of the surface (HNO3 can deposit quickly on the wet surface). Industrial sources and power plant emissions were the two major contributors among the regional and local sources. For nitrates, the contribution from mobile emissions was much greater than that from other sources and exceeded 40% in all 10 cities in this region during August. Given the high population density in the city centers, we also analyzed the source apportionment results in the city centers of Hong Kong, Guangzhou, and Shenzhen. As with the overall situation, the superregional contribution was very important in the city center, especially the city center of Hong Kong. With the exception of the superregional contribution, mobile sources contributed the most sulfates and nitrates in all three city centers during both months. Our results indicate that the sulfate and nitrate pollution issue cannot be solved by any single city or even by all 10 cities in the PRD region. A higher-level effort, such as interprovincial cooperation, is needed for a better control policy for this region. The PM2.5 pollution problem can be alleviated only when sulfates and nitrates are controlled effectively. Because the superregional contribution is important for these two pollutants, future study of the source apportionment over a larger area (e.g., including Hunan, Jiangxi, and Fujian provinces) with fine model resolution is necessary to better understand the sources from other provinces and their influence on the sulfate and nitrate levels in the PRD region. One of the limitations of this work was that we did not classify the source category in the super-regional contribution. Therefore, further work is needed to provide a more detailed source contribution for sulfate and nitrate formation in this region. This work focuses on sulfate and nitrate, the sources of other PM2.5 components, such as OC and EC, should be further studied once the sulfate and nitrate are controlled effectively over this region in the future.

Acknowledgments

This work was supported by the National Science Foundation of China (No. 41375103), NSFC/RGC Grant N_HKUST631/05, NSFC-GD Grant U1033001, and RGC Grant 16300715.

Author Contributions

Xingcheng Lu did the model simulation, analyzed the model results and wrote the paper. Xingcheng Lu and Jimmy Fung designed the framework of this paper and revised the paper.

Conflicts of Interest

The authors declare no conflict of interest.

Appendix

Model performance statistics formula:
R M S E = 1 n i = 1 n ( S i O i ) 2
I O A = 1 i = 1 n ( O i S i ) 2 i = 1 n ( | O i O ¯ | + | S i S ¯ | ) 2
N M B = i = 1 N ( S i O i ) i = 1 N O i × 100 %
M e a n S i m = 1 n i = 1 n S i
M e a n O b s = 1 n i = 1 n O i
I O A w i n d = 1 i = 1 N f ( | θ i ϕ i | ) 180 2 ,   0 ° θ i 360 °   a n d   0 ° ϕ i 360 ° f ( | θ i ϕ i | ) = | θ i ϕ i | 2 ,   | θ i ϕ i | 180 ° f ( | θ i ϕ i | ) = ( 360 ° | θ i ϕ i | ) 2 ,   | θ i ϕ i | > 180 °
where “RMSE” represents root mean square error, “IOA” represents index of agreement, “IOAwind” represents the index of agreement for wind direction evaluation, “NMB” represents normalized mean bias, Mean-Sim represents the mean of the model simulation and Mean-Obs represents the mean of the observation results. Si is the hourly simulation, Oi is the hourly observation value, θ i is the observation wind direction and ϕ i is the simulated wind direction at time i.

References

  1. Lu, X.; Fung, J.C.H.; Wu, D. Modeling wet deposition of acid substances over the PRD region in China. Atmosp. Environ. 2015, 122, 819–828. [Google Scholar] [CrossRef]
  2. Lo, J.C.; Lau, A.K.; Fung, J.C.; Chen, F. Investigation of enhanced cross-city transport and trapping of air pollutants by coastal and urban land-sea breeze circulations. J. Geophys. Res. Atmos. 2006, 111. [Google Scholar] [CrossRef]
  3. Li, Y.; Lau, A.H.; Fung, J.H.; Zheng, J.Y.; Zhong, L.J.; Louie, P.K.K. Ozone source apportionment (OSAT) to differentiate local regional and super-regional source contributions in the Pearl River Delta region, China. J. Geophys. Res. Atmos. 2012, 117, D15–D16. [Google Scholar] [CrossRef]
  4. Wu, D.; Fung, J.C.H.; Yao, T.; Lau, A.K.H. A study of control policy in the Pearl River Delta region by using the particulate matter source apportionment method. Atmos. Environ. 2013, 76, 147–161. [Google Scholar] [CrossRef]
  5. Yao, T.; Fung, J.C.H.; Ma, H.; Lau, A.K.H.; Chan, P.W.; Yu, J.Z.; Xue, J. Enhancement in secondary particulate matter production due to mountain trapping. Atmos. Res. 2014, 147, 227–236. [Google Scholar] [CrossRef]
  6. Lu, X.; Yao, T.; Li, Y.; Fung, J.C.H.; Lau, A.K.H. Source apportionment and health effect of NOx over the Pearl River Delta region in southern China. Environ. Pollut. 2016, 212, 135–146. [Google Scholar] [CrossRef] [PubMed]
  7. Yuan, Z.; Lau, A.K.H.; Zhang, H.; Yu, J.Z.; Louie, P.K.; Fung, J.C. Identification and spatiotemporal variations of dominant PM10 sources over Hong Kong. Atmos. Environ. 2006, 40, 1803–1815. [Google Scholar] [CrossRef]
  8. Xue, J.; Griffith, S.M.; Yu, X.; Lau, A.K.; Yu, J.Z. Effect of nitrate and sulfate relative abundance in PM2.5 on liquid water content explored through half-hourly observations of inorganic soluble aerosols at a polluted receptor site. Atmos. Environ. 2014, 99, 24–31. [Google Scholar] [CrossRef]
  9. Huang, X.H.; Bian, Q.; Ng, W.M.; Louie, P.K.; Yu, J.Z. Characterization of PM2.5 major components and source investigation in suburban Hong Kong: A one year monitoring study. Aerosol Air Qual. Res. 2014, 14, 237–250. [Google Scholar] [CrossRef]
  10. Zhang, H.; Li, J.; Ying, Q.; Yu, J.Z.; Wu, D.; Cheng, Y.; Jiang, J. Source apportionment of PM2.5 nitrate and sulfate in China using a source-oriented chemical transport model. Atmos. Environ. 2012, 62, 228–242. [Google Scholar] [CrossRef]
  11. Fu, J.; Lam, Y.; Gao, Y.; Jacob, D.; Carouge, C.; Dolwick, P.; Jang, C. Recent study of U.S. ozone background concentrations using GEOS-Chem. In Proceedings of the 5th GEOS-Chem Meeting, Cambridge, MA, USA, 2–5 May 2011.
  12. Zhang, Q.; Streets, D.G.; Carmichael, G.R.; He, K.B.; Huo, H.; Kannari, A.; Klimont, Z.; Park, I.S.; Reddy, S.; Fu, J.S.; et al. Asian emissions in 2006 for the NASA INTEX-B mission. Atmos. Chem. Phys. 2009, 9, 5131–5153. [Google Scholar] [CrossRef]
  13. Zheng, J.; Zhang, L.; Che, W.; Zheng, Z.; Yin, S. A highly resolved temporal and spatial air pollutant emission inventory for the Pearl River Delta region, China and its uncertainty assessment. Atmos. Environ. 2009, 43, 5112–5122. [Google Scholar] [CrossRef]
  14. Yarwood, G.; Morris, R.E.; Wilson, G.M. Particulate matter source apportionment technology (PSAT) in the CAMx photochemical grid model. In Air Pollution Modeling and Its Application XVII; Springer US: New York, NY, USA, 2007; pp. 478–492. [Google Scholar]
  15. Kwok, R.H.; Fung, J.C.; Lau, A.K.; Fu, J.S. Numerical study on seasonal variations of gaseous pollutants and particulate matters in Hong Kong and Pearl River Delta Region. J. Geophys. Res. Atmos. (1984–2012) 2010, 115. [Google Scholar] [CrossRef]
  16. Shimadera, H.; Hayami, H.; Chatani, S.; Morino, Y.; Mori, Y.; Morikawa, T.; Ohara, T. Sensitivity analysis of influencing factors on PM2.5 nitrate simulation. In Proceedings of the 11th Annual CMAS Conference, Chapel Hill, NC, USA, 15–17 October 2012.
  17. Contini, D.; Cesari, D.; Genga, A.; Siciliano, M.; Ielpo, P.; Guascito, M.R.; Conte, M. Source apportionment of size-segregated atmospheric particles based on the major water-soluble components in Lecce (Italy). Sci. Total Environ. 2014, 472, 248–261. [Google Scholar] [CrossRef] [PubMed]
  18. Ying, Q.; Kleeman, M. Regional contributions to airborne particulate matter in central California during a severe pollution episode. Atmos. Environ. 2009, 43, 1218–1228. [Google Scholar] [CrossRef]
  19. Contini, D.; Cesari, D.; Conte, M.; Donateo, A. Application of PMF and CMB receptor models for the evaluation of the contribution of a large coal-fired power plant to PM10 concentrations. Sci. Total Environ. 2016, 560, 131–140. [Google Scholar] [CrossRef] [PubMed]
  20. Becagli, S.; Sferlazzo, D.M.; Pace, G.; Sarra, A.D.; Bommarito, C.; Calzolai, G.; Ghedini, C.; Lucarelli, F.; Meloni, D.; Monteleone, F.; et al. Evidence for heavy fuel oil combustion aerosols from chemical analyses at the island of Lampedusa: A possible large role of ships emissions in the Mediterranean. Atmos. Chem. Phys. 2012, 12, 3479–3492. [Google Scholar] [CrossRef]
  21. Cesari, D.; Genga, A.; Ielpo, P.; Siciliano, M.; Mascolo, G.; Grasso, F.M.; Contini, D. Source apportionment of PM2.5 in the harbour–industrial area of Brindisi (Italy): Identification and estimation of the contribution of in-port ship emissions. Sci. Total Environ. 2014, 497, 392–400. [Google Scholar] [CrossRef] [PubMed]
  22. Griffith, S.M.; Huang, X.H.; Louie, P.K.K.; Yu, J.Z. Characterizing the thermodynamic and chemical composition factors controlling PM2.5 nitrate: Insights gained from two years of online measurements in Hong Kong. Atmos. Environ. 2015, 122, 864–875. [Google Scholar] [CrossRef]
Figure 1. Model domain setting and air quality station location (triangles). HK, Hong Kong; SZ, Shenzhen; DG, Dongguan; HZ, Huizhou; GZ, Guangzhou; FS, Foshan; ZQ, Zhaoqing; JM, Jiangmen; ZH, Zhuhai; ZS, Zhuhai.
Atmosphere 07 00098 g001
Figure 2. August and February averaged SO2 and NOx emissions in the Pearl River Delta (PRD) region. Unit: moles/s.
Atmosphere 07 00098 g002
Figure 3. The source regions defined in the PRD region.
Atmosphere 07 00098 g003
Figure 4. Model and observation comparison for two stations in the PRD region.
Atmosphere 07 00098 g004aAtmosphere 07 00098 g004b
Figure 5. Source category of sulfates and nitrates over ten cities over the PRD region in August.
Atmosphere 07 00098 g005
Table 1. Evaluation of hourly Weather Research Forecast (WRF) meteorology simulation.
RMSENMBIOA
FebruaryWind speed1.80.290.70
Wind direction-−0.160.88
Temperature (2m)30.120.81
AugustWind speed1.40.370.68
Wind direction-0.050.88
Temperature (2m)2.2−0.0090.73
Table 2. Evaluation of hourly particulate matter (PM2.5), sulfate and nitrate simulated by Comprehensive Air Quality Model with Extensions (CAMx).
PM2.5RMSEIOANMBMean-SimMean-OBS
February20.10.68−0.01244.243.5
August17.10.76−0.2419.926.0
SulfateRMSEIOANMBMean-SimMean-OBS
February6.10.60−0.1910.613.2
August4.90.81−0.354.26.6
NitrateRMSEIOANMBMean-SimMean-OBS
February6.00.430.625.23.2
August1.50.29−0.510.40.8
Table 3. Local, regional and super-regional contribution of sulfate and nitrate in 10 cities over the PRD region (in μg/m3).
Sulfate
FebruaryAugust
LocalRegionalS-RegionalLocalRegionalS-Regional
HZ0.4 (4%)0.2 (2%)10.0 (94%)0.3 (6%)1.1 (23%)3.4 (71%)
GZ1.5 (12%)1.3 (10%)9.5 (78%)1.3 (19%)1.6 (23%)4.0 (58%)
FS1.6 (11%)3.0 (22%)9.3 (67%)1.0 (14%)1.8 (26%)4.1 (60%)
DG1.2 (10%)1.3 (11%)9.7 (79%)0.9 (16%)1.4 (24%)3.6 (60%)
JM1.0 (8%)1.9 (16%)9.0 (76%)0.6 (12%)0.8 (15%)3.9 (74%)
SZ1.3 (11%)0.7 (7%)9.8 (82%)1.2 (22%)1.0 (19%)3.3 (60%)
ZS0.7 (6%)2.5 (20%)9.3 (74%)0.4 (8%)1.2 (23%)3.5 (69%)
ZQ0.8 (6%)2.7 (21%)9.2 (73%)0.4 (6%)1.9 (27%)4.7 (67%)
HK0.4 (4%)0.5 (5%)10.0 (92%)0.7 (16%)0.5 (12%)3.1 (73%)
ZH0.6 (5%)1.6 (14%)9.3 (81%)0.3 (7%)0.7 (15%)3.3 (77%)
Nitrate
FebruaryAugust
LocalRegionalS-RegionalLocalRegionalS-Regional
HZ0.7 (12%)0.2 (4%)5.0 (85%)0.1 (13%)0.4 (49%)0.3 (38%)
GZ1.7 (17%)3.2 (33%)4.8 (50%)0.2 (22%)0.5 (54%)0.2 (24%)
FS1.7 (14%)5.4 (44%)5.2 (42%)0.2 (23%)0.4 (49%)0.2 (28%)
DG0.8 (10%)2.7 (34%)4.3 (55%)0.04 (11%)0.2 (58%)0.1 (31%)
JM0.9 (9%)4.3 (47%)4.1 (44%)0.2 (25%)0.2 (31%)0.3 (44%)
SZ1.0 (13%)1.4 (19%)5.0 (68%)0.1 (14%)0.2 (51%)0.1 (35%)
ZS0.6 (5%)5.4 (50%)4.9 (45%)0.1 (11%)0.4 (64%)0.2 (25%)
ZQ0.8 (7%)5.5 (48%)5.2 (45%)0.1 (8%)0.6 (60%)0.3 (32%)
HK0.6 (10%)0.8 (14%)4.6 (76%)0.1 (30%)0.2 (40%)0.1 (30%)
ZH0.5 (6%)3.9 (49%)3.6 (45%)0.1 (15%)0.3 (59%)0.1 (26%)
Table 4. Regional contribution of sulfates and nitrates by other cities (top 3 for each).
February
SulfateNitrate
HZHK (24%)SZ (21%)DG (20%)SZ (34%)DG (22%)GZ (21%)
GZDG (28%)HK (21%)SZ (18%)DG (24%)SZ (24%)HK (19%)
FSGZ (49%)HK (12%)JM (9%)GZ (38%)HK (12%)DG (11%)
DGSZ (31%)HZ (31%)HK (18%)HZ (34%)SZ (34%)HK (20%)
JMGZ (27%)FS (21%)HK (15%)GZ (29%)FS (22%)DG (12%)
SZHK (36%)HZ (30%)DG (23%)HK (40%)HZ (39%)DG (17%)
ZSHK (23%)SZ (17%)ZH (14%)HK (24%)GZ (20%)SZ (20%)
ZQFS (34%)GZ (19%)JM (14%)FS (28%)GZ (26%)JM (15%)
HKSZ (55%)HZ (20%)DG (11%)SZ (47%)HZ (34%)DG (11%)
ZHHK (26%)DG (15%)SZ (14%)HK (21%)GZ (20%)SZ (20%)
August
SulfateNitrate
HZHK (36%)DG (21%)SZ (18%)HK (39%)SZ (27%)DG (17%)
GZDG (30%)HK (16%)FS (14%)DG (21%)HK (16%)FS (14%)
FSGZ (27%)JM (16%)DG (15%)JM (37%)GZ (17%)ZH (15%)
DGSZ (32%)HK (27%)GZ (15%)SZ (27%)HK (25%)GZ (13%)
JMHK (21%)FS (17%)ZH (16%)FS (27%)ZH (27%)GZ (20%)
SZHK (62%)DG (13%)GZ (7%)HK (51%)GZ (13%)DG (10%)
ZSZH (23%)HK (19%)GZ (18%)HK (20%)ZH (20%)GZ (19%)
ZQFS (23%)GZ (16%)JM (16%)JM (38%)FS (16%)ZH (12%)
HKSZ (41%)DG (20%)GZ (15%)SZ (39%)GZ (16%)DG (14%)
ZHHK (25%)GZ (18%)DG (16%)GZ (25%)SZ (21%)DG (14%)
Table 5. Source apportionment of sulfates and nitrates in the city centers of Guangzhou, Shenzhen and Hong Kong.
February-SulfatesGZSZHK
Local32%16%6%
Regional9%6%3%
Super-regional59%78%91%
August-SulfatesGZSZHK
Local32%25%23%
Regional18%20%10%
Super-regional47%55%67%
February-NitratesGZSZHK
Local27%15%12%
Regional34%14%9%
Super-regional39%71%79%
August-NitratesGZSZHK
Local33%24%11%
Regional47%43%49%
Super-regional20%33%40%

