Article

Potential Sources and Formations of the PM2.5 Pollution in Urban Hangzhou

1
Institute of Water Resources and Hydro-Electric Engineering, Xi’an University of Technology, Xi’an 710048, China
2
Zhejiang Environmental Science & Design Institute, Hangzhou 310007, China
3
Hangzhou Environmental Monitoring Center Station, Hangzhou 310007, China
4
Shanghai Academy of Environmental Sciences, Shanghai 200233, China
*
Authors to whom correspondence should be addressed.
Atmosphere 2016, 7(8), 100; https://doi.org/10.3390/atmos7080100
Submission received: 16 June 2016 / Revised: 11 July 2016 / Accepted: 12 July 2016 / Published: 28 July 2016

Abstract

:
Continuous measurements of meteorological parameters, gaseous pollutants, particulate matters, and the major chemical species in PM2.5 were conducted in urban Hangzhou from 1 September to 30 November 2013 to study the potential sources and formations of PM2.5 pollution. The average PM2.5 concentration was 69 µg·m−3, ~97% higher than the annual concentration limit in the national ambient air quality standards (NAAQS) of China. Relative humidity (RH) and wind speed (WS) were two important factors responsible for the increase of PM2.5 concentration, with the highest value observed under RH of 70%–90%. PM2.5 was in good correlation with both NO2 and CO, but not with SO2, and the potential source contribution function (PSCF) results displayed that local emissions were important potential sources contributing to the elevated PM2.5 and NO2 in Hangzhou. Thus, local vehicle emission was suggested as a major contribution to the PM2.5 pollution. Concentrations of NO2 and CO significantly increased in pollution episodes, while the SO2 concentration even decreased, implying local emission rather than region transport was the major source contributing to the formation of pollution episodes. The sum of SO42−, NO3, and NH4+ accounted for ~50% of PM2.5 in mass in pollution episodes and the NO3/EC ratios were significantly elevated, revealing that the formation of secondary inorganic species, particularly NO3, was an important contributor to the PM2.5 pollution in Hangzhou. This study highlights that controlling local pollution emissions was essential to reduce the PM2.5 pollution in Hangzhou, and the control of vehicle emission in particular should be further promoted in the future.

1. Introduction

Fine particles (PM2.5) in the atmosphere have great impacts on public health [1] and climate change [2,3]. Due to the rapid economic development, urbanization, and motorization, PM2.5 pollution frequently occurred in China during the past decade, which has attracted great attention from the public, government, and atmospheric researchers in China.
Atmospheric PM2.5 is mostly related to anthropogenic emissions from industries, traffic transportation, power plants, biomass burning, and so on. Coal combustion is a major source of PM2.5 in China, particularly during the heating season in northern China [4,5]. However, in the urban region of megacities, the rapid increase of motor vehicles has become a more and more significant contributor to the atmospheric NOx and particles [6,7,8,9]. In addition, biomass burning is an important source of PM2.5 during the post-harvest seasons from May to June and from October to November [10,11]. Accumulation of anthropogenic pollutants under stagnant weather conditions frequently triggers the occurrence of pollution episodes [12,13]. Besides, the gas-to-particle transformations of SO2, NOx, and VOCs also substantially contribute to the formation of PM2.5 pollution [7,14], particularly under high RH condition [15], with the sum of secondary inorganic species NO3, SO42−, and NH4+ accounting for ~77% of the total PM2.5 mass [10].
Hangzhou, capital city of Zhejiang Province, is one of the most polluted cities in the Yangtze Delta Region (YDR) in China [16]. Cao et al. indicated that fugitive dust, secondary aerosol, and carbonaceous matters were the most abundant species in the PM10 over Hangzhou in 2001–2002 and that coal combustion was the major source throughout the year [17]. Based on the source apportionment by positive matrix factorization (PMF), Liu et al. revealed that iron/steel manufacturing and secondary aerosols were two main sources for the PM2.5 in urban Hangzhou in 2004–2005 [18]. Jansen et al. revealed that secondary inorganic aerosol played an important role in the haze formation in Hangzhou [19]. Since 2002 several pollution control measurements including energy and industrial restructuring have been made to improve the air quality in Hangzhou, and the industrial coal consumption decreased from 14,580,321 ton in 2005 to 13,427,337 ton in 2013 [20]. In contrast, the number of motor vehicles in Hangzhou has substantially increased from 1,087,412 in 2005 to 2,542,976 in 2013 [20], suggesting an increasing contribution of vehicle emission to PM2.5 pollution. However, relatively few studies have been focused on characteristics, sources, and formation mechanisms of the PM2.5 pollution in urban Hangzhou since 2010 [11,19]. In this study, the effects of meteorological factors and anthropogenic gaseous pollutants on the particulate matters (PM) in urban Hangzhou were examined, based on continuous measurements of both metrological parameters and hourly concentrations of PM2.5, PM10, CO, SO2, and NO2 from 1 September to 30 November 2013, and PM2.5 with its major chemical components were measured and analyzed to reveal the potential sources and formations of PM2.5 pollution.

2. Methods

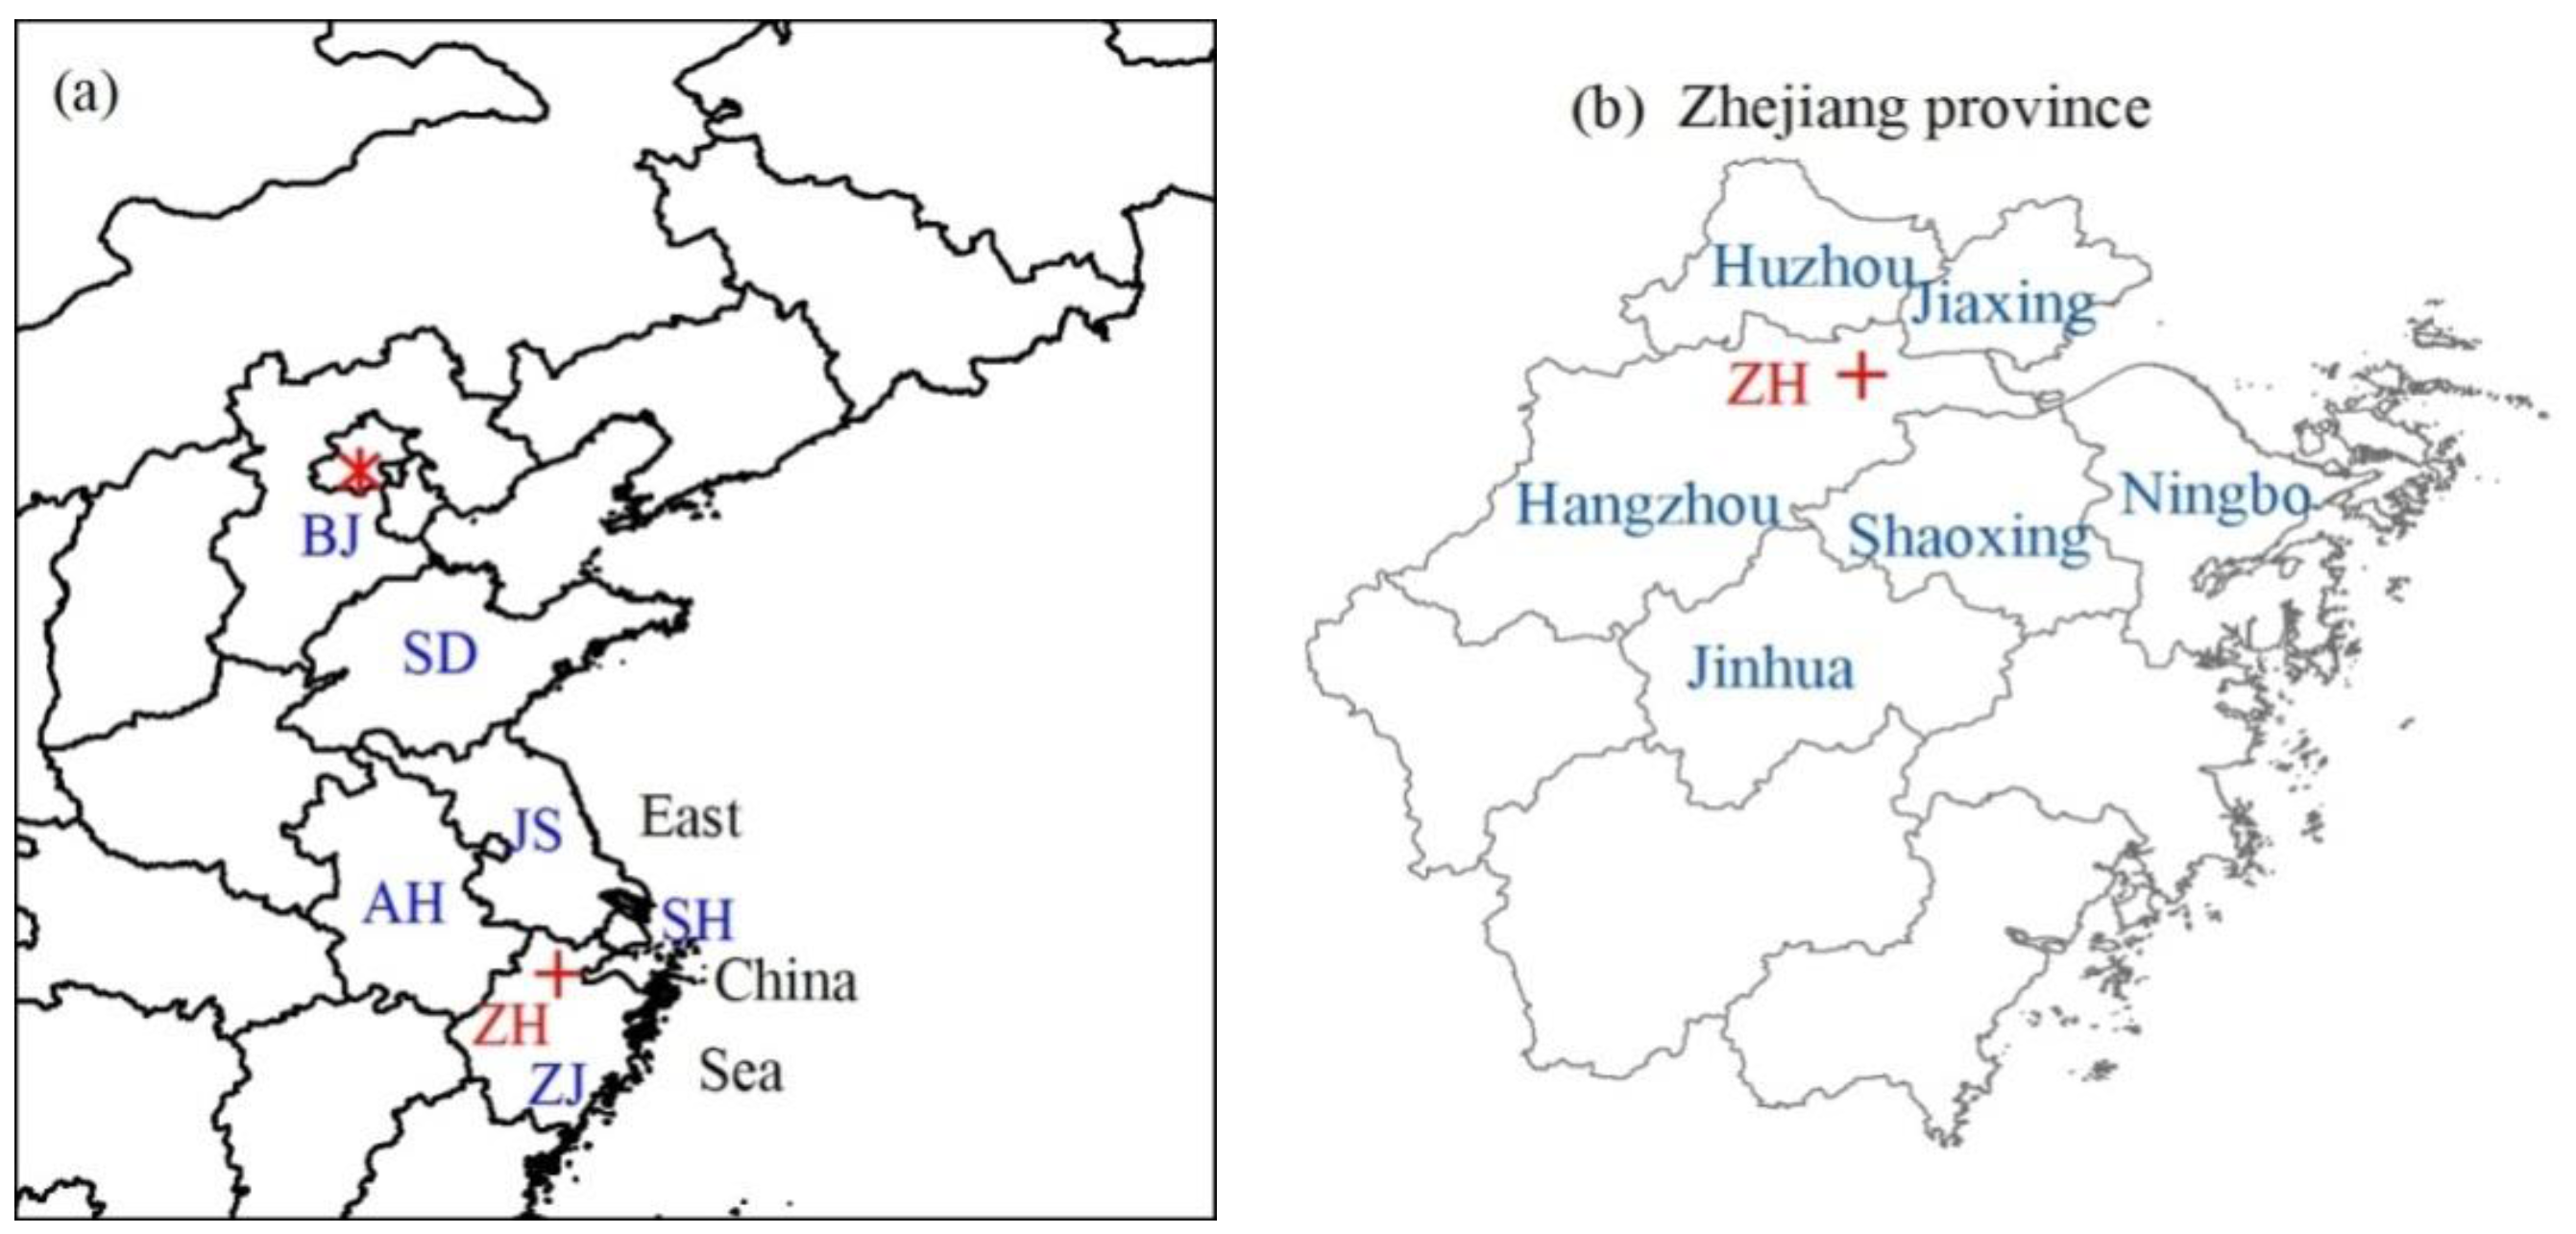
2.1. Particles and Gaseous Pollutants Monitoring

Hourly concentrations of PM2.5, PM10, CO, SO2, and NO2 from 1 September to 30 November 2013 were observed in a state-controlled observation site, Zhaohui (ZH), which is on the rooftop (~20 m above ground level) of a residential building in Xiacheng district (Figure 1) in Hangzhou. This site is located in a mixed-use urban area (office, commercial, residential, and traffic). PM2.5 samples were collected at ZH site from 10 October to 2 November 2013. Two aerosol samples on each day were simultaneously collected for ~24 h (normally from 09:00 to 09:00 of the next day) on both quartz filters (7202, Pall Corporation, New York, NY, USA) and Teflon filters (7592–104, Whatman Inc., Maidstone, UK) using two samplers (frmOMNI, BGI Inc., Butler, NJ, USA; flow rate: 5.0 L·min−1). All the samples were reserved in a refrigerator immediately after sampling. The filters were weighed before and after sampling using an analytical balance (AX205, METTLER TOLEDO, reading precision: 10 µg) after conditioned at a constant temperature (25 ± 1 °C) and relative humidity 50% ± 2%) for over 24 h. All the procedures were strictly quality controlled to avoid any possible contamination of the samples.

2.2. Chemical Analysis

Inorganic ions: Part of the sampled and blank quartz filters (~4.33 cm2) were ultrasonically extracted with 10 mL deionized water (>18 MΩ·cm−1) to measure the concentrations of water-soluble ions. Inorganic ions of SO42−, NO3, Cl, Na+, NH4+, K+, Mg2+, and Ca2+ were analyzed using an Ion Chromatography (Dionex 500, Dionex, Sunnyvale, CA, USA). The detailed procedures were described elsewhere [21,22].
Elements: The sampled Teflon filters were used to determine the concentrations of elements. A total of 13 elements including Al, Fe, K, Zn, Pb, Ba, Mn, Cu, Ti, Cr, Ni, As, and Co were determined using an Energy Dispersive X-ray Fluorescence (EDXRF) (Epsilon 5, PANalytical B.V., Almelo, The Netherlands). The detailed procedures were described by Zhang et al. [23].
Organic carbon (OC) and elemental carbon (EC): The sampled quartz filters were used to determine the concentrations of OC and EC, which were determined using a Carbon Analyzer (DRI Model 2001, Atmoslytic, Calabasas, CA, USA), following the Interagency Monitoring of Protected Visual Environments (IMPROVE) thermal/optical reflectance (TOR) protocol. The detailed procedures were described by Wang et al. [22].

2.3. Meteorological Data

Hourly values of ambient temperature, RH, WS, and wind directions (WD) were observed using a compact weather station (WS500-UMB, LUFFT, Fellbach, Germany) at ZH site.

2.4. Back Trajectory and the PSCF

Forty-eight-hour back trajectories of air masses arriving at ZH site at a height of 500 m were calculated every hour from 1 September to 30 November 2013, using the NOAA Hybrid Single-Particle Lagrangian Integrated Trajectory (HYSPLIT) model with GDAS one-degree archive meteorological data [24]. The height of 500m is chosen here as the averages of nighttime and daytime boundary heights of cities were mostly around or higher than 500 m [10,25,26], and air pollutants are well mixed below this layer. The height of 500 m is frequently chosen as the receptor height for backward air trajectories [14,27,28,29,30].
Based on the back trajectory results, the PSCF was calculated to infer the potential source regions contributing to elevated concentrations of atmospheric particles and the associate precursors in urban Hangzhou. The PSCF value is calculated as PSCFi,j = mi,j/ni,j, where ni,j is the total number of trajectory endpoints falling within grid cell (i,j), and mi,j is the number of trajectory endpoints with pollutant concentration higher than a set threshold in grid cell (i,j). The average concentration of each pollutant during the study period was used as the threshold. To minimize the biased PSCF caused by the low ni,j values, a weighting function was applied to the PSCF [31,32].

2.5. Estimation of Secondary Organic Carbon

The EC tracer method was used to estimate the concentration of secondary organic carbon (SOC) in PM2.5 [33,34], which was calculated as the following equations:
SOC = OC−POC
POC = EC×(OC/EC)pri ≈ EC×(OC/EC)min
where OC and EC are the measured concentrations of OC and EC in PM2.5, POC is the concentration of primary organic carbon, (OC/EC)pri is the primary OC to EC ratio, and (OC/EC)min is the minimum ratio of OC to EC, which is frequently used as (OC/EC)pri to calculate SOC concentrations [35,36]. In this study the (OC/EC)min in PM2.5 was 2.37.

3. Results and Discussion

Figure 2 shows the PM2.5 and PM10 concentrations and the mass ratio of PM2.5/PM10 during the study time in urban Hangzhou. The average concentrations of PM2.5 and PM10 were 69 µg·m−3 and 106 µg·m−3, respectively. According to the NAAQS of China, in which the Grade II concentration limits for daily and annual average concentration are 75 and 35 µg·m−3 for PM2.5 and 150 and 70 µg·m−3 for PM10, the average PM2.5 concentration was ~97% higher than the annual concentration limit, and daily PM2.5 concentration exceeded the daily concentration limit in 37 out of 91 days (~41%). In comparison, the average PM10 concentration was ~51% higher than the annual concentration limit, with daily PM10 concentration in ~16% of the 91 days exceeded the daily concentration limit in the NAAQS. Apparently, the PM2.5 pollution is more serious than the PM10 pollution in Hangzhou. The average mass ratio of PM2.5/PM10 was 66% (in the range from 35% to 96%) (Figure 2), indicating that PM2.5 was more abundance in PM10 than the coarse particles (PM2.5–10). Coarse particles in atmosphere are mainly derived from local dust emission, including vehicle and construction dust, and regional dust transport, while fine particles are mostly attributed to the accumulation of primarily anthropogenic particles and the gas-to-particle transformations of gaseous pollutants that are emitted from vehicle emission, coal burning, industry emission, biomass burning, and so on. Thus, the high abundance of PM2.5 in PM10 might suggest a major contribution of anthropogenic emission sources to the atmospheric particles in urban Hangzhou.

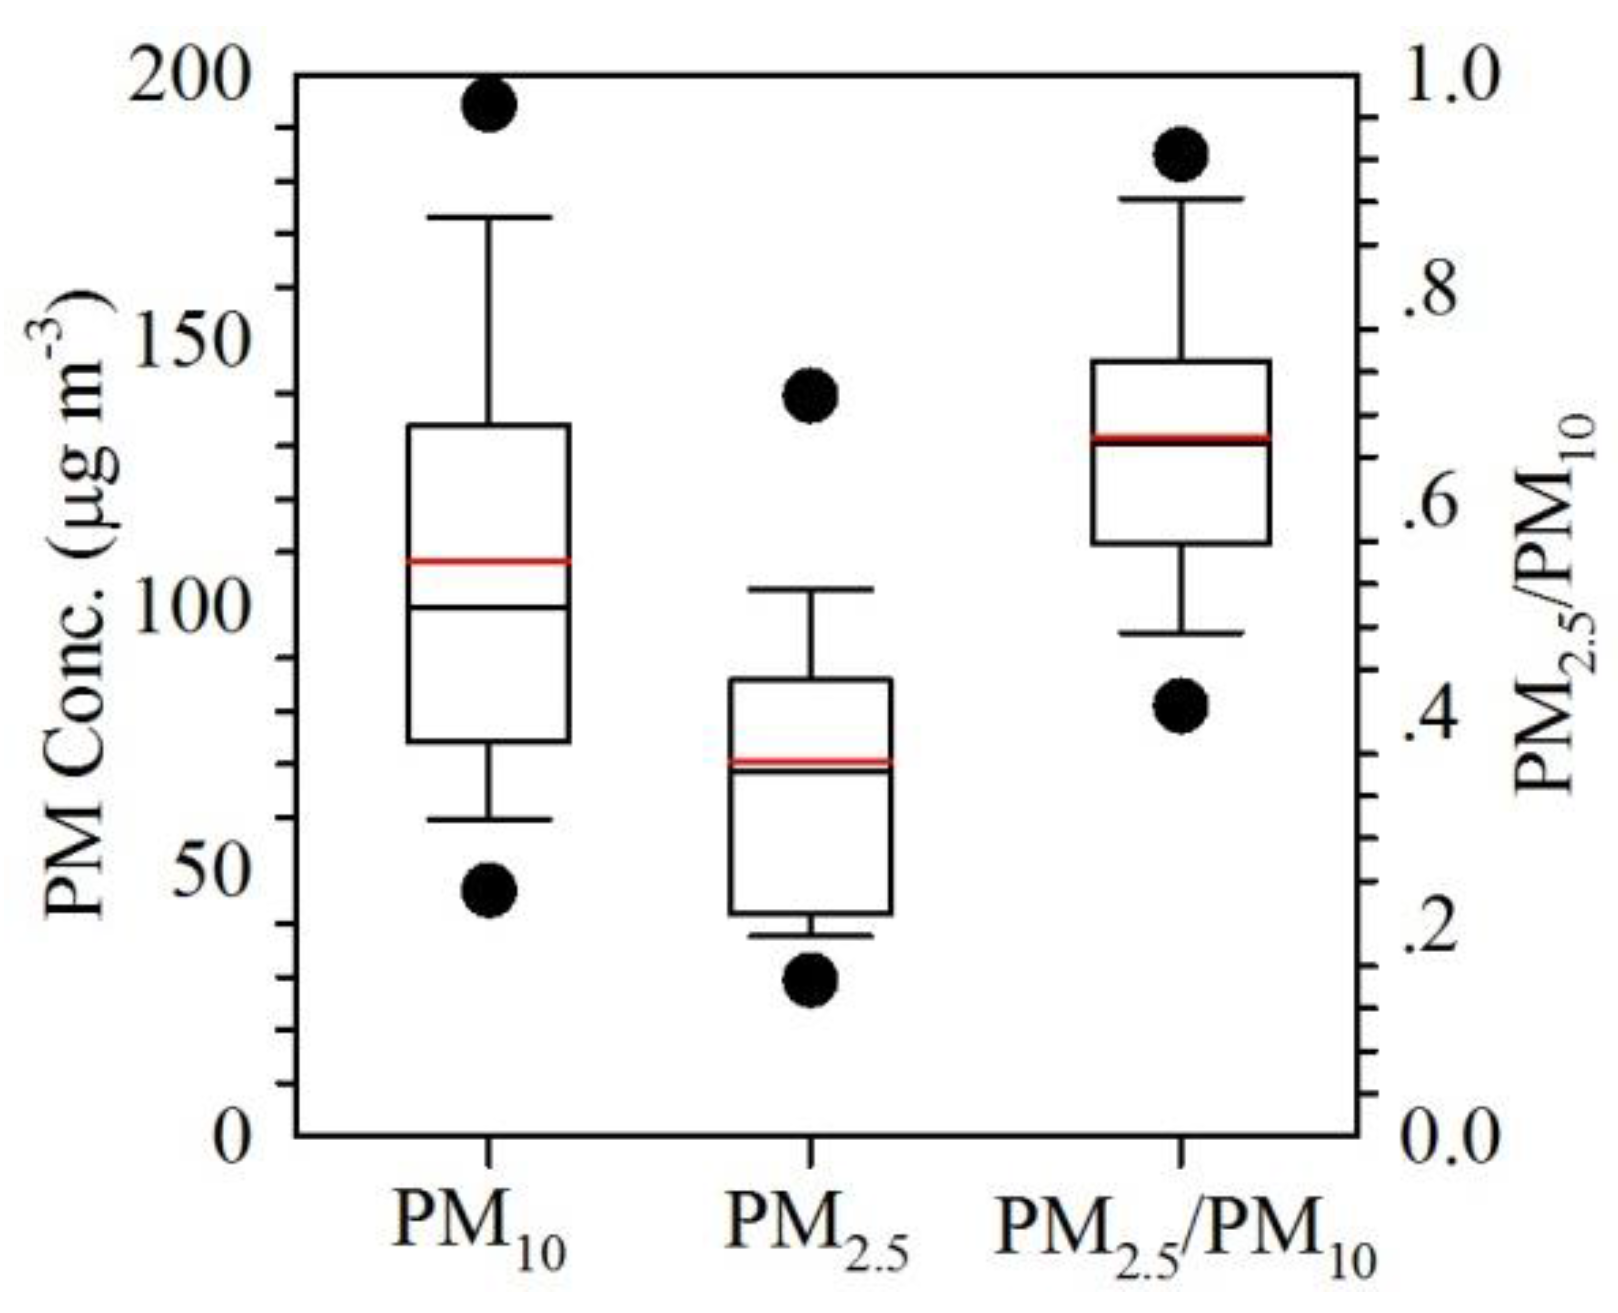
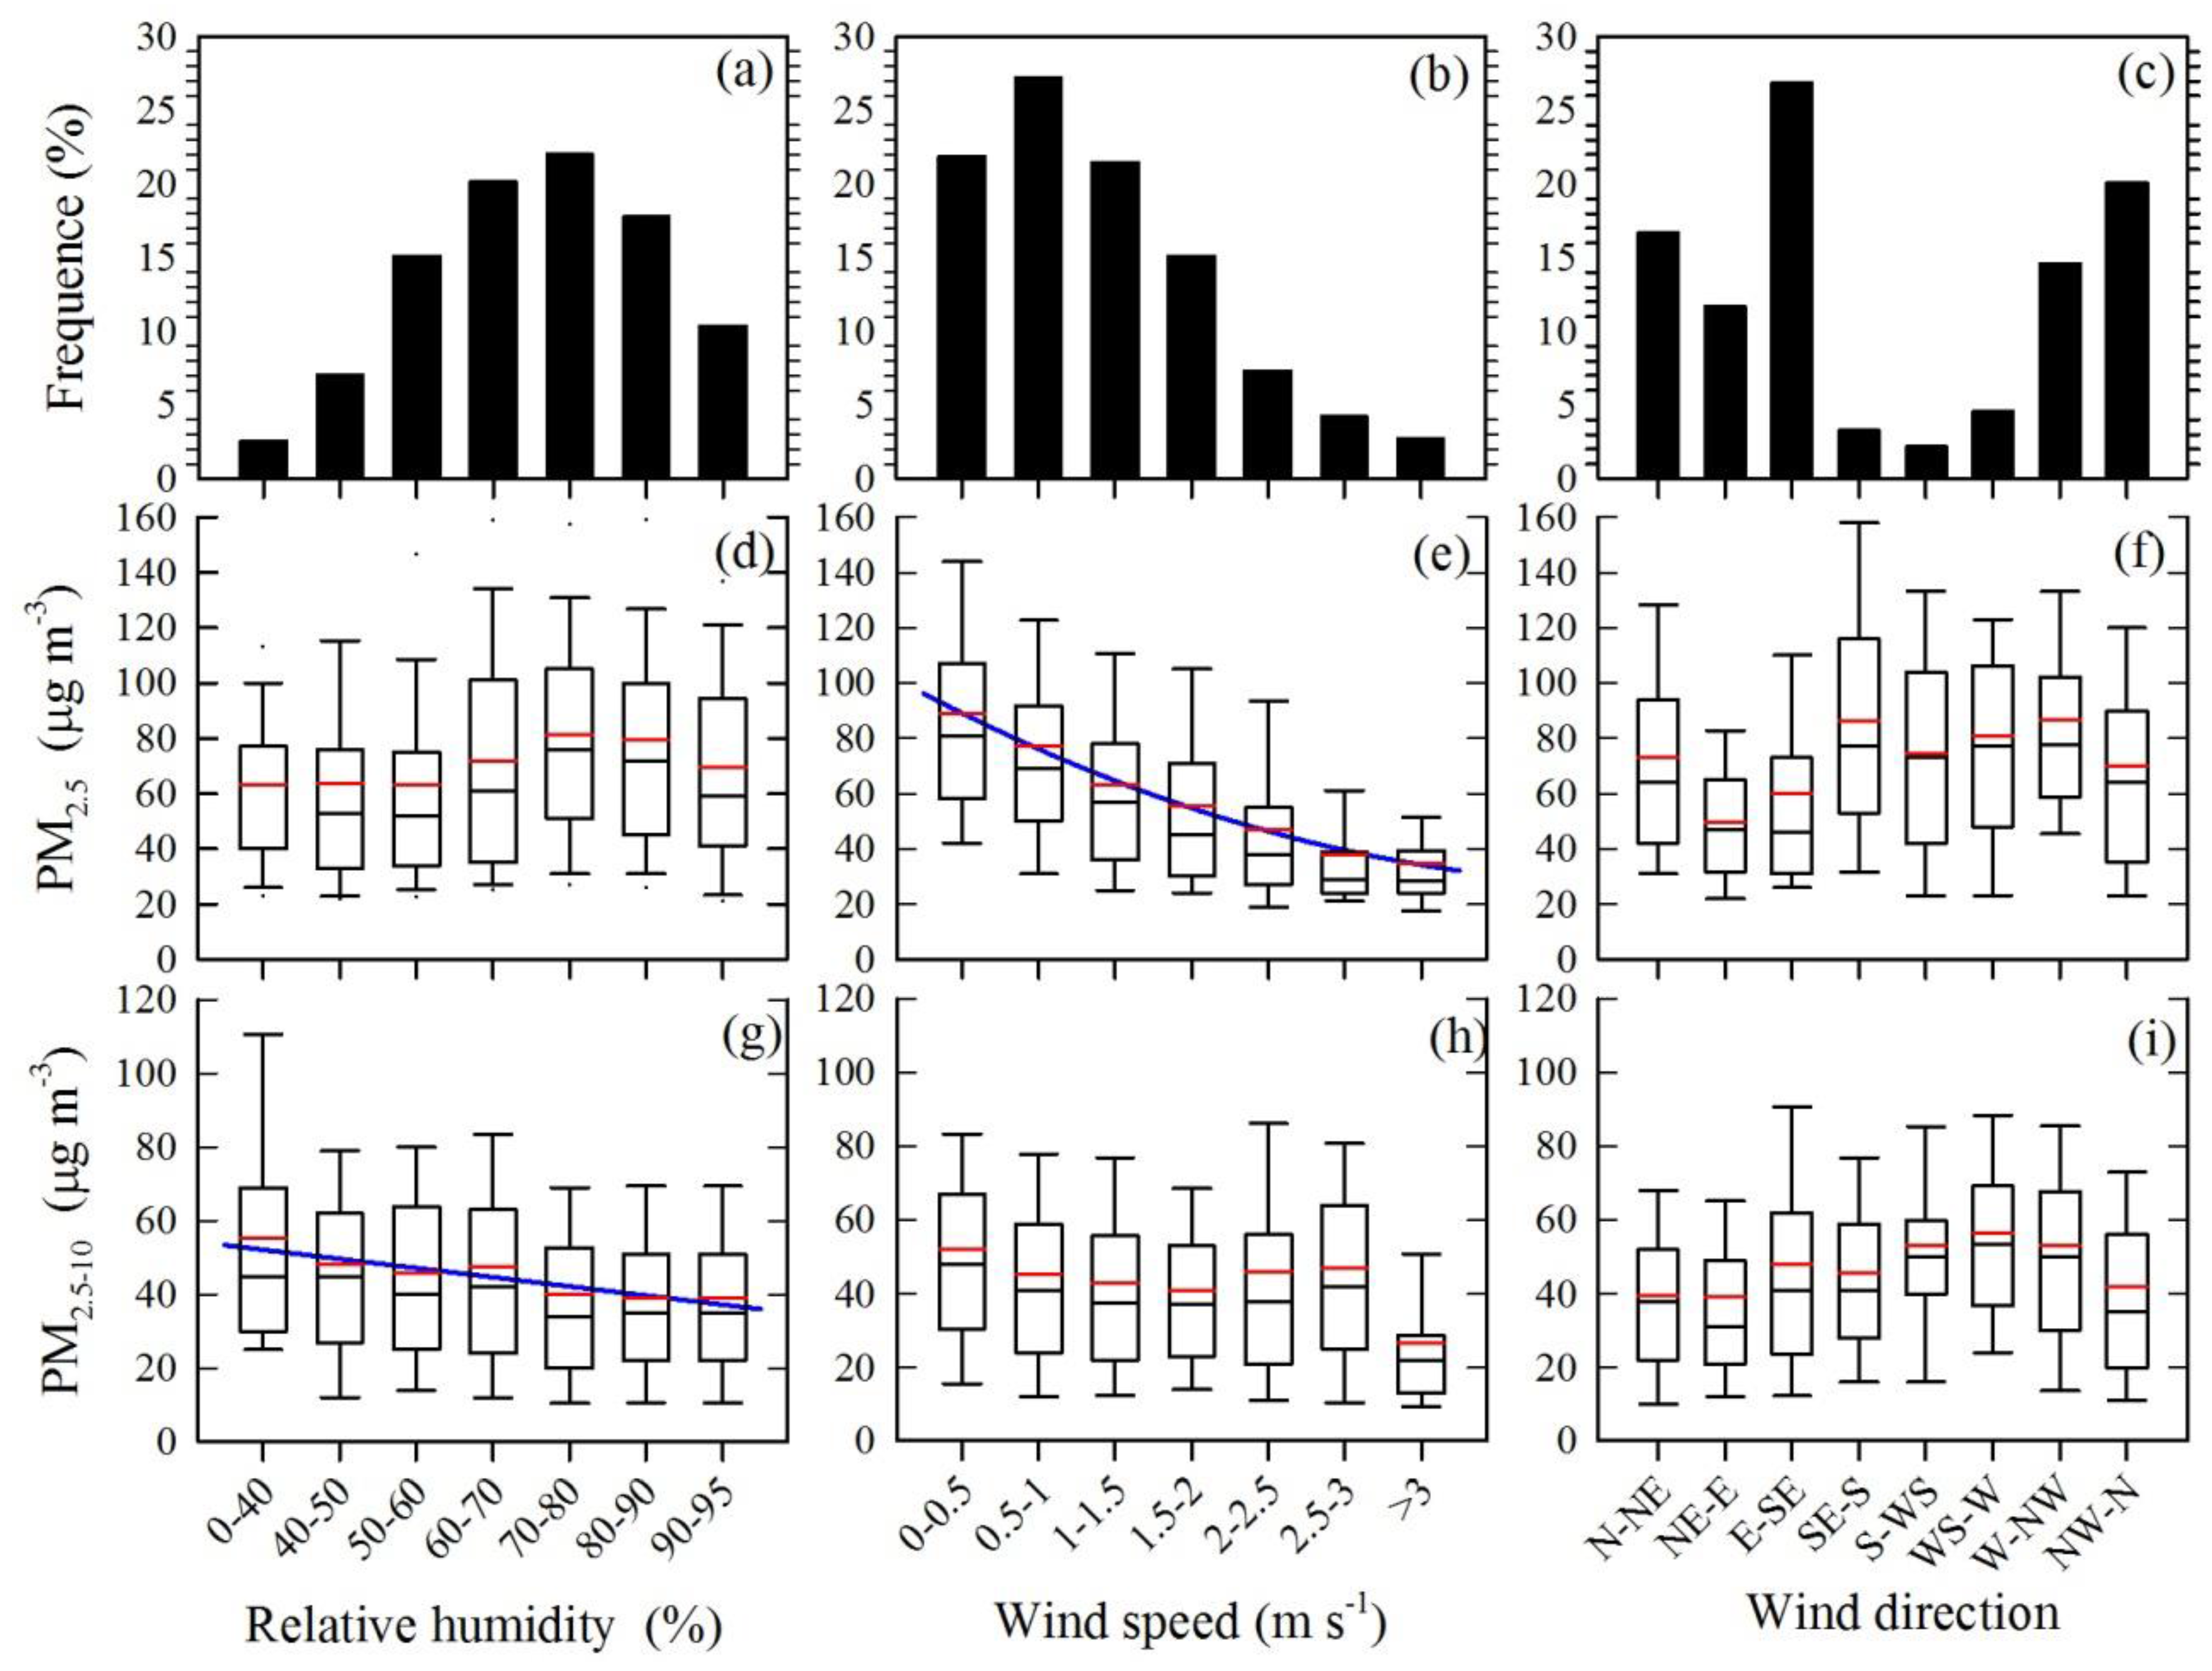
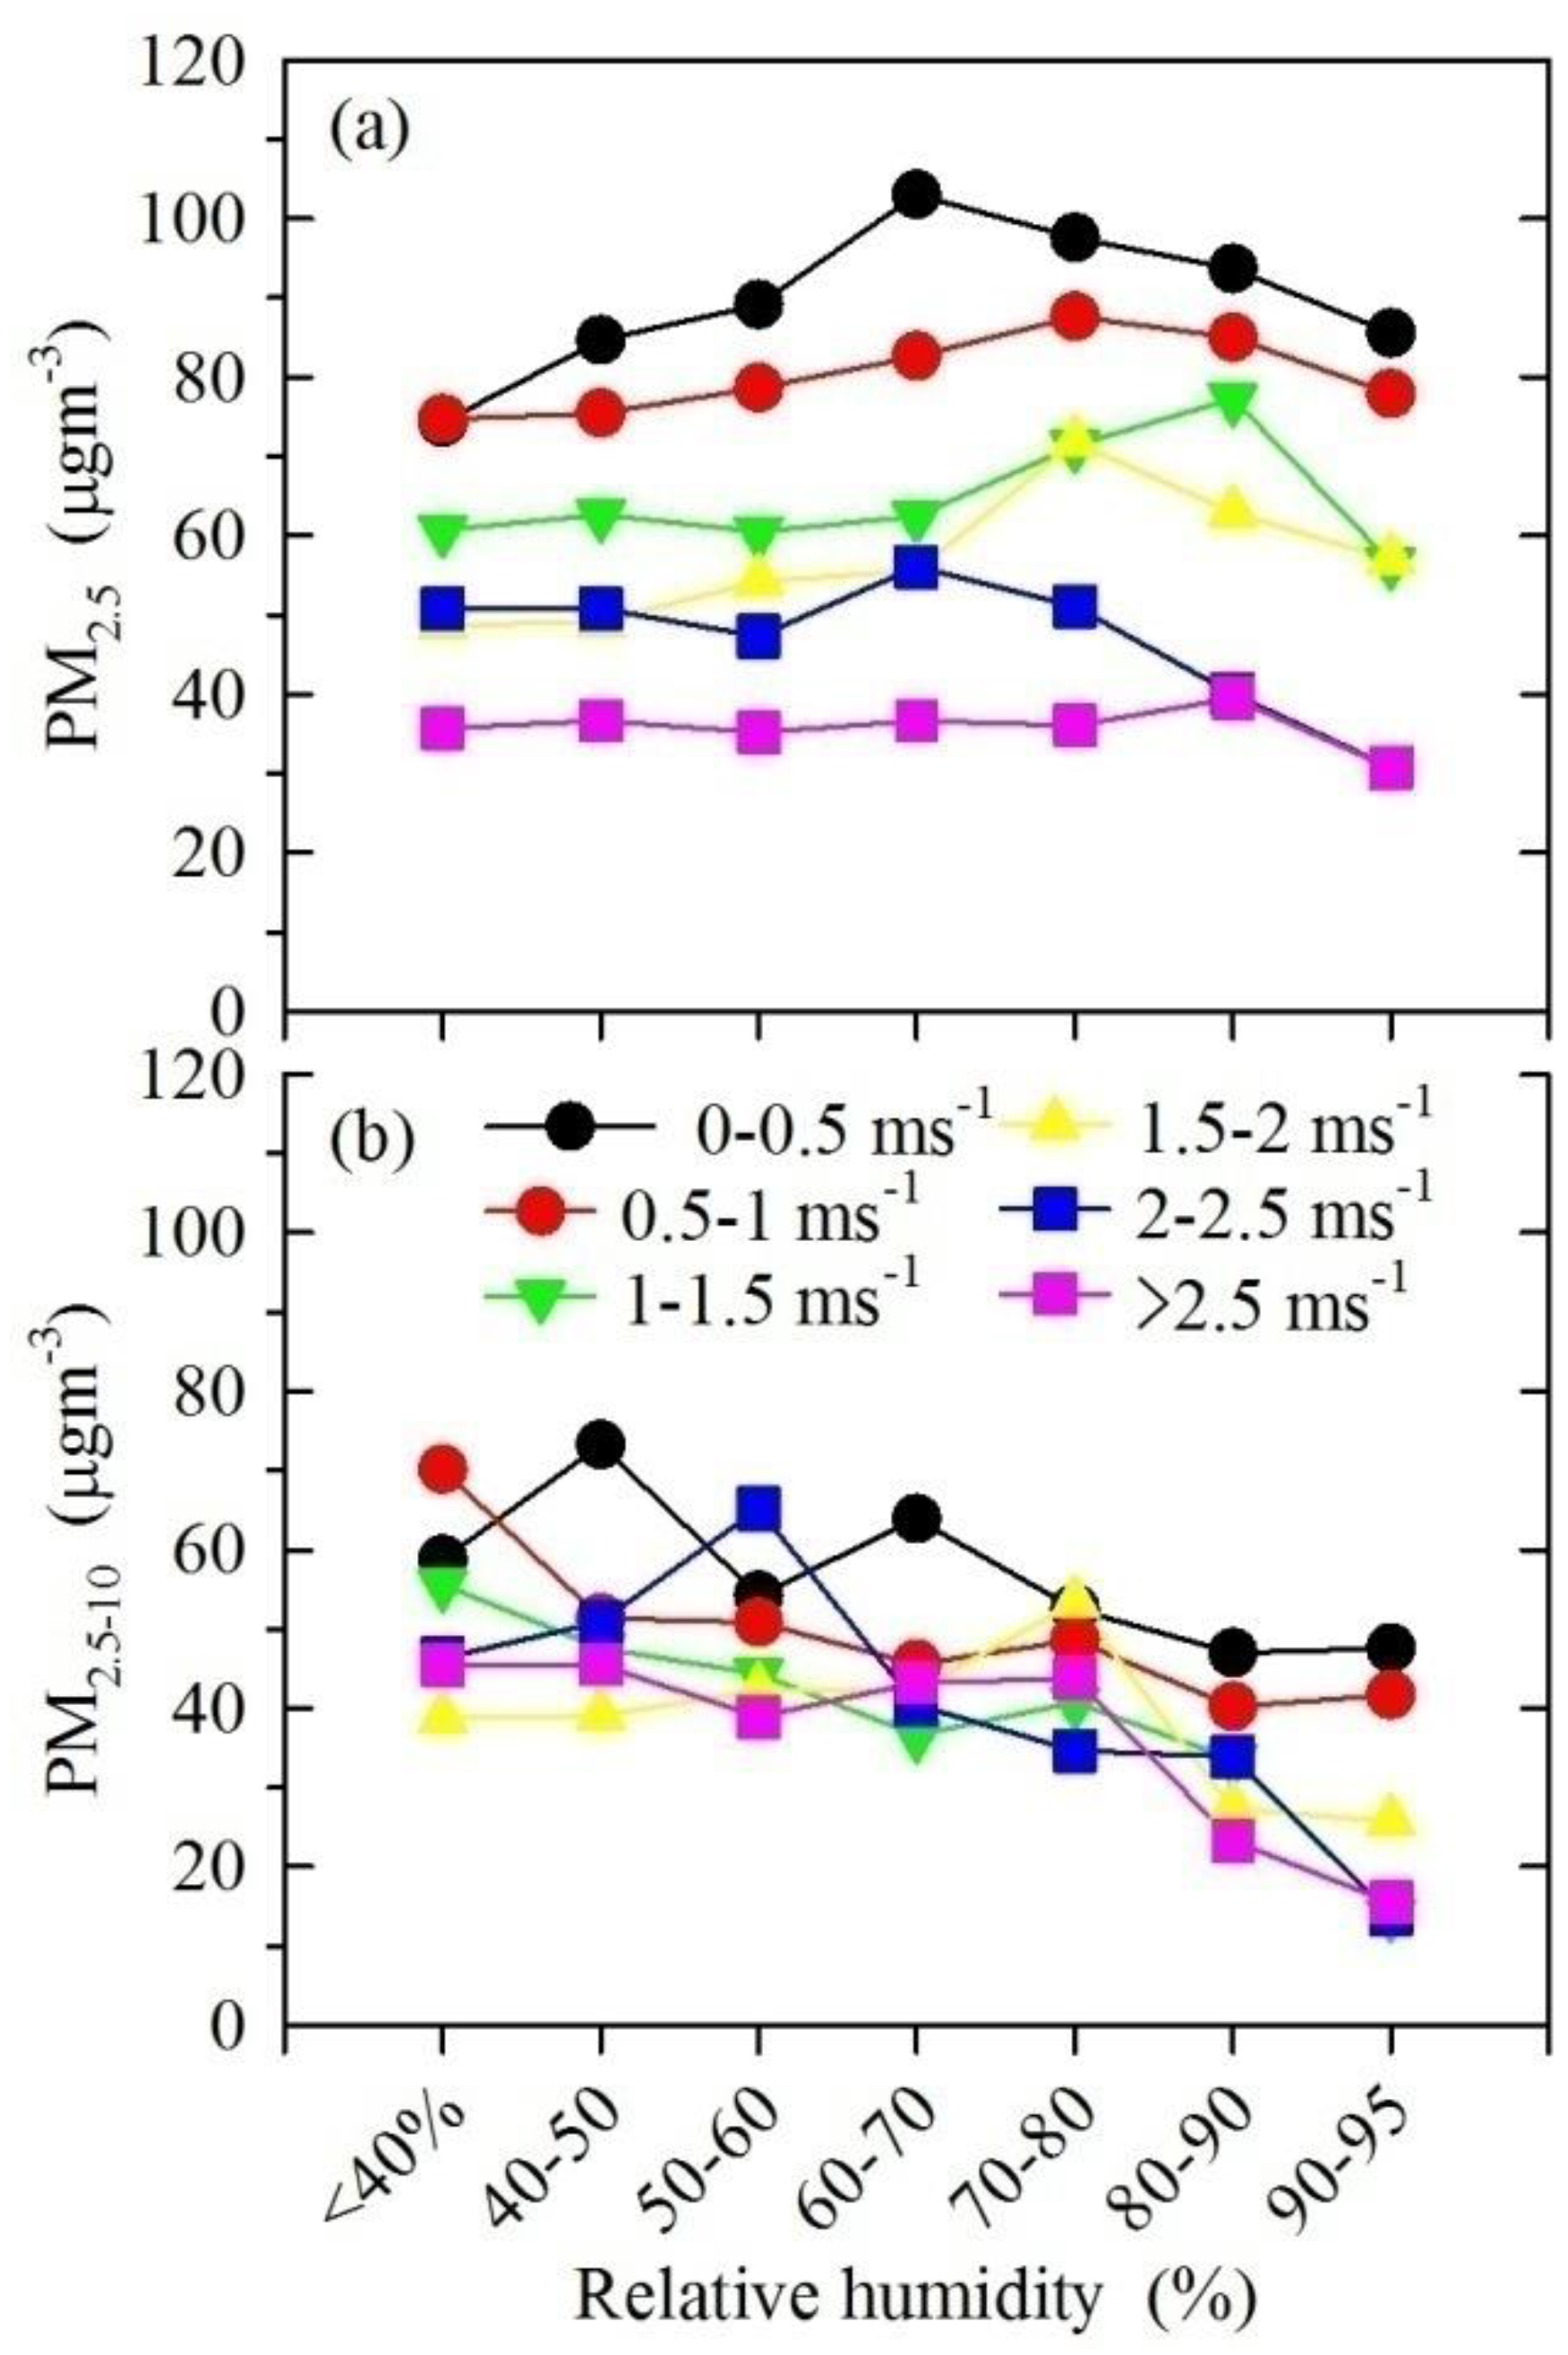
3.1. Effects of Meteorological Parameters on PM2.5 and PM2.5–10

Meteorological parameters including the height of planetary boundary layer (PBLH), temperature, RH, and wind conditions play important roles in determining the transport, diffusion, transformation, and deposition of air pollutants. PBLH is a critical factor affecting the vertical dilution of air pollutants, and decreasing PBLH could trap anthropogenic pollutants emitted from the Earth’s surface, causing high concentrations of air pollutants [37,38,39]. Unfortunately, PBLH was not observed during the study period, and the effects of PBLH on PM concentrations can not be examined in this study. The effects of temperature on PM concentrations are complicated. High temperature in summer promotes the formation of particulate sulfate, but dissociates part of particulate nitrate [40,41], while low temperature in winter is favorable for the absorption and condensation of secondary organic aerosols [42]. Generally, temperature is not significantly correlated to PM concentrations [43,44]. In comparison, wind conditions and RH are two important factors influencing the PM concentrations. Calm or low wind speed cause accumulation of air pollutants [12,45], resulting in elevated pollution concentrations, and wind directions affect the regional/long-range transport of air pollutants [14,44]. High RH is favorable for the formation of secondary particles [7,15], contributing to high pollution concentrations. Thus, we examined the effects of RH, WS, and WD on the PM2.5 and PM2.5–10 concentrations in this study, and the results are shown in Figure 3. All the statistical results in Figure 3 were based on hourly values of meteorological parameters and hourly PM2.5 and PM2.5–10 concentrations.
Figure 3d,g show the PM2.5 and PM2.5–10 concentrations at different RH ranges from 0%–95%. Those hours with RH > 95% were mostly under rainy condition and the data were excluded. Apparently, RH played an important role in the formation of PM2.5, i.e., secondary PM2.5, in Hangzhou, as the PM2.5 concentration was significantly elevated when RH was higher than 60%, and the highest value was observed when RH was in the range of 70%–90%. It has been explored that the heterogeneous reactions of gaseous pollutants on particle surface are substantially promoted under high RH condition [15,46,47], and haze episodes frequently occur in high RH level of >60% [7,10,48]. Notably, the occurrence of RH from 60%–90% was highest in Hangzhou (Figure 3a), implying a significant contribution of secondary formation to the PM2.5. In comparison, the PM2.5–10 concentration tended to decrease along with the increase of RH, with the lowest concentration observed in the highest RH condition, which could be attributed to the enhanced deposition of coarse particles under high RH condition, as coarse particles are primarily emitted from dust sources.
Figure 3e indicates that WS was an important factor responsible for the increase of PM2.5 concentration in Hangzhou, as the PM2.5 concentration decreased significantly along with the increase of WS. Firstly, accumulation of local anthropogenic emissions resulted in increases of both particles and gaseous pollutants under low WS condition. Secondly, the enhanced gaseous pollutants would favor the gas-to-particle transformations, leading to an increase of secondary particles. The PM2.5–10 concentrations decreased slightly as WS increased from 0–0.5 to 1.5–2.0 m·s−1 (Figure 3h), implying that the local emissions of coarse particles did not significantly change under low WS of <2.0 m·s−1. While under WS of 2.0–3.0 m·s−1, the PM2.5–10 concentration was elevated to ~47 µg·m−3 (average value) again, which could be attributed to the enhanced emission of dust particles under high WS. When the WS was higher than 3.0 m·s−1, both the PM2.5 and PM2.5–10 concentrations dropped to their lowest values, due to the favorable meteorological condition for the dilution of atmospheric pollutants. The occurrence of low WS (<2.0 m·s−1) was up to ~85% in Hangzhou (Figure 3b). Thus, local anthropogenic emission could easily trigger pollution episodes [37].
As both RH and WS significantly affected the PM concentrations, we further examined the relationship between WS, RH, and the PM2.5 and PM2.5–10 concentrations. As shown in Figure 4a, under a certain WS range the PM2.5 concentrations were elevated at RH level of 60%–90% compared to the concentrations at RH level of <60%. For example, when WS was in the range of 0–0.5 m·s−1 the averaged PM2.5 concentrations increased from 74–89 µg·m–3 at RH level of <60% to 94–103 µg·m−3 at RH level of 60%–90%, and when WS was in the range of 0.5–1 m·s−1 the averaged PM2.5 concentrations increased from 75–79 µg·m−3 to 83–88 µg·m−3. In comparison, the PM2.5–10 concentration mostly decreased along with the increase of RH at different WS ranges. These results revealed that, in addition to high concentrations caused by the accumulation process under unfavorable low wind condition, high RH level of >60% could further elevated PM2.5 concentrations, due to enhanced formation of secondary particles. Figure 4 also displayed that under a certain RH range the PM2.5 concentration significantly increased as WS decreased, while the PM2.5–10 concentration slightly varied, further indicating that WS played an important role in the PM2.5 pollution in Hangzhou.
As shown in Figure 3f, the PM2.5 concentration under the wind blown from northeastern direction to southeastern direction was lower than that from other directions, due to dilution effect of the clean air from the ocean. Fortunately, ~35% of the wind in autumn in Hangzhou was from northeastern direction to southeastern direction, favorable for cleaning up the local emissions. The impact of wind directions on PM2.5–10 was not as significant as that on PM2.5. However, the PM2.5–10 concentration was slightly elevated under the wind blew from southwestern and northwestern directions, implying a potential regional transport of coarse particles from these directions.

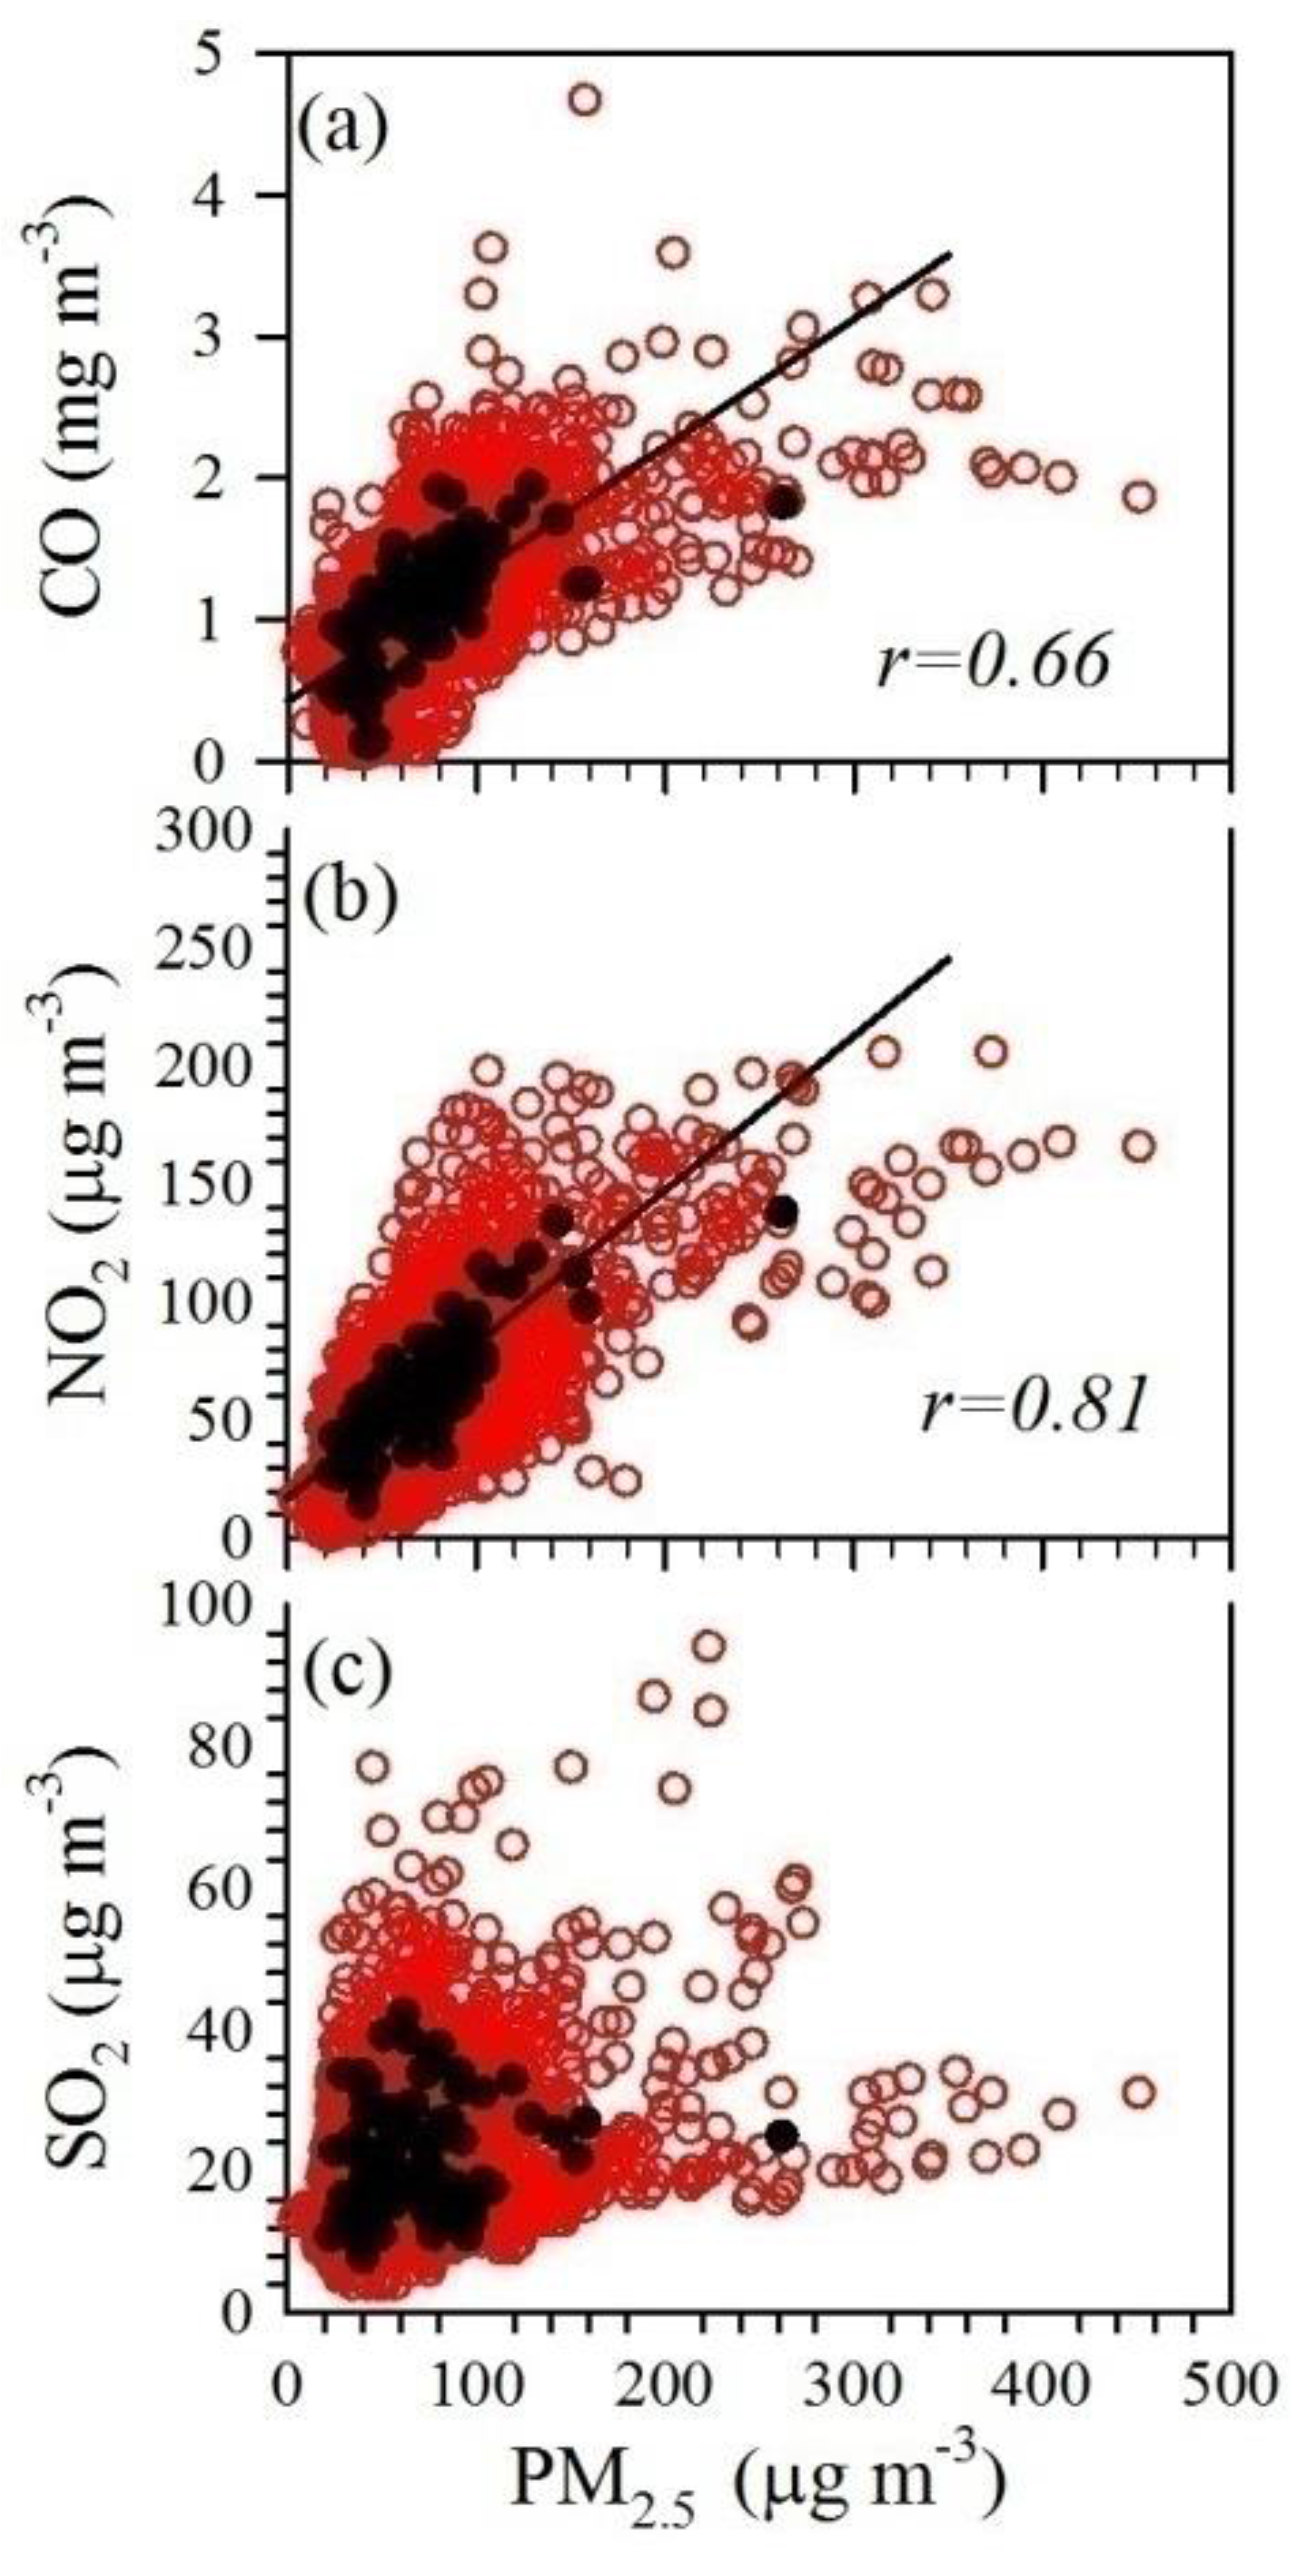
3.2. The Relationships between PM2.5 and Associated Precursor Gases

Figure 5 displays the linear relationships between PM2.5 and gaseous pollutants in Hangzhou. Although CO rarely acts as a precursor of secondary particles, its relationship with PM2.5 was examined to explore the effect of primary emissions on PM2.5 concentration, as CO is primarily emitted from anthropogenic sources including vehicle emission and industry emission [49] and it is relatively stable in the atmosphere. Particularly, the accumulation of local pollution emissions under stagnant conditions could result in the increase of both particulate matters and gaseous pollutants. As shown in Figure 5a, CO was in good correlation with PM2.5 (r = 0.66, p < 0.05), implying that primarily emitted particles were an important contributor to the total PM2.5 in Hangzhou. It should be mentioned that Hangzhou is surrounded by mountains on three sides, with typical characteristics of basin geomorphology. This kind of geomorphology is not favorable for the dilution of local pollution emissions. Therefore, the good correlation between CO and PM2.5 might be attributed to the accumulation of local pollution emission in Hangzhou.
As precursors of sulfate and nitrate, the good correlations between SO2/NO2 and PM2.5 were predictable. As shown in Figure 5b, NO2 was in good correlation with PM2.5 with a higher correlation coefficient (r = 0.81, p < 0.05) than that between CO and PM2.5, however, SO2 was in weak correlation with PM2.5 (Figure 5c, r = 0.02, p < 0.05). Similar results were also found previously in Hangzhou during pollution periods [50]. Our observational site was located at a commercial and residential area in urban Hangzhou, and vehicle emission was the major source of NO2 in the surrounding area. In comparison, SO2 is mostly emitted from coal combustion and the elevated SO2 in Hangzhou was mostly related to regional transport (which will be further discussed in Section 3.3). In this regard, the high correction between NO2 and PM2.5 might suggest a major contribution of local vehicle emission to the PM2.5 in urban Hangzhou.

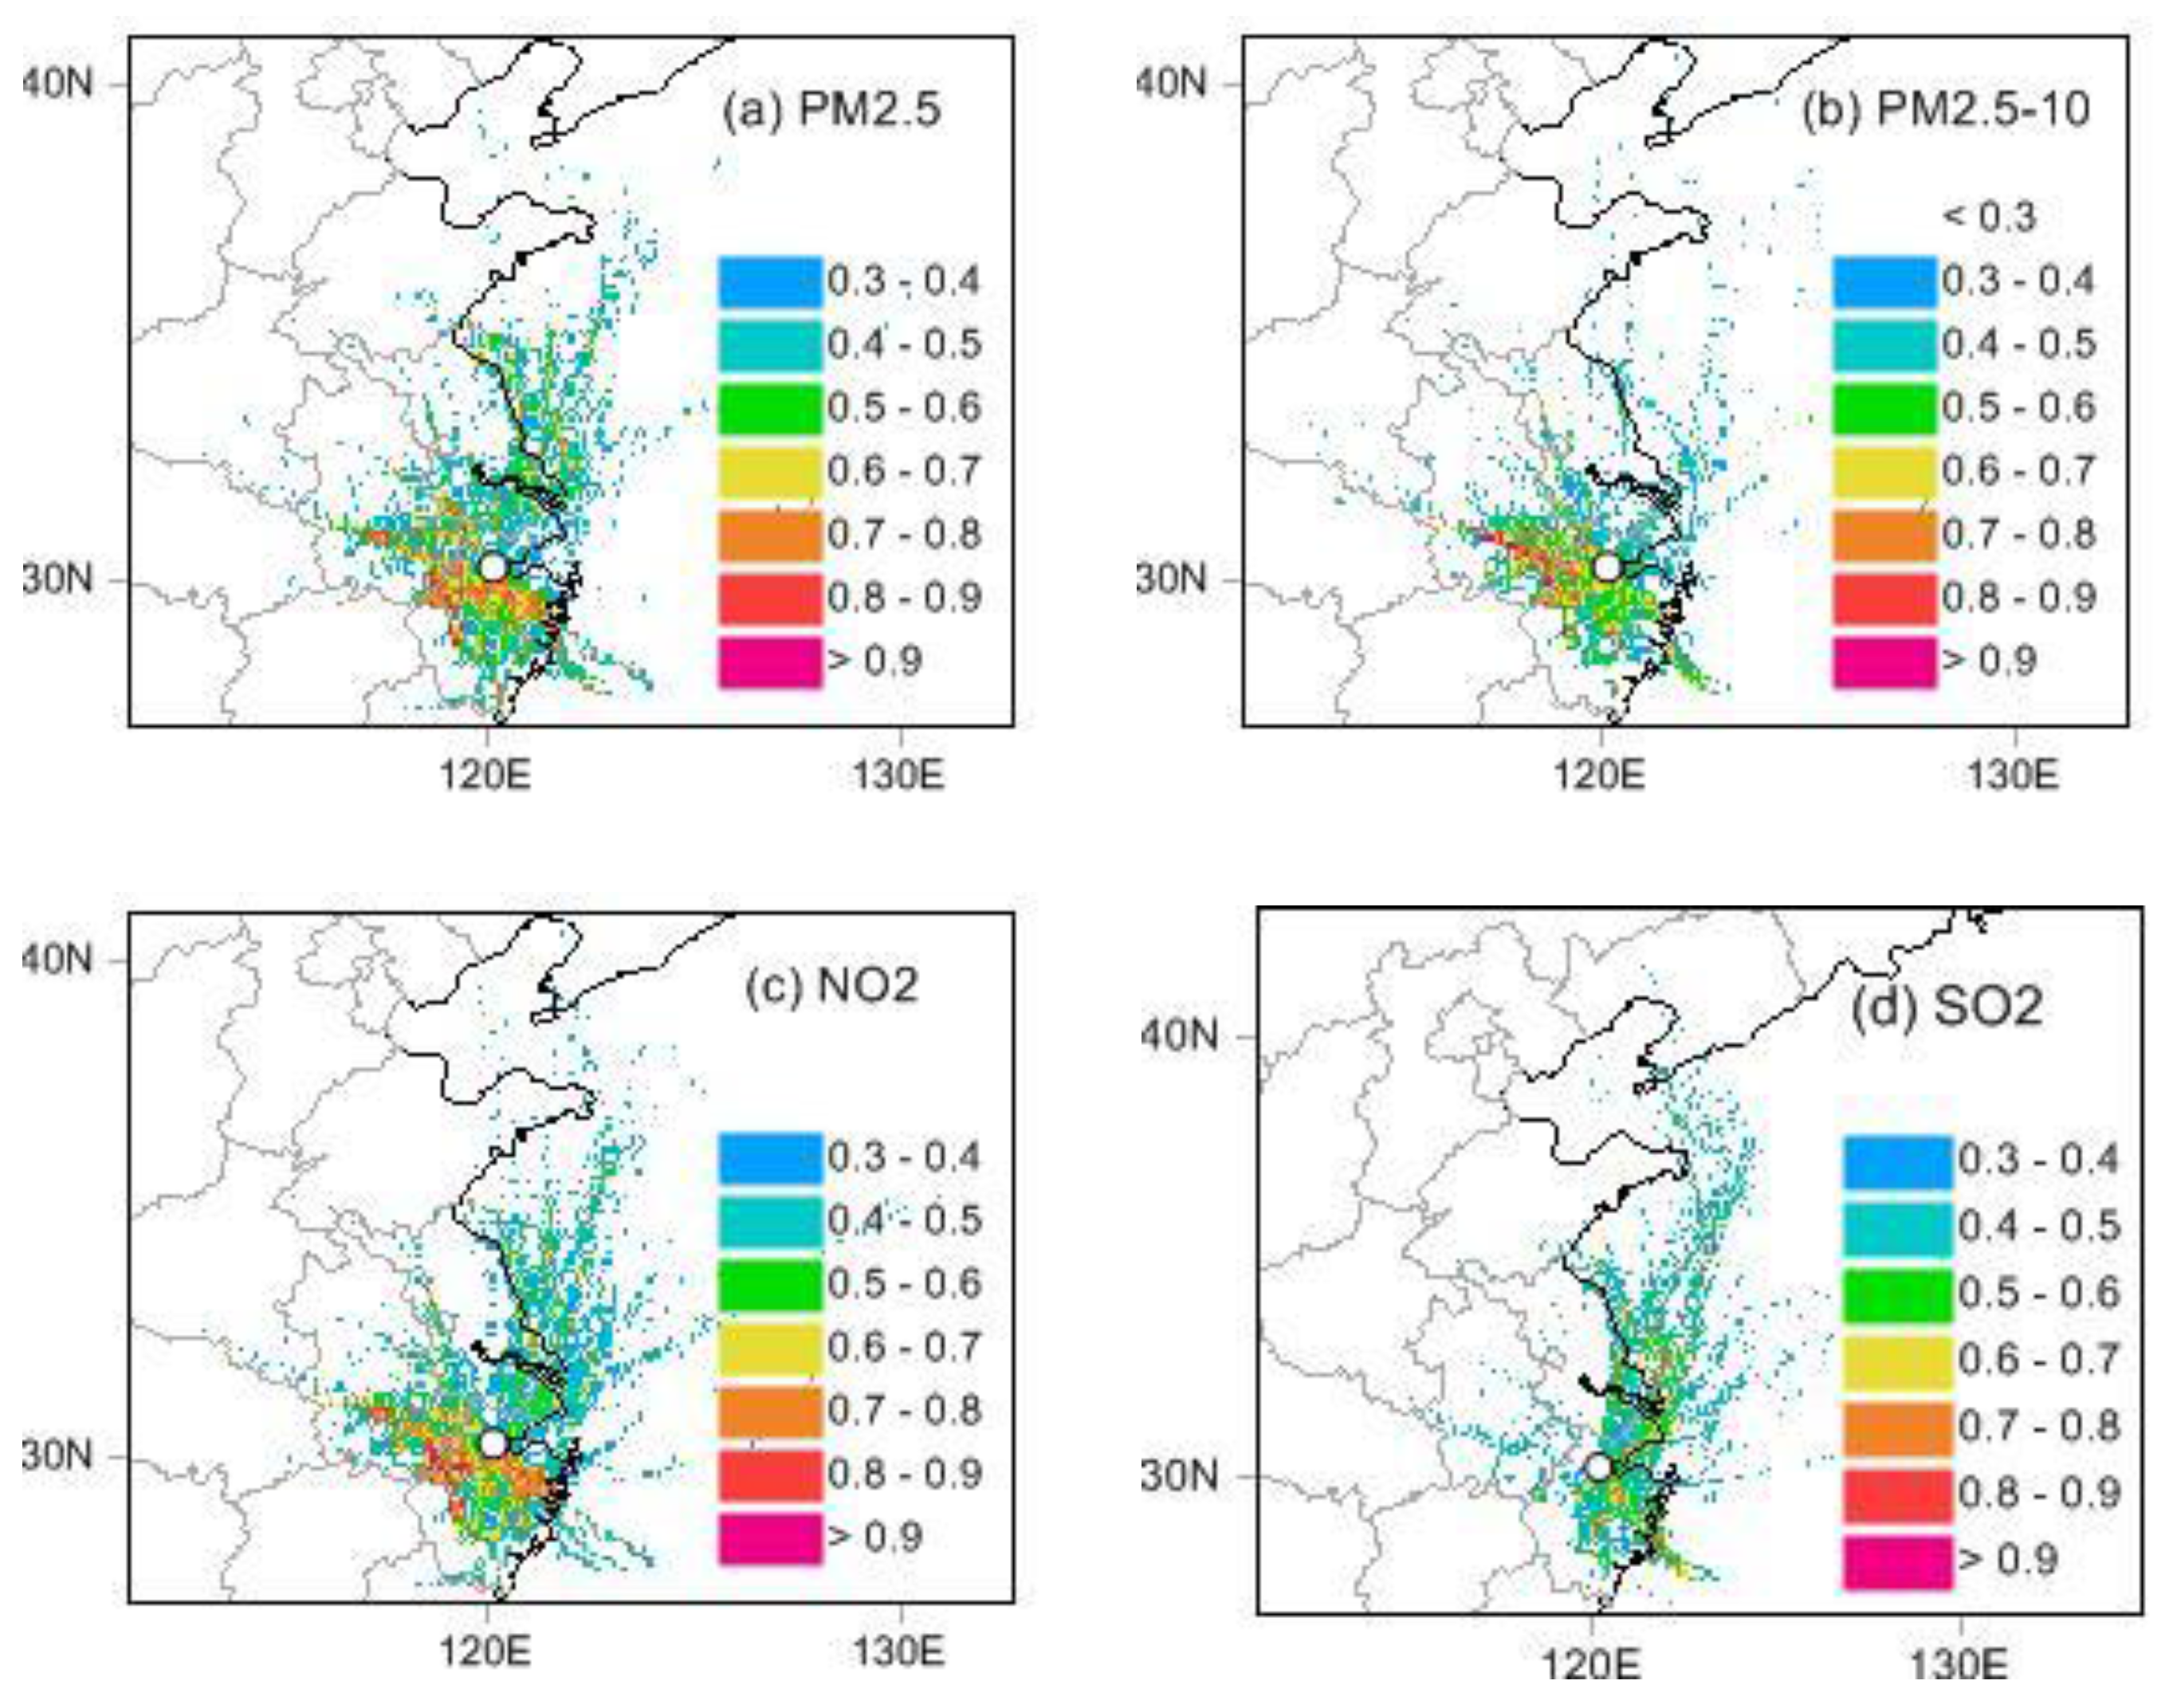
3.3 Potential Source Contributions to PM, SO2, and NO2

To further study the relative contribution of local emission and regional transport to the atmospheric pollutants in Hangzhou, the PSCF values of particles and the associated gaseous pollutants were calculated. As shown in Figure 6a,c, the spatial distributions of the PSCF values of NO2 was similar to that of PM2.5, which was consistent with the high correlation between NO2 and PM2.5. The potential sources contributed to the elevated PM2.5 and NO2 in Hangzhou were mostly from local pollution emissions as well as the pollution emissions from Shaoxing and Ningbo (Figure 1b). Emission inventory indicates that Hangzhou, Shaoxing, and Ningbo have intensive anthropogenic emissions of PM and NO2 [51], hence, could act as potential source contribution regions to the PM2.5 and NO2 in Hangzhou. In addition, the pollution emission in southeastern region of Anhui province can also contributed to the PM2.5 and NO2 in Hangzhou.
The potential source regions of PM2.5–10 were distinguished from that of PM2.5. As shown in Figure 6b, local emission and the pollution emission in southeastern region of Anhui province were the most important sources contributing the elevated PM2.5–10 in Hangzhou. Local contribution of PM2.5–10 was from re-suspend dust under high wind speed condition as discussed in Section 3.1, while the relatively high emission of particulate matters in southeastern region of Anhui province [51] could be transported to Hangzhou under the wind condition from northwestern directions.
As shown in Figure 6d, a major potential source region contributed to the elevated SO2 in Hangzhou was Shaoxing. Online observations have indicated that the ambient SO2 concentration in Shaoxing was much higher than that in the other cities in Zhejiang province [16], suggesting that the pollution emission in Shaoxing could act as a potential source contribution to the SO2 in Hangzhou. Another important source contribution region of the SO2 in Hangzhou was the southeastern coastal region of Shanghai, which is characterized with high SO2 emission [51]. Offshore area of East China Sea on the southeastern Jiangsu Province (Figure 1b) and the estuary of the Yangtze River were also source contribution regions of the SO2 in Hangzhou, which was probably due to ship emissions [52].

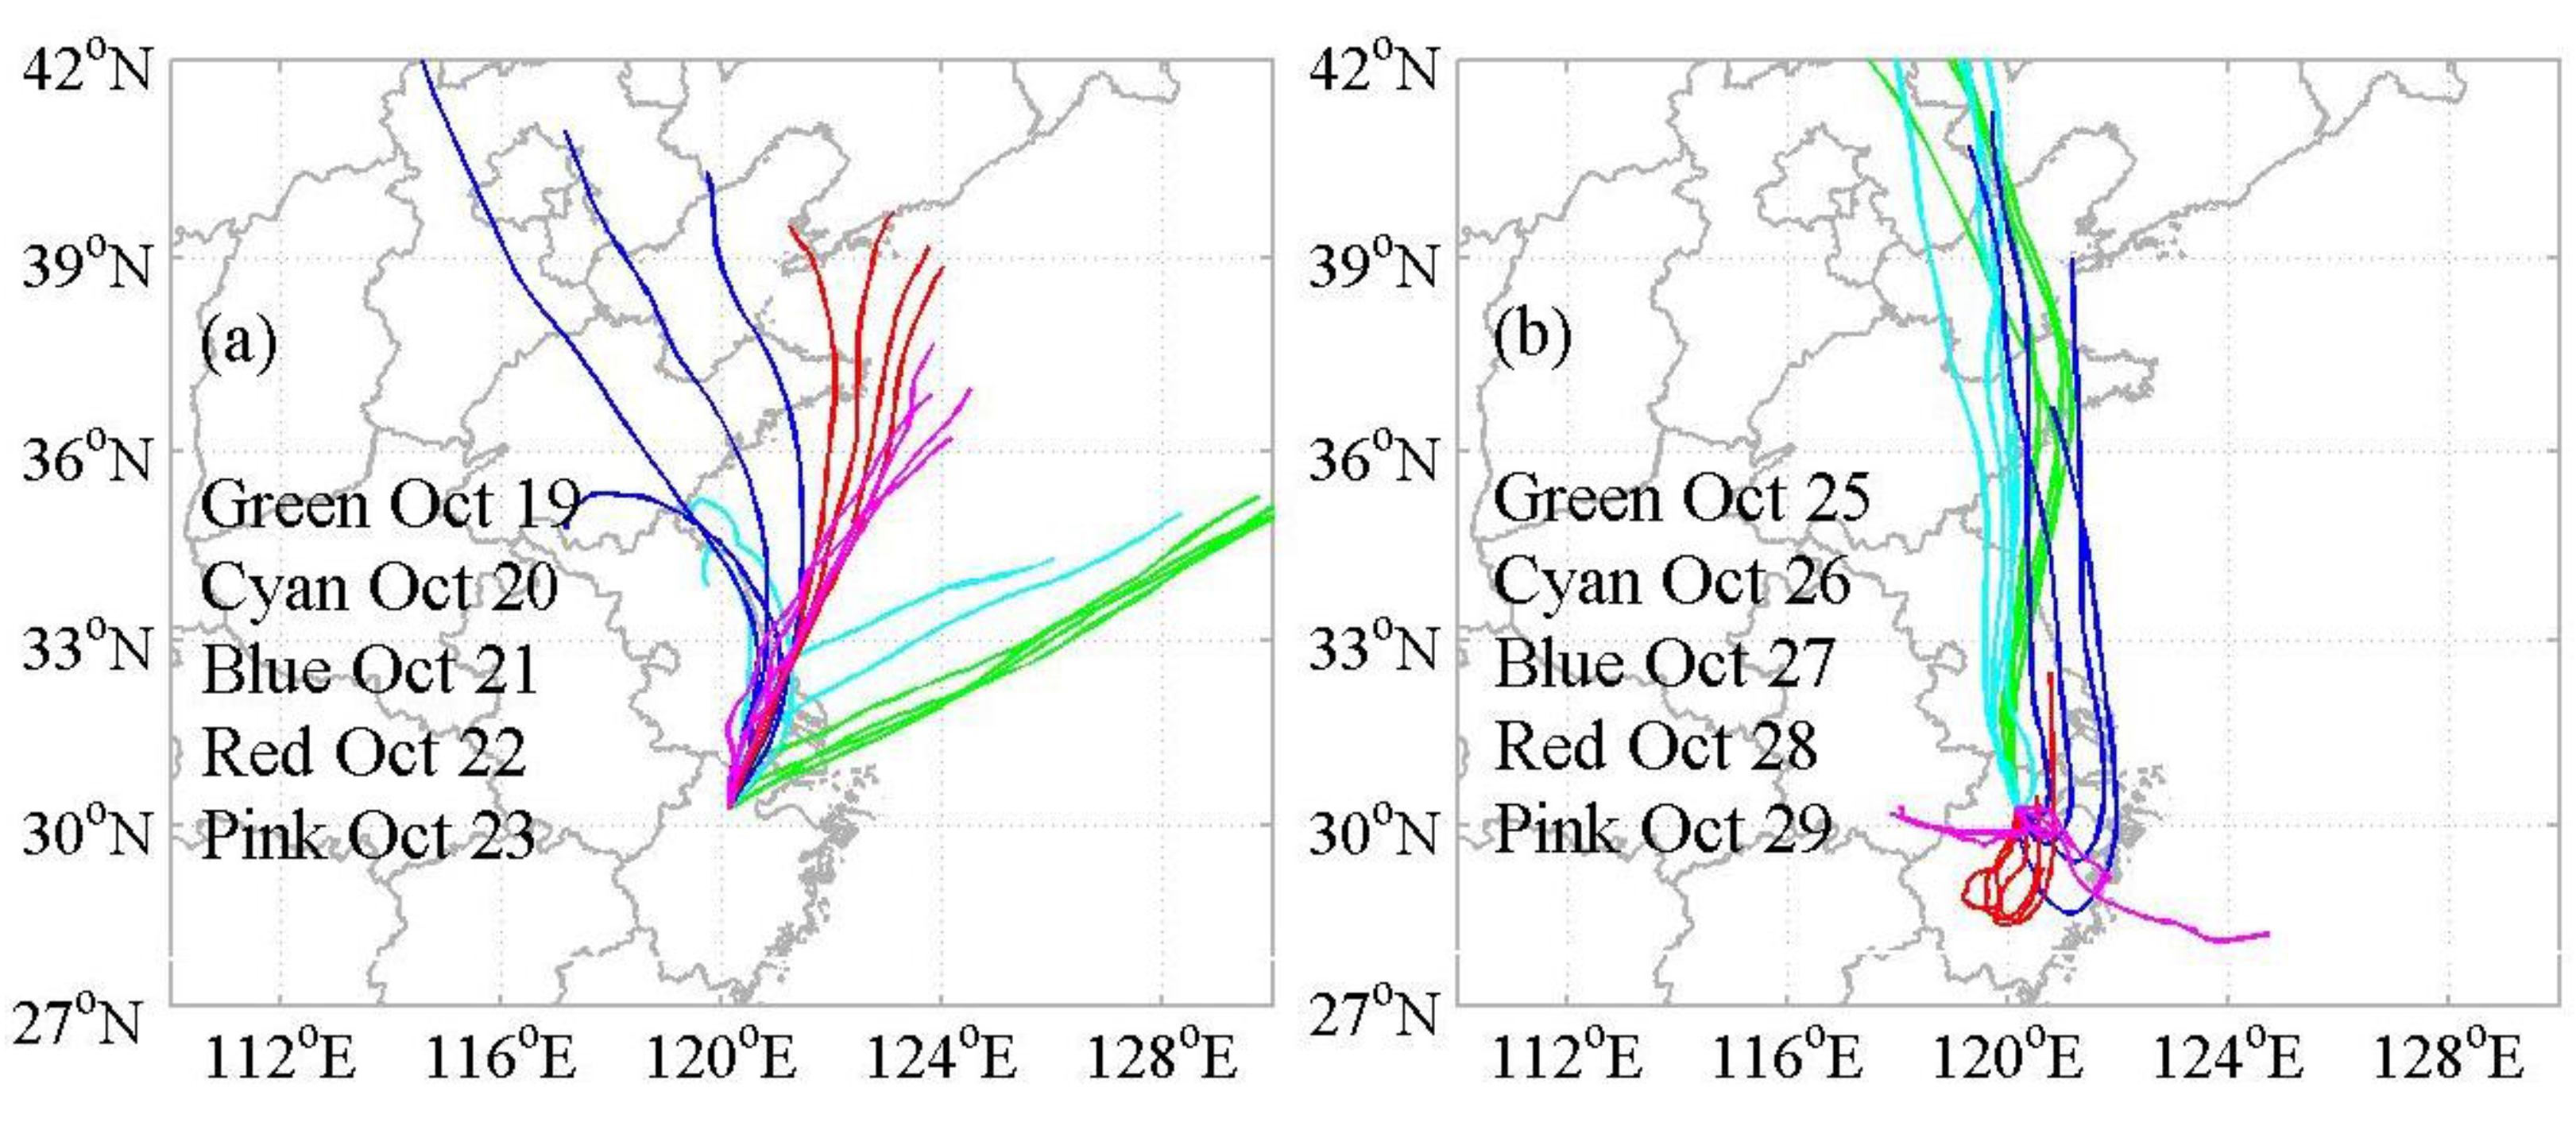
3.4. Characteristics and Sources of PM2.5 in Pollution Episodes

Figure 7c shows the variations of PM2.5, SO2, and NO2 from 10 October to 1 November. There were two pollution episodes (PEs) with daily PM2.5 concentrations higher than the daily concentration limit (75 µg·m−3) in NAAQS. The first one was from 20−23 October (PE1), and the second one was from 26–29 October (PE2). The non-pollution period from 12–16 October (NPE) with daily PM2.5 concentrations lower than 75 µg·m−3 was chosen for comparison. As shown in Figure 7b, high level of RH was observed in both pollution days and non-pollution days, with the average RH of ~63% and ~62% in PEs and NPE, respectively, indicating that the contribution of secondary aerosol to PM2.5 could be significant in Hangzhou in both PEs and NPE. The wind speed decreased from 1.3–2.0 m·s−1 in NPE to 0.8–1.0 m·s−1 and 0.7–1.1 m·s−1 in PE1 and PE2, respectively, implying that accumulation of pollutants could significantly contribute to these two pollution episodes. However, the winds that prevailed in PE1 were mainly from northern directions, while in PE2 they were mainly from eastern to western directions (Figure 7a).

3.4.1. High Concentrations of NO2 and CO in Pollution Episodes: Implication for the Major Contribution from Local Emissions

As shown in Figure 7c, the concentration of NO2 significantly increased in both PE1 and PE2, and the average concentrations were 1.6 and 2.1 times that in NPE (Table 1), respectively. However, the SO2 concentration in PE1 was comparable to that in NPE, while in PE2 it was only 60% of that in NPE (Table 1). Apparently, the NOx emission had a more significant contribution to the pollution episodes than the emission of SO2. On one hand, due to the effective control measures of SO2 emission over China [53], the emission of SO2 started to decrease in China after 2006 [54,55] and low SO2 concentration was observed in the Yangtze River Delta, even in haze periods [10]. On the other hand, local emission is a major source of the elevated NO2 in Hangzhou, while the elevated SO2 in Hangzhou was mainly attributed to regional transport (Section 3.3). The elevated NO2 in PE1 and PE2 were probably due to the accumulation process of local pollution emissions under low wind conditions (Figure 7b), which was further evident that the CO concentrations also increased in both PE1 and PE2, with the average concentrations of 1.6 and 1.4 times that in NPE (Table 1), respectively. Thus, local emission rather than regional transport was suggested to be the major contributor to the formation of these two episodes. As discussed in Section 3.1 and Section 3.2, pollution episodes in Hangzhou are easily triggered by local emission due to its high occurrence of low wind conditions and its characteristics of basin geomorphology.
The SO2 concentration in PE1 was slightly higher than that in PE2, while the NO2 concentration in PE1 was significantly lower than that in PE2 (Table 1). This might be attributed to the relative higher contribution from regional transport in PE1 than in PE2. As shown in Figure 8a, back trajectories of the air masses in PE1 passed over the coastal areas of Jiangsu province and the offshore area of East China Sea, which might bring SO2 and contributed to the particulate sulfate in Hangzhou. However, the increase of SO2 concentration was not as significant as that of NO2 and CO in PE1, suggesting that compared to local emission, the contribution from regional transport to PE1 was much lower. The trajectories in 26, 27 October in PE2 were mostly from the northern directions, passing over Jiangsu, Shanghai, and the offshore area of East China Sea, while in 28, 29 October the trajectories were much shorter and mostly limited in Hangzhou and the neighbored Shaoxing and Jinhua cities (Figure 8b). The trajectories, together with the higher increase of NO2 in PE2, suggest that local pollution emissions might have more contribution to the PE2 formation than to the PE1 formation.

3.4.2. Enhanced Contribution of Secondary Formations to the PM2.5 in Pollution Episodes

The ratios of the average PM2.5 concentrations in PE1 and PE2 to that in NPE (PE1/NPE and PE2/NPE ratios) were 2.5 and 2.7, respectively, higher than the gaseous pollutants, indicating an enhanced contribution of secondary particles to the PM2.5 in both PE1 and PE2. As shown in Figure 7d, secondary inorganic ions SO42− and NO3 increased the most among all the species in both PE1 and PE2, with the average concentrations being ~ 3 times that in NPE (Table 1). SO42− and NO3 together with NH4+ (SNA) accounted for ~40% of the PM2.5 mass in PE2, and up to 50% in PE1. In comparison, the average concentrations of OC and EC in PE1 and PE2 were 1.5–2.0 times that in NPE. Also, the increase of SOC concentration was not as significant as that of PM2.5 concentration, and the PE1/NPE and PE2/NPE ratios for SOC were only ~1.0 and 1.9, respectively. As for crustal matters, the concentration of element Al, which is usually used as a representative species of crustal particles, did not significantly vary from NPE to PE1 and PE2. These results further indicated that the formation of inorganic ions SO42− and NO3 played an important role in the PM2.5 pollution in Hangzhou.
The mass ratios of NO3/EC and SO42−/EC was used to explore the contribution of secondary formation in pollution days, as EC was primarily emitted and the variation of EC concentration could reveal the accumulation effect of primary emissions on the formation of PM2.5 pollution. As shown in Table 1, the NO3/EC ratios were elevated in both PE1 and PE2, revealing that the formation of NO3 were enhanced in these two episodes. Enhanced formation of SO42− was also suggested in PE1, but not in PE2, as elevated SO42−/EC ratio was only found in PE1, which was consistent with that the concentration of SO2 did not increase in PE2. The equivalent ratio of the sum of SO42– and NO3 (µeq·m–3) to NH4+ (µeq·m–3), i.e ([SO42– + NO3]/[NH4+]) increased from 0.9 in NPE to ~1.3 in PE1 and PE2 (Table 1), indicating that NH3 was not enough to completely neutralized all the SO42− and NO3 in PM2.5 during PE1 and PE2 and the acidity of particles might be increased due to the enhanced formation of SO42− and NO3 in the pollution episodes. In comparison, the mass ratios of OC/EC did not significantly vary from NPE to PE1 and PE2, also suggesting that the formation of secondary organic matters was not significantly enhanced in these two pollution episodes.

4. Conclusions

In this study, the potential sources and formations of the PM2.5 pollution in urban Hangzhou were explored based on continuous measurements of meteorological parameters, particulate matters, and gaseous pollutants in autumn, 2013. The average PM2.5 concentration was 69 µg·m–3 during the study time, ~97% higher than the annual concentration limit in NAAQS of China and the average mass ratio of PM2.5/PM10 was 66%, revealing that the PM2.5 pollution was serious in urban Hangzhou. RH and WS were two important factors responsible for the increase of PM2.5 concentration, with the highest PM2.5 concentration observed when RH was in the range of 70%–90% and when the wind speed was in the lowest level. Unfortunately, the occurrence of low WS (<2.0 m·s−1) was up to ~85%, implying local pollution emission could easily trigger pollution episodes in Hangzhou. Also, the occurrence of RH from 60%–90% was highest, suggesting a significant contribution of secondary formation to the PM2.5 in Hangzhou.
PM2.5 was in good correlation with both NO2 and CO in urban Hangzhou, but not with SO2, suggesting that local vehicle emission was a major contribution to PM2.5. The PSCF results displayed that the potential sources contributed to the elevated PM2.5 and NO2 In Hangzhou were mostly from local emissions as well as the pollution emission from Shaoxing and Ningbo. The major potential source regions contributing to the elevated SO2 in Hangzhou were Shaoxing, the southeastern coastal region of Shanghai, and the offshore area of East China Sea.
High concentrations of NO2 and CO were observed in PM2.5 pollution episodes, while the SO2 concentration even decreased, implying local emission rather than region transport was the major source contributing to the formation of pollution episodes. The sum of SO42−, NO3, and NH4+ accounted for ~50% of PM2.5 in mass in pollution episodes and the NO3/EC ratios were significantly elevated, revealing that the formation of secondary inorganic species, particularly NO3, was an important contributor to the PM2.5 pollution in Hangzhou.
This study highlights that controlling local pollution emissions was essential to reduce the PM2.5 pollution in Hangzhou, and the control of vehicle emission in particular should be further promoted in the future.

Acknowledgments

This work was supported by National Natural Science Foundation of China (Grant Nos. 41405115), the Special program for social development of key science and technology project of Zhejiang province (2014C03025), the Science and technology development project of Hangzhou (20131813A03 and 20130533B04), and the Environmental charity project of Ministry of Environmental Protection of China (201409008).

Author Contributions

Jian Wu analyzed the data and wrote the article. Chang Xu performed the experiments and helped with the data analysis. Wen Cheng and Qiongzhen Wang designed the study and edited the text body.

Conflicts of Interest

The authors declare no conflict of interest.

References

  1. Zhang, Z.L.; Wang, J.; Chen, L.H.; Chen, X.Y.; Sun, G.Y.; Zhong, N.S.; Kan, H.D.; Lu, W.J. Impact of haze and air pollution-related hazards on hospital admissions in Guangzhou, China. Environ. Sci. Pollut. Res. 2014, 21, 4236–4244. [Google Scholar] [CrossRef] [PubMed]
  2. Menon, S.; Hansen, J.; Nazarenko, L.; Luo, Y.F. Climate effects of black carbon aerosols in China and India. Science 2002, 297, 2250–2253. [Google Scholar] [CrossRef] [PubMed]
  3. Ramanathan, V.; Carmichael, G. Global and regional climate changes due to black carbon. Nat. Geosci. 2008, 1, 221–227. [Google Scholar] [CrossRef]
  4. Sun, Y.L.; Wang, Z.F.; Fu, P.Q.; Yang, T.; Jiang, Q.; Dong, H.B.; Li, J.; Jia, J.J. Aerosol composition, sources and processes during wintertime in Beijing, China. Atmos. Chem. Phys. 2013, 13, 4577–4592. [Google Scholar] [CrossRef]
  5. Zhao, P.S.; Dong, F.; He, D.; Zhao, X.J.; Zhang, X.L.; Zhang, W.Z.; Yao, Q.; Liu, H.Y. Characteristics of concentrations and chemical compositions for PM2.5 in the region of Beijing, Tianjin, and Hebei, China. Atmos. Chem. Phys. 2013, 13, 4631–4644. [Google Scholar] [CrossRef]
  6. Lang, J.L.; Cheng, S.Y.; Wei, W.; Zhou, Y.; Wei, X.; Chen, D.S. A study on the trends of vehicular emissions in the Beijing-Tianjin-Hebei (BTH) region, China. Atmos. Environ. 2012, 62, 605–614. [Google Scholar] [CrossRef]
  7. Wang, Q.; Zhuang, G.; Huang, K.; Liu, T.; Deng, C.; Xu, J.; Lin, Y.; Guo, Z.; Chen, Y.; Fu, Q.; et al. Probing the severe haze pollution in three typical regions of China: Characteristics, sources and regional impacts. Atmos. Environ. 2015, 120, 76–88. [Google Scholar] [CrossRef]
  8. Wang, J.; Ho, S.S.H.; Ma, S.; Cao, J.; Dai, W.; Liu, S.; Shen, Z.; Huang, R.; Wang, G.; Han, Y. Characterization of PM2.5 in Guangzhou, China: Uses of organic markers for supporting source apportionment. Sci. Total. Environ. 2016, 550, 961–971. [Google Scholar] [CrossRef] [PubMed]
  9. Wang, F.; Lin, T.; Feng, J.; Fu, H.; Guo, Z. Source apportionment of polycyclic aromatic hydrocarbons in PM2.5 using positive matrix factorization modeling in Shanghai, China. Environ. Sci. Process. Impact 2015, 17, 197–205. [Google Scholar] [CrossRef] [PubMed]
  10. Huang, K.; Zhuang, G.; Lin, Y.; Fu, J.S.; Wang, Q.; Liu, T.; Zhang, R.; Jiang, Y.; Deng, C.; Fu, Q.; et al. Typical types and formation mechanisms of haze in an eastern Asia megacity, Shanghai. Atmos. Chem. Phys. 2012, 12, 105–124. [Google Scholar] [CrossRef]
  11. Cheng, Z.; Wang, S.; Fu, X.; Watson, J.G.; Jiang, J.; Fu, Q.; Chen, C.; Xu, B.; Yu, J.; Chow, J.C.; et al. Impact of biomass burning on haze pollution in the Yangtze River Delta, China: A case study in summer 2011. Atmos. Chem. Phys. 2014, 14, 4573–4585. [Google Scholar] [CrossRef] [Green Version]
  12. Zhang, R.H.; Li, Q.; Zhang, R.N. Meteorological conditions for the persistent severe fog and haze event over eastern China in January 2013. Sci. China Earth Sci. 2014, 57, 26–35. [Google Scholar]
  13. Zhao, X.J.; Zhao, P.S.; Xu, J.; Meng, W.; Pu, W.W.; Dong, F.; He, D.; Shi, Q.F. Analysis of a winter regional haze event and its formation mechanism in the North China Plain. Atmos. Chem. Phys. 2013, 13, 5685–5696. [Google Scholar] [CrossRef]
  14. Sun, Y.L.; Jiang, Q.; Wang, Z.F.; Fu, P.Q.; Li, J.; Yang, T.; Yin, Y. Investigation of the sources and evolution processes of severe haze pollution in Beijing in January 2013. J Geophys. Res.-Atmos. 2014, 119, 4380–4398. [Google Scholar] [CrossRef]
  15. Sun, Y.L.; Wang, Z.F.; Fu, P.Q.; Jiang, Q.; Yang, T.; Li, J.; Ge, X.L. The impact of relative humidity on aerosol composition and evolution processes during wintertime in Beijing, China. Atmos. Environ. 2013, 77, 927–934. [Google Scholar] [CrossRef]
  16. Chinese Environmental Monitering Center, Monthly Report of Air Quality for 74 Major Cities in China from January, 2013–December, 2015. Available online: http://www.cnemc.cn/publish/106/0536/newList_1.html (aceessed on 28 July 2017).
  17. Cao, J.; Shen, Z.; Chow, J.C.; Qi, G.; Watson, J.G. Seasonal variations and sources of mass and chemical composition for PM10 aerosol in Hangzhou, China. Particuology 2009, 7, 161–168. [Google Scholar] [CrossRef]
  18. Liu, G.; Li, J.; Wu, D.; Xu, H. Chemical composition and source apportionment of the ambient PM2.5 in Hangzhou, China. Particuology 2015, 18, 135–143. [Google Scholar] [CrossRef]
  19. Jansen, R.C.; Shi, Y.; Chen, J.M.; Hu, Y.J.; Xu, C.; Hong, S.M.; Jiao, L.; Zhang, M. Using hourly measurements to explore the role of secondary inorganic aerosol in PM2.5 during haze and fog in Hangzhou, China. Adv. Atmos. Sci. 2014, 31, 1427–1434. [Google Scholar] [CrossRef]
  20. Hangzhou Municipal Bureau of Statistics. Hangzhou Statistical Yearbook; China Statistics Press: Beijing, China, 2006–2014. [Google Scholar]
  21. Wang, G.H.; Huang, L.M.; Gao, S.X.; Gao, S.T.; Wang, L.S. Characterization of water-soluble species of PM10 and PM2.5 aerosols in urban area in Nanjing, China. Atmos. Environ. 2002, 36, 1299–1307. [Google Scholar] [CrossRef]
  22. Wang, G.; Li, J.; Cheng, C.; Hu, S.; Xie, M.; Gao, S.; Zhou, B.; Dai, W.; Cao, J.; An, Z. Observation of atmospheric aerosols at Mt. Hua and Mt. Tai in central and east China during spring 2009-part 1: EC, OC and inorganic ions. Atmos. Chem. Phys. 2011, 11, 4221–4235. [Google Scholar] [CrossRef] [Green Version]
  23. Zhang, R.; Cao, J.; Tang, Y.; Arimoto, R.; Shen, Z.; Wu, F.; Han, Y.; Wang, G.; Zhang, J.; Li, G. Elemental profiles and signatures of fugitive dusts from Chinese deserts. Sci. Total. Environ. 2014, 472, 1121–1129. [Google Scholar] [CrossRef] [PubMed]
  24. Air Resources Laboratory. Available online: http://ready.arl.noaa.gov/hypub-bin/trajtype.pl?runtype=archive (accessed on 28 July 2016).
  25. Chang, Y.H.; Zou, Z.; Deng, C.R.; Huang, K.; Collett, J.L.; Lin, J.; Zhuang, G.S. The importance of vehicle emissions as a source of atmospheric ammonia in the megacity of Shanghai. Atmos. Chem. Phys. 2015, 15, 34719–34763. [Google Scholar] [CrossRef]
  26. Tang, G.; Zhang, J.; Zhu, X.; Song, T.; Münkel, C.; Hu, B.; Schäfer, K.; Liu, Z.; Zhang, J.; Wang, L.; et al. Mixing layer height and its implications for air pollution over Beijing, China. Atmos. Chem. Phys. 2016, 16, 2459–2475. [Google Scholar] [CrossRef]
  27. Huang, K.; Zhuang, G.; Lin, Y.; Wang, Q.; Fu, J.S.; Zhang, R.; Li, J.; Deng, C.; Fu, Q. Impact of anthropogenic emission on air quality over a megacity-revealed from an intensive atmospheric campaign during the Chinese spring festival. Atmos. Chem. Phys. 2012, 12, 11631–11645. [Google Scholar] [CrossRef]
  28. Zhao, M.; Huang, Z.; Qiao, T.; Zhang, Y.; Xiu, G.; Yu, J. Chemical characterization, the transport pathways and potential sources of PM2.5 in Shanghai: Seasonal variations. Atmos. Res. 2015, 158, 66–78. [Google Scholar] [CrossRef]
  29. Wang, H.; Zhu, B.; Shen, L.; Xu, H.; An, J.; Xue, G.; Cao, J. Water-soluble ions in atmospheric aerosols measured in five sites in the Yangtze River Delta, China: Size-fractionated, seasonal variations and sources. Atmos. Environ. 2015, 123, 370–379. [Google Scholar] [CrossRef]
  30. Li, H.; Duan, F.; He, K.; Ma, Y.; Kimoto, T.; Huang, T. Size-dependent characterization of atmospheric particles during winter in Beijing. Atmosphere 2016, 7. [Google Scholar] [CrossRef]
  31. Polissar, A.V.; Hopke, P.K.; Poirot, R.L. Atmospheric aerosol over vermont:  Chemical composition and sources. Environ. Sci. Technol. 2001, 35, 4604–4621. [Google Scholar] [CrossRef] [PubMed]
  32. Wang, F.; Chen, Y.; Meng, X.; Fu, J.; Wang, B. The contribution of anthropogenic sources to the aerosols over east china sea. Atmos. Environ. 2016, 127, 22–33. [Google Scholar] [CrossRef]
  33. Castro, L.M.; Pio, C.A.; Harrison, R.M.; Smith, D.J.T. Carbonaceous aerosol in urban and rural european atmospheres: Estimation of secondary organic carbon concentrations. Atmos. Environ. 1999, 33, 2771–2781. [Google Scholar] [CrossRef]
  34. Turpin, B.J.; Huntzicker, J.J. Identification of secondary organic aerosol episodes and quantitation of primary and secondary organic aerosol concentrations during SCAQS. Atmos. Environ. 1995, 29, 3527–3544. [Google Scholar] [CrossRef]
  35. Wang, F.; Guo, Z.; Lin, T.; Hu, L.; Chen, Y.; Zhu, Y. Characterization of carbonaceous aerosols over the East China Sea: The impact of the east asian continental outflow. Atmos. Environ. 2015, 110, 163–173. [Google Scholar] [CrossRef]
  36. Li, B.; Zhang, J.; Zhao, Y.; Yuan, S.; Zhao, Q.; Shen, G.; Wu, H. Seasonal variation of urban carbonaceous aerosols in a typical city Nanjing in Yangtze River Delta, China. Atmos. Environ. 2015, 106, 223–231. [Google Scholar] [CrossRef]
  37. Peng, Z.-R.; Wang, D.; Wang, Z.; Gao, Y.; Lu, S. A study of vertical distribution patterns of PM2.5 concentrations based on ambient monitoring with unmanned aerial vehicles: A case in Hangzhou, China. Atmos. Environ. 2015, 123, 357–369. [Google Scholar] [CrossRef]
  38. Liu, X.G.; Li, J.; Qu, Y.; Han, T.; Hou, L.; Gu, J.; Chen, C.; Yang, Y.; Liu, X.; Yang, T.; et al. Formation and evolution mechanism of regional haze: A case study in the megacity Beijing, China. Atmos. Chem. Phys. 2013, 13, 4501–4514. [Google Scholar] [CrossRef]
  39. Wang, M.; Cao, C.; Li, G.; Singh, R.P. Analysis of a severe prolonged regional haze episode in the Yangtze River Delta, China. Atmos. Environ. 2015, 102, 112–121. [Google Scholar] [CrossRef]
  40. Wang, Q.; Zhuang, G.; Huang, K.; Liu, T.; Lin, Y.; Deng, C.; Fu, Q.; Fu, J.S.; Chen, J.; Zhang, W.; et al. Evolution of particulate sulfate and nitrate along the Asian dust pathway: Secondary transformation and primary pollutants via long-range transport. Atmos. Res. 2016, 169, 86–95. [Google Scholar] [CrossRef]
  41. Huang, X.; Liu, Z.; Zhang, J.; Wen, T.; Ji, D.; Wang, Y. Seasonal variation and secondary formation of size-segregated aerosol water-soluble inorganic ions during pollution episodes in Beijing. Atmos. Res. 2016, 168, 70–79. [Google Scholar] [CrossRef]
  42. Ji, D.; Zhang, J.; He, J.; Wang, X.; Pang, B.; Liu, Z.; Wang, L.; Wang, Y. Characteristics of atmospheric organic and elemental carbon aerosols in urban Beijing, China. Atmos. Environ. 2016, 125, 293–306. [Google Scholar] [CrossRef]
  43. Shen, R.; Schäfer, K.; Schnelle-Kreis, J.; Shao, L.; Norra, S.; Kramar, U.; Michalke, B.; Abbaszade, G.; Streibel, T.; Fricker, M.; et al. Characteristics and sources of PM in seasonal perspective—A case study from one year continuously sampling in Beijing. Atmos. Pollut. Res. 2016, 7, 235–248. [Google Scholar] [CrossRef]
  44. Zhang, H.; Wang, Y.; Hu, J.; Ying, Q.; Hu, X.-M. Relationships between meteorological parameters and criteria air pollutants in three megacities in China. Environ. Res. 2015, 140, 242–254. [Google Scholar] [CrossRef] [PubMed]
  45. Zhang, Q.; Quan, J.; Tie, X.; Li, X.; Liu, Q.; Gao, Y.; Zhao, D. Effects of meteorology and secondary particle formation on visibility during heavy haze events in Beijing, China. Sci. Total. Environ. 2014, 502C, 578–584. [Google Scholar] [CrossRef] [PubMed]
  46. Zhu, T.; Shang, J.; Zhao, D.F. The roles of heterogeneous chemical processes in the formation of an air pollution complex and gray haze. Sci. China Chem. 2011, 54, 145–153. [Google Scholar] [CrossRef]
  47. Quan, J.; Liu, Q.; Li, X.; Gao, Y.; Jia, X.; Sheng, J.; Liu, Y. Effect of heterogeneous aqueous reactions on the secondary formation of inorganic aerosols during haze events. Atmos. Environ. 2015, 122, 306–312. [Google Scholar] [CrossRef]
  48. Hua, Y.; Cheng, Z.; Wang, S.; Jiang, J.; Chen, D.; Cai, S.; Fu, X.; Fu, Q.; Chen, C.; Xu, B.; et al. Characteristics and source apportionment of PM2.5 during a fall heavy haze episode in the Yangtze River Delta of China. Atmos. Environ. 2015, 123, 380–391. [Google Scholar] [CrossRef]
  49. Huang, C.; Chen, C.H.; Li, L.; Cheng, Z.; Wang, H.L.; Huang, H.Y.; Streets, D.G.; Wang, Y.J.; Zhang, G.F.; Chen, Y.R. Emission inventory of anthropogenic air pollutants and VOC species in the Yangtze River Delta region, China. Atmos. Chem. Phys. 2011, 11, 4105–4120. [Google Scholar] [CrossRef]
  50. Xiao, Z.M.; Zhang, Y.F.; Hong, S.M.; Bi, X.H.; Jiao, L.; Feng, Y.C.; Wang, Y.Q. Estimation of the main factors influencing haze, based on a long-term monitoring campaign in Hangzhou, China. Aerosol. Air. Qual. Res. 2011, 11, 873–882. [Google Scholar] [CrossRef]
  51. Fu, X.; Wang, S.X.; Zhao, B.; Xing, J.; Cheng, Z.; Liu, H.; Hao, J.M. Emission inventory of primary pollutants and chemical speciation in 2010 for the Yangtze River Delta Region, China. Atmos. Environ. 2013, 70, 39–50. [Google Scholar] [CrossRef]
  52. Fan, Q.; Zhang, Y.; Ma, W.; Ma, H.; Feng, J.; Yu, Q.; Yang, X.; Ng, S.K.W.; Fu, Q.; Chen, L. Spatial and seasonal dynamics of ship emissions over the Yangtze River Delta and East China Sea and their potential environmental influence. Environ. Sci. Technol. 2016, 50, 1322–1329. [Google Scholar] [CrossRef] [PubMed]
  53. Fang, M.; Chan, C.K.; Yao, X. Managing air quality in a rapidly developing nation: China. Atmos. Environ. 2009, 43, 79–86. [Google Scholar] [CrossRef]
  54. Lu, Z.; Streets, D.G.; Zhang, Q.; Wang, S.; Carmichael, G.R.; Cheng, Y.F.; Wei, C.; Chin, M.; Diehl, T.; Tan, Q. Sulfur dioxide emissions in China and sulfur trends in east Asia since 2000. Atmos. Chem. Phys. 2010, 10, 6311–6331. [Google Scholar] [CrossRef]
  55. Li, C.; Zhang, Q.; Krotkov, N.A.; Streets, D.G.; He, K.; Tsay, S.C.; Gleason, J.F. Recent large reduction in sulfur dioxide emissions from chinese power plants observed by the ozone monitoring instrument. Geophys. Res. Lett. 2010, 37, 292–305. [Google Scholar] [CrossRef]
Figure 1. Location of the sampling site (Zhaohui, ZH) in Hangzhou, Zhejiang province (ZJ), China (a) and map of Zhejiang province (b). Locations of Beijing (BJ), Shangdong province (SD), Jiangsu province (JS), Anhui province (AH), and Shanghai (SH) are also displayed.
Atmosphere 07 00100 g001
Figure 2. Box-circles plots of the PM2.5 and PM10 concentration and the mass ratio of PM2.5/PM10. The box boundaries represent the 25th and 75th percentile, and the black and red horizontal lines are the median and the average, respectively.
Atmosphere 07 00100 g002
Figure 3. The occurrence frequencies of different ranges of relative humidity (a), wind speed (b), and wind direction (c). Box plots of the PM2.5 concentrations at different ranges of relative humidity (d), wind speed (e), and wind direction (f), and the PM2.5–10 concentrations different ranges of relative humidity (g), wind speed (h), and wind direction (i). The box boundaries represent the 25th and 75th percentile, the black and red horizontal lines are the median and the average, respectively.
Atmosphere 07 00100 g003
Figure 4. The average concentrations of PM2.5 (a) and PM2.5–10 (b) at different ranges of relative humidity and wind speed.
Atmosphere 07 00100 g004
Figure 5. Linear relationships between the concentrations of PM2.5 and CO (a), NO2 (b), and SO2 (c). The red circles and black dots are the hourly and daily concentrations, respectively and the correlation coefficients are calculated from daily concentrations.
Atmosphere 07 00100 g005
Figure 6. Potential source contribution function (PSCF) of PM2.5 (a), PM2.5–10 (b), NO2 (c), and SO2 (d) in Hangzhou. The sampling site is marked in circle and the PSCF values are displayed in color.
Atmosphere 07 00100 g006
Figure 7. Time series of hourly values of wind direction (WD) (a), relative humidity (RH) and wind speed (WS) (b), daily concentrations of PM2.5, SO2, and NO2 (c), and concentrations of the water soluble species in PM2.5 (d).
Atmosphere 07 00100 g007
Figure 8. Forty-eight-hour back trajectories of the air masses at 500 m above ground level over Hangzhou in PE1 (a) and PE2 (b).
Atmosphere 07 00100 g008
Table 1. Average concentrations of particulate matters, gaseous pollutants, and the major species in PM2.5 and average mass ratios of chemical species in the non-pollution period from 12–16 October (NPE) and the two pollution episodes from 20−23 October (PE1) and from 26–29 October (PE2).
NPEPE1PE2
SO2 (µg·m−3)26.3 27.8 16.3
NO2 (µg·m–3)47.3 75.0 97.7
CO (mg·m–3)0.9 1.5 1.3
PM10 (µg·m–3)71.0 106.6 153.7
PM2.5 (µg·m–3)35.7 88.0 97.3
OC (µg·m–3)10.8 16.4 22.7
EC (µg·m–3)3.0 5.4 6.6
SOC (µg·m–3)3.73.77.1
Cl (µg·m–3)2.6 4.3 6.2
NO3 (µg·m–3)5.3 17.1 15.8
SO42+ (µg·m–3)9.7 28.3 19.0
Na+ (µg·m–3)1.9 1.7 2.4
NH4+ (µg·m–3)6.0 12.0 8.3
K+ (µg·m–3)0.5 1.4 1.2
Mg2+ (µg·m–3)0.2 0.2 0.2
Ca2+ (µg·m–3)0.8 2.0 1.6
Al (µg·m–3)0.40.30.4
OC/EC3.6 3.1 3.5
NO3/EC1.8 3.2 2.4
SO42+/EC3.3 5.4 3.0
[SO42– + NO3]/[NH4+]0.9 1.3 1.4

