1. Introduction
For decades, it has been acknowledged [
1,
2,
3], and is now generally accepted [
4,
5], that weather and climate affect behaviour and satisfaction associated with outdoor recreation and tourism. Nonetheless, the relationship between weather with recreation and tourism is poorly understood and under-researched [
6,
7,
8]. More specifically, very little is known about the specific weather sensitivity of particular tourism attractions within urban areas [
9,
10,
11,
12].
Zoological parks serve as excellent case studies in the field of tourism climatology because zoos can provide accurate records of visitor attendance data over time since they must account for all visitors on their property for financial and liability reasons [
13]. Recently, there has been a number of studies aimed at assessing the weather sensitivity of zoo visitation [
9,
11,
12,
13]. However, no study to date has looked at the effect of seasonal climatic anomalies on zoo visitation, nor tried to understand the implications of climate change for zoo visitation using a temporal climate analogue approach.
Dwyer [
14] suggested that if daily temperatures exceed seasonal averages during cold weather months, recreation participation is likely to increase, whereas during warm weather months, if daily temperatures exceed the seasonal average, participation may decline. In theory, warm, dry days should encourage visits; whereas, hotter weather may drive potential visitors to alternative attractions, such as indoor venues or participation in water-related activities [
15]. This study aims to test these previous conclusions regarding demand responses to seasonal climatic anomalies for outdoor recreation and tourism (ORT), this time in the context of an urban zoological park.
Being pioneered by Glantz [
16,
17,
18], analogues can be spatial in nature, where insights are drawn from a comparable region or location to the case study; or temporal, where analysis of past conditions is used to develop an understanding. Both spatial and temporal analogues aim to help assess impacts while identifying and characterizing determinants, using what is known about the present to make inferences about the future [
19]. The use of analogue methodologies overtime has significantly increased current understanding of how climate affects society, including impacts, vulnerability, and adaptive capacity [
19]. Historical analysis through the use of temporal analogues allows for the characterization of how human systems manage and experience climatic risks [
20]. According to Ford
et al. [
21], the temporal analogue approach is based on the premise that human systems in the near future will probably conduct activities as they have done in the recent past and be influenced by similar conditions and processes, providing empirical grounding to the analysis of sensitivity, vulnerability, and adaptation in climate change impact assessment.
The analogue approach has been severely under-utilized in climate change and tourism studies [
22,
23,
24,
25], although it has the potential to offer new insights into future impacts and the effectiveness of adaptations [
23]. Analogues are a useful tool for identifying the possible future impacts of global climate change, as impacts are assessed during real events and include adaptation strategies and business decisions made during an anomalous “short term” event, which may become the norm in the future [
24]. A key advantage of the climate change analogue approach is that it captures the full range of supply-side and demand-side adaptations by tourism operators, destination marketers, and tourists themselves [
26]. This study aims to use a temporal analogue approach to determine if any further insights into the implications of climate change for zoo visitation can be gained, with particular relevancy to the recent modeling approach for assessing the impact of climate change on zoo visitation [
27]. Analogues have been promoted as a simple and effective validation tool for more sophisticated modeling approaches [
26], such as the recent works by Hewer and Gough [
12,
26]. The analogue approach is also less subject to the high levels of uncertainty associated with complex long range models. Furthermore, analogues provide insights into fully contextualized actual adaptation, while regression analysis can only offer highly abstracted projections of potential adaptation (personal communication on 13 May 2016: Professor Daniel Scott, University of Waterloo).
In the context of ski tourism [
24,
25], the temporal climate analogue approach has revealed more conservative assessments of the impact of projected climate change on ski season length and lift ticket sales, when compared to the physical modelling approach [
28,
29]. Furthermore, Scott [
23] found that the decline in skier demand using a climate analogue approach was far less than survey studies of hypothetical behaviour change had projected [
30,
31]. When reviewing tourism demand response studies in the field of tourism climatology, Gössling
et al. [
32] concluded that econometric modelling studies have a wide range of uncertainties with regard to behavioural response, but climate analogues may provide more robust insights. Scott
et al. [
28] suggested that tourists have the greatest capacity to adapt to the risks and opportunities posed by climate change, a factor responsible for much of the uncertainty in the modelling approach. However, Scott
et al. [
26] contend that there remains much scope to better understand the adaptive capacity of tourists and tourism operators alike, by assessing climate analogue events.
Aylen
et al. [
9] were the first to analyse historical weather and attendance data in an effort to explore the weather sensitivity of zoo visitation. Based on a case study of Chester Zoo in the United Kingdom, the authors concluded that visitor behaviour was mainly influenced by the annual rhythm of the year and the pattern of school and bank holidays. However, there was evidence that visits were redistributed over short periods of time in accordance with the weather [
9]. The results suggested that visitors who may have been frustrated by rainy weather one day; turn up later when the weather improves [
9]. Furthermore, the authors suggested that although warmer temperatures encourage visits, this relationship was only maintained up to a threshold level of approximately 21 °C. Finally, this preliminary study found no evidence of a long-run shift in behaviour due to climate trends; but rather, just an immediate response to each day’s weather [
9]. In conclusion, Aylen
et al. [
9] essentially dismissed any considerable seasonal or annual impacts of projected climate change on zoo visitation.
Perkins [
13] tested the applicability of the spatial synoptic classification (SSC) as a tool to predict visitor attendance response in the tourism, recreation, and leisure (TRL) sector across different climate regimes, based on a case study using 10 years of daily attendance data from two different zoological parks in Atlanta and Indianapolis, USA. Daily attendance data was paired with the prevailing synoptic weather conditions to assess the potential impacts that ambient atmospheric conditions had on visitor attendance [
13]. The results indicated that dry moderate conditions were most associated with high levels of attendance and “moist polar” synoptic conditions were most associated with low levels of attendance at both zoological parks [
13]. However, the author concluded that visitors in Indianapolis showed lower levels of tolerance to synoptic conditions which were not “ideal”; being more averse to “polar” synoptic regimes and less tolerant to “moist tropical” synoptic regimes. Although optimal conditions for zoo visitation may be generalizable across different geographic locations with varying climatic conditions; visitor perception of, and response to, unfavourable weather conditions seem to vary between different case studies.
Perkins and Debbage [
11] focused on ambient thermal environments and visitor behaviour at zoological parks in Phoenix and Atlanta, USA. The authors analysed 10 years of daily zoo visitation in concert with daily weather data to establish the Physiologically Equivalent Temperature (PET) and measure the thermal conditions most likely experienced by zoo visitors. The results suggested that although optimal thermal conditions associated with both zoos appeared to be the same (“slightly warm” or “warm”, based on PET thermal categories); thermal aversion occurred on opposite sides of the spectrum, with visitors in Atlanta avoiding extreme cold and those in Phoenix adverse to extreme heat [
11]. This study has important geographic implications for the weather sensitivity and thermal thresholds associated with zoo visitation; nonetheless, the authors called for further research focusing on zoological parks in cooler climates than that which is characteristic of Atlanta.
Hewer and Gough [
12] used 15 years of daily weather and attendance data to create predictive regression models in an effort to determine the seasonal weather sensitivity of visitation to a zoological park in Toronto, Canada. The results suggested that shoulder season months (spring and fall) were most weather sensitive, followed by off-season months (winter) and then peak-season months (summer). Furthermore, the authors also identified weather-related behavioural thresholds for zoo visitation. During the shoulder season, temperatures exceeding 26 °C were indicative of a critical temperature threshold, causing attendance levels to decline. In the peak season, visitors were more tolerable of extreme heat and attendance levels did not decline until temperatures exceeded 29 °C [
12]. For precipitation, average daily attendance levels declined by approximately 50% when only trace amounts of precipitation was recorded on a given day (0.2 to 2.0 mm). Interestingly, there was very little additional decline in attendance as the volume of total daily precipitation increased beyond 2 mm, including days that recorded more than 60 mm of total precipitation [
12]. The authors concluded that maximum temperature was the most influential weather variable during the off and shoulder seasons; however, total precipitation was the most influential weather variable in the peak season.
The first formal climate change impact assessment on zoo visitation was conducted by Hewer and Gough [
27], using a modelling approach to predict seasonal and annual impacts of projected climate change, based on regression equations derived from the statistical relationship between daily weather and zoo attendance. In regard to annual impacts, the modelling results suggested that visitation is likely to increase by 8% as early as the 2020s (2011 to 2040), by 14%–17% in the 2050s (2041–2070), and by 18%–34% in the 2080s (2071–2100); the range of impacts are dependent upon low and high emissions scenarios and their associated degrees of warming. In regard to the impacts on seasonality, the authors concluded that the off-season would experience minor increases in attendance, while the majority of increases would be experienced during the shoulder seasons. However, increased warming under projected climate change was predicted to have a negative effect on peak season visitation, especially if warming exceeds 3 °C during the summer months [
27]. The current study aims to compare the results of the modelling approach and the analogue approach to assessing the impact of projected climate change on zoo visitation in Toronto.
3. Results
In regard to the presence of confounding non-climatic factors, there were no special animal attractions or new zoo exhibits which would have been likely to explain the unusually high number of zoo visitors during the anomalously warm winters of 2006 and 2012. Furthermore, there were not any known external factors which would have been likely to reduce total visitation during the winters that recorded seasonal temperatures (2011, 2013). In regard to total precipitation, there did not seem to be any internal confounding factors during the anomalously wet or dry winter seasons. However, the wet winter of 2008 was concurrent with the global financial crisis which seems to have a positive effect on zoo visitation that year and the dry winter of 2015 was concurrent with the Pan Am Games in Toronto which seemed to have a negative effect on zoo visitation that year. Nonetheless, it unlikely that the influence of these non-climatic factors which occurred in only one of the two years for both the wet and dry anomalous year groupings skewed the results dramatically, especially since the Pan Am Games was a summer event and may not have had much impact on winter season visitation that year.
In regard to the presence of confounding non-climatic factors, there were no special animal attractions or new zoo exhibits which would have been likely to explain the unusually high number of zoo visitors during the anomalously warm springs of 2010 and 2012. Furthermore, there were not any known external factors which would have been likely to reduce total visitation during the springs that recorded seasonal temperatures (2004, 2008). In regard to total precipitation, the anomalously wet spring season of 2003 was also the second coolest spring recorded between 1999 and 2015. Furthermore, this season was also concurrent with the SARS crisis in Toronto, which had a negative impact on zoo visitation that year. These two confounding variables were likely to exaggerate the impact that the anomalously wet season had of total spring zoo visitation. However, it is unlikely that their presence would negate the results altogether, especially since the anomalously wet spring of 2011 caused similar effects when no other confounding factors appeared to be present. Furthermore, the anomalously dry season of 2012 was also the warmest spring season recorded between 1999 and 2015. This would have likely exaggerated the impact of the anomalously dry season on total spring zoo visitation. Nonetheless, it is again unlikely that this occurrence would negate the findings altogether, especially since a similar effect was observed during the anomalously dry spring of 1999, when no other factors seemed to be present.
3.1. Winter
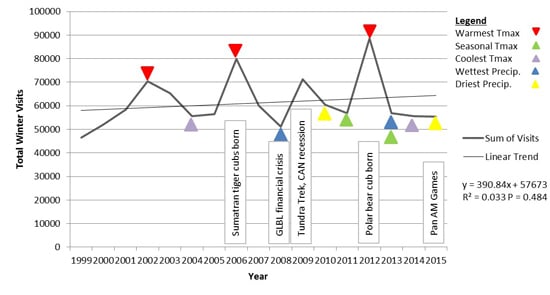
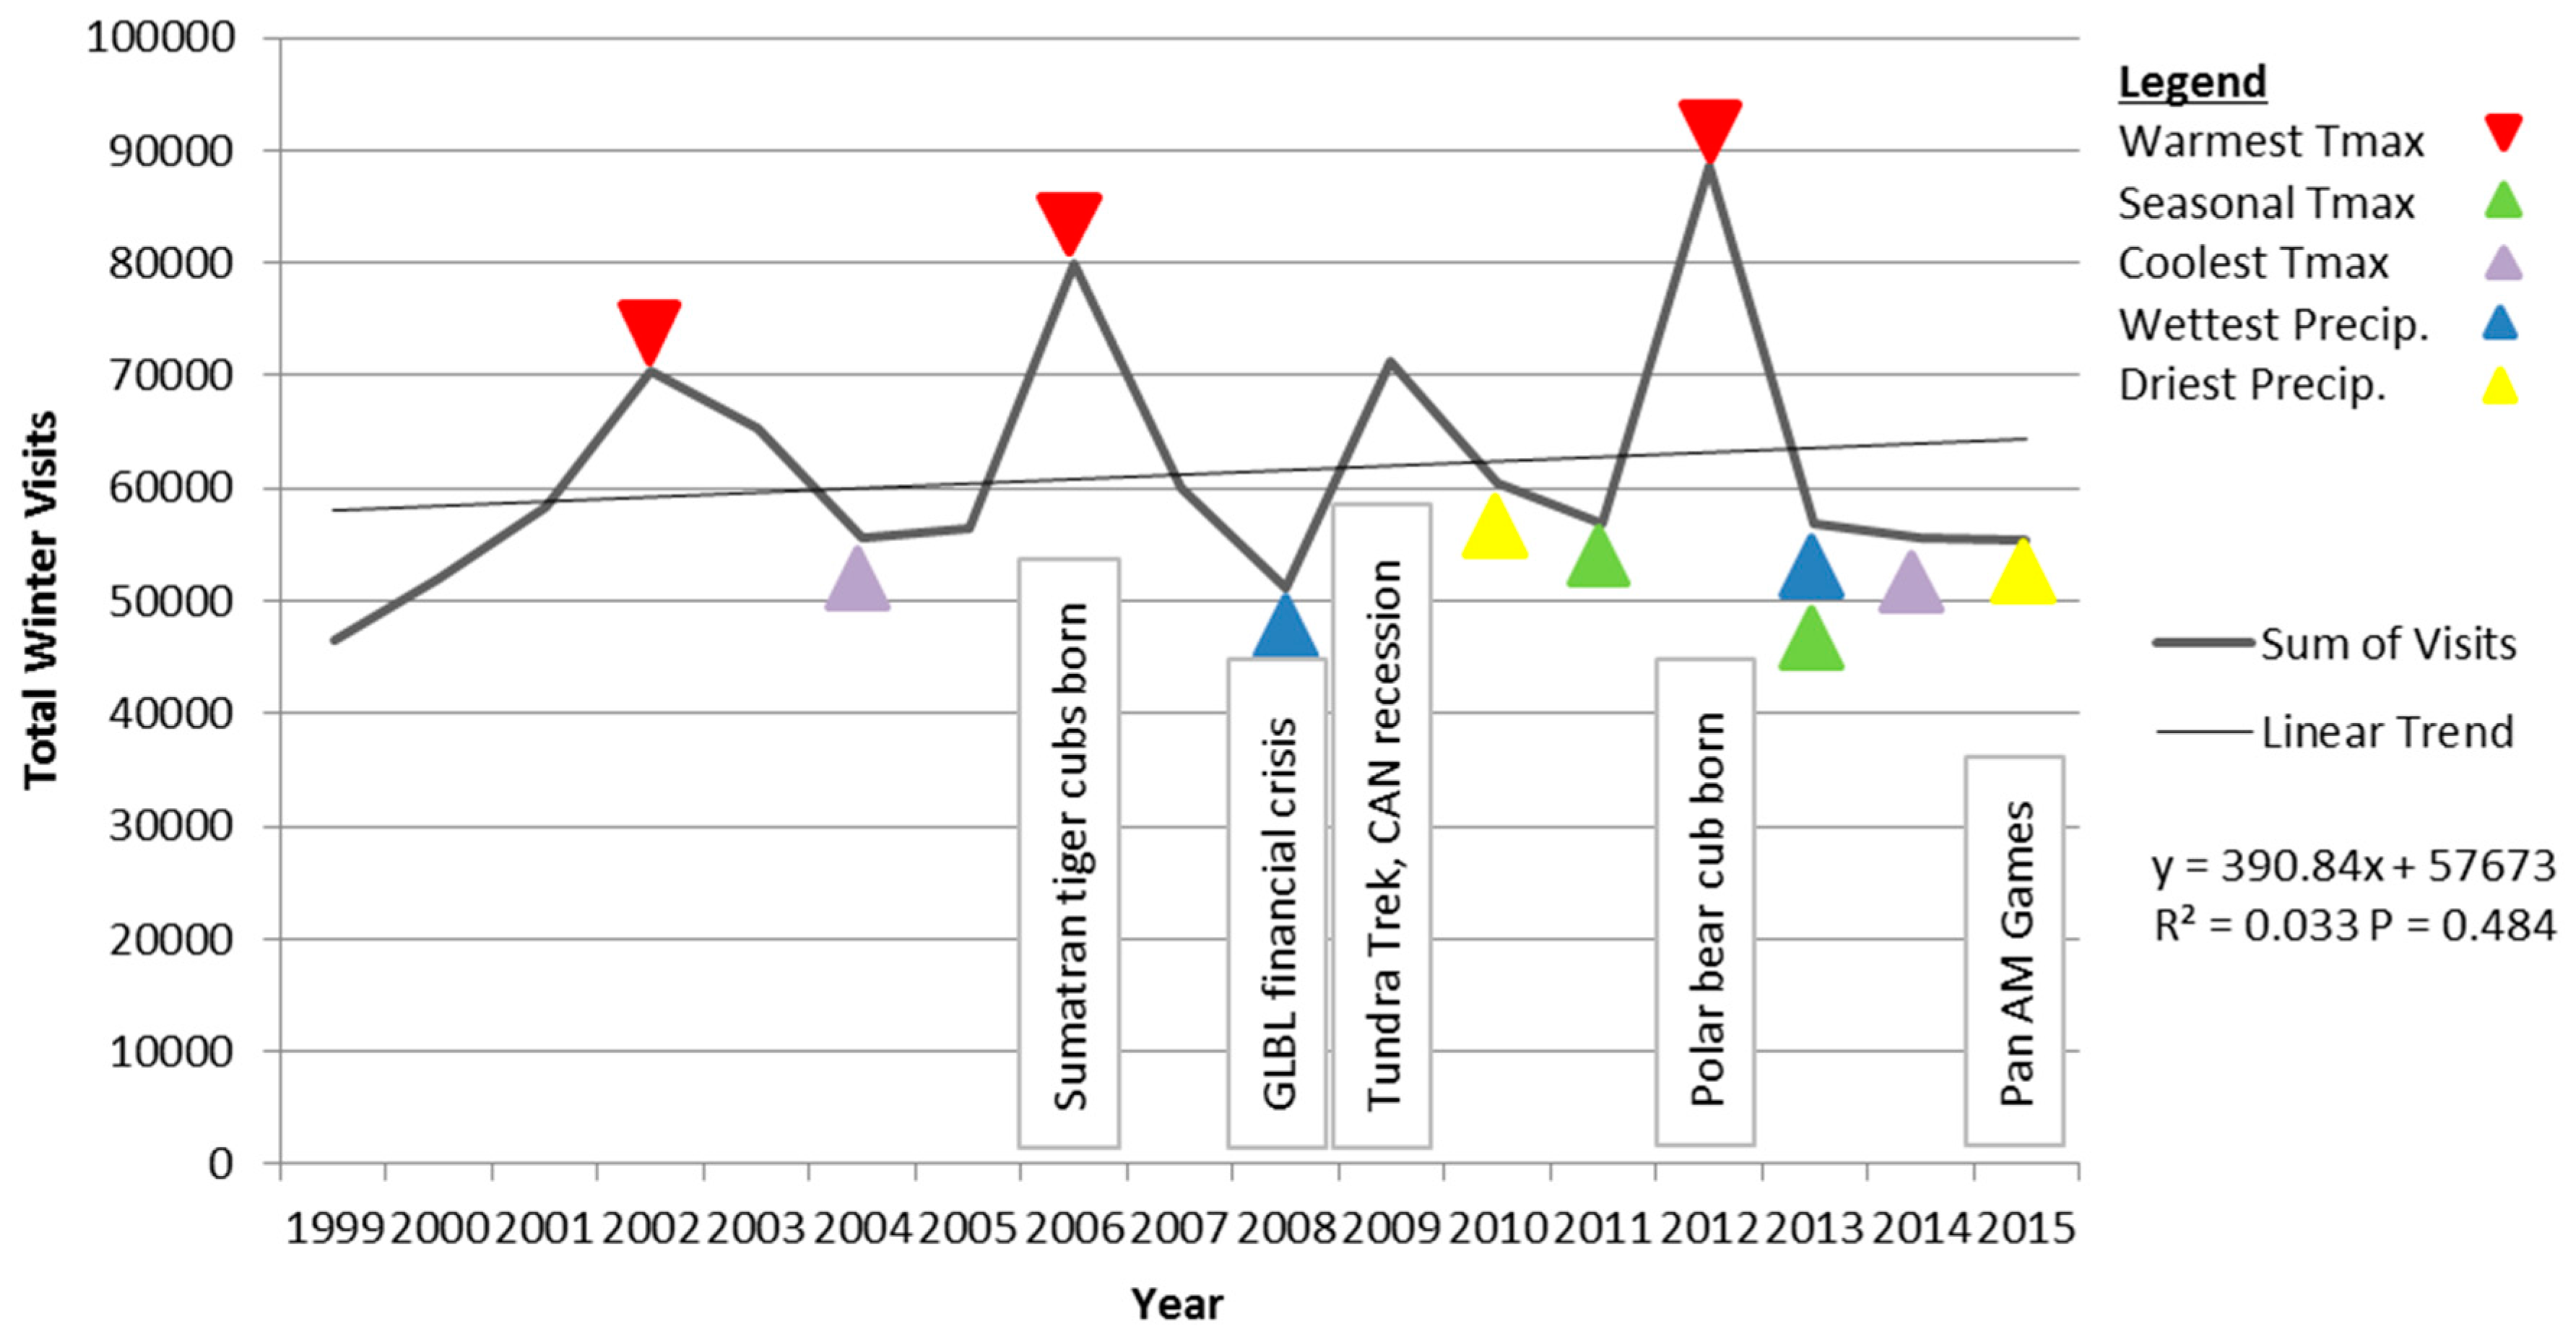
The winter season included the months of December, January, and February. Although there was a positive slope in linear trend line for total zoo visitation over time in the winter season (
Figure 2), the results of a simple linear regression analysis suggested that this trend was not statistically significant (
R2 = 0.033,
p = 0.484). Therefore, there should not be any issues with selecting years to represent seasonal climatic anomalies or climate normals from either end of the study period.
Figure 2 illustrates that there were three years in particular when total zoo visitation was unusually high in the winter season (2002, 2006, 2012). The winters of 2006 and 2012 were the warmest winters to occur from 1999 to 2015, both of which recorded average maximum temperatures more than 3 °C warmer than average maximum temperatures during the 1981 to 2010 baseline. Although it was not selected as one of the two anomalously warm winters, the winter of 2002 also recorded temperatures more than 2 °C warmer than average winter temperatures during the baseline period. The winters of 2011 and 2013 recorded average temperatures that were closest to the seasonal averages from 1981 to 2010 and therefore represent climatically normal seasons. An
F-test to determine if there were differences in the variances between total daily zoo visitation during anomalously warm winters compared to climatically normal winters revealed statistically significant results (
n = 178,
F = 5.928,
p < 0.001). A
t-test assuming unequal variances to determine if there were differences in the means for total daily zoo visitation between anomalously warm winters and climatically normal winters also revealed statistically significant results (
n = 178,
t = 1.882,
p = 0.031).
Anomalously wet or dry winters did not appear to have an impact on total zoo visitation in a particular year. The winters of 2008 and 2013 recorded 70 and 44 percent more total precipitation than the seasonal average (155.8 m), based on the 1981 to 2010 baseline. Whereas, the winters of 2010 and 2015 recorded 49 and 31 percent less total precipitation than the seasonal average from 1981 to 2010. Despite the presence of both anomalously wet and dry winter seasons within the study period from 1999 to 2015, the results of both an F-test (F = 0.957, p = 0.385) and t-test (t = −0.506, p = 0.307) did not indicate any statistically significant differences between either the variances or means of these two groups, respectively.
The anomalously warm winters recorded in 2006 and 2012 were found to have a statistically significant impact on total zoo visitation during those two years, when compared to total zoo visitation during the climatically normal winter seasons of 2011 and 2013. On average, daily maximum temperature during the winter seasons of 2006 and 2012 were 3.2 °C warmer than baseline winter temperatures. Total winter season zoo visitation increased by 48% when comparing the anomalously warm years with the climatic normal years (more than 27,000 additional visitors each winter season, on average). Based on the selective ensemble of seasonal climate change projections for this region (
Table 1), the anomalous warm winters of 2006 and 2012 are expected to become the climatic normals as early as the 2050s (2041–2070) under RCP8.5 and by the 2080s (2071–2100) under RCP4.5. Total precipitation in the winter season is projected to increase over the course of the 21st century from an additional 10% in the 2020s to as much as 30% in the 2080s (
Table 2). However, even when anomalously wet winters occurred (+44%, +70%) that far exceeded the increases in precipitation projected under climate change, no statistically significant differences in total winter season zoo visitation were reported, even compared to the driest winters between 1999 to 2015. Although there is some uncertainly pertaining to when winters in this region will experience an average warming of 3 °C, it is very likely that winter season zoo visitation will continue to increase considerably, under projected climate change.
3.2. Spring
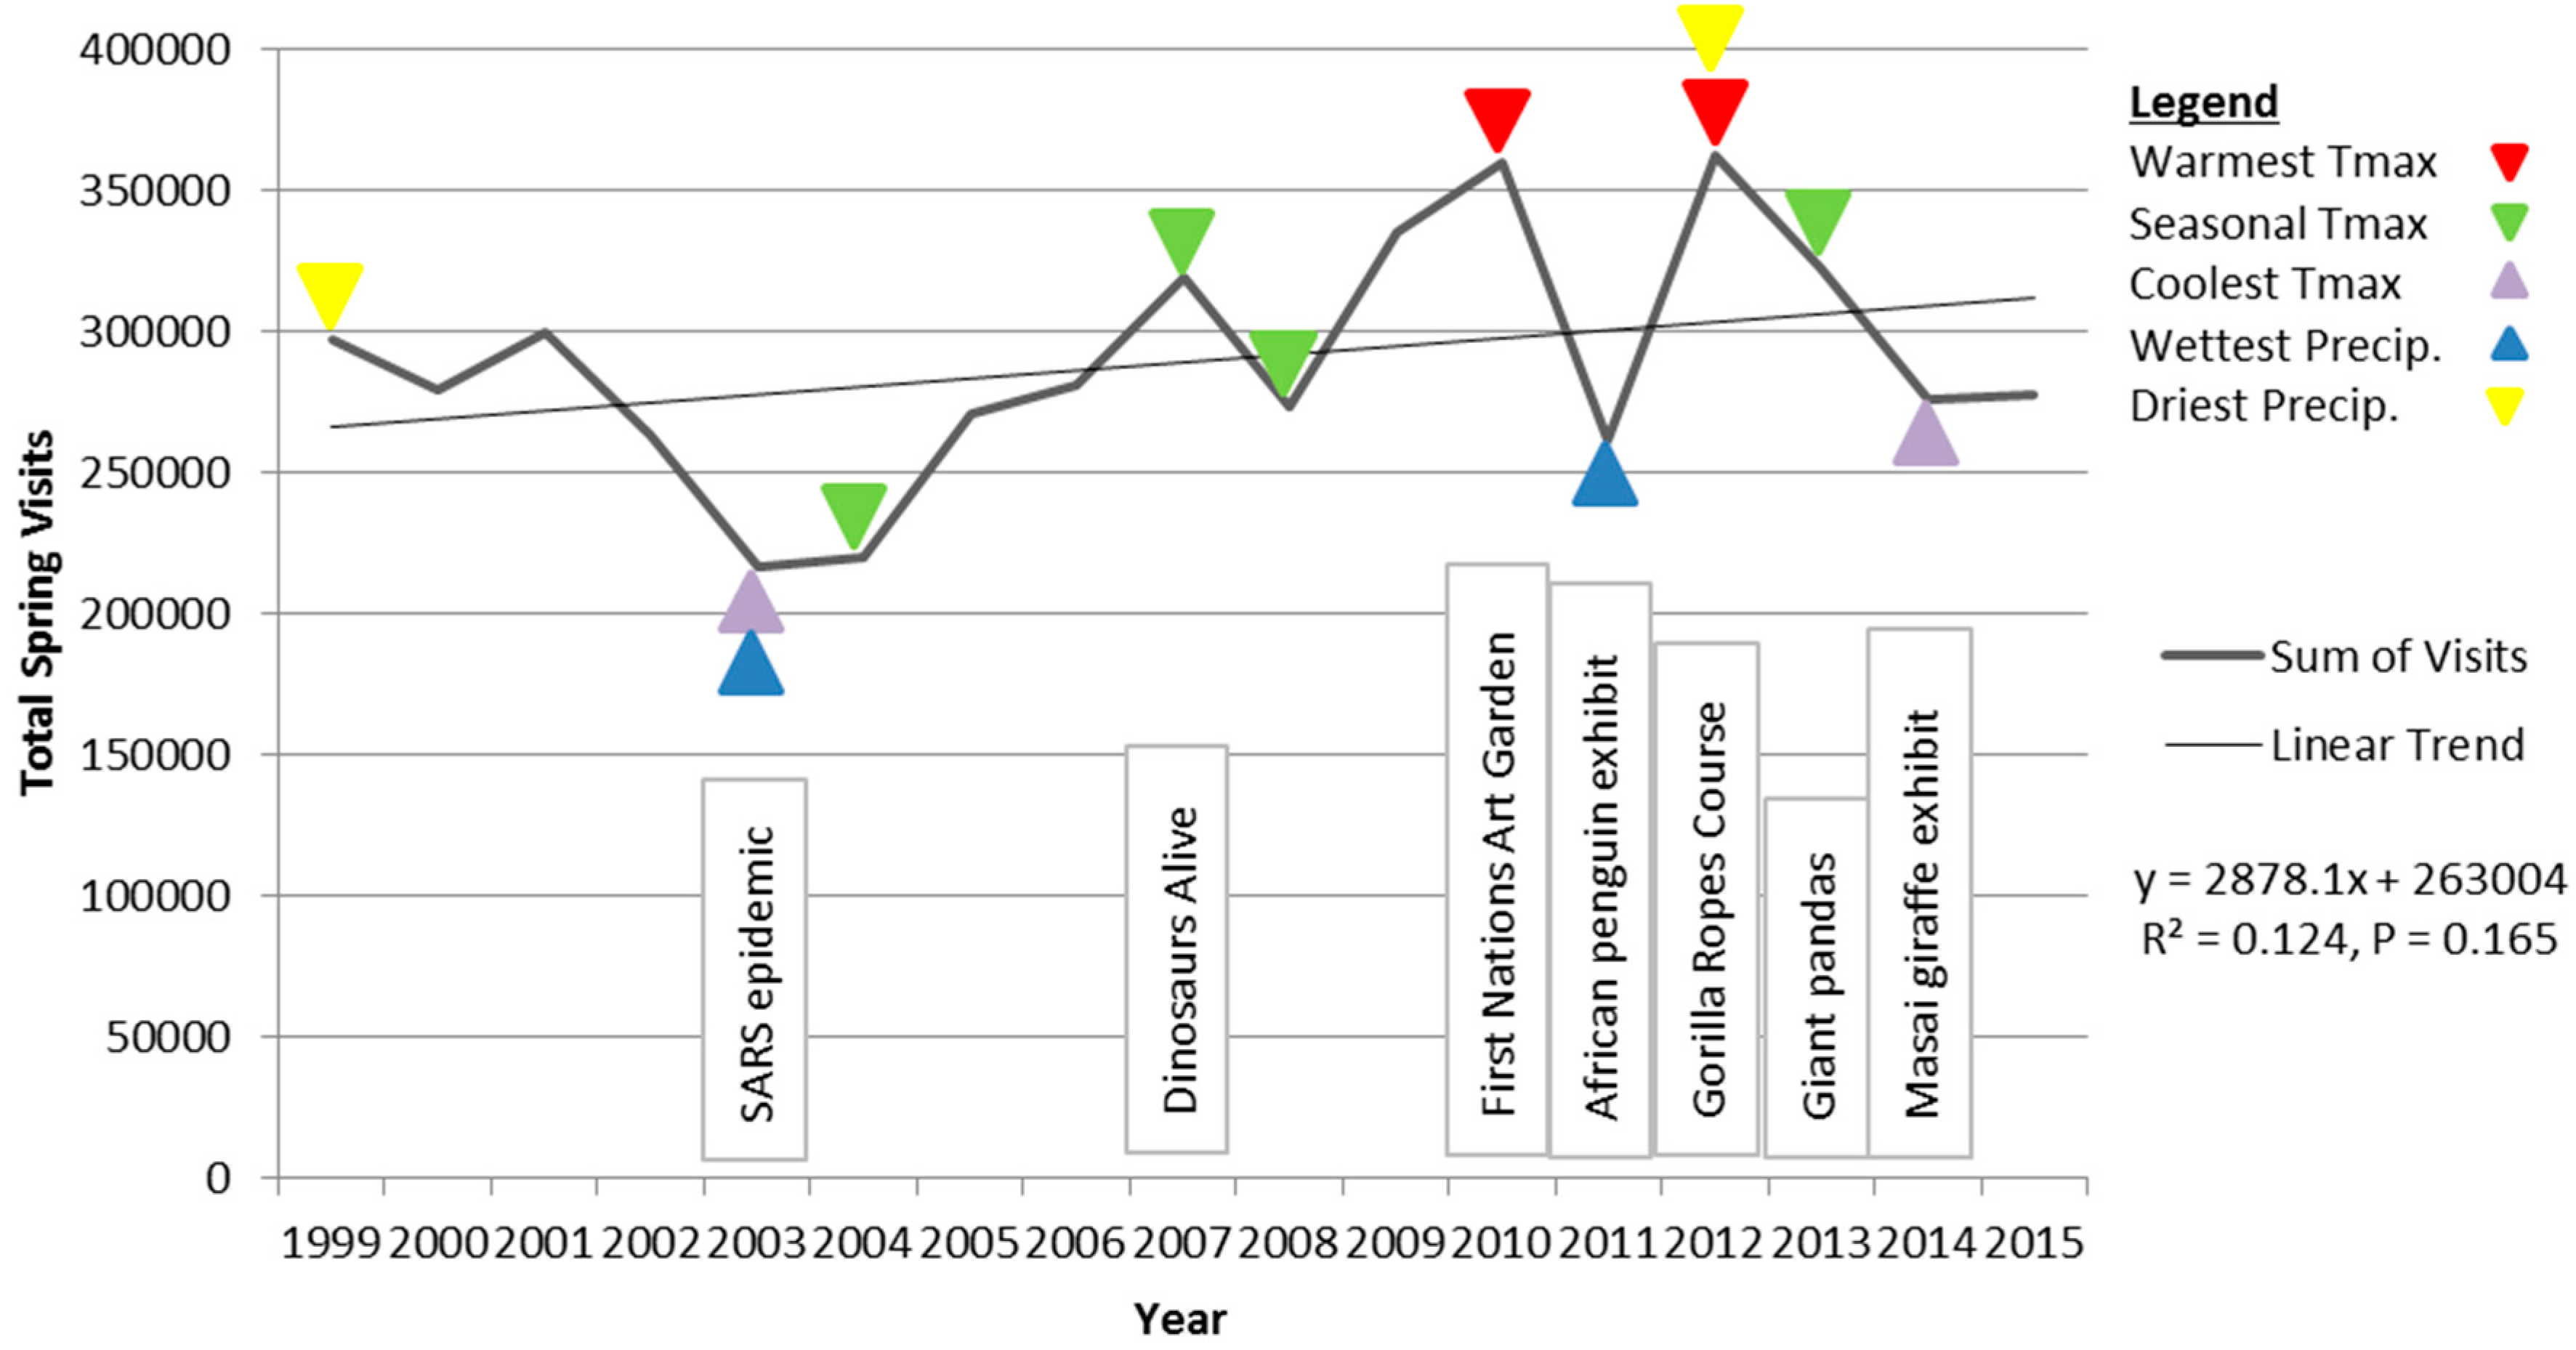
The spring season included the months of March, April, and May. Although there was once again a positive slope in linear trend line for total zoo visitation over time in the spring season (
Figure 3), the results of a simple linear regression analysis suggested that this trend was not statistically significant (
R2 = 0.124,
p = 0.165). Therefore, there should not be any issues with selecting years to represent seasonal climatic anomalies or climate normals from either end of the study period.
Figure 3 illustrates that there were two years in particular when total zoo visitation was unusually high in the spring season (2010, 2012). The spring of 2010 and 2012 were the warmest springs to occur from 1999 to 2015, both of which recorded average maximum temperatures more than 3 °C warmer than average maximum temperatures during the 1981 to 2010 baseline. The springs of 2007 and 2013 recorded average temperatures that were closest to the seasonal averages from 1981 to 2010 and therefore represented climatically normal seasons. However, these two years were concurrent with potentially confounding non-climatic factors: the opening of the Dinosaurs Alive exhibit in May of 2007, and the arrival of the two giant pandas in March of 2013. This prompted the decision to select the springs of 2004 and 2008 to represent climatically normal springs instead, which recorded the next two closest average temperatures when compared to the seasonal average from 1981 to 2010. The springs of 2007 and 2013 were 0.05 °C and 0.12 °C warmer than the seasonal average from 1981 to 2010, respectively. Whereas, the springs of 2004 and 2008 were 0.22 °C warmer and 0.44 °C cooler, respectively, when compared to the seasonal baseline average. An
F-test to determine if there were differences in the variances between total daily zoo visitation during anomalously warm springs compared to climatically normal springs revealed statistically significant results (
n = 184,
F = 2.405,
p < 0.001). A
t-test assuming unequal variances to determine if there were differences in the means for total daily zoo visitation between these two groups also revealed statistically significant results (
n = 184,
t = 3.531,
p < 0.001).
Anomalously wet springs appeared to have a considerable impact on total zoo visitation in a particular year, when compared to anomalously dry springs. The springs of 2003 and 2011 recorded 38 and 73 percent more total precipitation than the seasonal average (191.08 m), based on the 1981 to 2010 baseline. Whereas, the springs of 1999 and 2012 recorded 42 and 43 percent less total precipitation than the seasonal baseline average from 1981 to 2010. An F-test to determine if there were differences in the variances between total daily zoo visitation during anomalously wet springs compared to anomalously dry springs revealed statistically significant results (n = 184, F = 0.648, p = 0.001). A t-test assuming unequal variances, used to determine if there were differences in the means for total daily zoo visitation between these two groups, also revealed statistically significant results (n = 184, t = −2.993, p = 0.001).
The anomalously warm springs recorded in 2010 and 2012 were found to have a statistically significant impact on total zoo visitation during those two spring seasons, when compared to total zoo visitation during the climatically normal winter seasons of 2004 and 2008. On average, daily maximum temperatures during the spring seasons of 2010 and 2012 were 3.9 °C warmer than baseline spring temperatures. Total spring season zoo visitation increased by 46% when comparing the anomalously warm years with the climatic normal years (more than 114,000 additional visitors each spring season, on average). Based on the selective ensemble of seasonal climate change projections for this region (
Table 1), the anomalous warm springs of 2010 and 2012 are expected to become the climatic normals as early as the 2050s (2041–2070) under RCP8.5 and by the 2080s (2071–2100) under RCP4.5. Total precipitation in the spring season is projected to increase over the course of the 21st century from an additional 5% in the 2020s to as much as 30% in the 2080s (
Table 2). The results of this study suggest that when anomalously wet spring seasons did occur, total zoo visitation was significantly lower compared to anomalously dry spring seasons. However, the anomalously wet seasons tested were associated with increases in precipitation (+42%, +43%) that far exceed those projected under climate change over the course of the 21st century for this region. In summary, spring season zoo visitation is likely to increase under projected climate change due to rising temperatures, despite potential decreases due to increased precipitation.
3.3. Summer
The summer season included the months of June, July, and August. Once again, a positive slope was observed in the linear trend line for total zoo visitation over time in the summer season (
Figure 4); however, the results of a simple linear regression analysis suggested that this trend was not statistically significant (
R2 = 0.047,
p = 0.403). Therefore, there should not be any issues with selecting years to represent seasonal climatic anomalies or climate normals from either end of the study period.
The summers of 2002, 2005, and 2012 were the warmest summers to occur from 1999 to 2015 in this region. The summers of 2002 and 2012 recorded average temperatures that were 1.89 °C warmer than those recorded during the 1981 to 2010 baseline period; whereas, the summer of 2005 recorded temperatures that were 2.71 °C warmer than average baseline temperatures. Interesting,
Figure 4 indicates that total summer season zoo visitation was below average attendance levels in all three of these years. The summers of 2003 (+0.22 °C) and 2013 (−0.33 °C) recorded average temperatures that were closest to the seasonal average from 1981 to 2010 (25.77 °C), and therefore most accurately represented climatically normal seasons. However, visitation during the summer of 2003 was likely negatively impacted by the SARS crisis in Toronto; whereas, visitation during the summer of 2013 was likely positively affected by the arrival of the two giant pandas on loan from China. In an effort to control for the influence of these potentially confounding non-climatic factors, the summers of 2008 and 2014 were selected instead to represent summers with climatically normal temperatures. The summers of 2008 and 2014 recorded temperatures that were 0.53 °C and 0.54 °C cooler than seasonal baseline temperatures, respectively [
43]. An
F-test to determine if there were differences in the variances between total daily zoo visitation during anomalously warm summers compared to climatically normal summers revealed statistically significant results (
n = 184,
F = 0.759,
p = 0.031). A
t-test assuming unequal variances, used to determine if there were differences in the means for total daily zoo visitation between these two groups, also revealed statistically significant results (
n = 184,
t = −2.861,
p = 0.002).
Anomalously wet or dry summers did not appear to have an impact on total zoo visitation in a particular year (
Figure 4). The summer of 2013 recorded the second greatest volume of total precipitation between 1999 and 2015, with 56 percent more total precipitation than the seasonal average from 1981 to 2010 (224.71 m). However, the summer of 2013 was not selected to represent an anomalously wet summer season due to the potentially confounding influence that the presence of the two giant pandas may have had on results of this analysis. Instead, the summers of 2008 and 2010 were chosen, which recorded 76 and 51 percent more total precipitation than the seasonal baseline average. Inversely, the summers of 2001 and 2007 recorded 42 and 50 percent less total precipitation than the seasonal average from 1981 to 2010. Despite the presence of both anomalously wet and dry summer seasons within the study period from 1999 to 2015, the results of both an
F-test (
F = 1.239,
p = 0.074) and
t-test (
t = −0.908,
p = 0.182) did not indicate any statistically significant differences between either the variances or means of these two groups, respectively.
In regard to the presence of confounding non-climatic factors, there were known external factors which would have been likely to explain the below average number of zoo visitors during the anomalously warm summers of 2005 and 2012. Furthermore, there were not special animal attractions or new zoo exhibits which would have been likely to increase total visitation during the summers that recorded seasonal temperatures (2008, 2014). In regard to total precipitation, there did not appear to be any major confounding factors which would have considerably influenced the results. The anomalously wet year of 2008 was concurrent with the global financial crisis which seemed to have a positive impact on zoo visitation that year; whereas, the anomalously dry summer of 2007 was concurrent with the opening of the new Dinosaurs Alive exhibit which seemed to have a positive impact of zoo visitation that year. Nonetheless, it is unlikely the presence of these two factors during only one of the two years making up the groupings selected to represent anomalously wet and dry summer seasons was enough to produce a false negative in terms of the finding that there was no significant differences in the variances or means for total daily zoo visitation between these two groups.
The anomalously warm summers recorded in 2005 and 2012 were found to have a statistically significant impact on total zoo visitation during those two summer seasons, when compared to total zoo visitation during the climatically normal summer seasons of 2008 and 2014. On average, daily maximum temperature during the summer seasons of 2005 and 2012 were 2.3 °C warmer than baseline summer temperatures (1981–2010). Total summer season zoo visitation decreased by 11% when comparing the anomalously warm years with the climatic normal years (almost 80,000 fewer visitors each summer season, on average). Based on the selective ensemble of seasonal climate change projections for this region (
Table 1), the anomalous warm summer of 2005 and 2012 are expected to become the climatic normals by the beginning of the 2050s (2041–2070) under RCP8.5 and by the end of the 2050s under RCP4.5. Total precipitation in the summer season is projected to decrease slightly over the course of the 21st century by as much as 4% in the 2020s to as much as 9% in the 2080s (
Table 2). However, even when anomalously dry summers did occur (−42%, −50%), which far exceeded the decreases in precipitation projected under climate change, no statistically significant differences in total summer season zoo visitation were reported, even compared to the wettest summer between 1999 and 2015. It is very likely that average maximum temperatures in this region during the summer season will experience a warming of more than 2 °C by the mid-21st century. The results of this study suggest that this will likely have a negative impact of zoo attendance during this season.
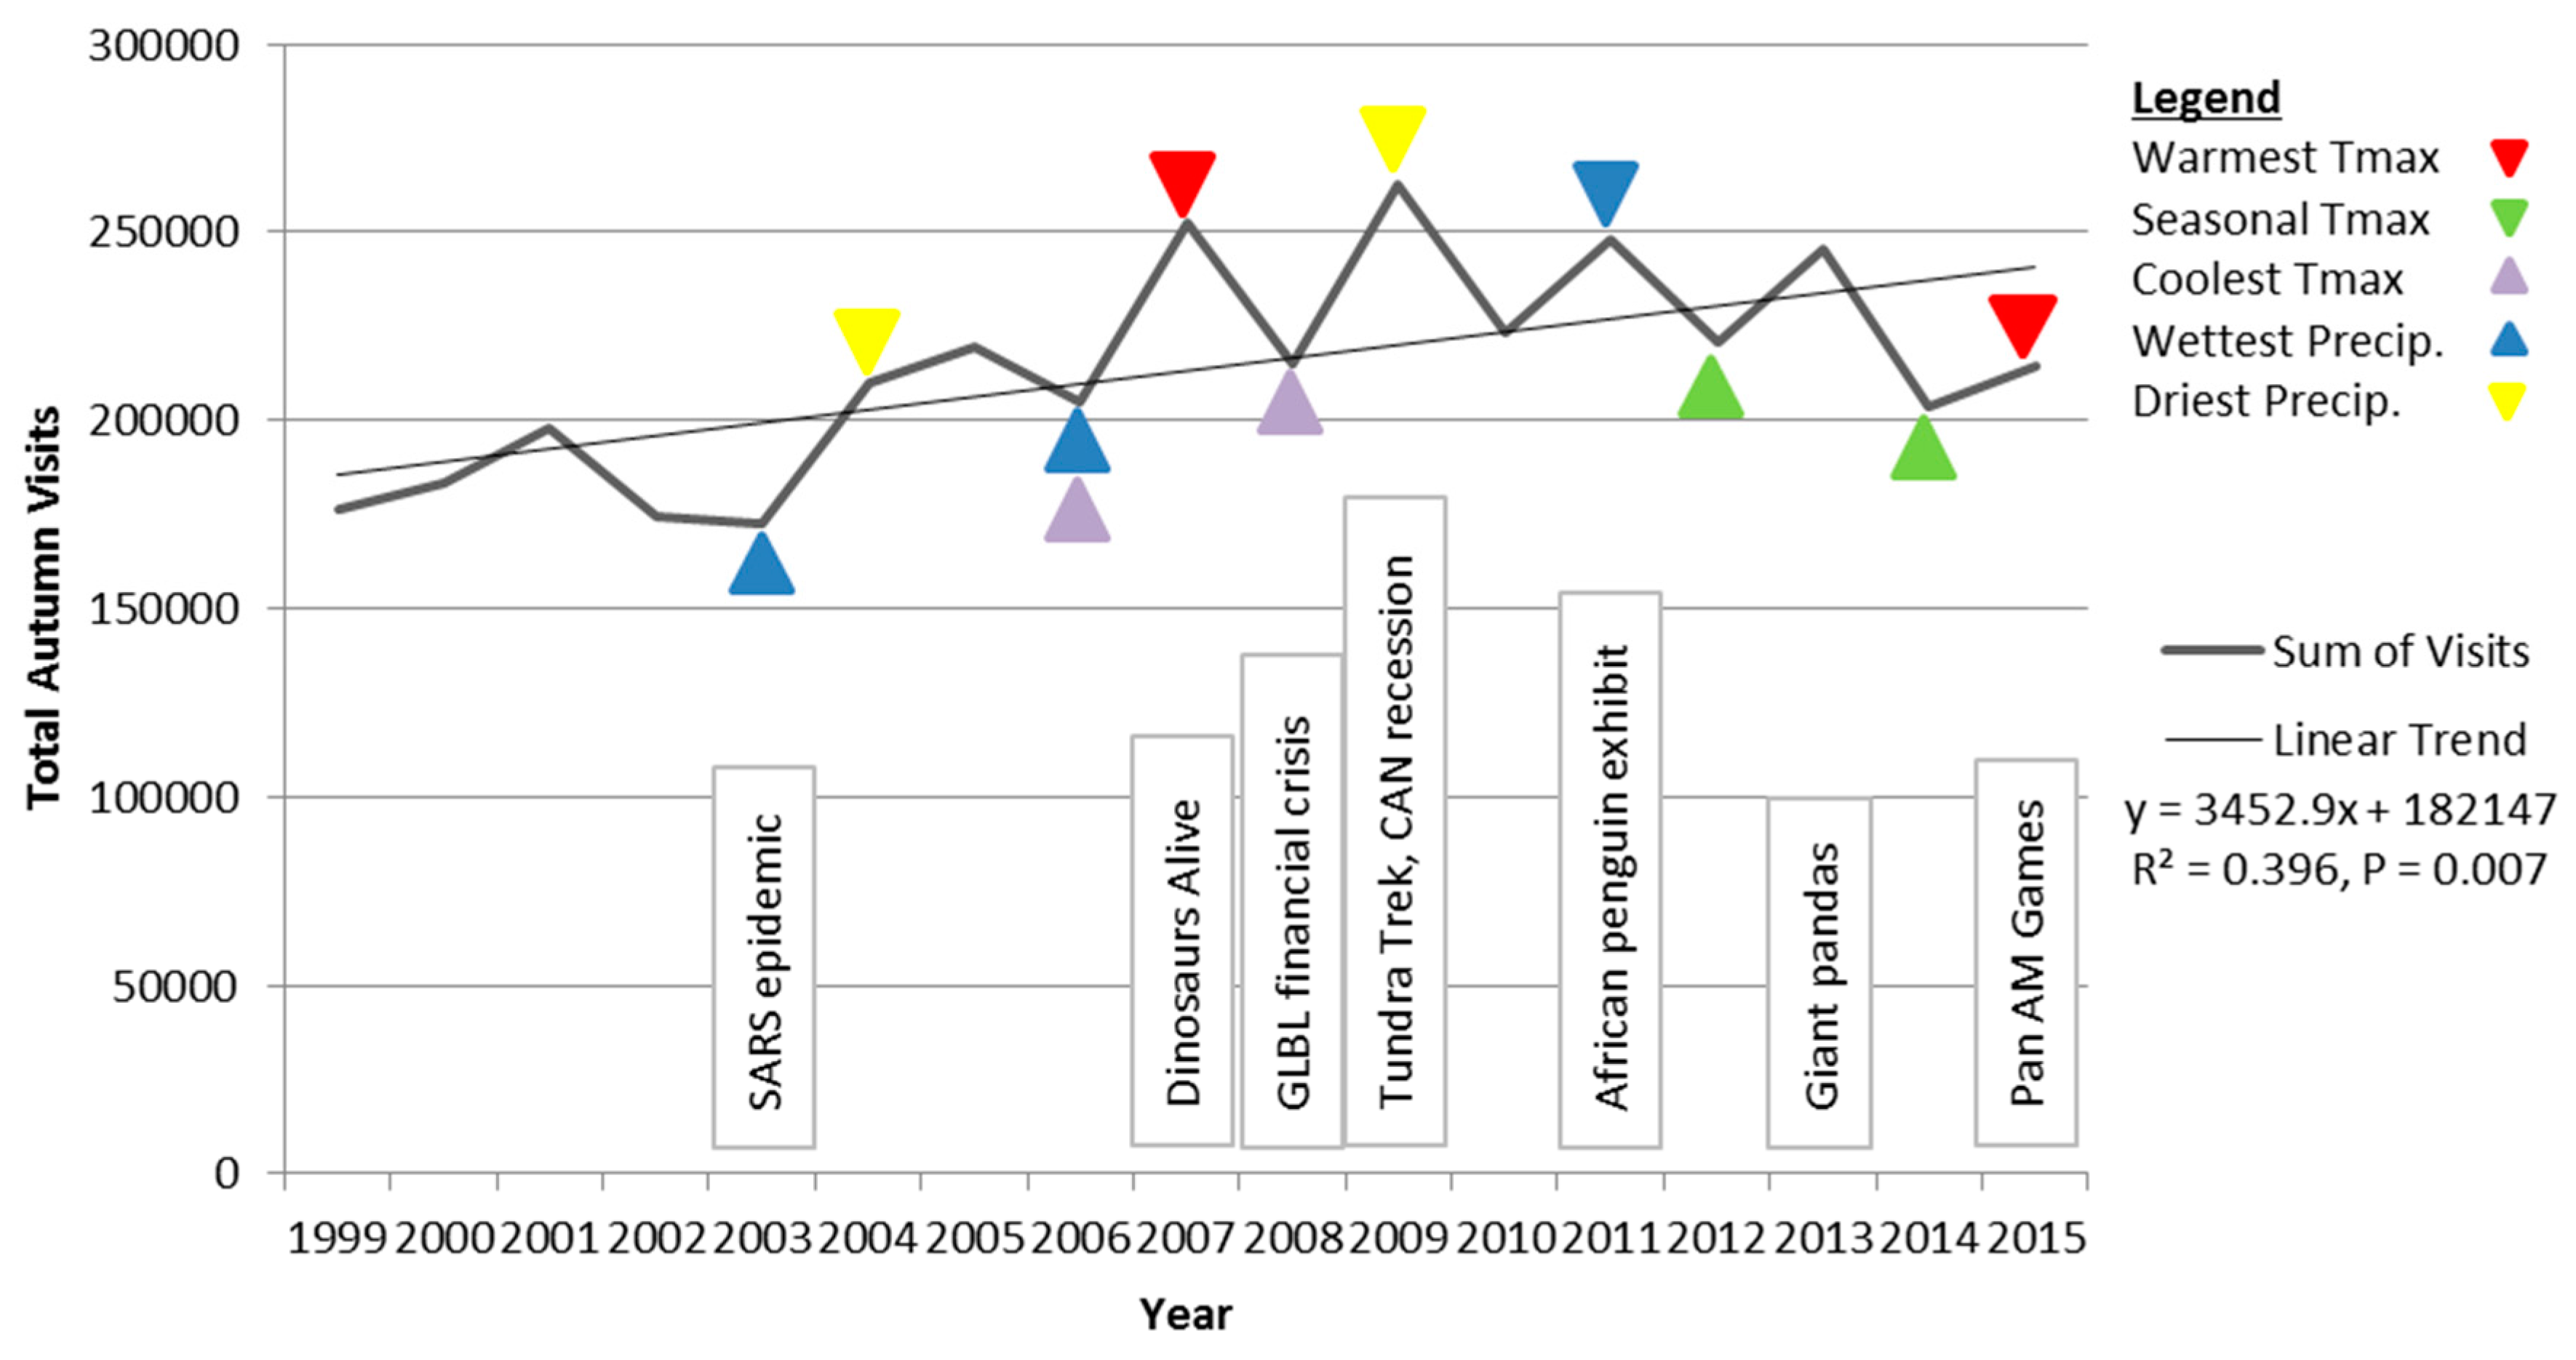
3.4. Autumn
The autumn season included the months of September, October, and November.
Figure 5 indicates that there was a positive slope in linear trend line for total zoo visitation over time in the autumn season and the results of a simple linear regression analysis suggests that this trend is statistically significant (
R2 = 0.396,
p = 0.007). Therefore, there may be issues with selecting years to represent seasonal climatic anomalies or climate normals from either end of the study period. To such a degree that autumn seasons near the beginning of the study period may be associated with lower than average total visitation; whereas, autumn seasons near the end of the study period may be associated with higher than average visitation levels.
Figure 5 illustrates that there were four years in particular when total zoo visitation was noticeably higher than the linear trend during the autumn season (2007, 2009, 2011, 2013). Unlike the other three seasons already considered, these spikes in total visitation over time do not correlate directly with the warmest seasons within the study period. Instead, they seem to be directly related to non-climatic factors primarily internal to zoo operations and management involving special animal attractions and new exhibits (Dinosaurs Alive in 2007; Tundra Trek in 2009; African penguins in 2011; Giant pandas in 2013). Howbeit, the autumns of 2007 and 2015 were the warmest autumns to occur from 1999 to 2015, both of which recorded average maximum temperatures more than 2 °C warmer than average seasonal baseline temperatures. Whereas, the autumns of 2012 and 2014 recorded average temperatures that were closest to the seasonal baseline average and therefore represent climatically normal seasons. An
F-test to determine if there were differences in the variances between total daily zoo visitation during anomalously warm autumns compared to climatically normal autumns did not reveal statistically significant results (
n = 181,
F = 1.122,
p = 0.220). A
t-test assuming equal variances to determine if there were differences in the means for total daily zoo visitation between anomalously warm autumns and climatically normal autumns did not produce statistically significant results either (
n = 181,
t = 0.870,
p = 0.192).
Anomalously wet or dry autumns did not appear to have an impact on total zoo visitation during that season in a particular year either. The autumn season of 2003 recorded the greatest volume of total precipitation from 1999 to 2015, with 47% more total precipitation than the seasonal baseline average (208 mm). However, this season was concurrent with the SARS crisis in Toronto and was also near the beginning of the study period which demonstrated a positive linear trend. Both of these factors may have caused total autumn zoo visitation to be lower than usual regardless of the anomalously wet season. In response, the autumns of 2004 and 2009 were selected to represent anomalously wet seasons, recording 45 and 30 percent more total precipitation respectively, compared to the seasonal baseline average. Whereas, the winters of 2010 and 2015 recorded 49 and 31 percent less total precipitation than the seasonal average from 1981 to 2010. Despite the presence of both anomalously wet and dry autumn seasons within the study period from 1999 to 2015, the results of both an F-test (F = 0.998, p = 0.494) and t-test (t = −0.380, p = 0.352) did not indicate any statistically significant differences between either the variances or means of these two groups, respectively.
As mentioned earlier, there were apparently a number of non-climatic variables that seemed to exercise considerable influence over total zoo visitation during the autumn season that may have confounded the results. To begin, the anomalously warm autumn of 2007 was concurrent with the new Dinosaurs Alive exhibit which seemed to positively impact total zoo visitation that year. Inversely, the anomalously warm autumn of 2015 was concurrent with the Pan Am Games which were during July in Toronto and seemed to negatively impact total zoo visitation that year, possibly having lingering effects on zoo visitation during the autumn season. Furthermore, the anomalously wet autumn of 2011 was concurrent with the new African penguin exhibit which may have positively impacted zoo visitation that season. Additionally, the anomalously dry autumn of 2009 was concurrent with the new Tundra Trek exhibit which seemed to positively impact total zoo visitation that year. The full extent to which these confounding factors influenced the results cannot be determined, but it is possible that the positive impact associated with Dinosaurs Alive in the warm 2007 season was offset by the negative impact of the Pan Am Games in the 2015 season, when the two seasons were averaged. Furthermore, the positive impact associated with the African penguins in the wet 2011 season may have been offset by the positive influence of the Tundra Trek in the dry 2009 season, when the two groups were compared. Regardless, these findings suggest that the autumn season was least sensitive to climatic anomalies as the results did not record any statistically significant differences between anomalously warm or climatically normal seasons, nor between anomalously wet or dry seasons, in regard to total autumn season zoo visitation.
On average, daily maximum temperatures during the autumn seasons of 2007 and 2015 were 2.2 °C warmer than baseline autumn temperatures in this region. Total autumn season zoo visitation increased by 10% when comparing the anomalously warm years with the climatic normal years (just over 21,000 additional visitors each autumn season, on average). Based on the selective ensemble of seasonal climate change projections for this region (
Table 1), the anomalous warm autumns of 2007 and 2015 are expected to become the climatic normals as by the early 2050s (2041–2070) under RCP8.5 and by the late 2050s RCP4.5. It is possible that further warming under projected climate change during the autumn season may result in increased zoo visitation, but the results of this study were inconclusive in this regard due to a lack of statistically significant differences being reported between the two groups. There remains a lot of uncertainty in the climate change projections for total precipitation during the autumn season for this region, reporting both slight increases and decreases across the course of the 21st century, depending on the RCP (
Table 2). Regardless, even when anomalously wet autumns occurred (+45%, +30%), which far exceeded the increases in precipitation projected under climate change, no statistically significant differences in total autumn season zoo visitation were reported, although compared to the driest winters between 1999 to 2015. The results of this study suggest that the positive impacts of projected climate change on zoo visitation, as suggested in the modeling approach by Hewer & Gough [
27] are less likely to be realised during the autumn season, as this season seems least sensitive to climatic anomalies.
4. Discussion and Conclusions
The findings of this study confirmed the expectations of Dwyer [
14] and Smith [
15] that when anomalously warm winters occurred within the observational record from 1999 to 2015, the total number of zoo visitors increased significantly as a result. Likewise, when anomalously warm summers occurred, the total number of zoo visitors decreased significantly. However, the comments of both Dwyer [
14] and Smith [
15] seem to relate more to seasonal thermal extremes experienced in the winter and summer months without any discussion of how these relationships may be altered in the transitioning seasons of the spring and autumn. The results of the current study provide some insights into this query, showing that visitation during the spring season responded similarly to that of the winter season; whereas, visitation in the autumn season was unique in its apparent lack of sensitivity to seasonal climatic anomalies. A possible explanation is trajectory [
12]. Autumn is a season that is cooler than its antecedent; whereas, spring is warmer than its antecedent. Therefore, spring “seems” warmer than autumn and thus, may be perceived as more attractive to zoo visitors. This has important implications for previous modelling studies which have grouped both shoulder seasons together in an effort to increase sample size and statistical power [
12,
27].
The results of this study do not agree with the suggestion made by Aylen
et al. [
9] that climate change is unlikely to have considerable seasonal or annual impacts on zoo visitation. When anomalously warm winters and springs were recorded in the study region, total zoo visitation increased significantly during those seasons. Inversely, when anomalously warm summers occurred, total summer season zoo visitation decreased significantly. This is indicative of the type of demand response that can be expected from zoo visitors and managers alike, if these conditions were to become the norm under projected climate change. Nonetheless, conclusions on the implications of climate change for tourism demand must be drawn with caution; since extreme events are likely to have different effects on tourist behaviour than longer-term trends like climate change [
25]. Howbeit, the divergent conclusions drawn from these two studies may be explained by the geographic context in which they were conducted, as the two different zoos selected as case studies are situated in two considerably different geographic regions with varying climatic characteristics (Manchester, England compared to Toronto, Canada).
Although focused on the same zoological park in Toronto (Canada), direct comparisons between the modelling approach of Hewer & Gough [
27] and the analogue approach of the current study was difficult to achieve. Hewer & Gough [
27] combined three different seasonal regression models based on the statistical relationship between daily attendance and weather data, in order to assess the impact of projected climate change on zoo visitation. However, the model predictions for daily zoo visitation under projected climate change were reported as annual impacts; whereas, the current study reports the effects of climatic anomalies in relation to seasonal impacts. Nonetheless, Hewer & Gough [
27] suggested increases in zoo visitation under projected climate change during the winter months of the off season as well as during the spring and autumn months of the shoulder seasons, with potential decreases in visitation during the summer months of the peak season. The results of the current study support the direction of the impacts in both the winter and summer seasons but caution against the suggestion that visitation in the autumn season will increase at same the rate as visitation in the spring season. When a warming of between 2 °C to 3.5 °C was projected, the modelling approach of Hewer and Gough [
27] suggested that total annual zoo visitation would increase by 14% to 17%; which takes into account the positive impacts in the winter, spring, and autumn seasons as well as the negative impacts during the summer season. By averaging the projected warming and associated impacts from the four different seasons in the current analogue approach, when a 2.9 °C increase in annual temperature was experienced, where above average temperatures occurred in all four seasons, total annual zoo visitation increased by 23%. Interestingly, in the context of an urban zoological park, the temporal climate analogue approach projects greater climate change impacts than the modelling approach; this is contrary to that which has been reported in the ski industry context [
23,
24,
25].
Zoo visitation is a unique tourism attraction and recreational activity in comparison to other tourism contexts that have been assessed using the climate analogue approach (i.e. downhill skiing), in that it is significantly and directly impacted by internal management decisions such as special animal attractions and new zoo exhibits. Recognising this, the current study attempted to identify confounding variables associated with these types of internal factors and either avoid selecting climate analogues during those years or at least acknowledge the presence of such factors and the potential influence that may have been exerted on the dependent variable (zoo visitation). The 17 years of data available for this study enabled some flexibility in the selection of seasons to represent normal climatic conditions. At times, less normal seasons were chosen in order to avoid the presence of potentially confounding variables (most notably, the opening of the Dinosaurs Alive exhibit in May of 2007 and the arrival of the giant pandas in March of 2013). The current analysis was fortunate enough to be able to identify two years between 1999 and 2015 for each season to represent anomalously warm, wet, and dry conditions. However, due to the limited occurrence of such seasonal climatic anomalies, it was not always possible to avoid certain potentially confounding effects associated with either internal or external factors. For example, the anomalously wet spring of 2003 which was associated with significantly less zoo visitation that season, was also concurrent with the SARS outbreak in Toronto; therefore, the presence of this non-climatic confounding variable may have produced a false positive within the results. Although the average increases in total autumn season zoo visitation during the two anomalously warm autumn seasons of 2007 and 2015 were not found to be statistically significant, these seasonal climatic anomalies were both concurrent with potentially confounding non-climatic factors, Dinosaurs Alive in 2007 and the Pan AM Games in 2015. Nonetheless, a unique aspect of this study’s research design should have also helped to control for the effect any confounding variables may have had on the results and subsequent conclusions. Previous studies in tourism climatology using the temporal climate analogue approach have based their conclusions of the effects that one record warm season had on tourism supply and demand [
23,
24,
25]. Whereas, the current study uses an average of two seasonal climatic anomalies, through which the potentially confounding effects of any non-climatic variables that may have influenced participation in a given season are reduced.
When dealing with weather and attendance data that has been aggregated to the seasonal time scale, the finding that even extreme changes in the volume of total precipitation had no significant effect on total visitation (apart from during the spring), has important implications for the role of temporal scale for the research design of studies in tourism climatology. For example, when studies analysed daily weather and attendance data, total precipitation was found to be a highly significant predictor variable [
9,
12,
27]. These modelling approach studies therefore reported results which were in line with the contentions of de Freitas [
42,
43,
44,
45,
46], emphasising the over-riding effect that the physical component of tourism climate has on visitor satisfaction and behaviour. However, when working with aggregated data, such as monthly, seasonal, or annual averages, the statistical relationship between temperature and participation becomes more emphasised; while other important climatic variables no longer appear significant. This has led some to conclude that temperature is the single most important variable in relation to tourist satisfaction and behaviour [
47,
48,
49,
50,
51]. However, the importance of temporal scale in research design and the implications for the influence certain climatic predictor variables may have on tourism demand when analysed at a finer temporal scale should not be overlooked. In this regard, future research examining the impact of extreme weather events on daily zoo visitation remains an important area of future research.
Similar to modeling approaches, a limitation of an analogue methodology is the inability to predict future influencing conditions, including technological advances, changing behavioural responses, changing demographics and increasing energy prices for transportation and operations [
24]. In addition, analogues are not available to assess the impacts of the upper ranges of projected climate change, since few analogue situations have occurred that are representative of long-range modeled climate futures under high greenhouse gas emissions and subsequent radiative forcing (for example, warming that exceeds 4 °C). Furthermore, even the analogue approach cannot fully capture the adaptive capacity of tourists, especially in relation to human acclimatization to thermal stress [
32]. As climate change increases the frequency and occurrence of extreme events (
i.e., seasonal climatic anomalies), tourists will gain experience with these kinds of seasons and will likely change their behaviour concerning the timing and activities associated with their recreation and leisure pursuits [
25]. Nonetheless, a continuation of strategic research is needed to reevaluate past assessments and fill important knowledge gaps in the field of tourism climatology as well as climate change impacts for tourism, in order to provide accurate and reliable information for governments and businesses involved with and reliant upon the tourism, recreation, and leisure sector.
A number of strategic management recommendations can be formulated from this study. For example, zoo visitors responded positively when temperatures were warmer than usual during the winter and spring seasons. Therefore, zoo managers could capitalize on this visitor tendency by increasing promotional efforts during anomalously warm winters and springs, but should also plan for increased attendance in relation to staffing and activities. As these temperature conditions become more common under projected climate change, this opportunity will present itself more frequently; however, the effect may be diminished as visitors become acclimatized [
25,
32]. Reassessments will be required as time goes on to explore these changes in the physical environment as well as the dynamic relationship between zoo visitation and weather/climate. Finally, zoo visitors responded negatively when temperatures were warmer than usual during the summer season. In this regard, zoo managers should be proactive with efforts to mitigate both the perception and effect of thermal stress on zoo visitors. Providing adaptive measures to help visitors reduce thermal stress such as cool misting stations and cold water fountains are some potential strategies. Furthermore, increasing the promotion of the zoo’s water park and splash pad as well as other promotions, such as discounted frozen treats or free bottled water, may also be useful strategies to reduce the negative effect of anomalously warm temperatures during the summer season, conditions that are expected to become more common under projected climate change.


