
A Methodology to Reduce the Computational Effort in the Evaluation of the Lightning Performance of Distribution Networks


 ,
, 
Abstract
:1. Introduction
2. Procedure for the Evaluation of the Lightning Performance of Distribution Networks
- Random generation of a large number of lightning events N. Each event Sn (with n = 1,…,N) is characterized by the point of impact and the channel-base current peak I0,n. According to [7,8], the current is assumed to follow a log-normal Probability Density Function (PDF), while, for the point of impact coordinates, a uniform PDF is considered within a striking area that contains the power system of interest and all possible lightning events that can cause critical flashovers [3,4].
- Application of an attachment model (e.g., the electrogeometric model (EGM) [1]) that determines whether the selected event is a direct or indirect stroke. The direct lightning events can be simulated with the injection of a current source represented using Heidler’s function [9] in parallel with a suitable resistance accounting for the lightning channel. Otherwise, in case of an indirect strike, one has to resort to the equations describing the field-to-line coupling problem.
- For each event Sn, with n = 1,…,N, the obtained overvoltage is compared with the line CFO in order to define a Boolean variable:
- Computation of the probability of having a dangerous overvoltage as the following ratio:
3. A Methodology to Improve the Procedure Performances
3.1. Reduction of the Number of Monte Carlo Runs
- Set a number K > 2 of Monte Carlo simulations, carried out in parallel, in which the independent model variables are maintained the same.
- Set .
- Build up a set of K random events SN,j, for any j = 1,…,K.
- Determine the probability pN,j according to Equation (2).
- Calculate the means for each j = 1,…, K:
- Calculate the means of the means:
- Calculate values of the MSPE of the mean (MSPEMEAN):
- Compute the confidence interval for the probability, , to a significance level 1−α aswhereand is the Student’s t- distribution with K−1 degrees of freedom.
- Define the Boolean quantity:where are two suitable threshold parameters and(note that BN = 1 if at least one of the two conditions is verified, otherwise it is equal to 0).
- If BN = 0, increase N of a unit, i.e., N = N + 1 and repeat all steps starting from Step 3, otherwise stop the Monte–Carlo procedure.
3.2. Reduction of the Number of Calls to the Field-to-Line Coupling Code
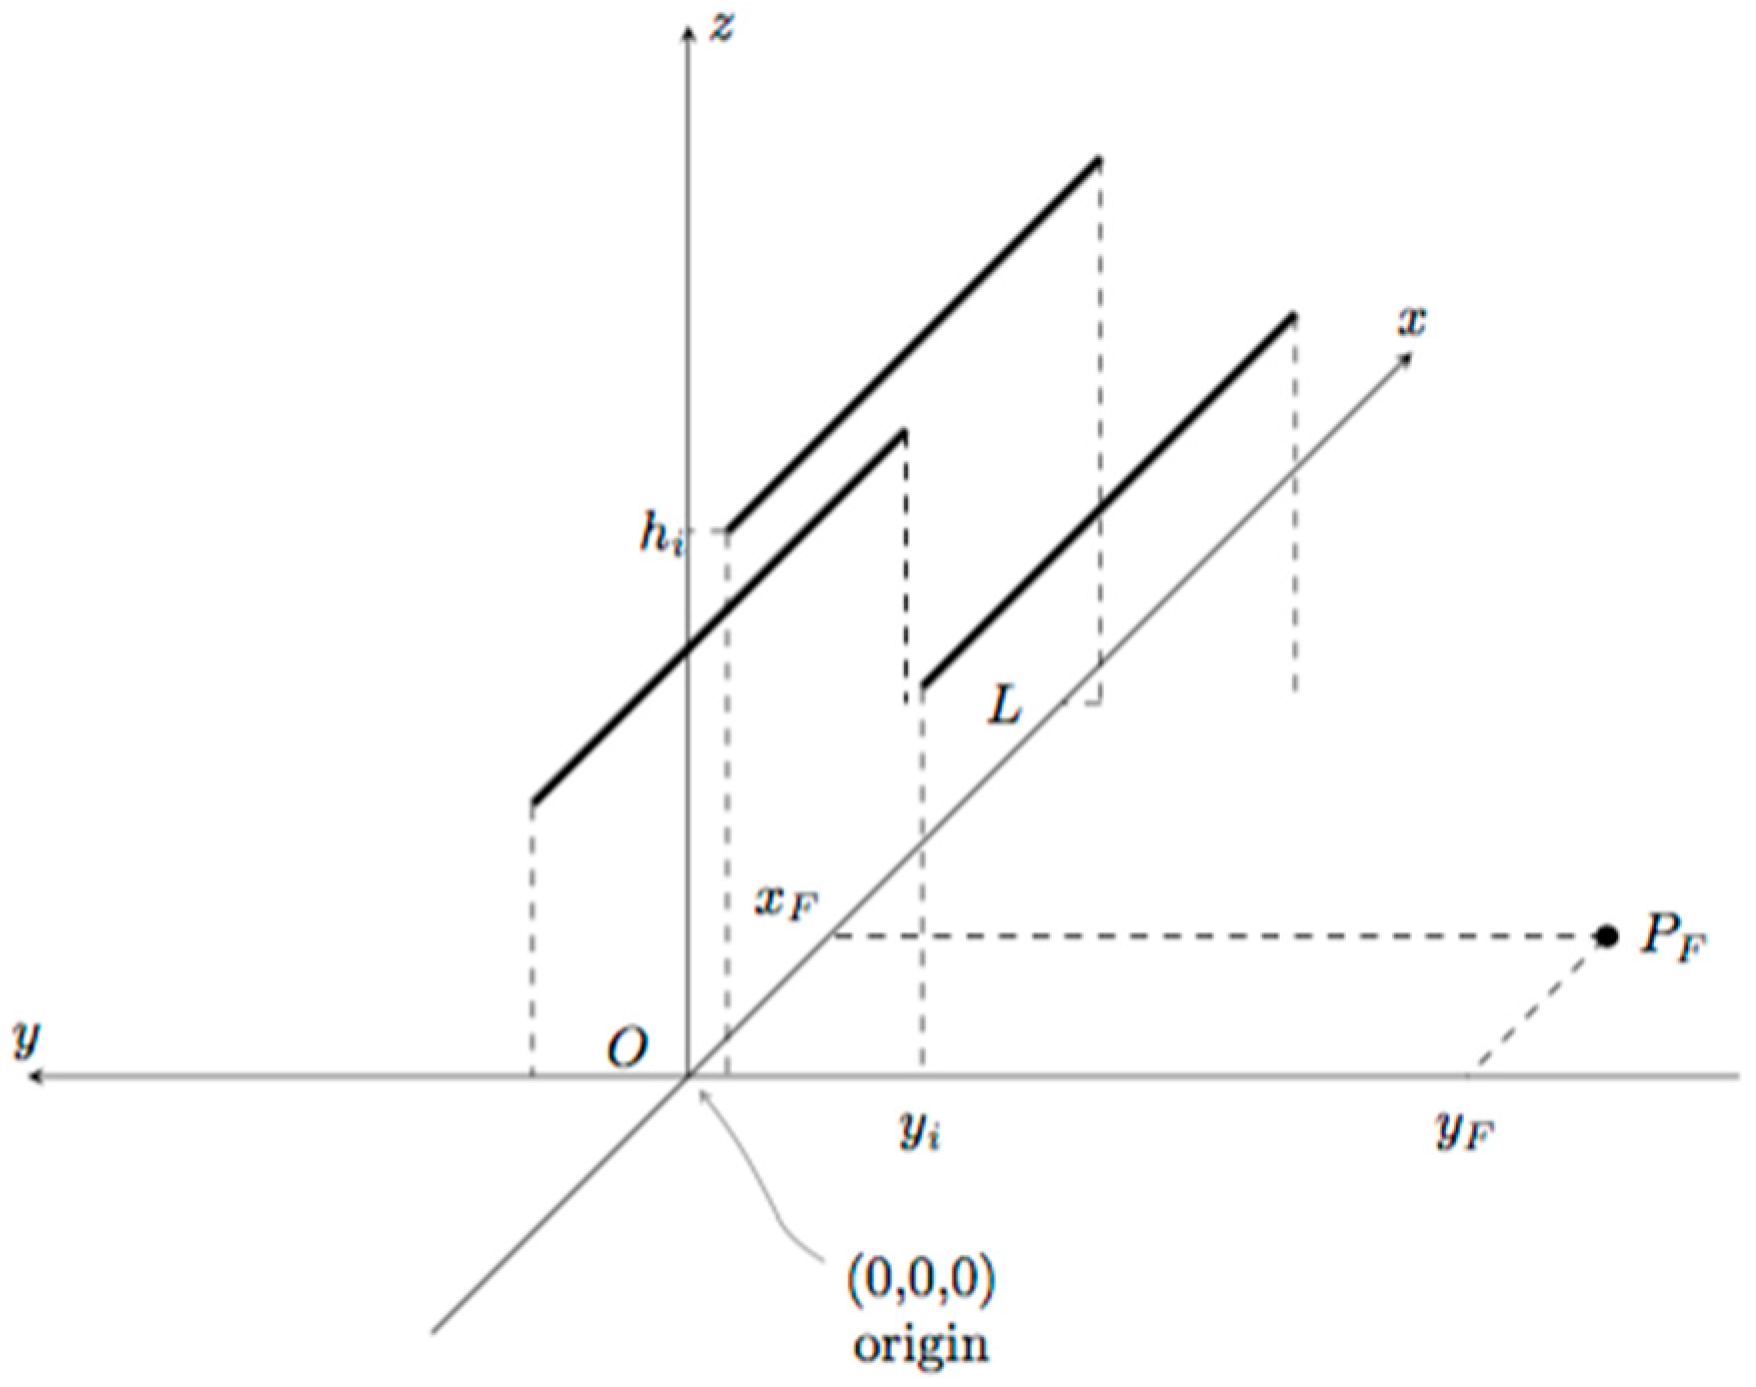
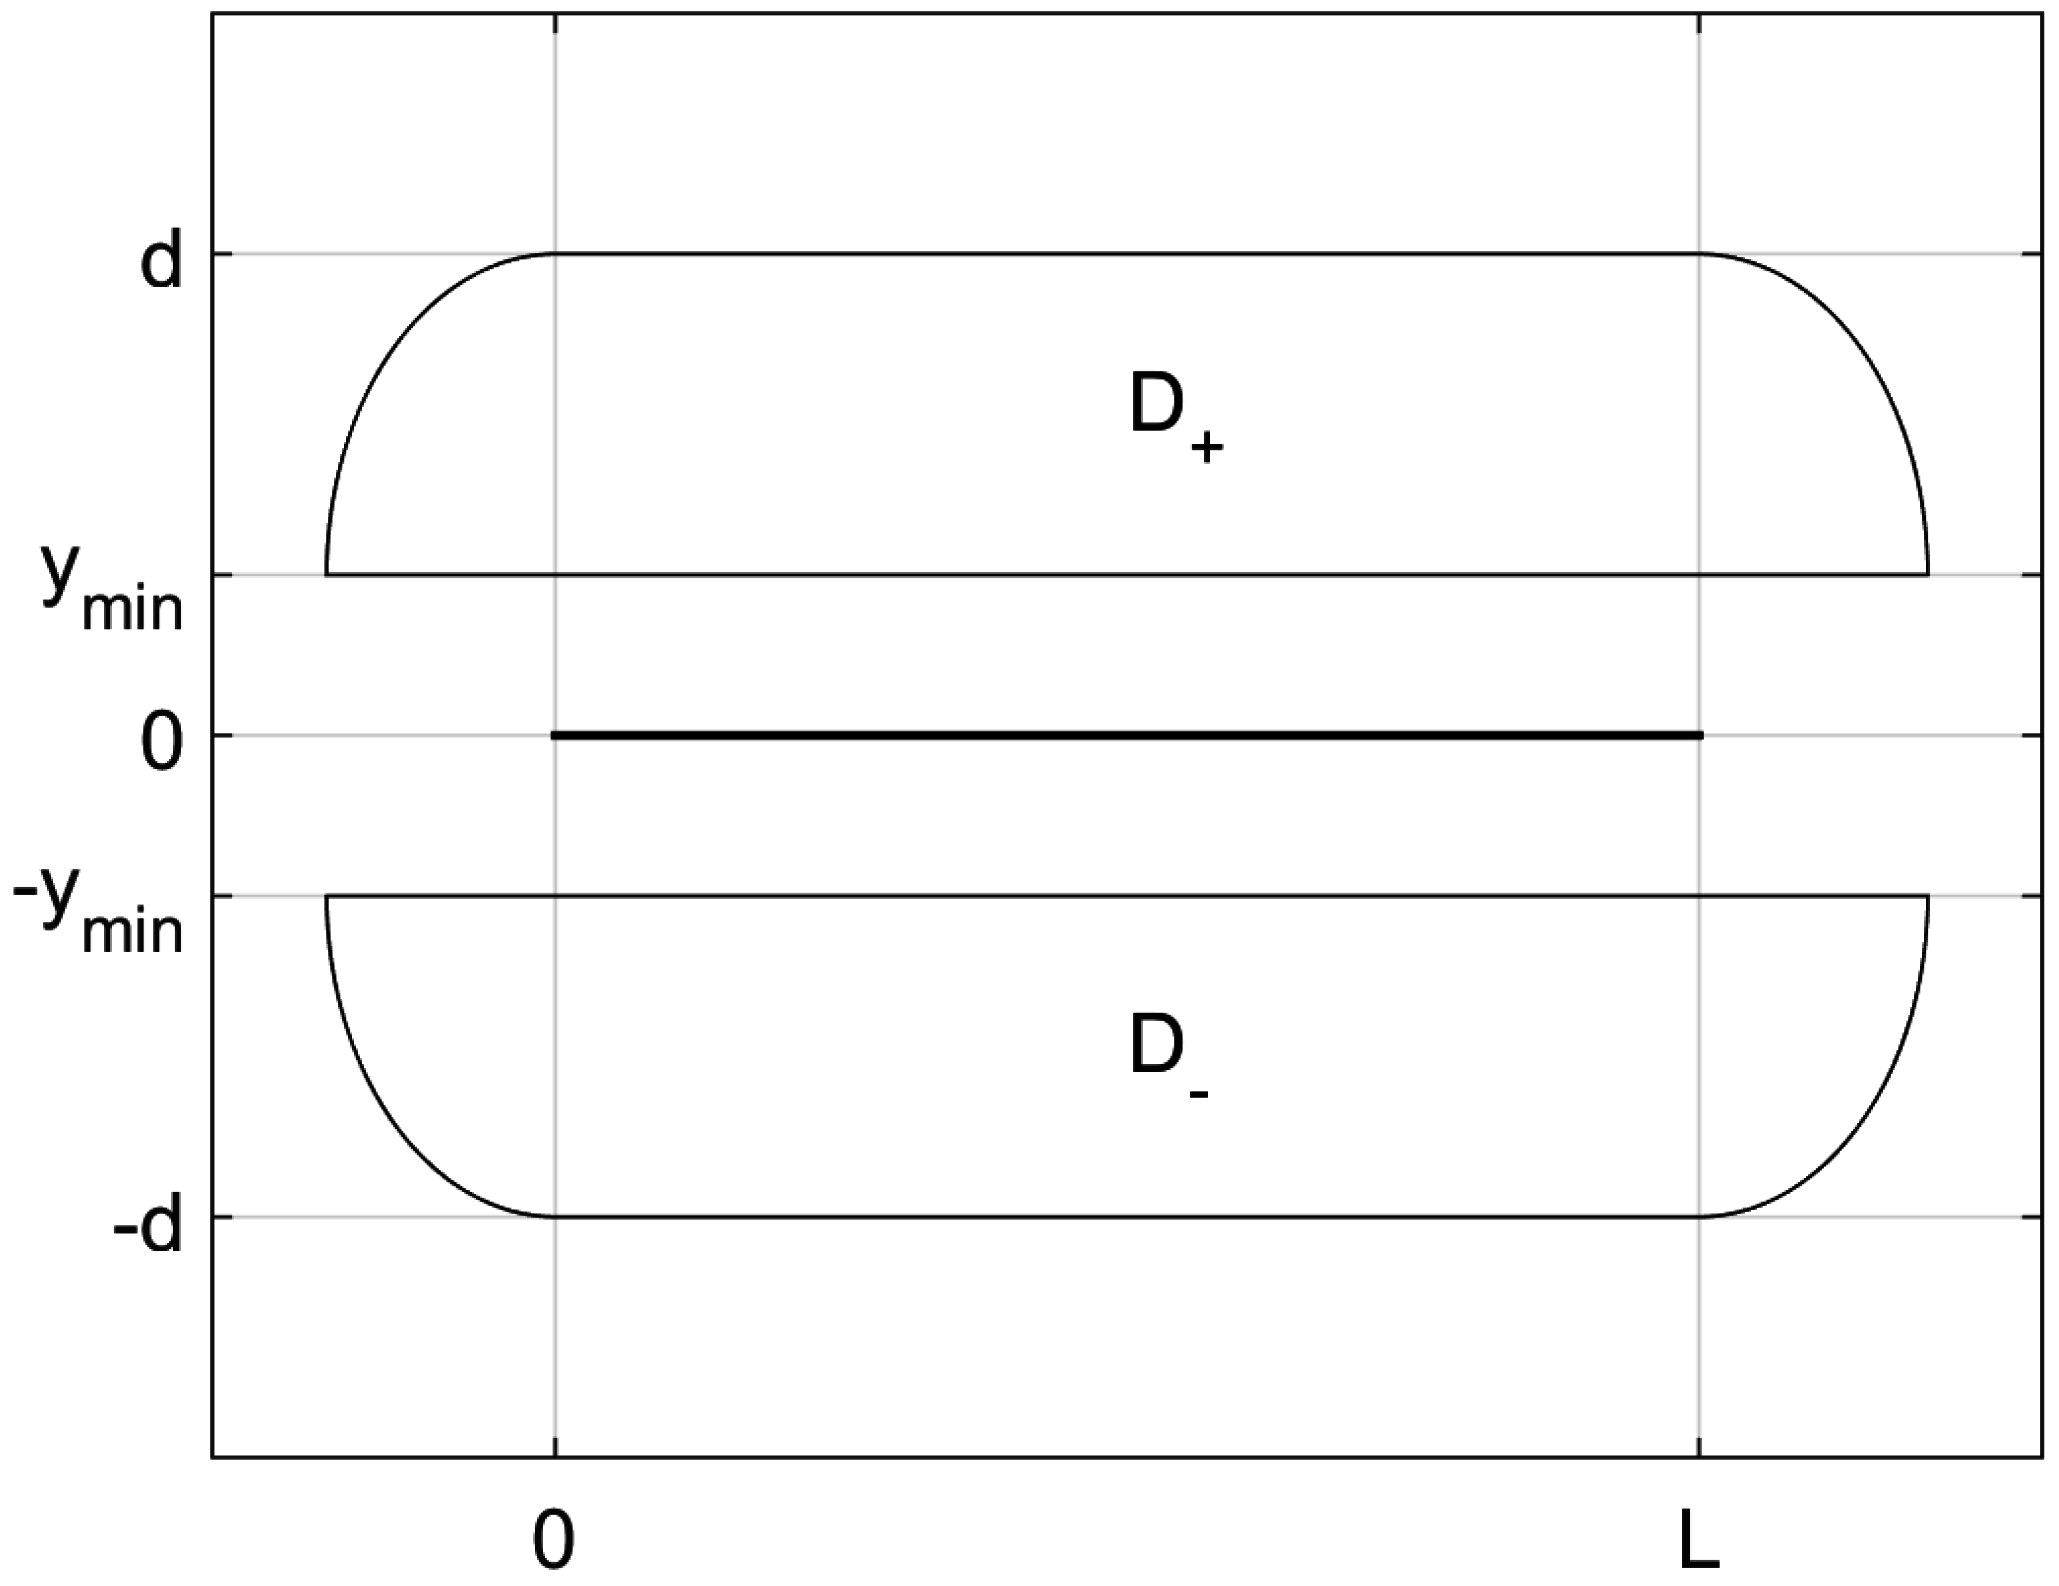
- ymin can be chosen as the value under which, for any peak current, the power system will always experience a direct strike. Recalling the electrogeometric criterion described in [1], one can express the lateral distance as a function of the peak current. As can be expected, such function is monotonically increasing; thus, the value corresponding to the minimum current can be selected as ymin. In the following, ymin will be set as 15.00 m, which corresponds to about 2 kA (that has a probability smaller than 0.016% according to the current lognormal probability density function presented in Equation (1) in [1] by using the parameters of Table 1 in [1]);
- ymax can be chosen as the horizontal distance at which, no matter the peak current, the resulting overvoltage will always be smaller than the CFO. According to the Rusk–Darveniza formula [12], one can set
4. Numerical Results
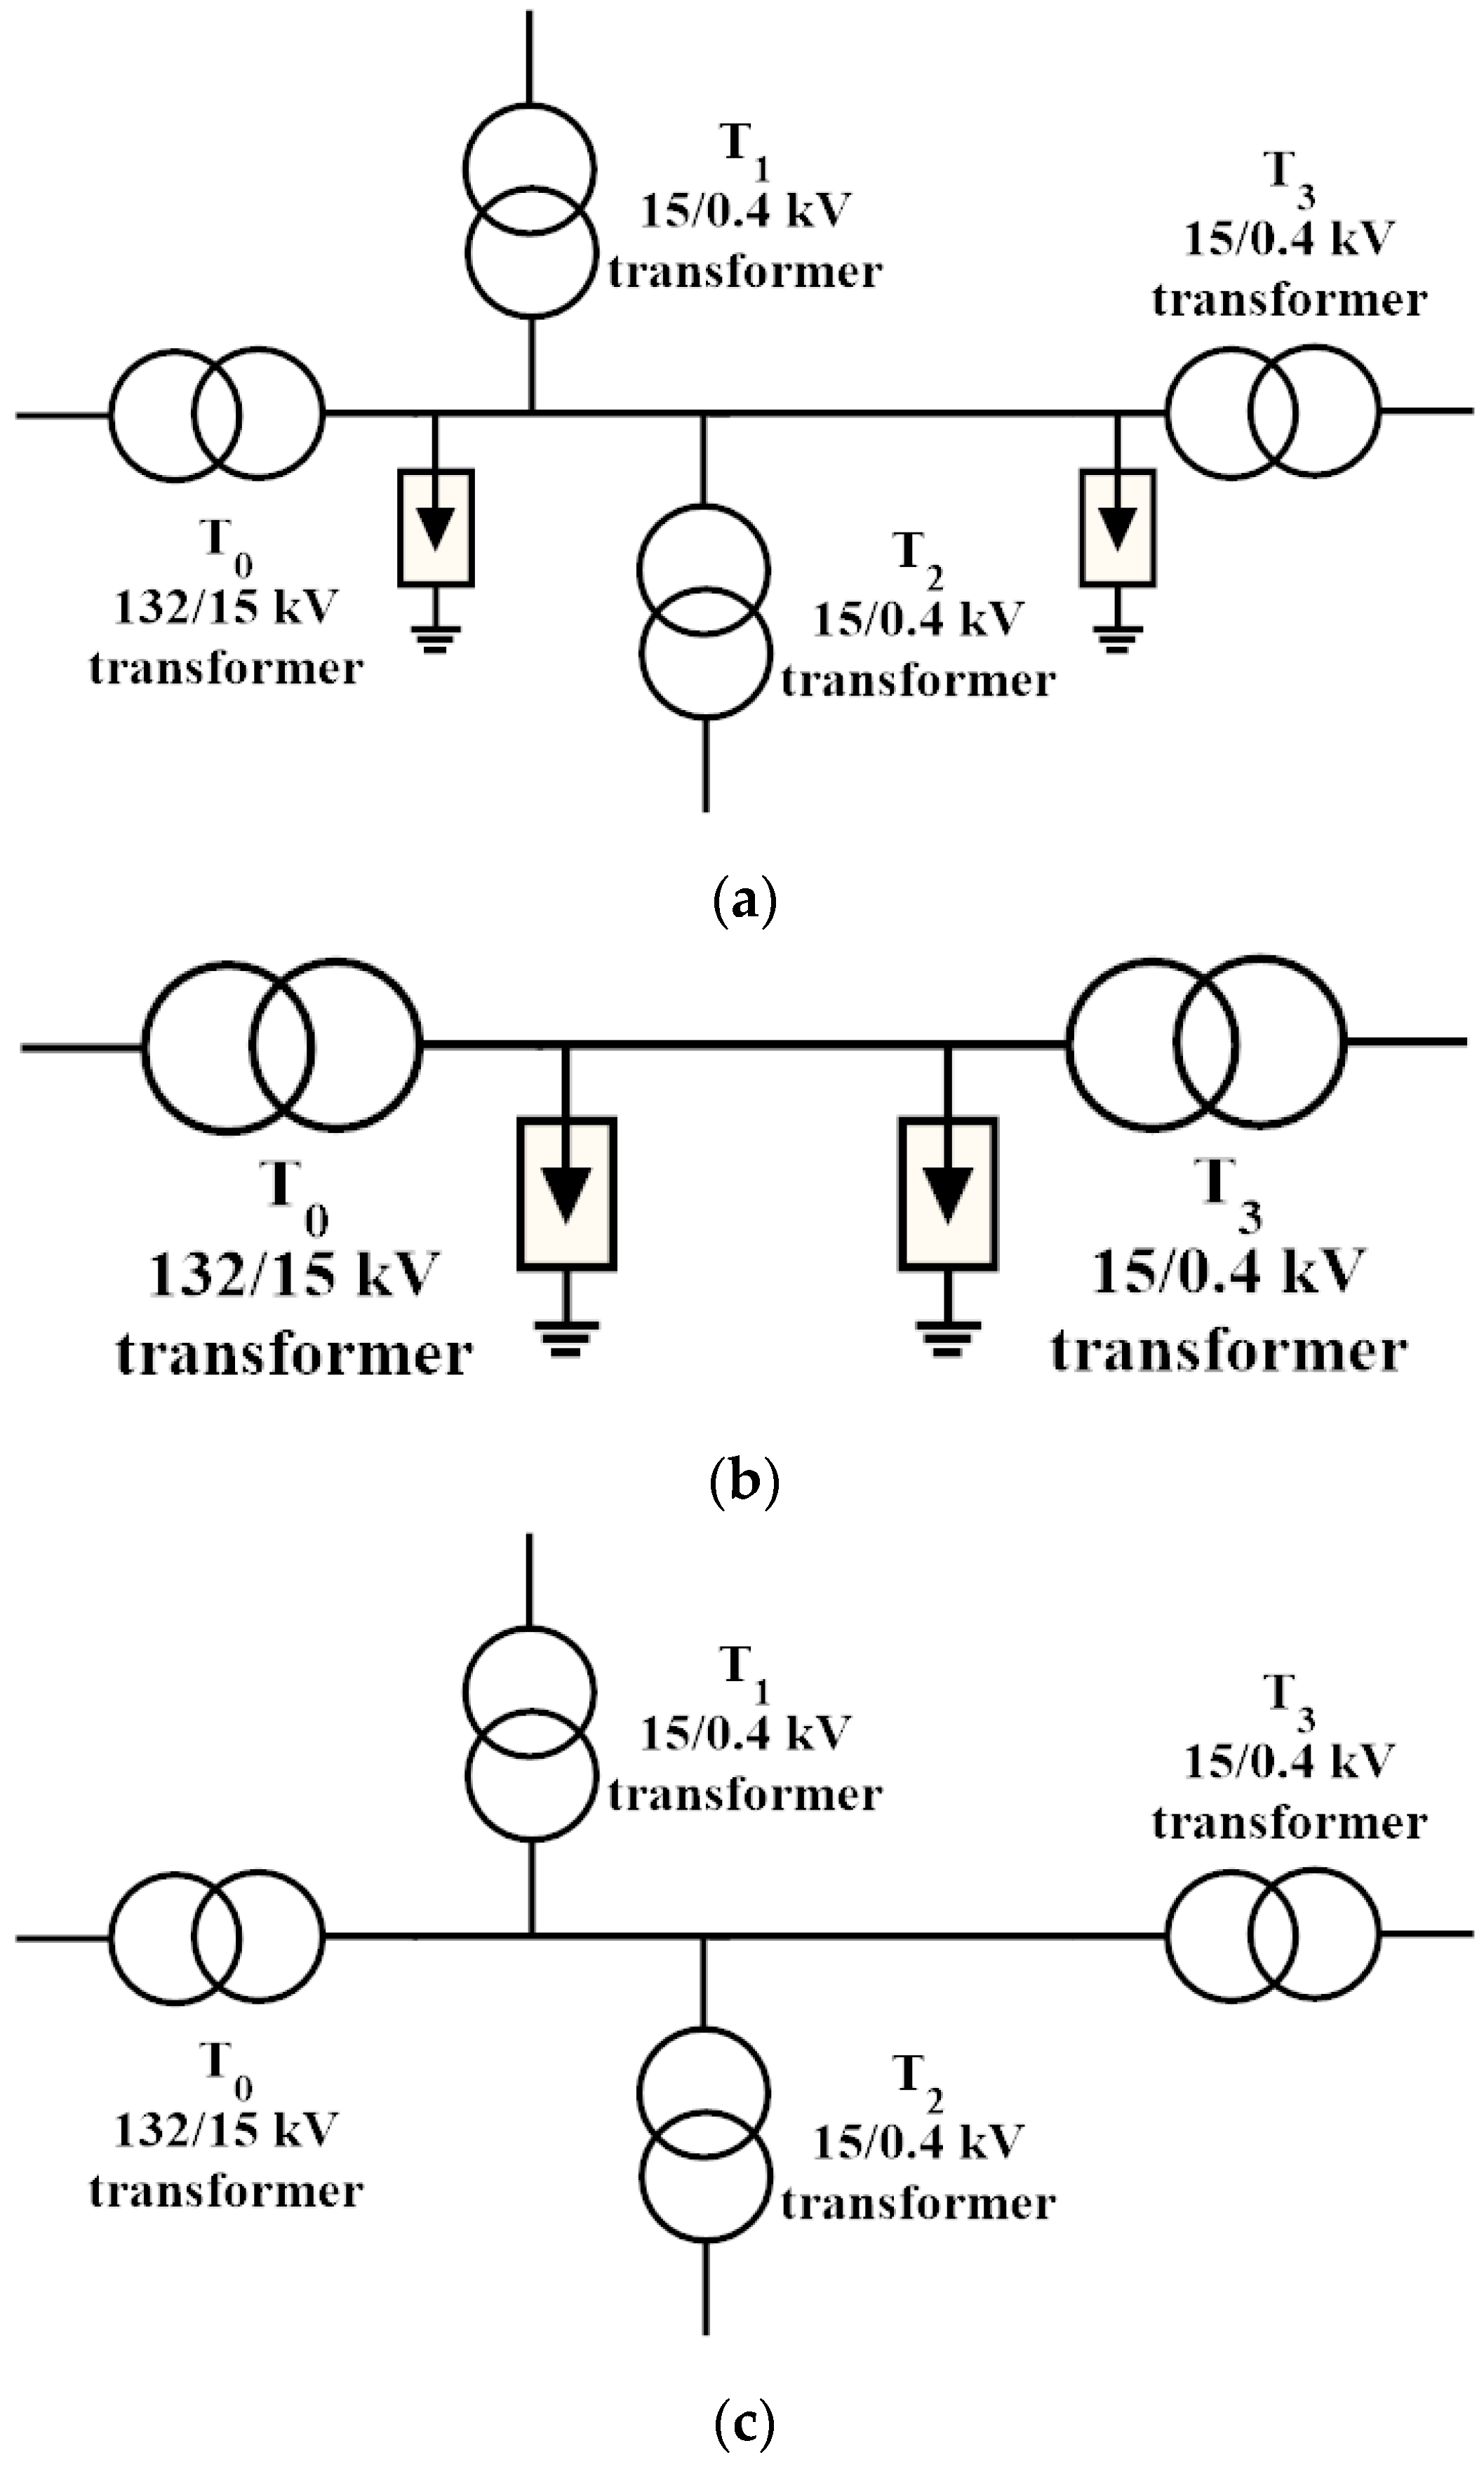
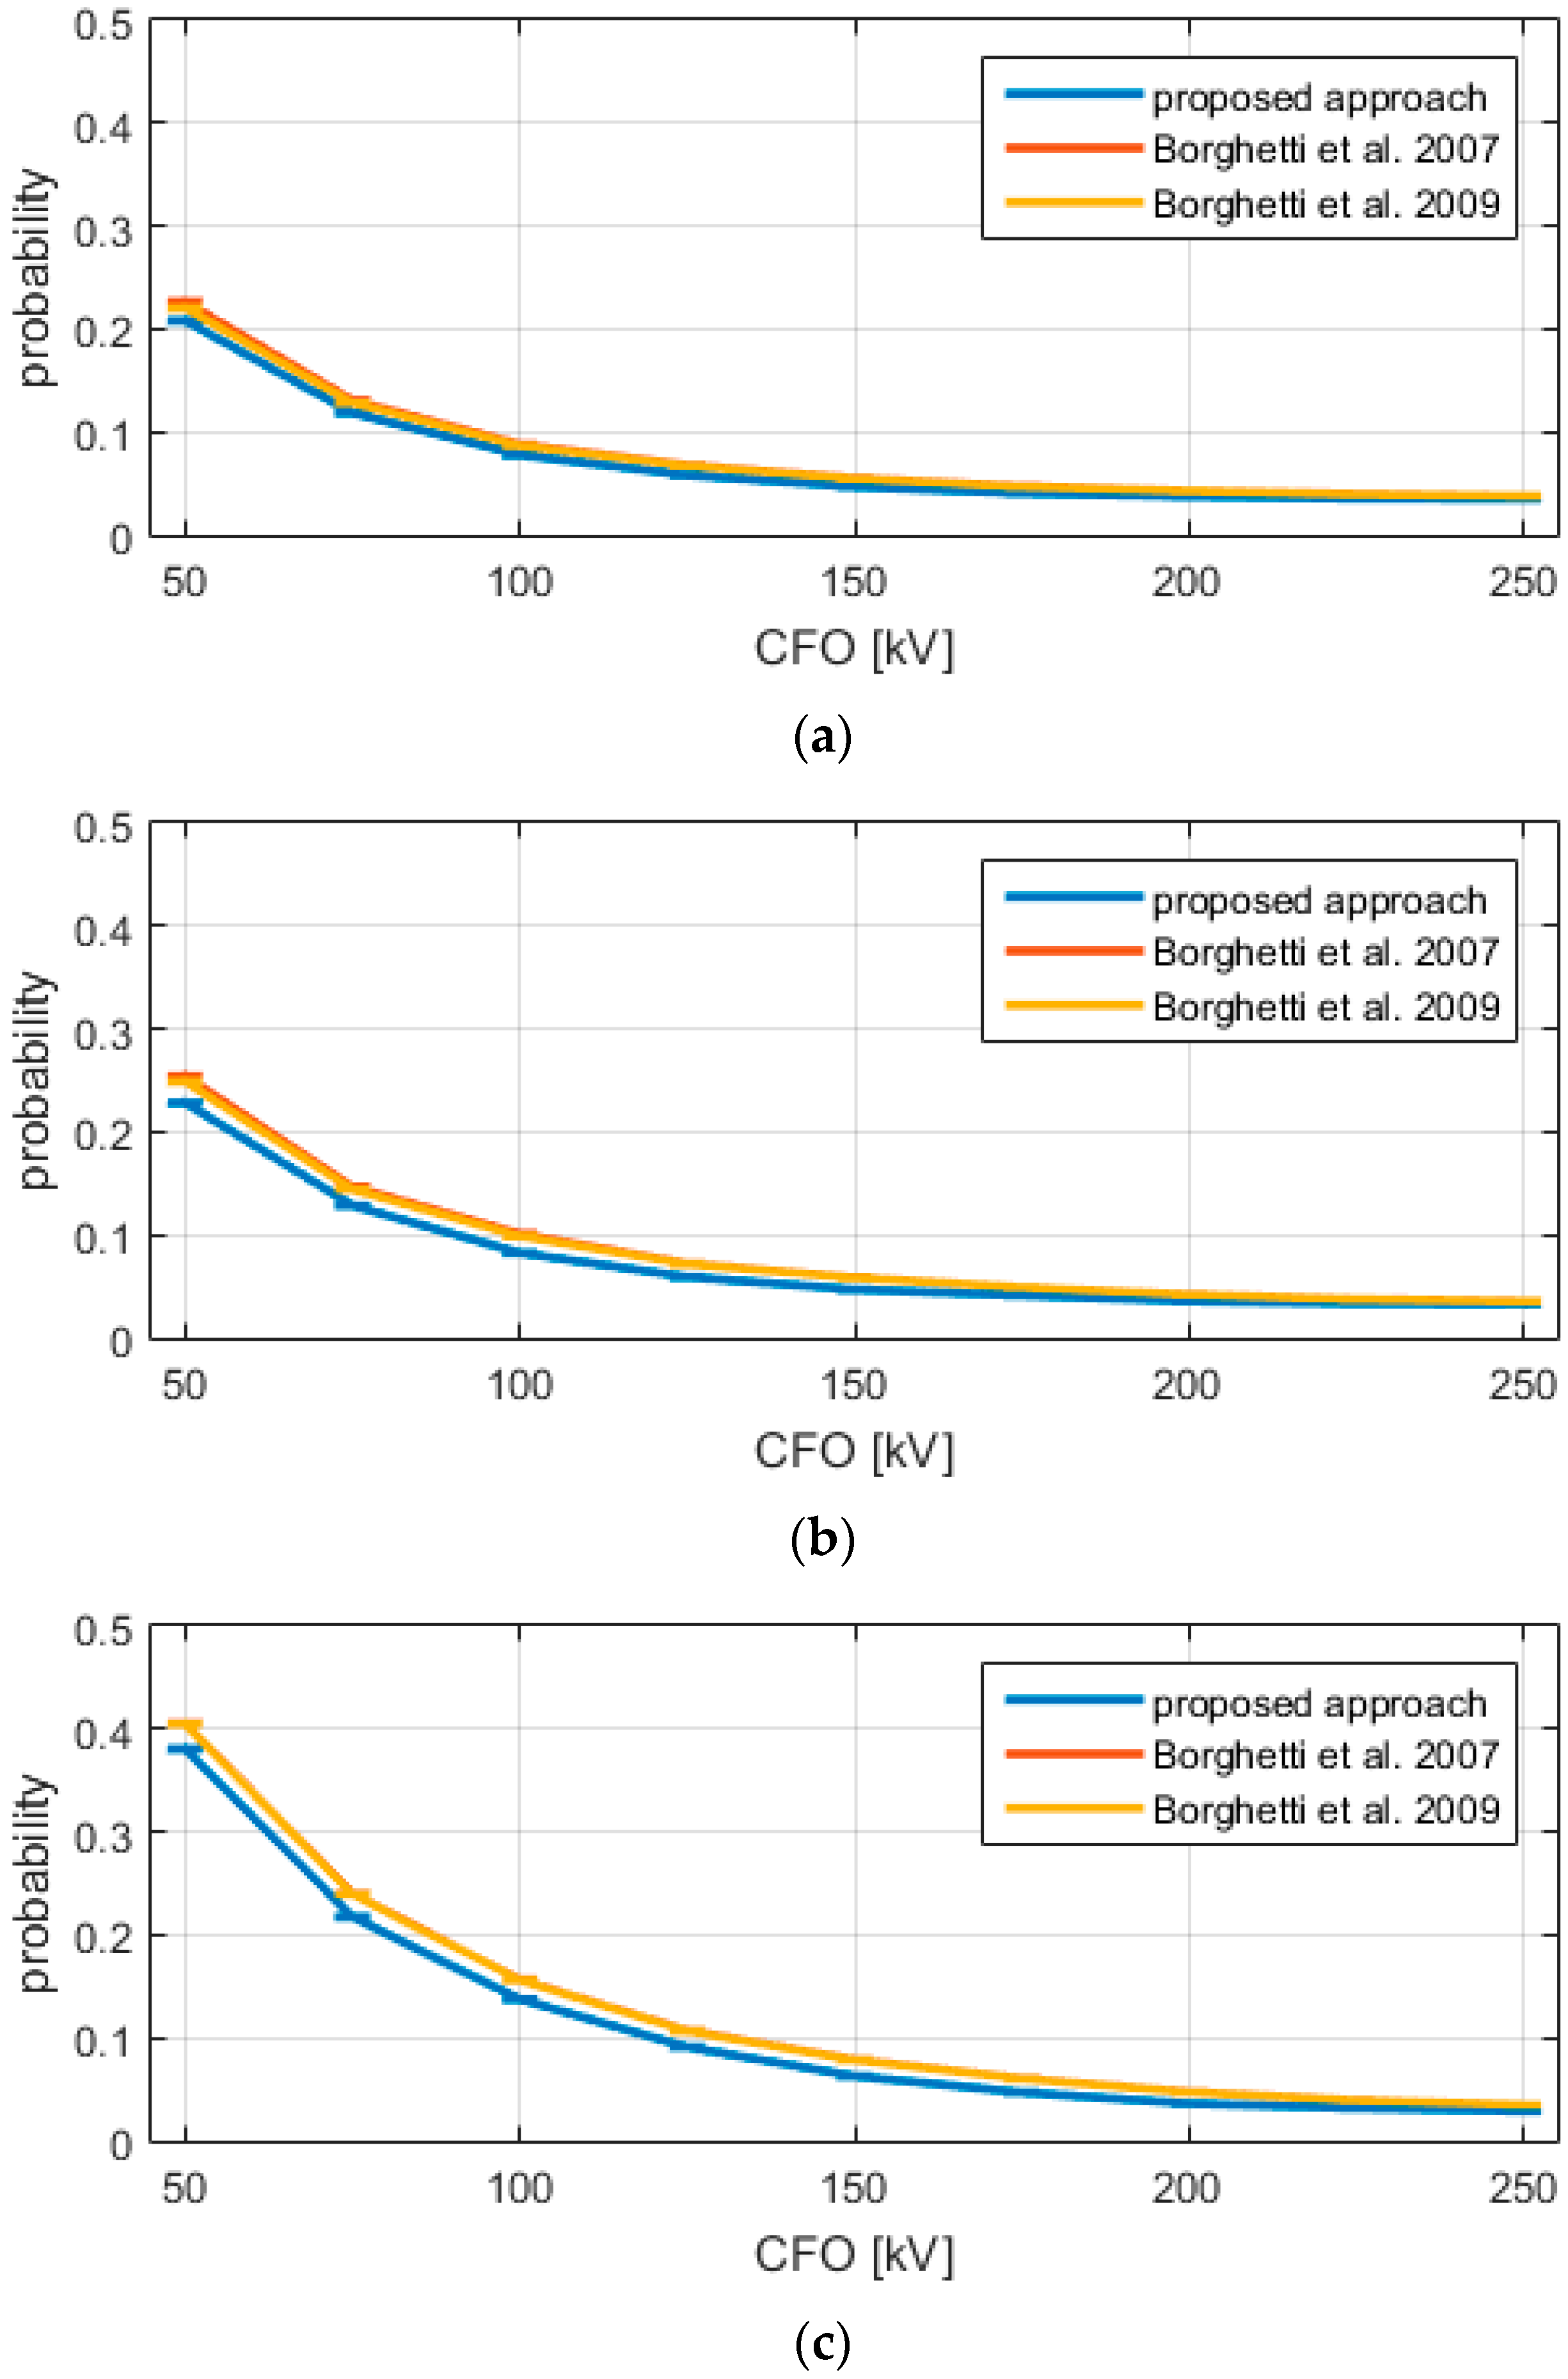
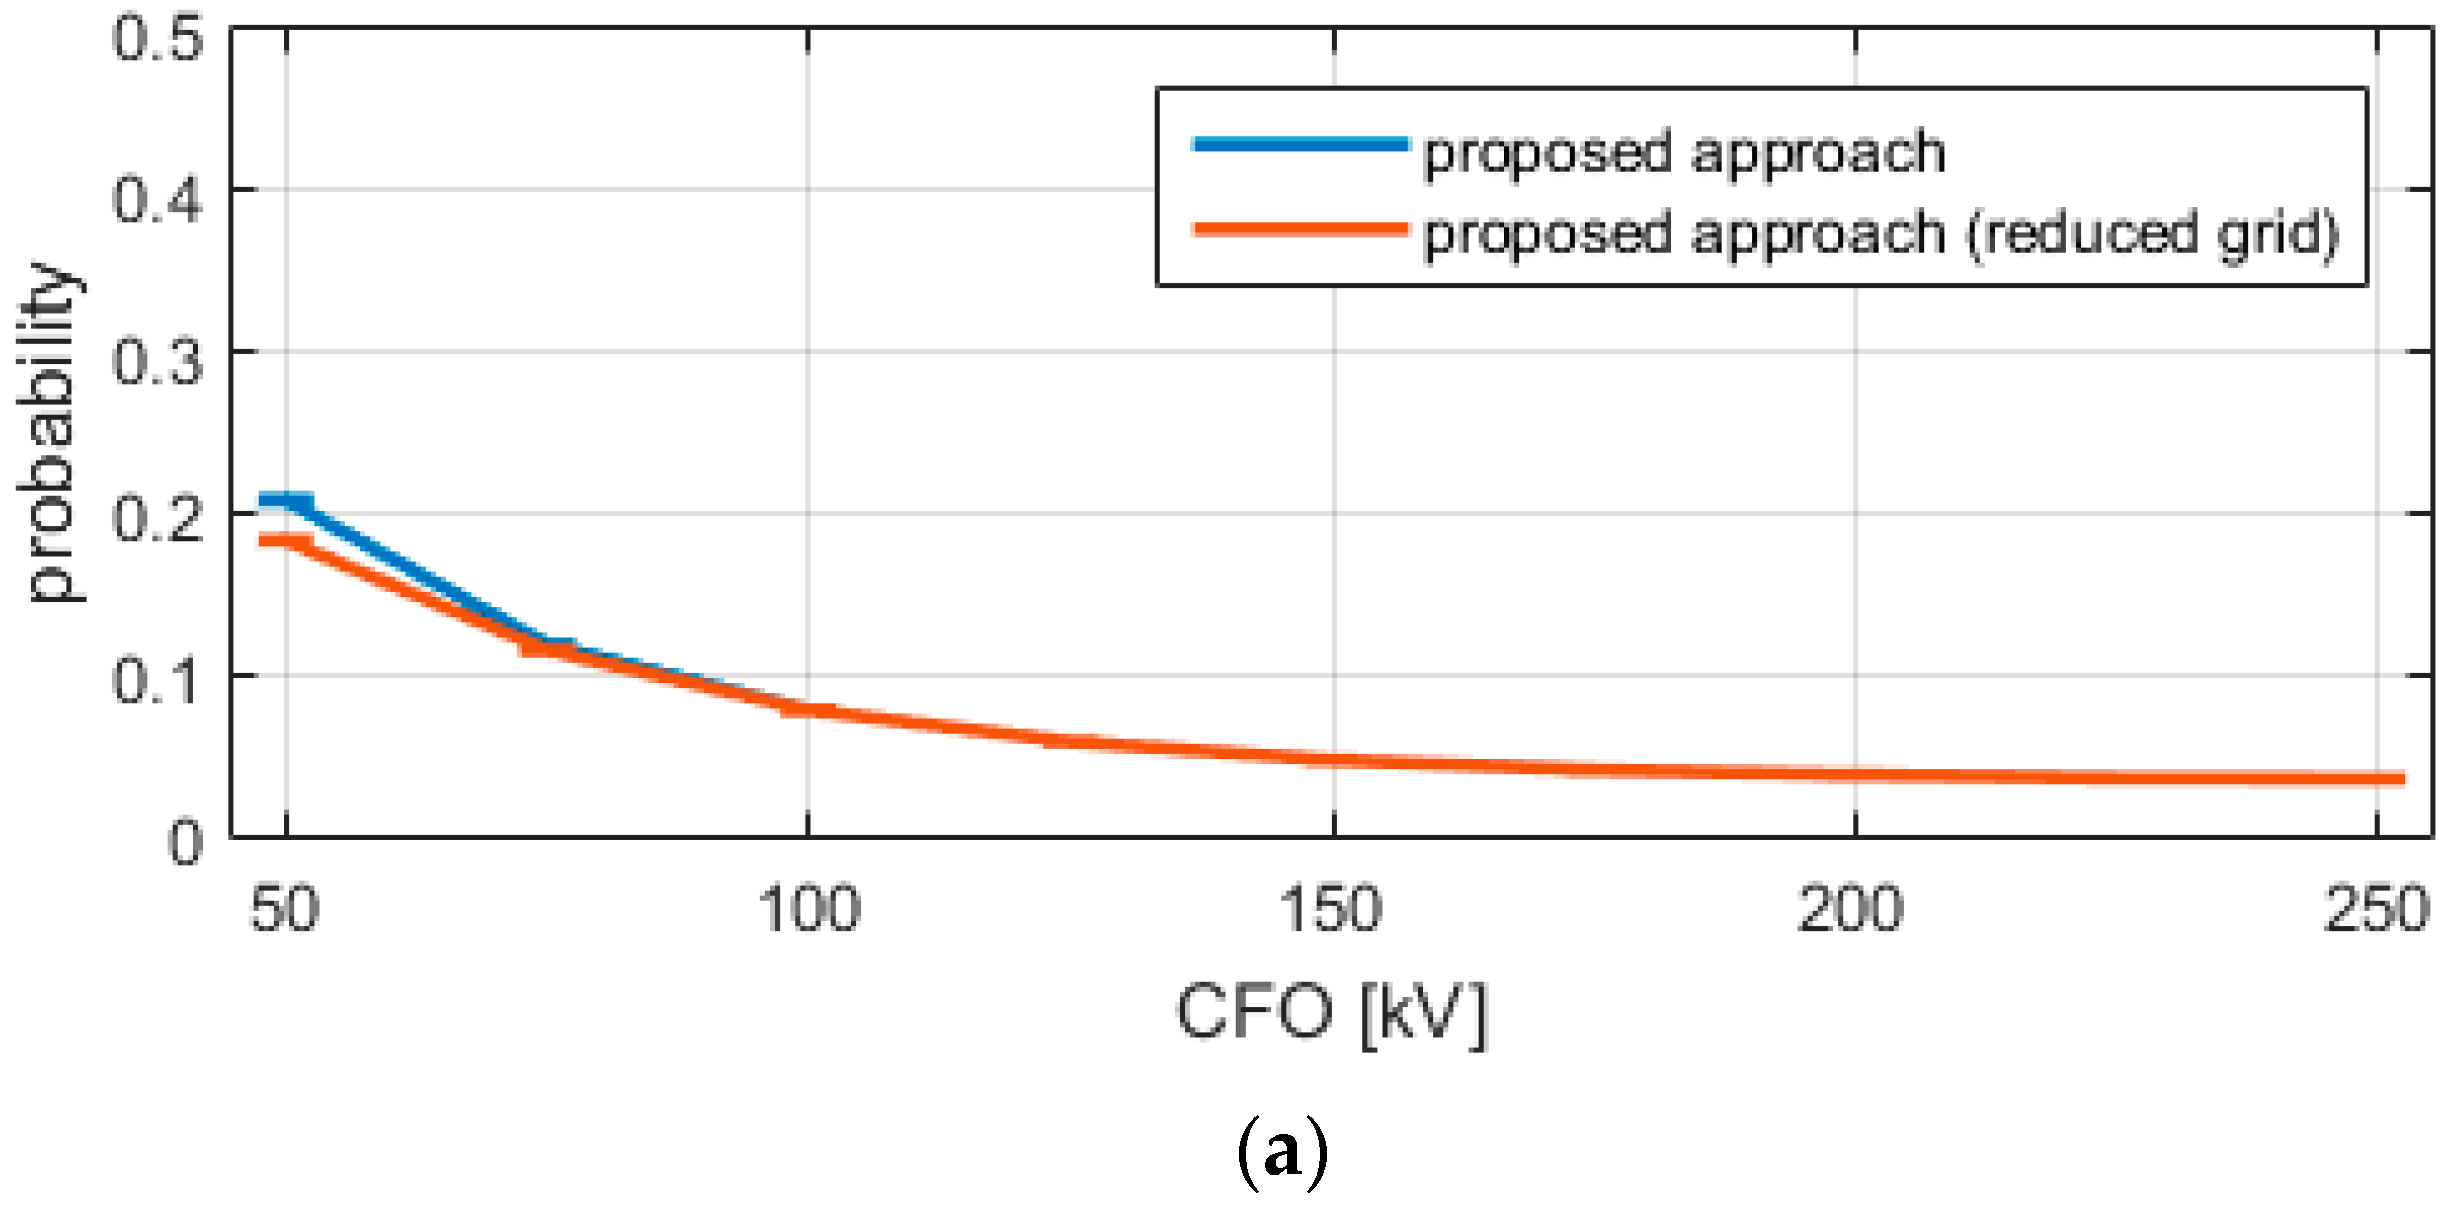
- in Test1 (see Figure 2a), the network is fed by a 132 kV voltage source and contains an HV/MV transformer, a MV/LV transformer (both protected by surge arresters), and two laterals respectively at 250 m and 750 m from the HV/MV transformer and consisting of two MV/LV identical transformers with two 300-m-long LV cables.
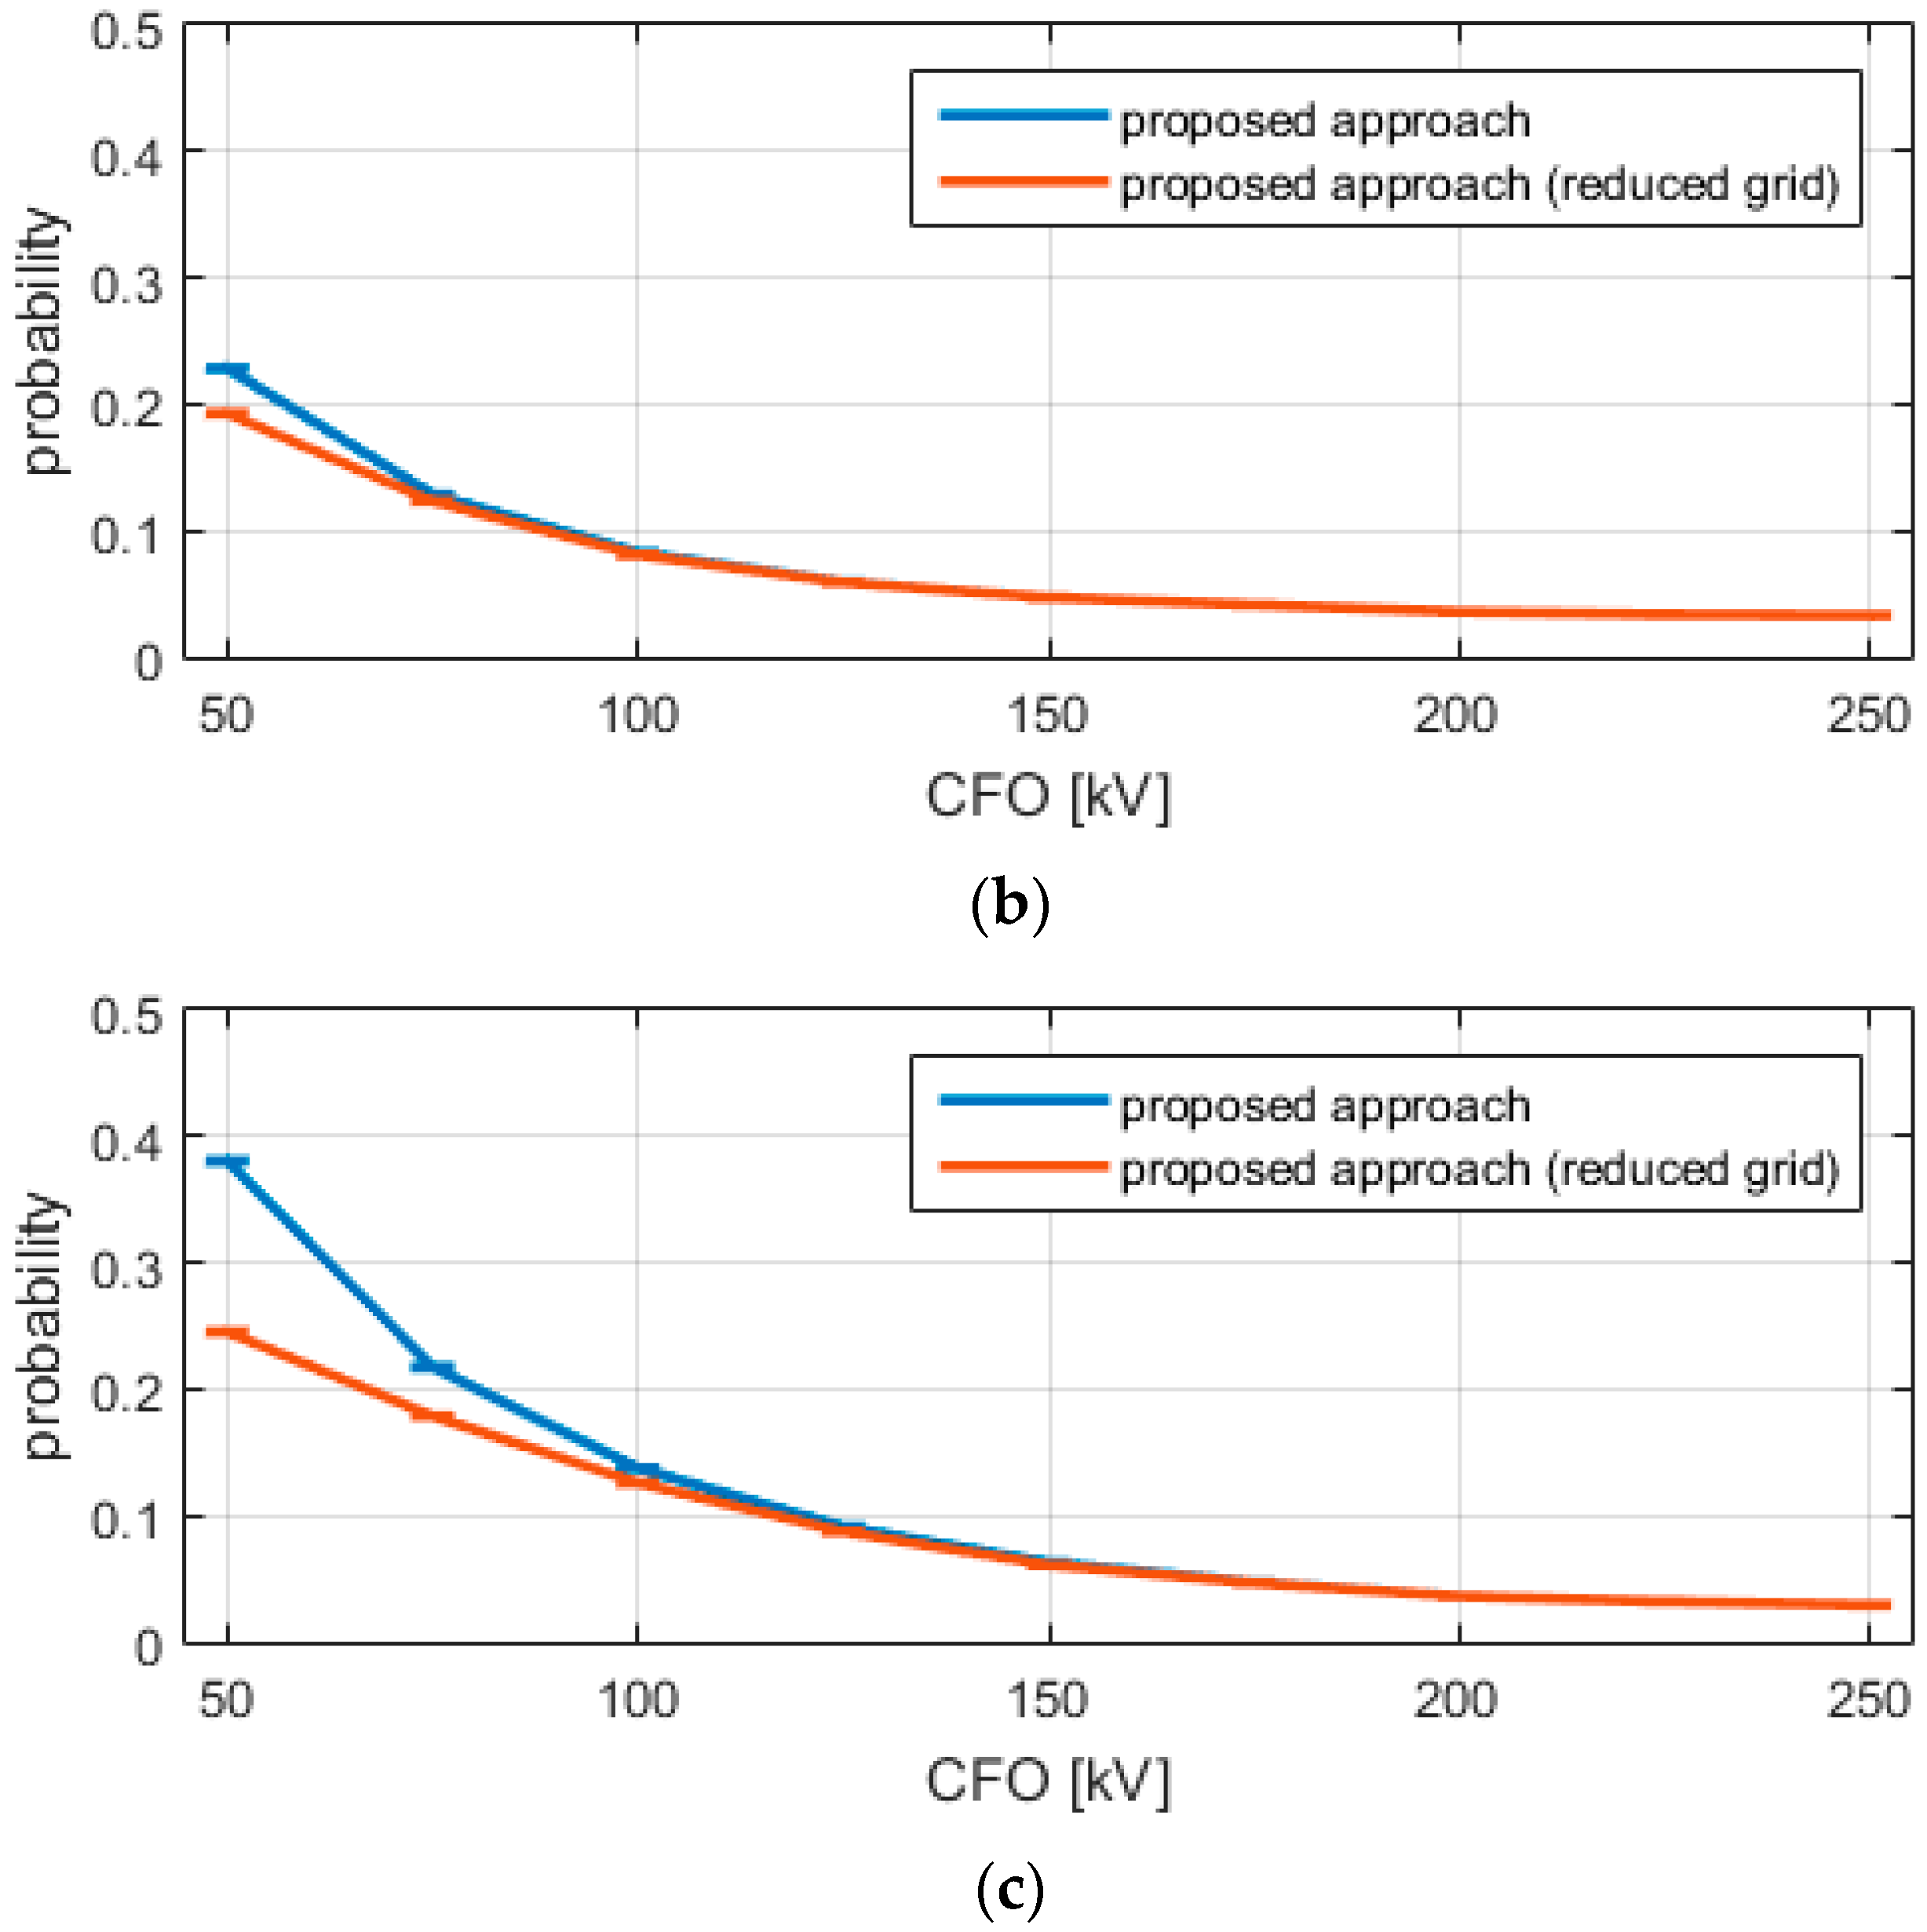
- in Test2 (see Figure 2b), the same network of Test1 is considered, but without laterals.
- in Test3 (see Figure 2c), the same network of Test1 is considered, but without the surge arresters.
- the number of parallel runs K is 5 (according to [10]);
- two significance levels, 90% and 95% (corresponding to and , respectively), are analyzed;
- the threshold constant values are and , which means that the mean probability value, for a selected CFO, will belong, at level , to the confidence interval with an amplitude smaller than 0.015 or, in any case, smaller than 15% of the computed mean probability .
- the mean value of the probability
- the boundaries of the confidence strip and
- the absolute and relative errors and (in bold the leading stop condition)
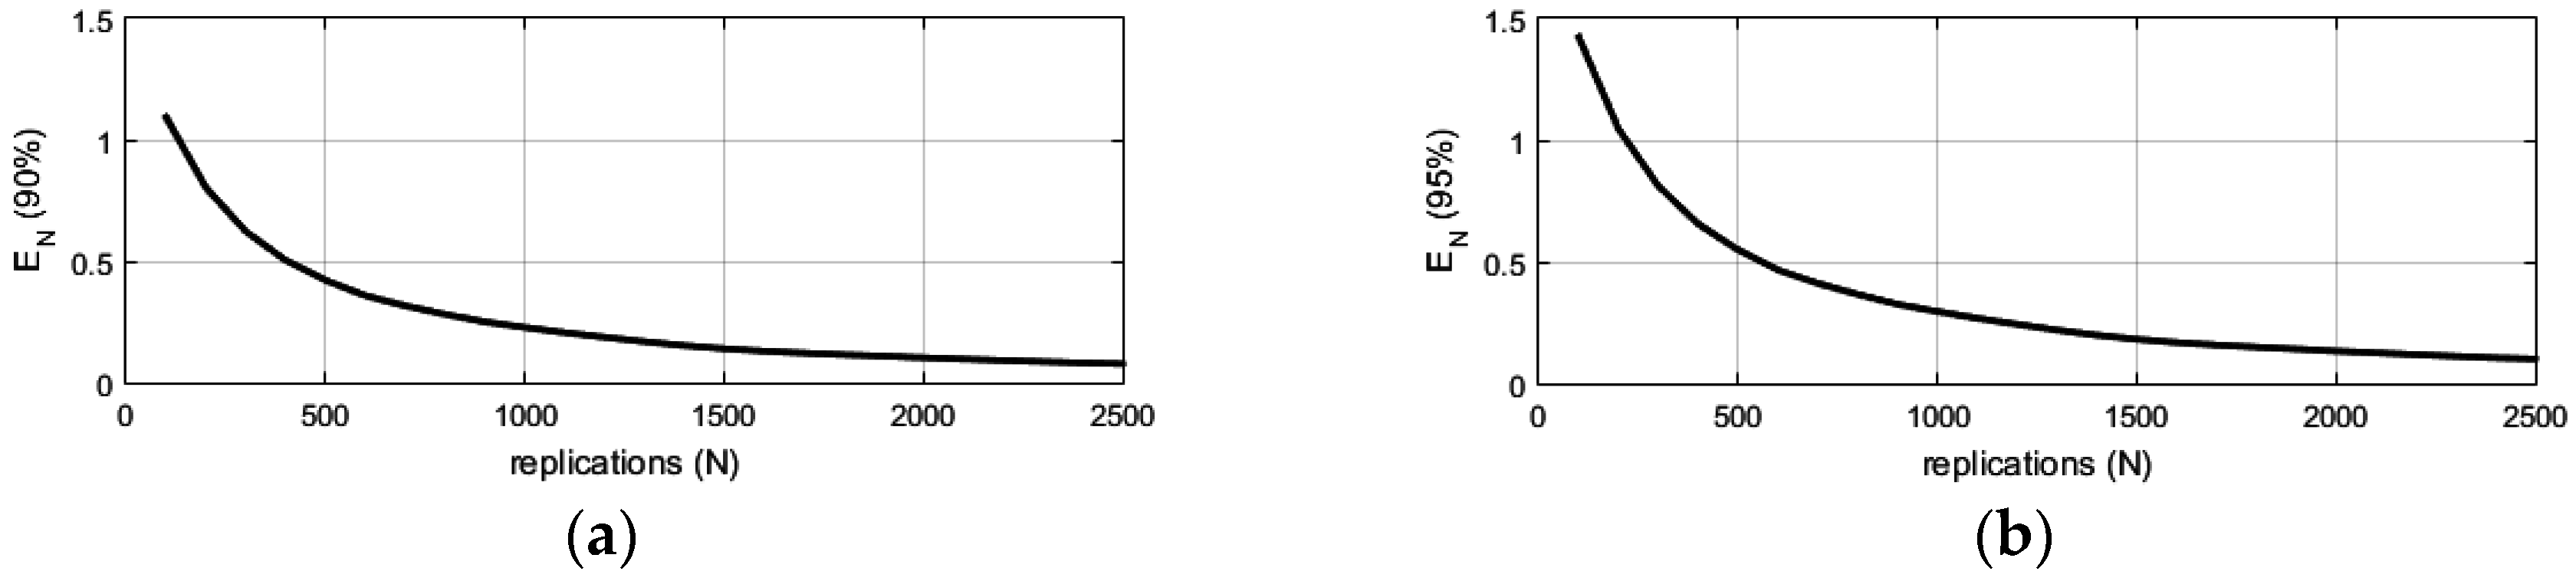
- the evolution of as a function of the number of runs for and (Panels a and b);
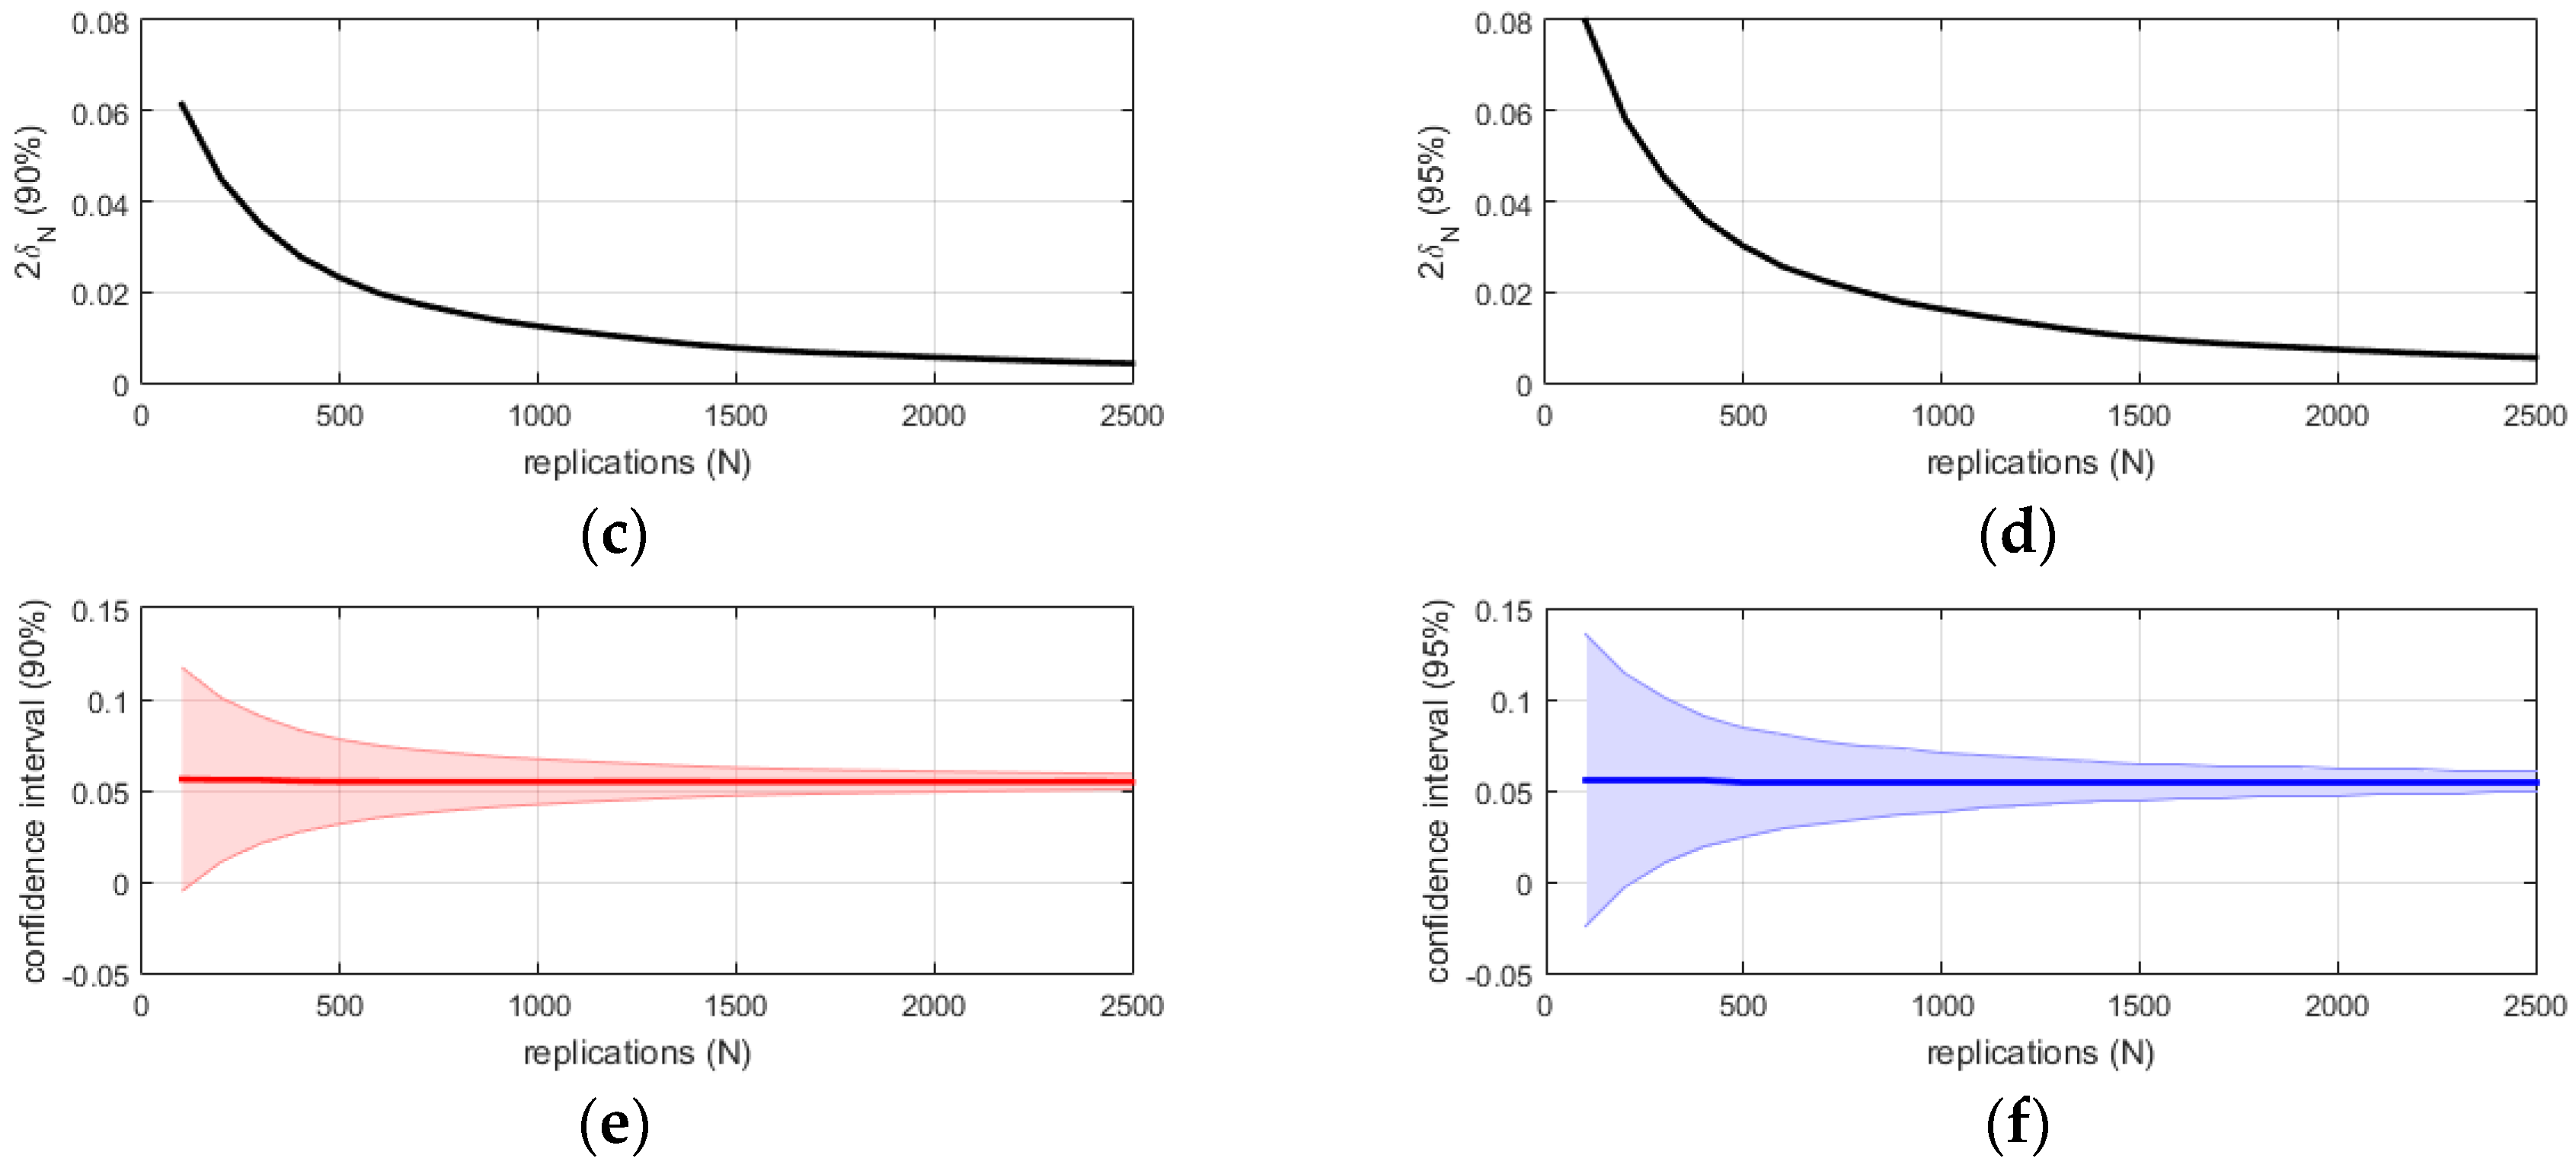
- the evolution of as a function of the number of runs for and (Panels c and d) with an indication of the number of runs selected to construct Table 2;
- the evolution of the confidence strip and the mean probability as a function of the number of runs for and (Panels e and f).
5. Conclusions
Conflicts of Interest
References
- Nucci, C.A. A Survey on Cigré and IEEE Procedures for the Estimation of the Lightning Performance of Overhead Transmission and Distribution Lines; X International Symposium on Lightning Protection: Curitiba, Brazil, 2009; pp. 151–165. [Google Scholar]
- Guide for Improving the Lightning Performance of Electric Power overhead Distribution Lines; IEEE Std. 1410; IEEE Working Group: Piscataway, NJ, USA, 2004.
- Borghetti, A.; Nucci, C.A.; Paolone, M. An improved procedure for the assessment of overhead line indirect lightning performance and its comparison with the IEEE Std. 1410 method. IEEE Trans. Power Del. 2007, 22, 684–692. [Google Scholar] [CrossRef]
- Borghetti, A.; Nucci, C.A.; Paolone, M. Indirect-lightning performance of overhead distribution networks with complex topology. IEEE Trans. Power Del. 2009, 24, 2206–2213. [Google Scholar] [CrossRef]
- Nucci, C.A.; Rachidi, F. Interaction of electromagnetic fields with electrical networks generated by lightning. In The Lightning Flash: Physical and Engineering Aspects; Series Power and Energy. 34; IEE Press: London, UK, 2003. [Google Scholar]
- Guide for Improving the Lightning Performance of Electric Power overhead Distribution Lines; IEEE Std. 1410; IEEE Working Group: Piscataway, NJ, USA, 2011.
- Berger, K.; Anderson, R.B.; Kröninger, H. Parameters of lightning flashes. Electra 1975, 41, 23–37. [Google Scholar]
- Guide to Procedures for Estimating the Lightning Performance of Transmission Lines. Available online: http://c4.cigre.org/WG-Area/WG-C4.23-Guide-to-Procedures-for-Estimating-the-Lightning-Performance-of-Transmission-Lines (accessed on 20 November 2016).
- Heidler, F. Analytische blitzstromfunktion zur EMP berechnung. In Proceedings of the 18th International Conference Lightning Protection, Munich, Germany, 16–20 September 1985.
- Brignone, M.; Delfino, F.; Procopio, R.; Rossi, M.; Bendato, I.; Mosca, R.; Rachidi, F. Evaluation of the lightning performance of an overhead multiconductor transmission line system. In Proceedings of the International Colloquium on Lightening and Power Systems, Bologna, Italy, 27–30 June 2016.
- Montgomery, D.C. Design and Analysis of Experiments; John Wiley and Sons: New York, NY, USA, 1997. [Google Scholar]
- Darveniza, M. A practical extension of Rusk’s formula for maximum lightning induced voltages that accounts for ground resistivity. IEEE Trans. Power Del. 2007, 22, 605–612. [Google Scholar] [CrossRef]
- Brignone, M.; Delfino, F.; Procopio, R.; Rossi, M.; Rachidi, F. Evaluation of power system lightning performance, part I: Model and numerical solution using the PSCAD-EMTDC platform. IEEE Trans. Electromagnet. Compat. 2016, 59, 137–145. [Google Scholar] [CrossRef]
- Imece, A.F.; Durbak, D.W.; Elahi, H.; Kolluri, S.; Lux, A.; Mader, D.; McDemott, T.E.; Morched, A.; Mousa, A.M.; Natarajan, R.; et al. Modeling guidelines for fast front transients. IEEE Trans. Power Del. 1996, 11, 493–506. [Google Scholar]
- ABB Application Guidelines. Overvoltage Protection: Metal Oxide Surge Arresters Medium Voltage Systems. Available online: https://www.google.com.hk/url?sa=t&rct=j&q=&esrc=s&source=web&cd=1&cad=rja&uact=8&ved=0ahUKEwiZu8aik7bQAhXBv7wKHdWOD30QFggZMAA&url=https%3A%2F%2Flibrary.e.abb.com%2Fpublic%2F70e9fd6933c8c644c12578d200333cb5%2F952_abb_awr_mittelspannung_E_low.pdf&usg=AFQjCNEjfPL5DqsZHpROZyADDhcnQe_VuA&sig2=NX-6SnVuYA_MEwDHUdPHcw (accessed on 20 November 2016).
- Borghetti, A.; Morched, A.S.; Napolitano, F.; Nucci, C.A.; Paolone, M. Lightning induced overvoltages transferred through distribution power transformers. IEEE Trans. Power Del. 2009, 24, 360–372. [Google Scholar] [CrossRef]
- Brignone, M.; Delfino, F.; Procopio, R.; Rossi, M.; Rachidi, F. Evaluation of power system lightning performance, part II: Application to an overhead distribution network. IEEE Trans. Electromagnet. Compat. 2016, 59, 146–153. [Google Scholar] [CrossRef]


| Cond. 1 | Cond. 2 | Cond. 3 | |
|---|---|---|---|
| height from ground | 8.0 m | 8.0 m | 8.6 m |
| distance from y axis | −1.2 m | 1.2 m | 0.0 m |
| conductor diameter | 0.64 cm | 0.64 cm | 0.64 cm |
| CFO (kV) | N | ||||||
|---|---|---|---|---|---|---|---|
| 50 | 1500 | 0.233 | 0.216 | 0.250 | 0.034 | 0.145 | |
| 100 | 1100 | 0.087 | 0.080 | 0.094 | 0.014 | 0.158 | |
| 150 | 1100 | 0.055 | 0.047 | 0.062 | 0.014 | 0.268 | |
| 200 | 900 | 0.042 | 0.035 | 0.050 | 0.014 | 0.344 | |
| 250 | 400 | 0.034 | 0.027 | 0.041 | 0.014 | 0.423 | |
| 50 | 1100 | 0.235 | 0.217 | 0.252 | 0.034 | 0.146 | |
| 100 | 800 | 0.088 | 0.081 | 0.095 | 0.014 | 0.158 | |
| 150 | 900 | 0.055 | 0.048 | 0.062 | 0.014 | 0.250 | |
| 200 | 700 | 0.043 | 0.036 | 0.050 | 0.014 | 0.320 | |
| 250 | 400 | 0.034 | 0.029 | 0.040 | 0.011 | 0.325 |
| CFO (kV) | N | ||||||
|---|---|---|---|---|---|---|---|
| 50 | 1400 | 0.270 | 0.250 | 0.291 | 0.040 | 0.149 | |
| 100 | 700 | 0.099 | 0.092 | 0.107 | 0.014 | 0.145 | |
| 150 | 2600 | 0.056 | 0.049 | 0.064 | 0.014 | 0.264 | |
| 200 | 1500 | 0.040 | 0.032 | 0.047 | 0.014 | 0.371 | |
| 250 | 1400 | 0.035 | 0.027 | 0.042 | 0.014 | 0.422 | |
| 50 | 1100 | 0.235 | 0.217 | 0.252 | 0.034 | 0.146 | |
| 100 | 1000 | 0.275 | 0.255 | 0.294 | 0.039 | 0.142 | |
| 150 | 400 | 0.098 | 0.091 | 0.105 | 0.014 | 0.148 | |
| 200 | 1200 | 0.056 | 0.049 | 0.064 | 0.014 | 0.265 | |
| 250 | 800 | 0.040 | 0.033 | 0.047 | 0.014 | 0.362 |
| CFO (kV) | N | ||||||
|---|---|---|---|---|---|---|---|
| 50 | 1000 | 0.430 | 0.399 | 0.461 | 0.062 | 0.145 | |
| 100 | 1700 | 0.174 | 0.162 | 0.187 | 0.026 | 0.147 | |
| 150 | 2900 | 0.087 | 0.079 | 0.094 | 0.014 | 0.172 | |
| 200 | 3900 | 0.053 | 0.045 | 0.060 | 0.014 | 0.283 | |
| 250 | 2800 | 0.039 | 0.032 | 0.047 | 0.014 | 0.380 | |
| 50 | 700 | 0.436 | 0.406 | 0.466 | 0.060 | 0.138 | |
| 100 | 1000 | 0.177 | 0.164 | 0.190 | 0.026 | 0.147 | |
| 150 | 1100 | 0.089 | 0.082 | 0.096 | 0.014 | 0.163 | |
| 200 | 2000 | 0.052 | 0.045 | 0.060 | 0.014 | 0.286 | |
| 250 | 1300 | 0.040 | 0.033 | 0.048 | 0.014 | 0.374 |
© 2016 by the authors; licensee MDPI, Basel, Switzerland. This article is an open access article distributed under the terms and conditions of the Creative Commons Attribution (CC-BY) license (http://creativecommons.org/licenses/by/4.0/).
Share and Cite
Bendato, I.; Brignone, M.; Delfino, F.; Procopio, R.; Rachidi, F. A Methodology to Reduce the Computational Effort in the Evaluation of the Lightning Performance of Distribution Networks. Atmosphere 2016, 7, 147. https://doi.org/10.3390/atmos7110147
Bendato I, Brignone M, Delfino F, Procopio R, Rachidi F. A Methodology to Reduce the Computational Effort in the Evaluation of the Lightning Performance of Distribution Networks. Atmosphere. 2016; 7(11):147. https://doi.org/10.3390/atmos7110147
Chicago/Turabian StyleBendato, Ilaria, Massimo Brignone, Federico Delfino, Renato Procopio, and Farhad Rachidi. 2016. "A Methodology to Reduce the Computational Effort in the Evaluation of the Lightning Performance of Distribution Networks" Atmosphere 7, no. 11: 147. https://doi.org/10.3390/atmos7110147