Article

Characteristics of Particulate Carbon in Precipitation during the Rainy Season in Xiamen Island, China

1
Key Lab of Global Change and Marine-Atmospheric Chemistry of State Oceanic Administration, Third Institute of Oceanography, State Oceanic Administration, Xiamen 361005, China
2
Institute of Urban Environment, Chinese Academy of Sciences, Xiamen 361021, China
3
Anji Meteorological Bureau of Zhejiang Province, Zhengjiang 313300, China
*
Author to whom correspondence should be addressed.
Atmosphere 2016, 7(11), 140; https://doi.org/10.3390/atmos7110140
Submission received: 14 September 2016 / Revised: 19 October 2016 / Accepted: 25 October 2016 / Published: 28 October 2016

Abstract

:
Measuring wet deposition of organic carbon (OC) and elemental carbon (EC) aerosol is crucial for the understanding of their circulation and climate effect. To further understand the wet deposition of particulate carbon (OC and EC), precipitation samples were collected from April to August 2014 on Xiamen Island in China. EC and water insoluble organic carbon (WIOC) concentrations were analyzed using a thermal optical method to investigate temporal variations and wet deposition fluxes. The average EC and WIOC concentrations were 7.3 μgC·L−1 and 495.3 μgC·L−1, respectively, which are both comparable to the results reported in European areas. EC and WIOC concentrations were higher in spring than in summer. Higher EC concentrations were found in April, which were probably associated with the transport of air masses from northern continental areas. Higher WIOC concentrations were found in May and were mainly attributed to air masses from the South China Sea. Lower concentrations of EC and WIOC in the summer were primarily due to the clean air masses transported from the ocean. The wet deposition flux was calculated as the product of concentration and precipitation amount. Average wet deposition fluxes of EC and WIOC were estimated to be 0.6 mgC·m−2·month−1 and 36.7 mgC·m−2·month−1, respectively. Wet deposition fluxes of EC and WIOC exhibited similar concentration trends. The largest flux in EC wet deposition occurred in April (1.8 mgC·m−2·month−1), while the largest flux in WIOC wet deposition occurred in May (63.1 mgC·m−2·month−1).

1. Introduction

Carbonaceous aerosols are usually classified into organic carbon (OC) and elemental carbon (EC). They are ubiquitous components of atmospheric particulate matter, and have important influences on environments, health and climate systems [1,2,3,4]. OC is derived from both primary sources (e.g., fossil fuel combustion and biomass burning) and secondary sources (e.g., gas to particle conversion of volatile organic compounds), while EC is a primary pollutant emitted from the incomplete combustion of biofuels, fossil fuels and biomass. OC efficiently scatters light, and therefore exerts a direct aerosol climate forcing and contributes to visibility reduction [5,6]. EC is the dominant absorber of solar radiation, absorbing solar radiation from the visible to the infrared wavelengths of the spectrum, exerting a positive radiative forcing with a large impact on visibility [7,8,9]. To understand the influence of carbonaceous aerosols on climates, environments and human health, it is essential to study the atmospheric cycle of emissions, transports, and depositions of these particles. Current understanding of the atmospheric cycle of carbonaceous aerosols is still largely incomplete, especially regarding wet deposition [6,10].
Wet deposition is an important process that removes carbonaceous particles from the atmosphere. Atmospheric wet deposition of total carbon is a significant carbon flux that cannot be neglected in regional models of the carbon cycle and that should be simultaneously considered with dry deposition as a removal mechanism of carbon from the regional atmosphere [11]. However, limited studies have focused on particulate carbons (OC and EC particles) in precipitation and their wet depositions [6,12]. The concentrations of EC in precipitation and snow samples have been determined using different analytical methods in several locations around the world to estimate their scavenging ratio and wet deposition [10,13,14,15,16,17]. Until now, there has been no accepted standard analytical method for measuring the OC and EC concentration in precipitation. Common analytical methods used for measuring EC in precipitation are thermal-optical analysis [6,12,14,18] and optical analysis, including light reflectance [19], light absorption [20] and single-particle soot photometry (SP2) [16,21]. Only several studies have directly measured both water insoluble organic carbon (WIOC, specifically, particulate OC) and EC in precipitation by the thermal-optical analysis method [6,12,22]. These methods are commonly used for the analysis of aerosol samples. Different analytical methods for measurement of OC and EC in rainwater have been compared and evaluated by Torres et al. [23]. Optical analysis usually measures the EC concentrations without OC. SP2 analysis can measure the EC masses, size distribution and mixing state of individual particles, however, it cannot analyze the OC concentrations simultaneously. Thermal-optical analysis is a successful method used to measure the OC and EC concentrations simultaneously in aerosol samples, although it cannot give the information of the size distribution and mixing state. A significant fraction of total carbon in precipitation was present as insoluble particulate OC [11]. Therefore, WIOC in precipitation and its wet deposition should not be neglected and measurement of OC and EC together is desirable. In summary, technical problems combined with high variability in precipitation processes and atmospheric pollution have led to highly variable results in the particulate carbon scavenging in rainwater [24]. Thus, to further understand the atmospheric cycle of carbonaceous aerosols and more accurately estimate their wet deposition, it is essential to investigate the particulate OC and EC in precipitation all over the world.
To expand the current data set on the spatial and temporal variability of particulate carbon in precipitation and further understanding their wet deposition, rainwater samples were collected on Xiamen Island from April to August 2014. WIOC and EC were simultaneously measured using a thermal-optical method. Xiamen is one of the cleanest coastal cities in China. Xiamen Island is the main part of the city’s urban area. Many studies in Xiamen have focused on the carbonaceous particles in the atmosphere [3,25,26,27], but none have analyzed the level of particulate carbon in precipitation. Thus, the objectives of this study are to: (1) assess the particulate carbon levels in precipitation during the rainy season; (2) characterize the temporal variation of WIOC and EC in precipitation; (3) identify the air mass processes being influenced; and, finally, (4) estimate the wet deposition flux of particulate carbon. The results will help to further the understanding of the influence of carbonaceous carbon emissions on the regional carbon budget with respect to its impact on climate.

2. Materials and Methods

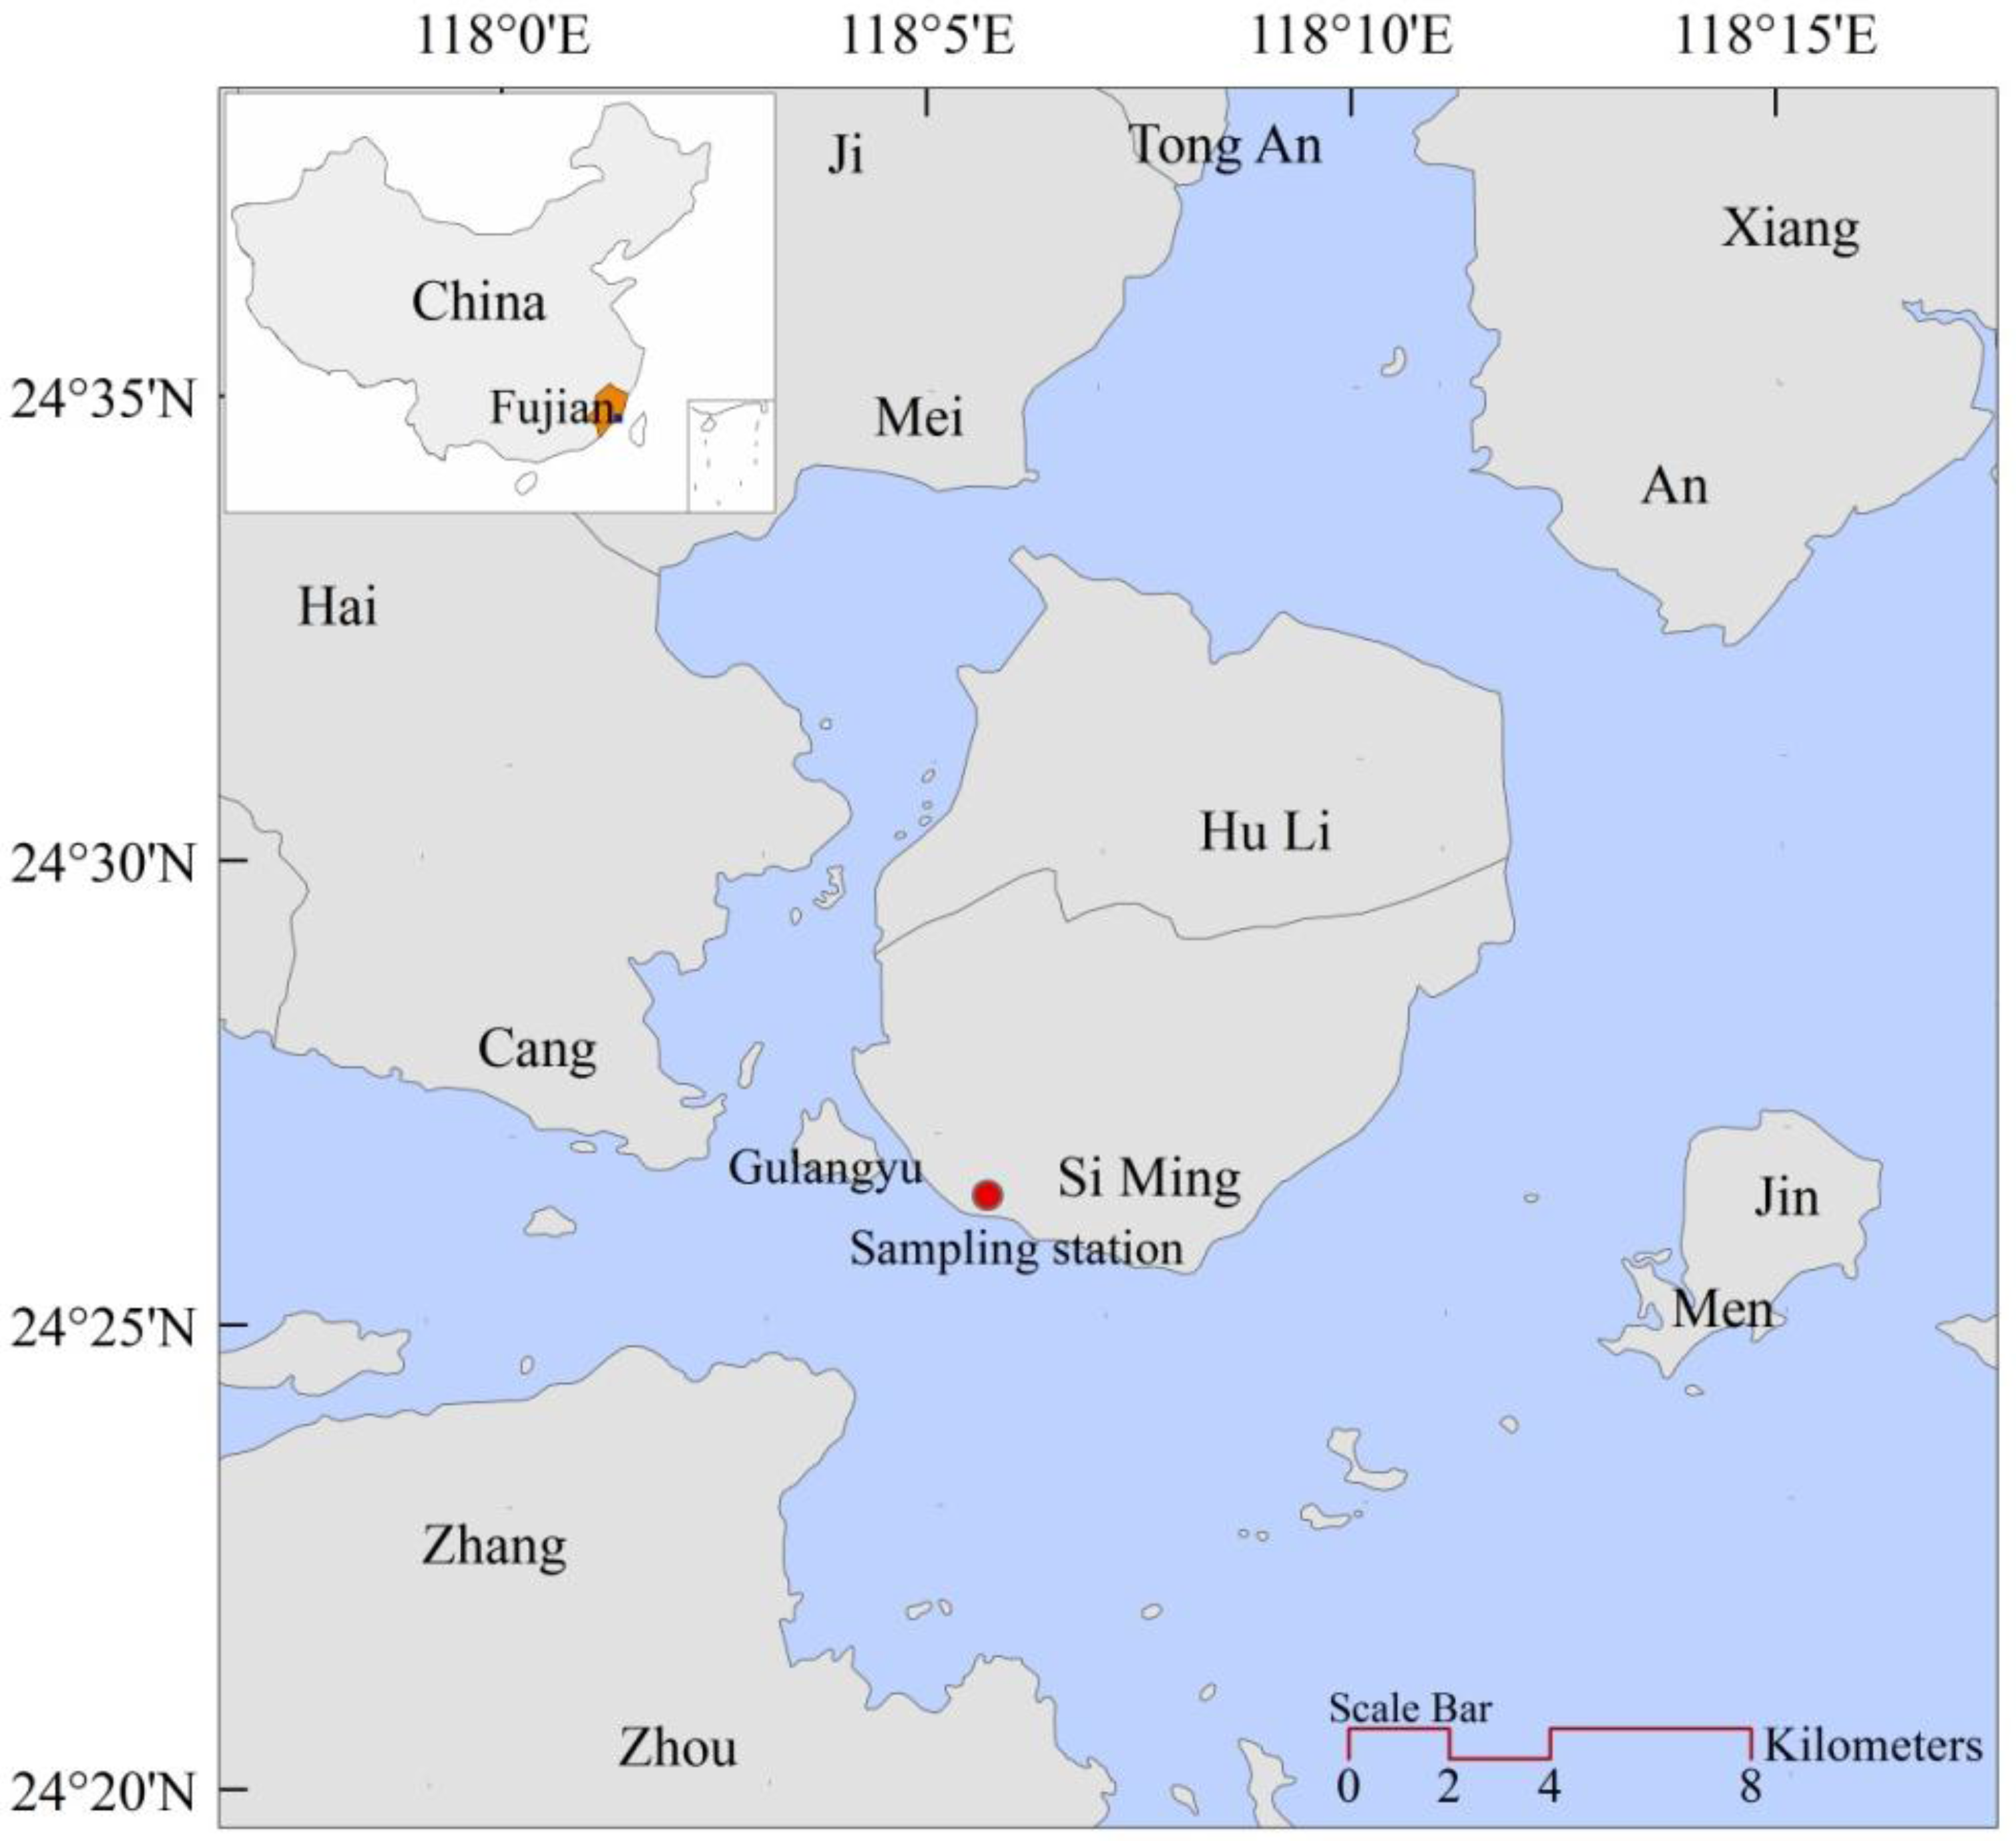
2.1. Site Description

Xiamen is a coastal city located in southeastern China that is a modern international portal city for tourism and one of the earliest participants in China’s opening-up policy as a special economic zone (Figure 1). Xiamen includes Xiamen Island, Gulangyu Island, and part of the rugged mainland coastal region, from the left bank of the Jiulong River in the west to the islands of Xiang’an in the northeast. Xiamen Island is the main part of the city’s urban area, including Siming and Huli District. Although Xiamen Island is only 7.5% of the total area of Xiamen city, it has an urban population of over 884,100 and accounts for approximately 47.7% of the total population. Located in the temperate and subtropical zones, Xiamen has a subtropical, oceanic monsoon climate that is indicative of a mild climate with abundant rainfall [28]. The average annual rainfall is approximately 1200 mm, and the maximum annual rainfall usually occurs during May to August [28]. Frost and snow rarely occur in Xiamen, so the wet deposition mainly refers to the rain samples [29]. In this study, the precipitation samples at Xiamen Island were collected mainly during the rainy season, from April to August. The sampling site was situated at the Marine-Atmospheric Environment Monitoring Station of the Third Institute of Oceanography of the State Oceanic Administration (24°26′12.47″N, 118°05′21.11″E). It is on the roof of a nine-floor building, approximately 45 m above sea level. This site is located in southwestern Xiamen Island (Figure 1), surrounded by famous tourism locations in Xiamen, such as Gulangyu Island, Nanputuo Temple, Xiamen University, and ancient fort at Huli Hill. The observation station is representative of coastal urban district of Xiamen Island due to the impact of traffic, sea-salt, residential, construction and ship emissions [30].

2.2. Sampling and Analysis

Precipitation samples were collected from April to August 2014 with an automated precipitation sampler (TE-78-100XAPS, TISCH, New York, NY, USA). The sampler consists of a rain sensor, wet container, dry container and dust preventing cover. When there was rain, the rainfall sensor would activate the cover and open automatically, exposing the container to the precipitation. The container was closed when the sensor dried after the rain. After each collection, the container was carefully washed. For the analysis of EC, WIOC, and WITC (water insoluble total carbon), a portion of each precipitation sample (45–600 mL) was rapidly filtered through a quartz fiber filter (Whatman QMA) that had been heated at 550 °C for 4 h in advance. Precipitation samples that could not be filtered immediately after collection were frozen until filtration. Samples were filtered using a glass filter unit in order to concentrate particles onto a circular region 47 mm in diameter. The efficiency of the filtration procedure was previously tested and shown to be efficient in filtering carbon particles from precipitation samples [31]. In this study, the efficiency of filtration was tested using suspensions of a known amount of carbon black particles in water. The average efficiency was 75%, similar to the study by Chýlek et al. [14]. The quartz filter was then dried inside desiccators at ambient temperature for approximately 24 h and stored in a frozen state until analyses. To determine the EC, WIOC and WITC concentrations, a piece of filter was cut from each filter and analyzed with an automated semi-continuous thermal-optical transmittance (TOT) carbon analyzer (Sunset Laboratory, Model-4, Houston, TX, USA). The TOT method follows the National Institute for Occupational Safety and Health (NIOSH) protocol [32]. The details of the TOT method can be found elsewhere [26,27]. Briefly, the small piece of the filter is gradually heated in pure helium (He) gas environment to 850 °C at which point most organic carbon is thought to be converted into carbon dioxide (CO2), whereas small organic compounds are charred into EC. The CO2 is then swept out of the oven by He gas and detected by a self-contained non-dispersive infrared (NDIR) system. Then, after the sample oven has cooled to 550 °C, the sample is step-heated to 870 °C in an oxidizing environment of 2% oxygen-containing helium (2% O2, 98% He). At this stage, EC is oxidized into CO2 and detected by the NDIR. Finally, a standard methane gas is injected for reference. The split between OC and EC is corrected when the laser transmittance returns to the initial value. The precision of the instrument is ±5%, and the detection limit is 0.1 μg·cm−2. The filtration process and the thermal-optical analyzing method have been previously used to quantify carbonaceous matter extracted from rain and snow samples [6,12,15].

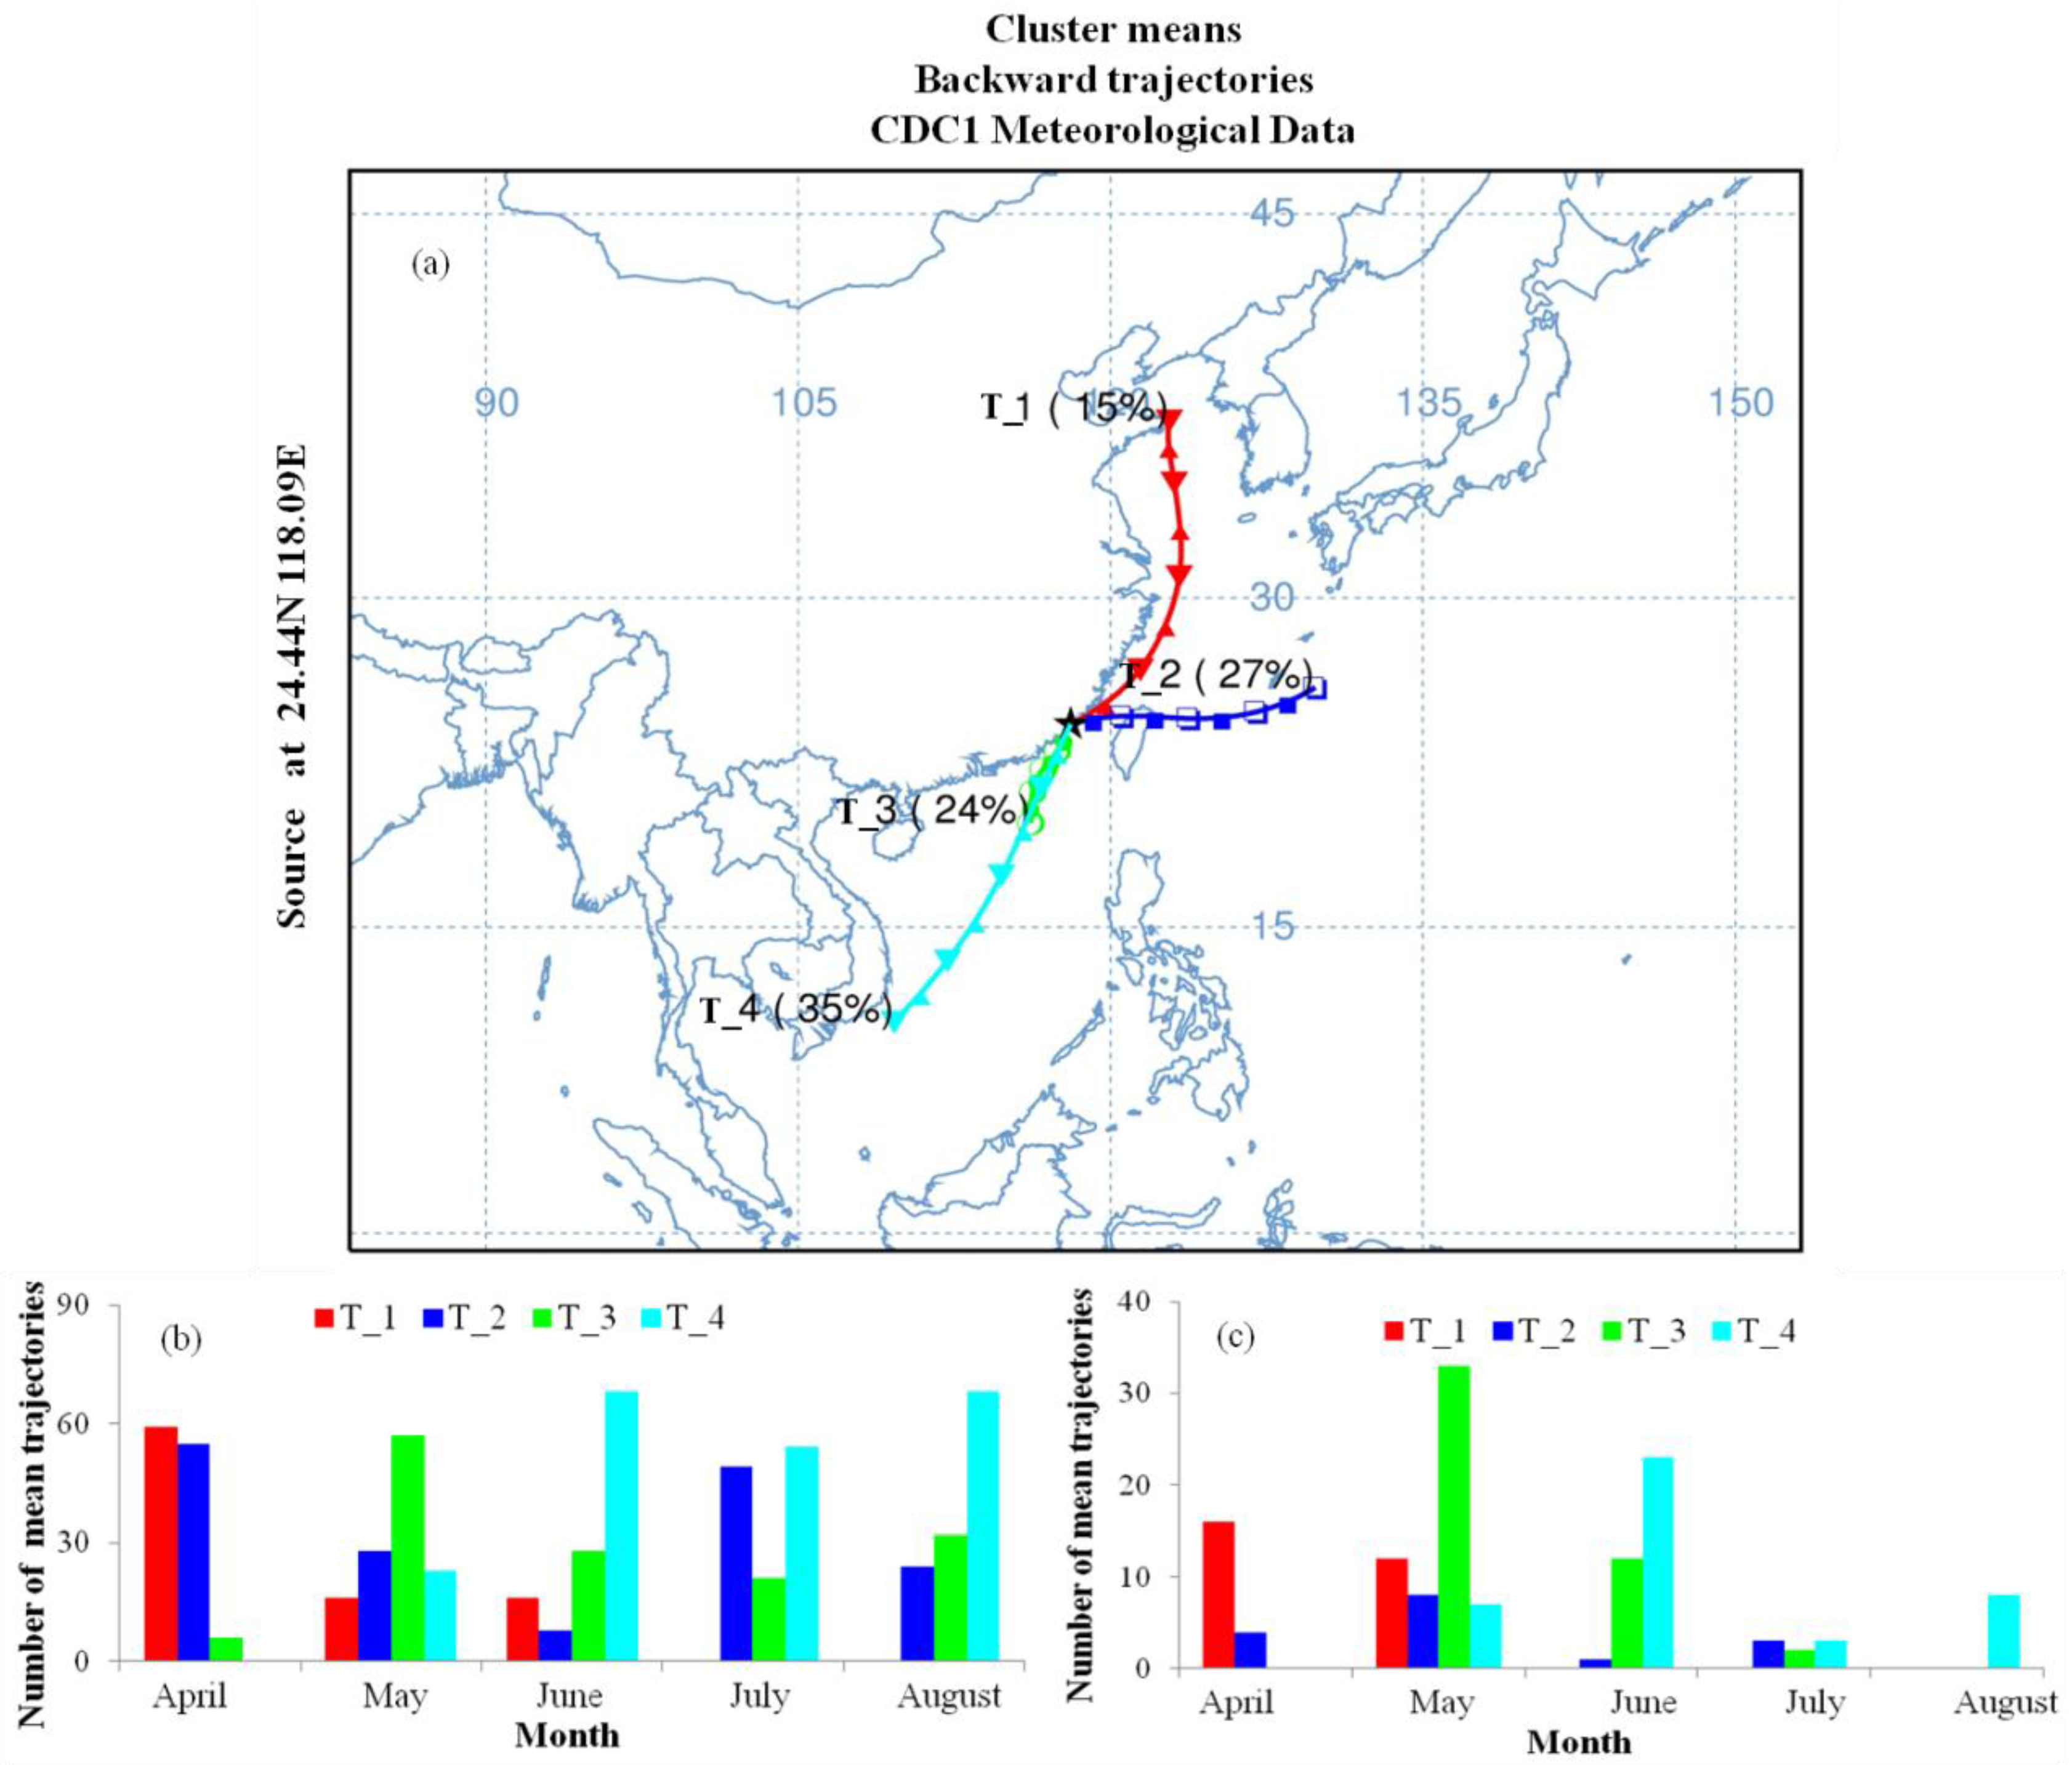
2.3. Air Mass Trajectory Analysis

To identify the potential transport pathways of precipitation, mean air mass backward trajectories arriving at the sampling site at an altitude of 100 m (above the model ground level) were calculated by the Hybrid Single-Particle Lagrangian Integrated Trajectory (HYSPLIT) model of the Air Resources Laboratory of NOAA [33]. HYSPLIT back-trajectories have been used in previous studies to investigate the source regions of particulate carbon in rain [6,12]. Four-day backward air mass trajectories were simulated with a daily resolution. Trajectories with end times of 00:00, 06:00, 12:00 and 18:00 (UTC) were first calculated for each day from April to August 2014, and then trajectory cluster analysis was conducted. The clustering tool integrated in the model was applied to create clusters of trajectories based on the percent change in total space variance (TSV) and calculated the mean backward trajectories of the clusters. The global reanalysis grid data provided by the Climate Diagnostics Center of NCEP/NCAR I (CDC-I) Meteorological Data were used to simulate the backward trajectories.

3. Results and Discussion

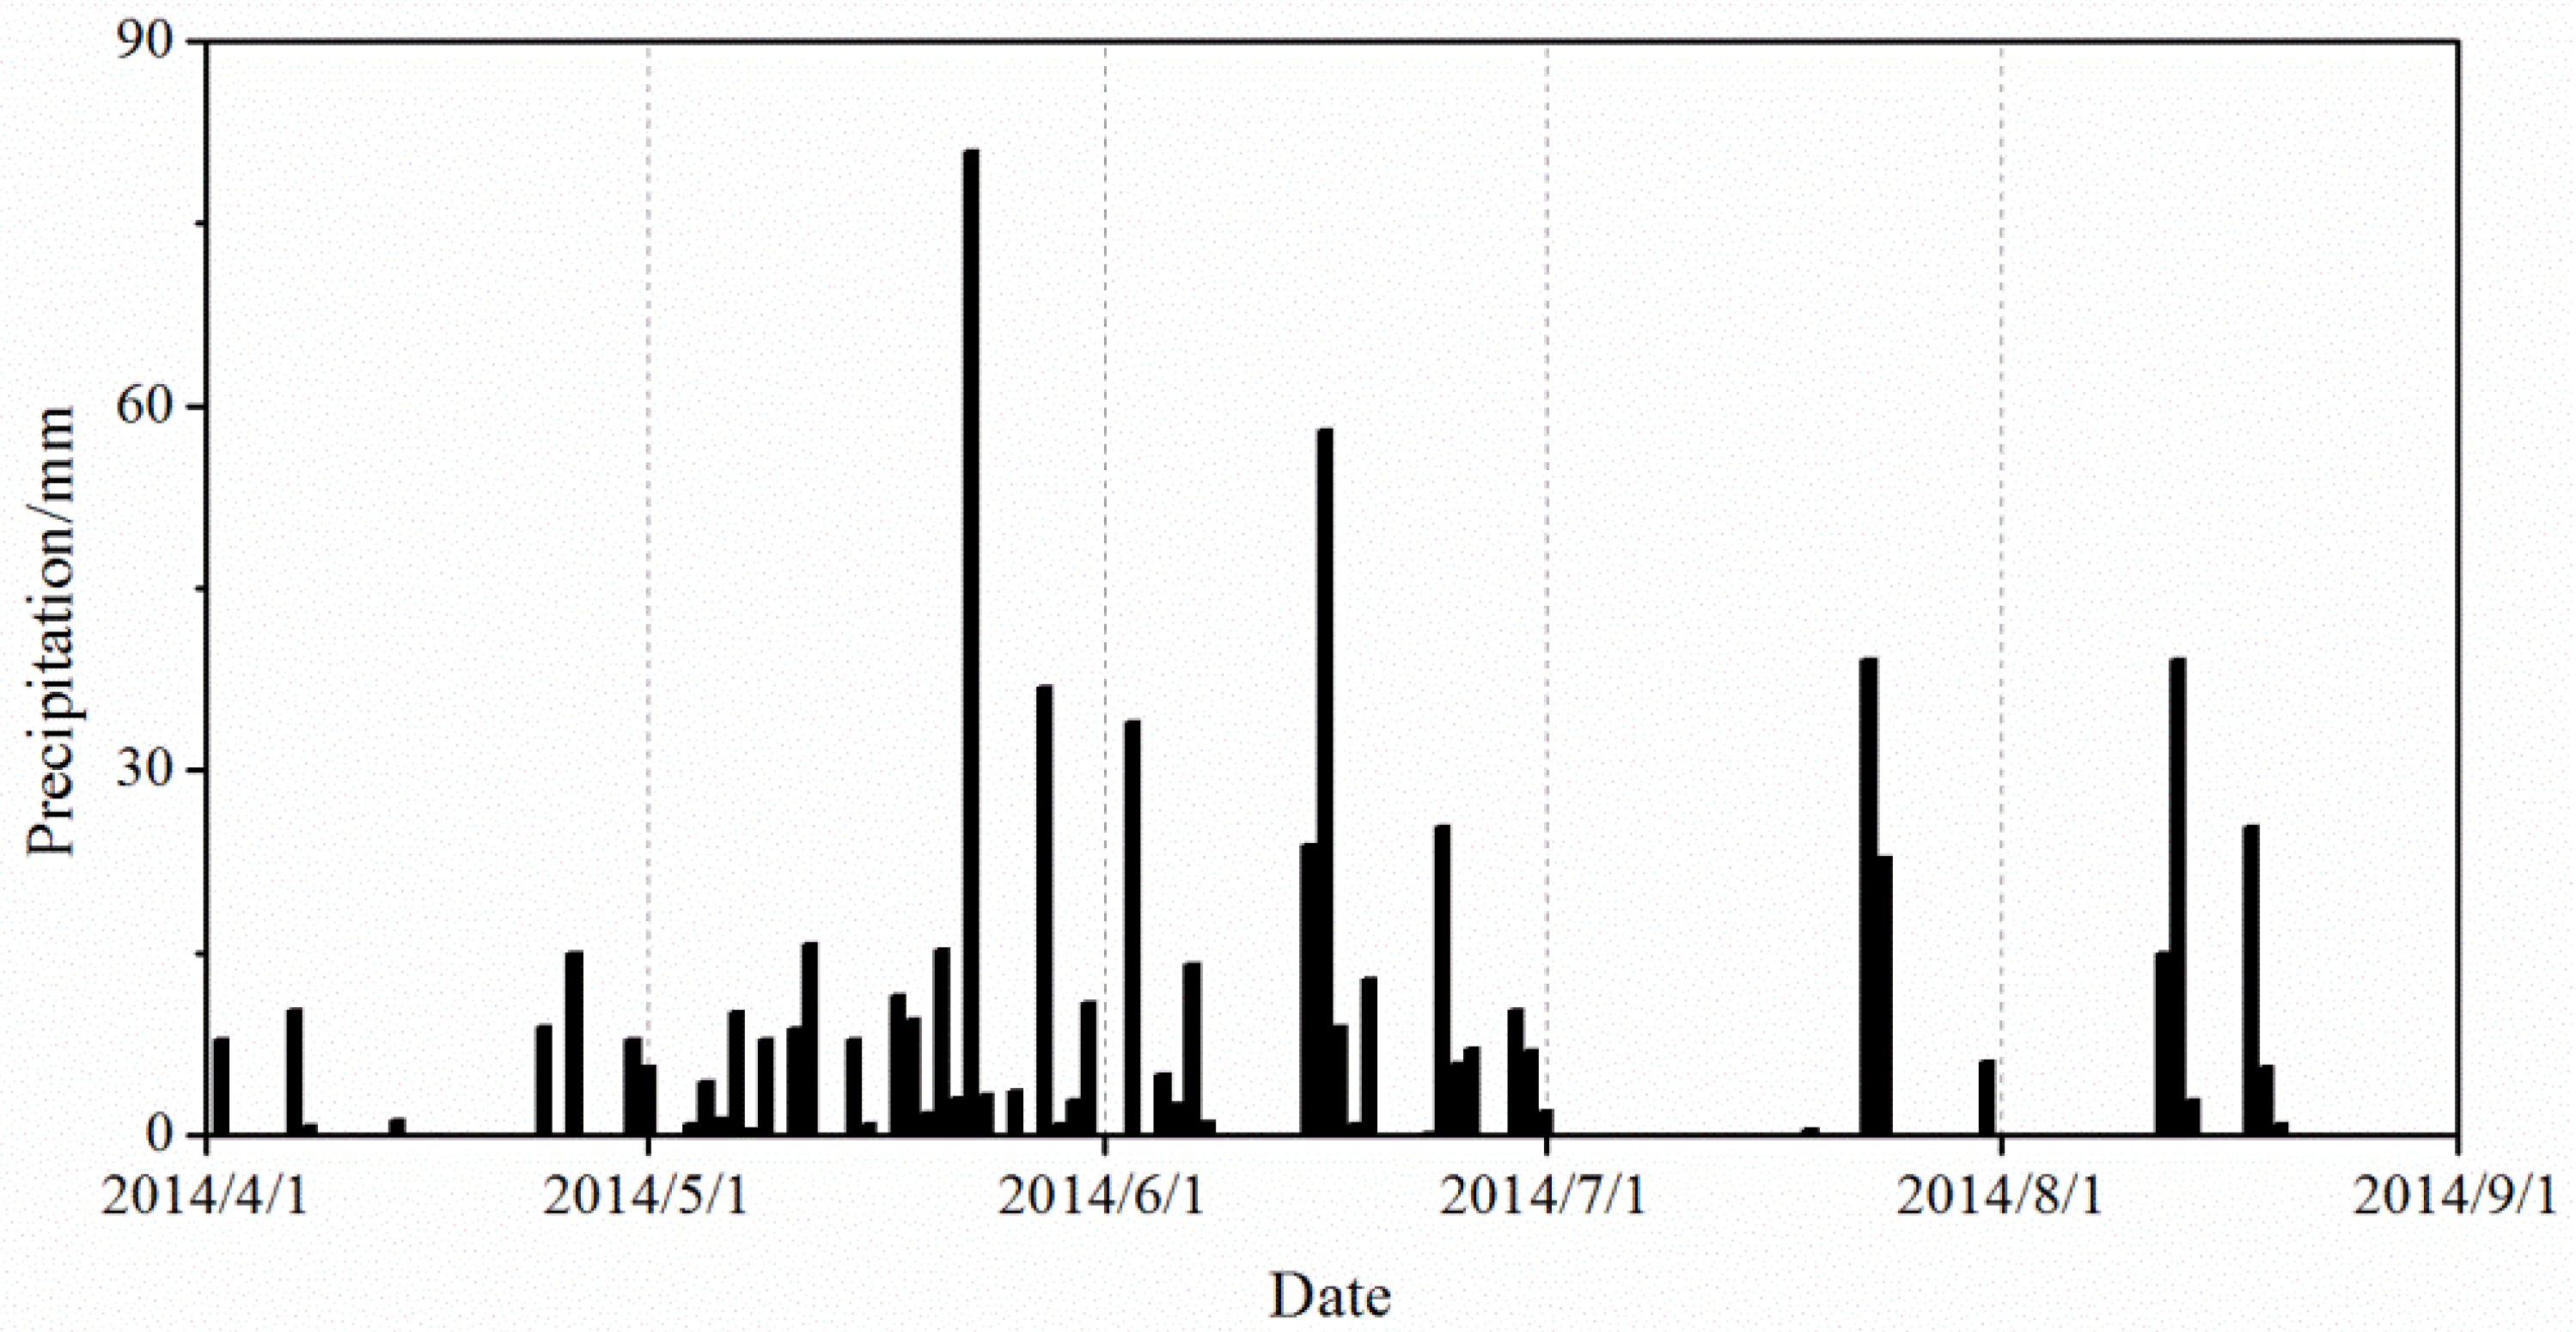
3.1. Precipitation Data

Figure 2 shows a time series of the daily precipitation in Xiamen Island from April to August 2014. There were 58 rainy days during the sampling period. The volume of daily precipitation varied from 0.1 mm to 80.9 mm. Several heavy precipitation events occurred in the months from May to August except April. Combined with meteorological condition and air mass trajectories, it can be found that highest precipitation amount (80.9 mm) on 23 May was mainly due to the low-level jet from the southwest (Figure S1a), which provided a large amount of water vapor and unstable energy for heavy rain [34]. Heavy precipitation events on 16 June and 23 July were influenced by the processes of Hagibis typhoon and Matmo typhoon, respectively [35]. Active cold air from north colliding with the warm humid air masses from the ocean, which contain abundant water vapor, can lead to strong convective weather and intense precipitation. Heavy precipitation on 13 August may be caused by the strong convective weather, and the rainfall may be originated from the South China Sea (Figure S1b). The total accumulated precipitation during the five-month study period was 675.4 mm, which accounted for approximately 62.3% of the yearly total accumulated precipitation (1084.5 mm) in 2014. The monthly distribution of the accumulated precipitation was as follows: 52.4 mm in April, 245.6 mm in May, 217.8 mm in June, 70.5 mm in July and 89.1 mm in August. The average volumes of the precipitation events were 1.7 mm·day−1, 7.9 mm·day−1, 7.3 mm·day−1, 2.3 mm·day−1, and 2.9 mm·day−1, respectively. A previous study reported that the frequent occurrence of migratory cyclones and a stationary Meiyu front caused persistent and occasionally enhanced precipitation in spring over the East China Sea, while the dominant subtropical anticyclone over the central North Pacific transported clean oceanic air masses from the south in the summer [16]. According to the cluster analysis results of the air mass backward trajectories arriving at the sampling site (Figure 3a and Figure S2), four clusters of air masses largely influenced the area. Cluster T_1 represented the long-range transport of air masses originating from the northern continental region, while T_4 represented the long-range transport of marine air masses originating from the South China Sea. T_2 and T_3 represented marine air masses transported from the northwestern Pacific Ocean and the South China Sea, respectively. Marine air masses constituted more than 80% of all the air masses. The number of T_1, T_2, T_3 and T_4 transport pathways distributed over the five months is shown in Figure 3b. The decreased number of T_1 and the increased number of T_3 and T_4 during April to August indicated that the variations in precipitation events and amounts were linked to the alternate control of marine and continental air masses. This result is consistent with a previous report that the Meiyu front plays an important role in the meridional transition of airflow between continental air from the north and oceanic air from the south [16]. In total, 33 precipitation samples were collected during the study period. Several precipitation samples were not daily samples because they were collected after entire precipitation events, so the representativeness of the sampled precipitation with respect to all precipitation events was more than 56.9%. Figure 3c shows the four mean transport pathways during the 33 sampled precipitation events. The distribution is similar to the trajectories in Figure 3b. Precipitation in April was mainly affected by air masses transported from the north. Precipitation in May was primarily influenced by the Meiyu front, which caused a transition in airflow between the continental air from the north and the oceanic air from the south and the increased oceanic air from the nearby South China Sea. In summer (June to August), the precipitation was mainly controlled by oceanic air masses.

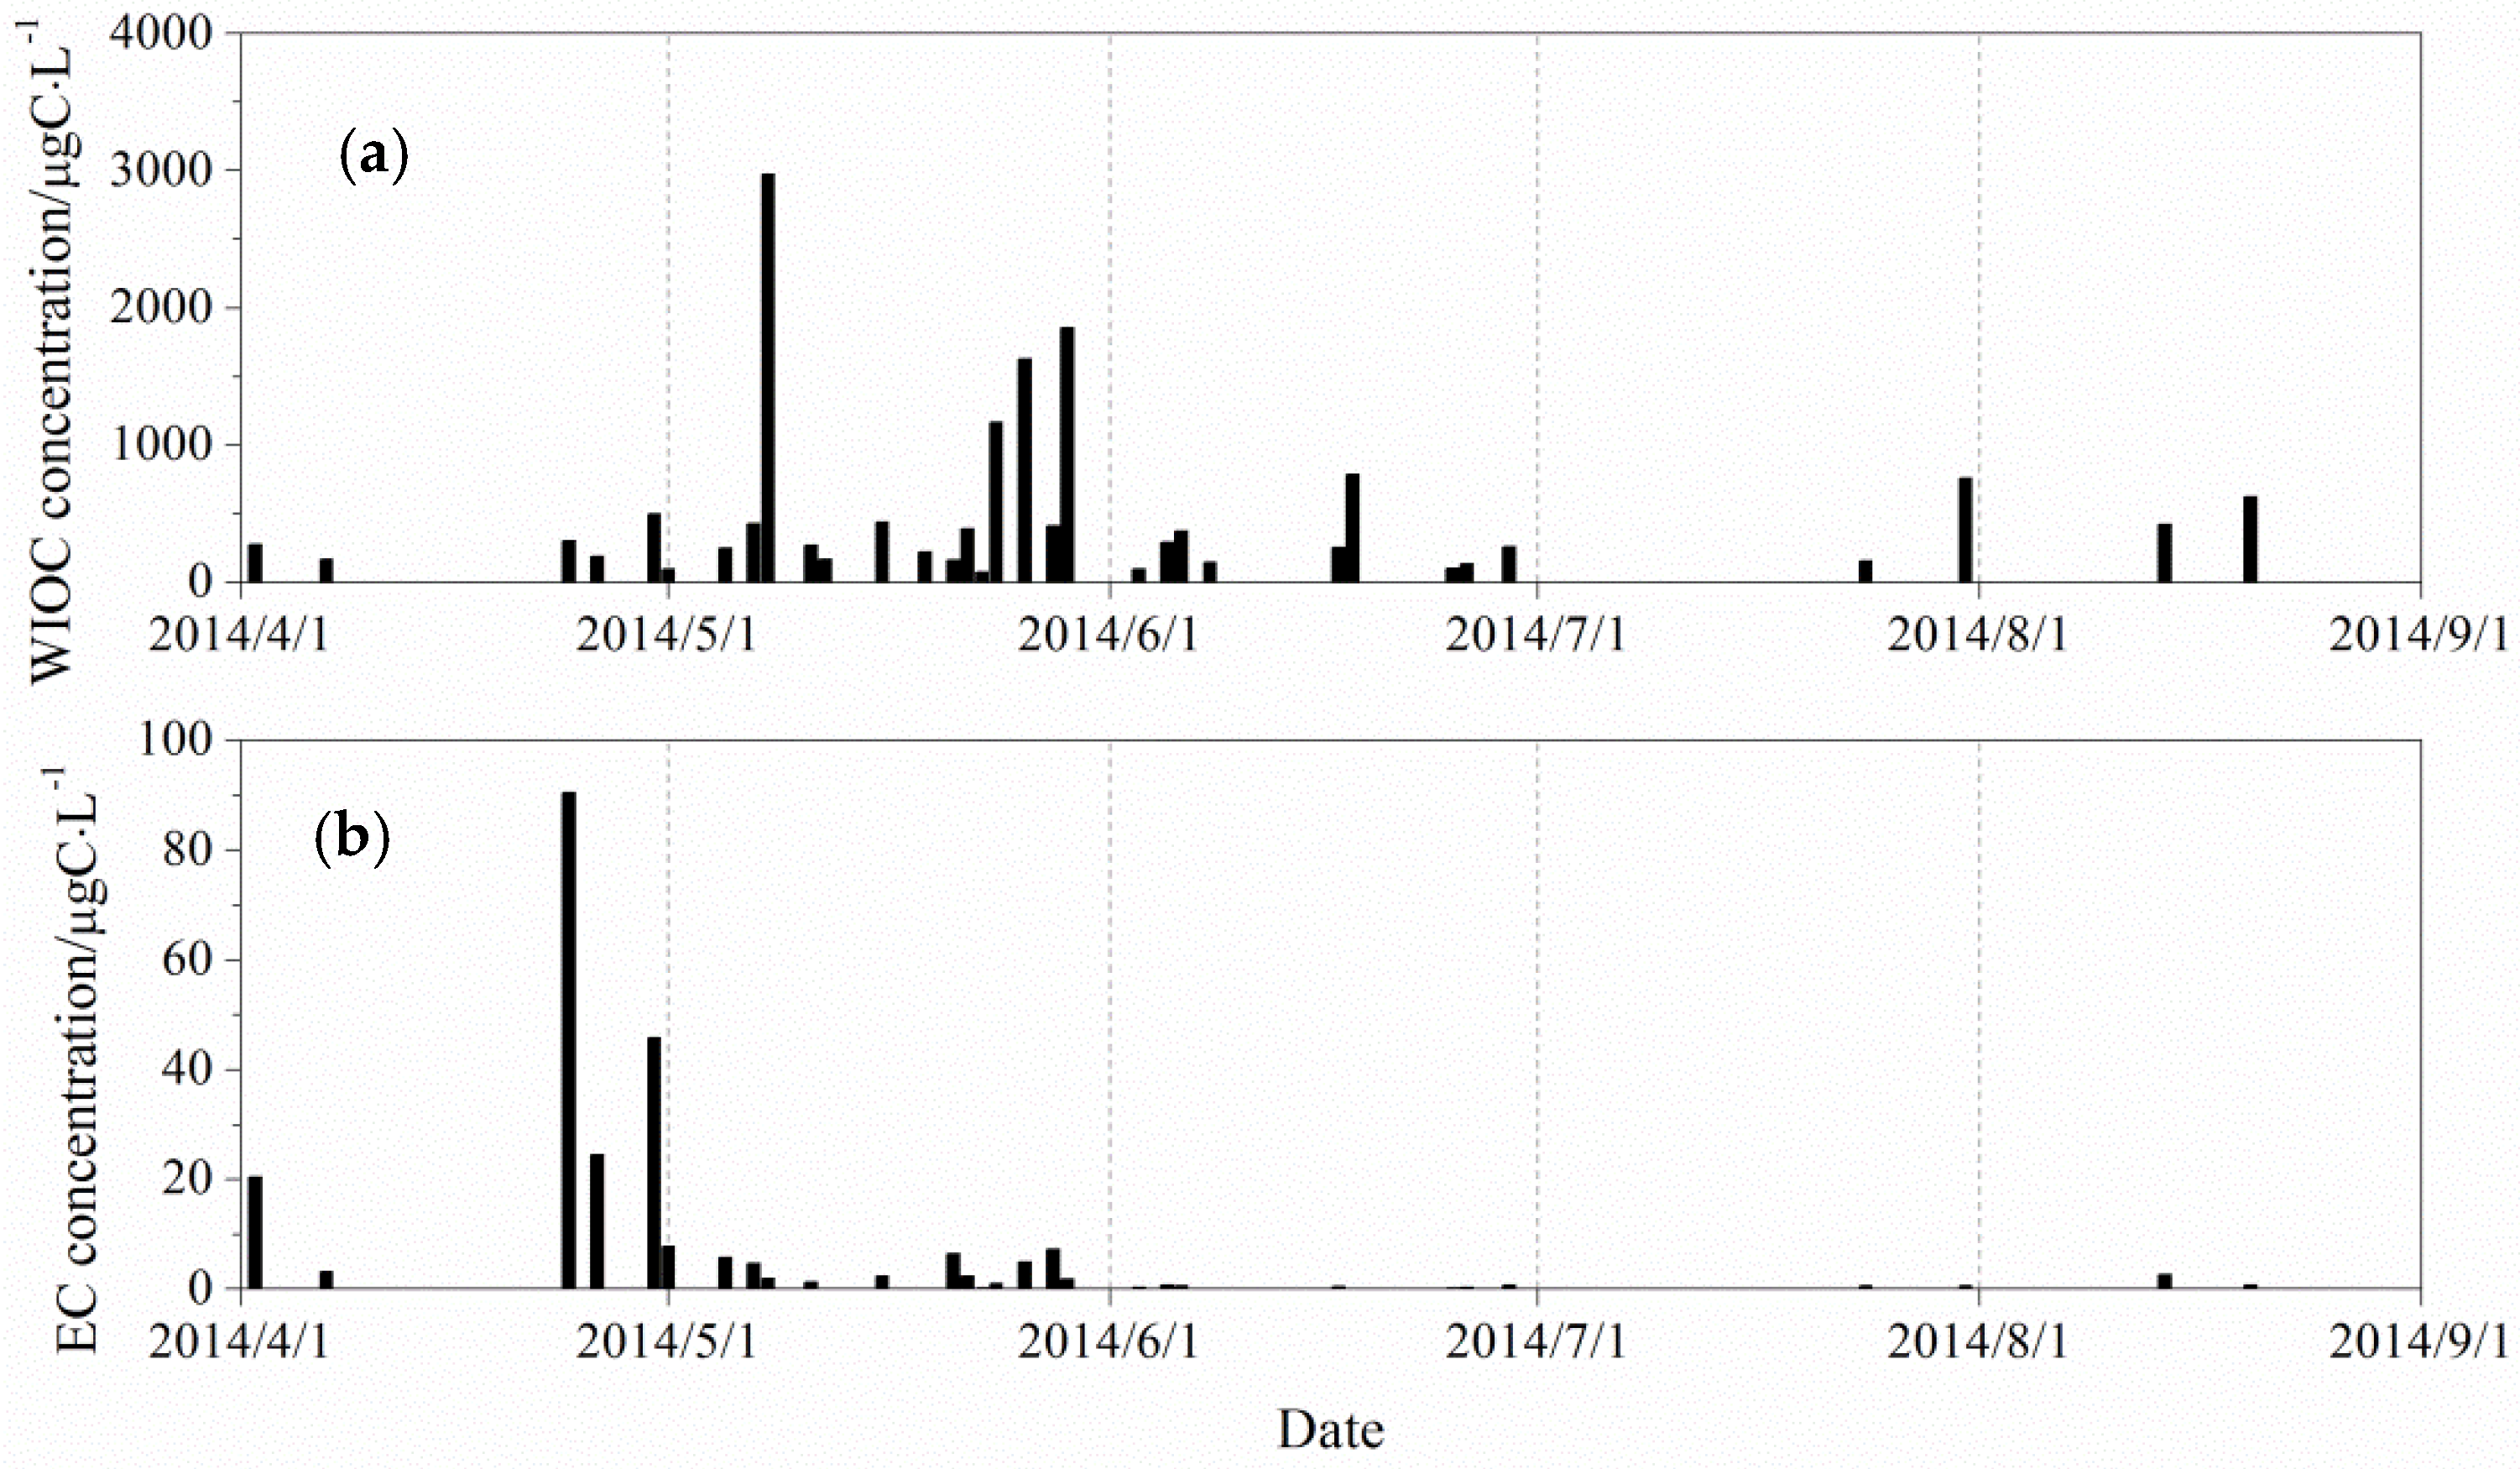
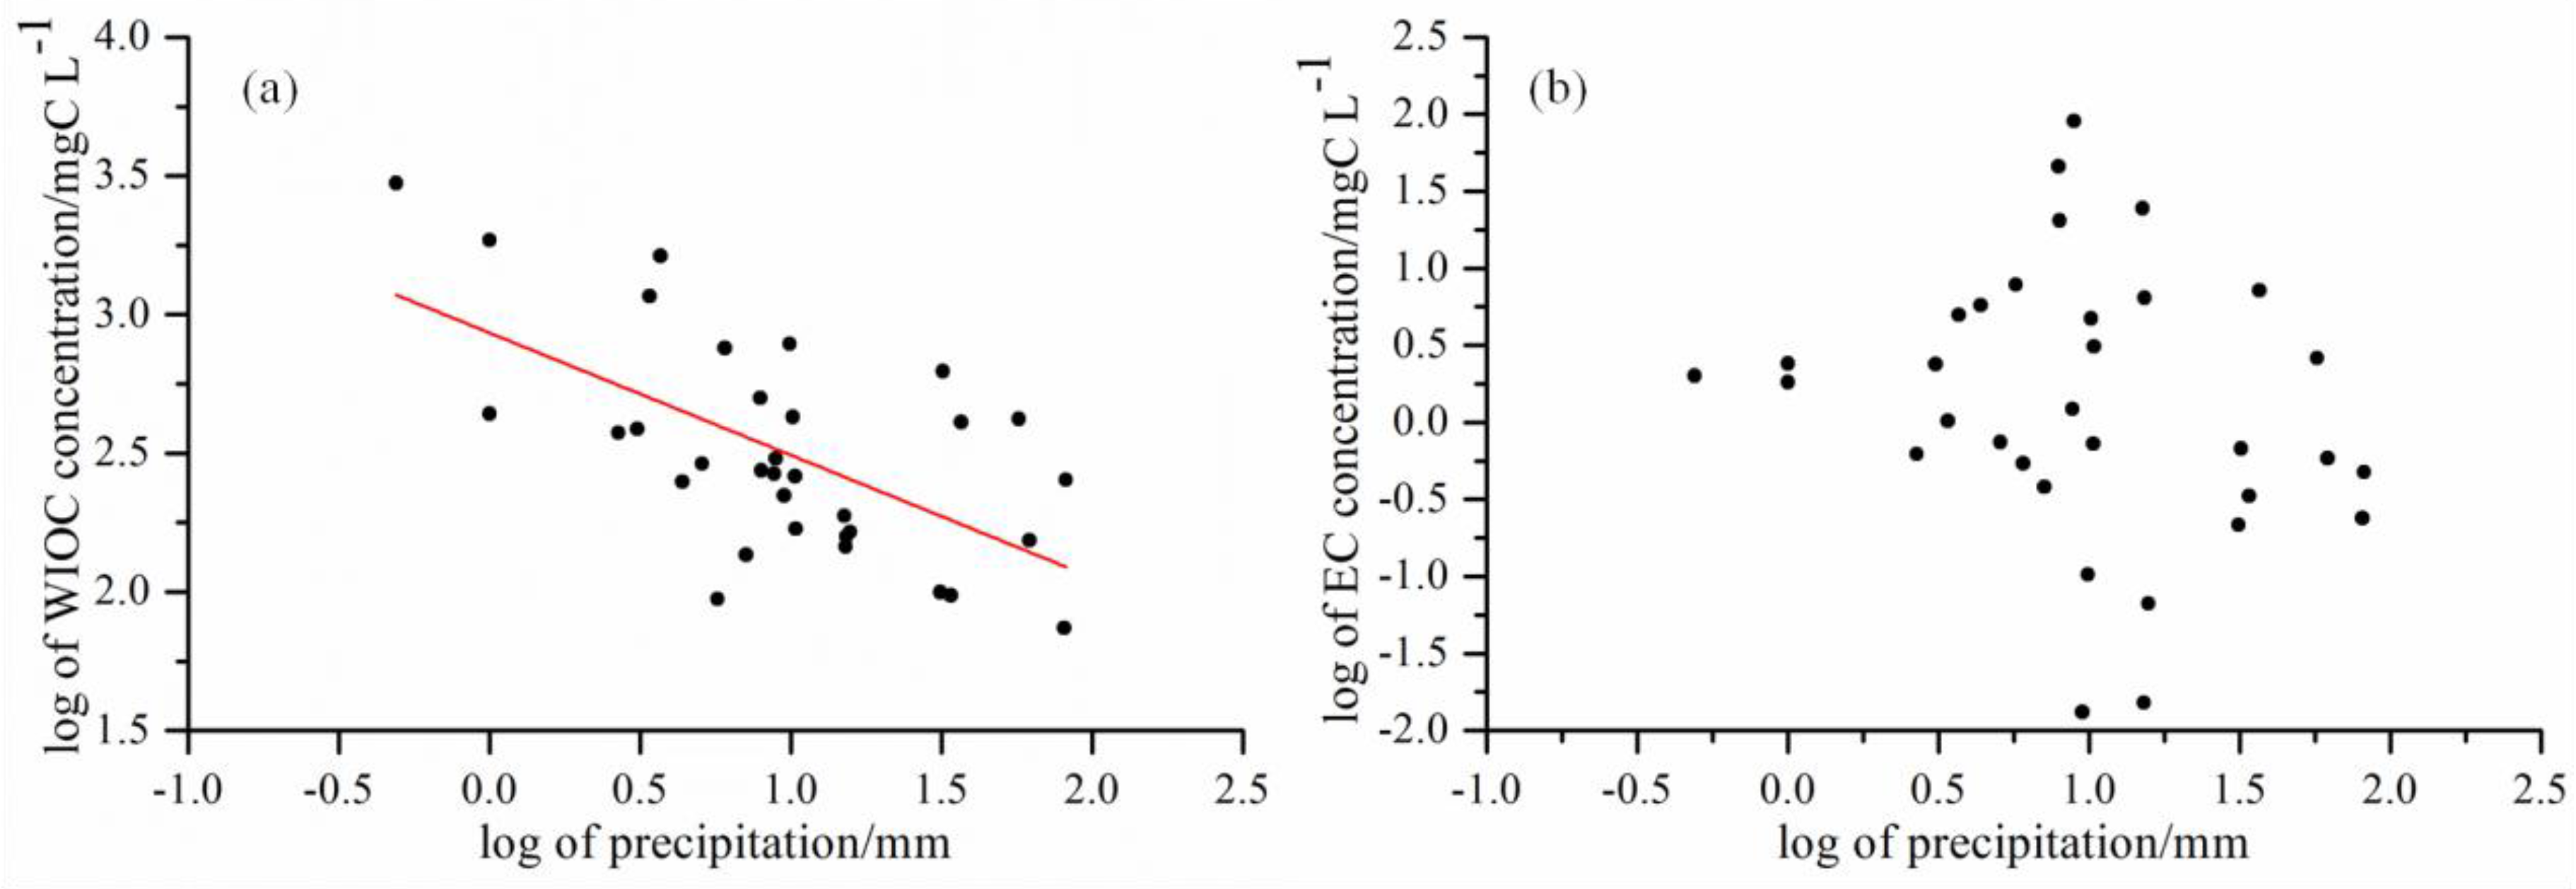
3.2. Particulate Carbon Concentrations in Precipitation

Table 1 shows the descriptive statistics for the EC, WIOC and WITC concentrations in precipitation collected at Xiamen Island. The EC concentration ranged from 0.0 to 90.5 μgC·L−1, with a mean of 7.3 ± 17.5 μgC·L−1. This concentration fits within the range of values that have been reported previously. EC concentrations in precipitation ranged from 0.0 to 1300 μgC·L−1 in rainwater and 0.0 to 130 μgC/L in snow and ice samples [23]. The WIOC concentration ranged from 74.2 to 2972.9 μgC·L−1, with a mean value of 495.3 ± 607.4 μgC·L−1, which is higher than those measured in the European background atmosphere where average varied from 98 to 358 μgC·L−1 [6]. Although the average EC concentrations in rainwater were slightly lower than those recorded over the North Atlantic Ocean (23 μgC·L−1), the average WIOC and WITC concentrations were comparable to those (438 μgC·L−1 and 460 μgC·L−1, respectively) over the North Atlantic Ocean [12]. Table 1 shows that the average particulate carbon concentrations in spring were much higher than those in summer, especially the EC concentrations. The EC values in spring were approximately 19 times higher than those in summer. Although the analytical method was different, the seasonal variation of EC in this study is similar to results in the East China Sea [16]. Mori et al. measured the EC in rainwater with single-particle soot photometry (SP2) and reported that the average EC concentrations in rainwater in the East China Sea were highest in spring (92 ± 76 μgC·L−1) and lowest in summer (8.0 ± 4.1 μgC·L−1) [16]. The EC concentrations in precipitation in the North Atlantic Ocean also exhibited higher values in spring (48 μgC·L−1) than in summer (5.1 μgC·L−1) [12]. Above all, it is clear that EC is a minor contributor to the total mass of particulate carbon in precipitation. This result indicates that the wet deposition processes may be more efficient at removing WIOC than removing EC from the atmosphere [12].
Figure 4 shows the temporal variation of EC and WIOC concentrations in precipitation during the sampling period. The highest level of EC in precipitation was found at April, while the highest WIOC value was found in May. High concentrations of EC in April and WIOC in May resulted in the overall high particulate carbon concentrations in spring. The particulate carbon concentrations were very low from June to August. Previous study reported that the scavenging efficiency of EC was lower in polluted environments but higher in remote locations due to their hydrophilic properties [15]. However, it can acquire hydrophilic properties by chemical ageing, many of the long-lived EC particles in the atmosphere maybe acquired hydrophilic properties by chemical ageing. Thus, higher EC concentration in precipitation in April suggested that many of the EC particles in atmosphere in April may be some long-lived EC particles or long-transported particles which have been acquired hydrophilic properties and easily scavenged by the rainwater. The long-range transported air masses in Figure 3 proved these speculate. Besides, higher EC concentrations in the atmosphere would also increase the absolute EC mass incorporated in rainwater during cloud precipitation processes [16]. A previous study in Xiamen observed that the aerosol EC levels in spring were larger than those in summer [26]. Thus, the higher EC concentrations in precipitation in spring, especially in April, may be due to the higher EC concentrations in the atmosphere. Figure S3 (Supplementary Materials) shows that the black carbon mass concentrations in the atmosphere during April were much higher than in other months, which further support this explanation. The origin of air masses is also a dominant factor in the temporal variation of EC concentrations in precipitation [12]. Atmospheric concentrations of EC in northern Chinese cities were higher than those in Xiamen [36]. According to the results of the air mass backward trajectory analyses (Figure 3), rain events associated with trajectories from the north, which is known to be an important source region of EC to the atmosphere, displayed much higher EC concentrations in April. Precipitation associated with the cleaner, oceanic air masses resulted in the lower EC concentrations during summer. Niu et al. also reported lower aerosol carbon levels in Xiamen during summer that was mainly attributed to the clean air masses from the ocean [26]. Combined with the WIOC concentration and the air masses, it was found that most of the higher concentrations of WIOC in precipitation were associated with the T_3 air masses, which originated from the nearby South China Sea. Breaking waves were thought to exert an overwhelming influence on the organic carbon enrichment of sea spray aerosols [37]. Thus, the input of organic carbon from the ocean is one possible reason for the higher WIOC concentrations in May. In addition to, higher concentrations of WIOC were coincident with the highest level of total precipitation in May. It seemed a little different from the study conducted in the North Atlantic Ocean [12], which found that the sampling events with high precipitation volumes exhibited lower WIOC concentrations than those with low precipitation volumes. However, the findings here are actually consistent with the previous results in the North Atlantic Ocean [12] when considering each precipitation event. This finding is evident in the regression analysis between the logarithm of the WIOC concentration and the logarithm of the precipitation amount (Figure 5a), which was similar to that of the previous study in the North Atlantic Ocean. The regression result obtained from the analysis was as follow:
Log10 (WIOC) = (2.94 ± 0.11) − (0.44 ± 0.10) × log10 (precipitation)
The significant negative correlation coefficient between these two parameters (r = −0.61 at p = 0.01) indicated that organic particles were efficiently scavenged from the atmosphere at the onset of rain events and then diluted by subsequent rainfall. Thus, dilution is an important factor that controls the WIOC concentrations of precipitation [12]. The logarithm of the EC concentrations did not correlate with the logarithm of precipitation amounts (Figure 5b), which suggests that EC concentrations in precipitation were not significantly affected by the time variation of the precipitation amount. This result, along with the lower contributions of EC compared to WIOC in precipitation, indicates that EC particles were not as efficiently scavenged from the atmosphere as WIOC particles [12]. Cerqueira et al. also reported that the scavenging ratios of EC were much lower than those of WIOC, indicated that EC was removed less efficiently from the atmosphere by wet deposition than WIOC [6].

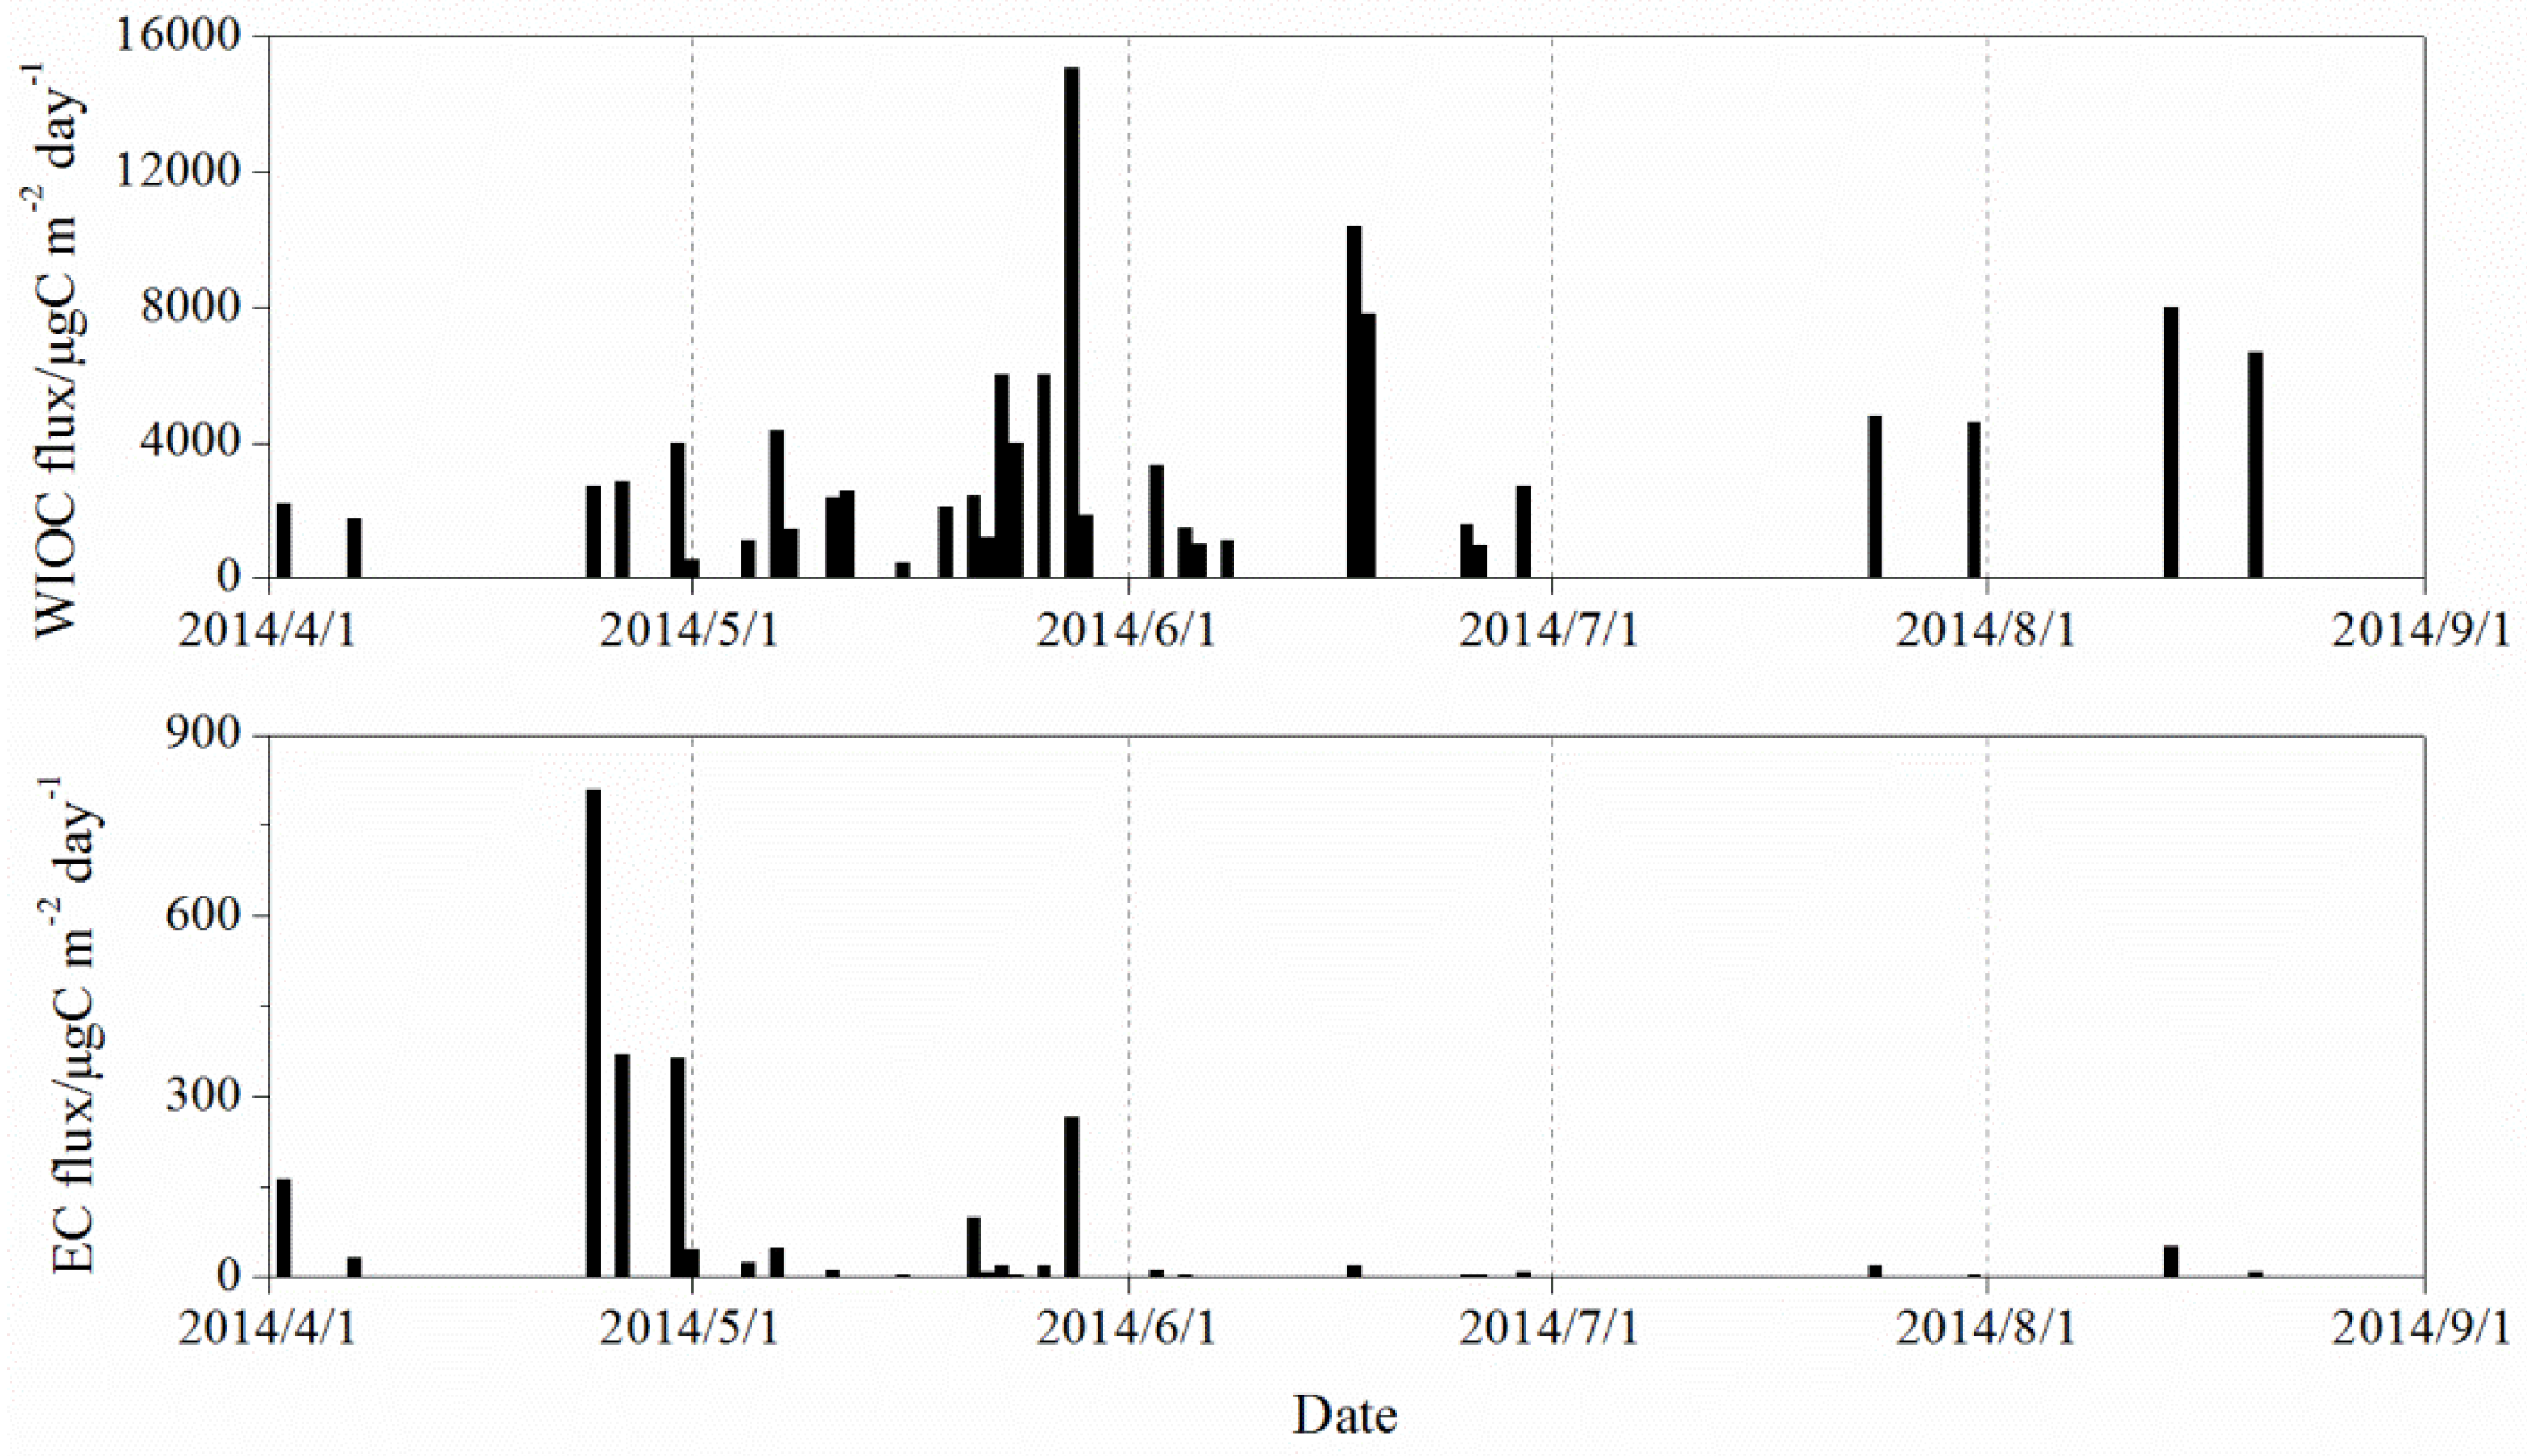
3.3. Wet Deposition Fluxes

EC and WIOC wet deposition flux for the ith sampling event Fi (μgC m−2·day−1) as
Fi = Ci × Pi
where Ci is the mass concentration in rainwater and Pi is the amount of precipitation in the sampling event [16]. The time variation of EC and WIOC daily wet deposition flux is shown in Figure 6. Daily EC wet deposition flux varied from 0.1 μgC·m−2·day−1 to 807.5 μgC·m−2·day−1, and WIOC daily wet deposition flux varied from 438.5 μgC·m−2·day−1 to 15055.7 μgC·m−2·day−1. The average daily wet deposition flux of EC and WIOC at Xiamen during the sampling period was 73.1 ± 164.0 μgC·m−2·day−1 and 3610.6 ± 3610.4 μgC·m−2·day−1, respectively; these values were 1.6 and 8.6 times higher, respectively, than the reported average values (EC was 47 ± 108 μgC·m−2·day−1, and WIOC was 419 ± 1188 μgC·m−2·day−1) in the central North Atlantic Ocean [12]. The trend in EC wet deposition fluxes was consistent with the variation in EC concentrations. Higher EC fluxes were also found in April, which indicated that atmospheric inputs were a major contribution to the EC wet deposition flux. EC wet deposition flux decreased from April to August because EC particles were nearly absent in the rain from June to August. The trend in WIOC wet deposition fluxes was slightly different from the variation in the WIOC concentrations. This finding indicates that the magnitude of WIOC wet deposition flux at Xiamen Island was mostly controlled by the amount of precipitation. Higher WIOC wet deposition fluxes during May to August suggests that marine air masses may transport some WIOC to Xiamen Island and then deposit it through rain.
According to the methods described by Mori et al. [16], all precipitation events need to be taken into account, including rain events from which rainwater was not sampled, to derive monthly EC wet deposition flux. Thus, monthly EC and WIOC wet deposition flux, Fm, in the units of mgC·m−2·month−1 was defined as
F m = Σ i F i Σ i P i P m / 1000
where Pm represents the total monthly precipitation. The monthly wet deposition fluxes of EC, WIOC and WITC during the sampling period are shown in Table 2. The highest EC wet deposition flux occurred in April, while the highest WIOC wet deposition flux occurred in May. In spring, the average monthly wet deposition flux of EC and WIOC at Xiamen were 1.3 mgC·m−2·month−1 and 38.5 mgC·m−2·month−1, respectively; in summer, these same fluxes were 0.1 mgC·m−2·month−1 and 35.4 mgC·m−2·month−1, respectively. These values are comparable to the results from European background sites, which reported that EC wet deposition fluxes ranged from 0.4 to 3.2 mgC·m−2·month−1 and that WIOC fluxes ranged from 5.1 to 31.5 mgC·m−2·month−1 [6]. The atmospheric OC and EC concentrations in Xiamen were comparable to the urban background sites in Europe [27], which indicated comparable deposition fluxes. EC wet deposition fluxes in snow in northeastern China were estimated to be 4.7 ± 3.7 mgC·m−2·month−1. The monthly EC wet deposition fluxes measured at a remote site in the East China Sea were 16.8 mgC·m−2·month−1, 1.9 mgC·m−2·month−1, 0.91 mgC·m−2·month−1 and 2.2 mgC·m−2·month−1 during spring, summer, fall, and winter, respectively [16]. Greater flux during spring compared to summer was coincident with the seasonal variations in this study. Matsui et al. used the CMAQ-PASCAL model to calculate the EC wet deposition flux over East Asia during March through May 2010 and found that the wet deposition flux of EC over South China (28 mgC·m−2·month−1) was four times greater than that of North China (6.6 mgC·m−2·month−1) because of the higher precipitation rate [38]. However, our study found that the EC wet deposition flux at Xiamen during the sampling period was not as large as the model calculation. Xiamen is one of the cleanest coastal cities in China. The concentrations of carbonaceous aerosols in Xiamen were much lower than those in Beijing, Qingdao, Shanghai, and other northern cities in China [32]. Therefore, one possible reason for the lower wet deposition fluxes in Xiamen may be the lower atmospheric concentrations. In addition, the transition from fresh, largely hydrophobic EC to aged EC that is coated by various soluble species may also affect the wet deposition flux. Although EC can acquire hydrophilic properties through chemical aging, fresh EC is known to be hydrophobic; thus, its scavenging ratio tends to be lower than those commonly found for more soluble air components. Hegg et al. also noted that the scavenging efficiency of EC was lower in polluted environments but higher in remote locations, due to their hydrophilic properties [15]. The average concentration of EC was three times higher in cloud-water than in rainwater [39]. In our study, we did not collect the cloud-water sample, only the precipitation samples. Rainwater samples contribute to wash out for below-cloud scavenging, below-cloud scavenging of aerosol EC can also contribute to washout and wet deposition. However, below-cloud scavenging is a small contributor to the removal of aerosol mass [15,40]. This may be another factor that resulted in the lower wet deposition of EC in Xiamen.

4. Conclusions

To further understand the wet deposition of carbonaceous aerosols and their circulation and climate effect, precipitation samples were collected on Xiamen Island from April to August 2014, WIOC and EC in precipitation were then simultaneously measured using a thermal-optical method. The wet deposition flux was calculated as the product of the concentrations and precipitation amount. During the rainy season, the average EC and WIOC concentrations were 7.3 μgC·L−1 and 495.3 μgC·L−1, respectively. The average wet deposition fluxes of EC and WIOC were estimated to be 0.6 mgC·m−2·month−1 and 36.7 mgC·m−2·month−1, respectively. The values were similar to the results reported for European background areas. EC and WIOC concentrations and wet deposition fluxes exhibited similar variation tendencies. EC concentrations and wet deposition fluxes were higher in spring than in summer. High EC concentrations and fluxes were found in April, and were probably associated with the transport of air masses from the northern continental area. High WIOC concentrations and fluxes were found in May and were mainly attributed to air masses from the South China Sea. Lower concentrations and fluxes of EC and WIOC during the summer months were primarily due to the clean air masses transported from the ocean, which contained minor amounts of carbonaceous aerosols. This study reports the first measurement of WIOC and EC concentration in precipitation and their wet deposition at Xiamen Island. Although the data were only during several months, it can still contribute to a better understanding of particulate carbon removal from the atmosphere, which will be helpful to further understanding of the influence of carbonaceous carbon emissions on the regional carbon budget with respect to its impact on climate.

Supplementary Materials

The following are available online at https://www.mdpi.com/2073-4433/7/11/140/s1, Figure S1: Daily backward trajectories arriving at the sampling site (a) on May 23 and (b) August 13, Figure S2: Four clusters of the air mass backward trajectories arriving at the sampling site, in which cluster 1 of 4 represents the trajectories of T_1, cluster 2 of 4 represents the trajectories of T_2, cluster 3 of 4 represents the trajectories of T_3, and cluster 4 of 4 represents the trajectories of T_4, Figure S3: Time series of daily BC mass concentrations at Xiamen Island during the study period.

Acknowledgments

This research was supported by the National Natural Science Foundation of China (No. 41305133), the Scientific Research Foundation of Third Institute of Oceanography, SOA. (No. 2015032 and No. 2014027), the Natural Science Foundation of Fujian Province (No. 2015J05024 and No. 2013J05065), and the Ningbo Soft Science Research Program (No. 2014A10095). Finally, we would like to thank the reviewers and editors who have contributed valuable comments to improve the manuscript.

Author Contributions

The work presented here was carried out in collaboration with all authors. Shuhui Zhao wrote the manuscript. Liqi Chen and Jinpei Yan contributed to the reviewing and revising of the manuscript. Shuhui Zhao, Jinpei Yan, and Wei Li performed the field campaign. Peng Shi and Yun Li were involved the data analysis.

Conflicts of Interest

The authors declare no conflict of interest.

References

  1. Poschl, U. Atmospheric aerosol: Composition, transformation, climate and health effects. Angew. Chem. Int. Ed. Engl. 2005, 44, 7520–7540. [Google Scholar] [CrossRef] [PubMed]
  2. Jacobson, M.Z. Effects of externally-through-internally-mixed soot inclusions within clouds and precipitation on global climate. J. Phys. Chem. A 2006, 110, 6860–6873. [Google Scholar] [CrossRef] [PubMed]
  3. Niu, Z.; Wang, S.; Chen, J.; Zhang, F.; Chen, X.; He, C.; Lin, L.; Yin, L.; Xu, L. Source contributions to carbonaceous species in PM2.5 and their uncertainty analysis at typical urban, peri-urban and background sites in southeast China. Environ. Pollut. 2013, 181, 107–114. [Google Scholar] [CrossRef] [PubMed]
  4. Zhu, C.S.; Cao, J.J.; Tsai, C.J.; Shen, Z.X.; Han, Y.M.; Liu, S.X.; Zhao, Z.Z. Comparison and implications of PM2.5 carbon fractions in different environments. Sci. Total Environ. 2014, 466, 203–209. [Google Scholar] [CrossRef] [PubMed]
  5. Malm, W.C.; Day, D.E. Optical properties of aerosols at Grand Canyon National Park. Atmos. Environ. 2000, 34, 3373–3391. [Google Scholar] [CrossRef]
  6. Cerqueira, M.; Pio, C.; Legrand, M.; Puxbaum, H.; Kasper-Giebl, A.; Afonso, J.; Preunkert, S.; Gelencsér, A.; Fialho, P. Particulate carbon in precipitation at European background sites. J. Aerosol Sci. 2010, 41, 51–61. [Google Scholar] [CrossRef]
  7. Larson, S.M.; Cass, G.R.; Gray, H.A. Atmospheric carbon particles and the Los Angeles visibility problem. Aerosol Sci. Technol. 1989, 10, 118–130. [Google Scholar] [CrossRef]
  8. Horvath, H. Atmospheric light absorption—A review. Atmos. Environ. 1993, 27, 293–317. [Google Scholar] [CrossRef]
  9. Ramanathan, V. Role of black carbon in global and regional climate changes. In Proceeding of 17th International Conference on Nucleation and Atmospheric Aerosols, Galway, Ireland, 18 October 2007.
  10. Matsuda, K.; Sase, H.; Murao, N.; Fukazawa, T.; Khoomsub, K.; Chanonmuang, P.; Visaratana, T.; Khummongkol, P. Dry and wet deposition of elemental carbon on a tropical forest in Thailand. Atmos. Environ. 2012, 54, 282–287. [Google Scholar] [CrossRef]
  11. Pan, Y.; Wang, Y.; Xin, J.; Tang, G.; Song, T.; Wang, Y.; Li, X.; Wu, F. Study on dissolved organic carbon in precipitation in northern China. Atmos. Environ. 2010, 44, 2350–2357. [Google Scholar] [CrossRef]
  12. Custódio, D.; Cerqueira, M.; Fialho, P.; Nunes, T.; Pio, C.; Henriques, D. Wet deposition of particulate carbon to the Central North Atlantic Ocean. Sci. Total Environ. 2014, 496, 92–99. [Google Scholar] [CrossRef] [PubMed]
  13. Ogren, J.A.; Charlson, R.J.; Groblicki, P.J. Determination of elemental carbon in rainwater. Anal. Chem. 1983, 55, 1569–1572. [Google Scholar] [CrossRef]
  14. Chýlek, P.; Kou, L.; Johnson, B.; Boudala, F.; Lesins, G. Black carbon concentrations in precipitation and near surface air in and near Halifax, Nova Scotia. Atmos. Environ. 1999, 33, 2269–2277. [Google Scholar] [CrossRef]
  15. Hegg, D.A.; Clarke, A.D.; Doherty, S.J.; Ström, J. Measurements of black carbon aerosol washout ratio on Svalbard. Tellus 2011, 63, 891–900. [Google Scholar] [CrossRef]
  16. Mori, T.; Kondo, Y.; Ohata, S.; Moteki, N.; Matsui, H.; Oshima, N.; Iwasaki, A. Wet deposition of black carbon at a remote site in the East China Sea. J. Geophys. Res. Atmos. 2014, 119, 10485–10498. [Google Scholar] [CrossRef]
  17. Wang, Z.W.; Gallet, J.C.; Pedersen, C.A.; Zhang, X.S.; Strom, J.; Ci, Z.J. Elemental carbon in snow at Changbai Mountain, northeastern China: Concentrations, scavenging ratios, and dry deposition velocities. Atmos. Chem. Phys. 2014, 14, 629–640. [Google Scholar] [CrossRef] [Green Version]
  18. Hadley, O.L.; Corrigan, C.; Ramanathan, V. Measurements of Black Carbon in California Snow and Rain; CEC-500-2008-029; California Energy Commission, PIER Energy-Related Environmental Research Program: Sacramento, CA, USA, 2007.
  19. Armalis, S. Wet Deposition of Elemental Carbon in Lithuania. Sci. Total Environ. 1999, 239, 89–93. [Google Scholar] [CrossRef]
  20. Granat, L.; Engstrom, J.E.; Praveen, S.; Rodhe, H. Light absorbing material (Soot) in rainwater and in aerosol particles in the Maldives. J. Geophys. Res. Atmos. 2010, 115, D16307. [Google Scholar] [CrossRef]
  21. Ohata, S.; Moteki, N.; Kondo, Y. Evaluation of a Method for measurement of the concentration and size distribution of black carbon particles suspended in rainwater. Aerosol Sci. Technol. 2011, 45, 1326–1336. [Google Scholar] [CrossRef]
  22. Ducret, J.; Cachier, H. Particulate carbon content in rain at various temperate and tropical locations. J. Atmos. Chem. 1992, 15, 55–67. [Google Scholar] [CrossRef]
  23. Torres, A.; Bond, T.C.; Lehmann, C.M.B.; Subramanian, R.; Hadley, O.L. Measuring organic carbon and black carbon in rainwater: Evaluation of methods. Aerosol Sci. Technol. 2014, 48, 239–250. [Google Scholar] [CrossRef]
  24. Heintzenberg, J.; Cerecedabalic, F.; Vidal, V.; Leck, C. Scavenging of black carbon in Chilean coastal fogs. Sci. Total Environ. 2016, 541, 341–347. [Google Scholar] [CrossRef] [PubMed]
  25. Chen, B.; Du, K.; Wang, Y.; Chen, J.; Zhao, J.; Wang, K.; Zhang, F.; Xu, L. Emission and transport of carbonaceous aerosols in urbanized coastal areas in China. Aerosol Air Qual. Res. 2012, 12, 371–378. [Google Scholar] [CrossRef]
  26. Niu, Z.; Zhang, F.; Kong, X.; Chen, J.; Yin, L.; Xu, L. One-year measurement of organic and elemental carbon in size-segregated atmospheric aerosol at a coastal and suburban site in Southeast China. J. Environ. Monit. 2012, 14, 2961–2967. [Google Scholar] [CrossRef] [PubMed]
  27. Zhao, S.; Chen, L.; Li, Y.; Xing, Z.; Du, K. Summertime spatial variations in atmospheric particulate matter and its chemical components in different functional areas of Xiamen, china. Atmosphere 2015, 6, 234–254. [Google Scholar] [CrossRef]
  28. Physical Geography of Xiamen, Xiamen Municipal Government, P.R. China. Available online: http://www.xm.gov.cn/zjxm/xmgk (accessed on 29 September 2016).
  29. Xu, L.; Chen, J.; Yang, L.; Yin, L.; Yu, J.; Qiu, T.; Hong, Y. Characteristics of total and methyl mercury in wet deposition in a coastal city, Xiamen, China: Concentrations, fluxes and influencing factors on HG distribution in precipitation. Atmos. Environ. 2014, 99, 10–16. [Google Scholar] [CrossRef]
  30. Yan, J.; Chen, L.; Qi, L.; Zhao, S.; Zhang, M. Effect of typhoon on atmospheric aerosol particle pollutants accumulation over Xiamen, China. Chemosphere 2016, 159, 244–255. [Google Scholar] [CrossRef] [PubMed]
  31. Cachier, H.; Pertuisot, M.H. Particulate carbon in arctic ice: Ice archives in Antarctica and Greenland. Analusis 1994, 22, 34–37. [Google Scholar]
  32. Birch, M.E.; Cary, R.A. Elemental carbon-based method for monitoring occupational exposures to particulate diesel exhaust: Methodology and exposure issues. Aerosol Sci. Technol. 1996, 121, 1183–1190. [Google Scholar] [CrossRef]
  33. Draxler, R.R.; Rolph, G.D. HYSPLIT (Hybrid Single-Particle Lagrangian Integrated Trajectory) Model Access via NOAA ARL READY WEBSITE; NOAA Air Resources Laboratory: Silver Spring, MD, USA, 2003. [Google Scholar]
  34. Sun, Q.; Chen, D.; Zheng, X.; Su, Z. Analysis of a heavy rain process in southern Fujian on May 23, 2014. In Proceedings of the Annual meeting of Chinese Meteorological Society, Beijing, China, 24–25 December 2014. (In Chinese)
  35. Typhoon and Marine Weather Monitoring and Warning, China Meteorological Administration. Available online: http://typhoon.nmc.cn (accessed on 29 September 2016).
  36. Cao, J.J.; Lee, S.C.; Chow, J.C.; Watson, J.G.; Ho, K.F.; Zhang, R.J.; Jin, Z.D.; Shen, Z.X.; Chen, G.C.; Kang, Y.M.; et al. Spatial and seasonal distributions of carbonaceous aerosols over China. J. Geophys. Res. 2007, 112, D22S11. [Google Scholar] [CrossRef]
  37. Quinn, P.K.; Bates, T.S.; Schulz, K.S.; Coffman, D.J.; Frossard, A.A.; Russell, L.M.; Keene, W.C.; Kieber, D.J. Contribution of sea source carbon pool to organic matter enrichment in sea spray aerosol. Nat. Geosci. 2014, 7, 228–232. [Google Scholar] [CrossRef]
  38. Matsui, H.; Koike, M.; Kondo, Y.; Oshima, N.; Moteki, N.; Kanaya, Y.; Takami, A.; Irwin, M. Seasonal variations of Asian black carbon outflow to the Pacific: Contribution from anthropogenic sources in China and biomass burning sources in Siberia and Southeast Asia. J. Geophys. Res. Atmos. 2013, 118, 9948–9967. [Google Scholar] [CrossRef]
  39. Budhavant, K.B.; Rao, P.S.P.; Safai, P.D.; Leck, C.; Rodhe, H. Black carbon in cloud-water and rain water during monsoon season at a high altitude station in India. Atmos. Environ. 2016, 129, 256–264. [Google Scholar] [CrossRef]
  40. Jacobson, M.Z. Development of mixed-phase clouds from multiple aerosol size distributions and the effect of clouds on aerosol removal. J. Geophys. Res. 2003, 108, AAC4. [Google Scholar] [CrossRef]
Figure 1. Map of Xiamen Island and the sampling site.
Atmosphere 07 00140 g001
Figure 2. Time series of the daily precipitation in Xiamen Island.
Atmosphere 07 00140 g002
Figure 3. Cluster analyses of 96-h backward trajectories ending at the sampling site: (a) cluster mean trajectories from April to August 2014; (b) monthly distributions of the four mean trajectories during the sampling period; and (c) monthly distributions of the four mean trajectories during the sampled precipitation events.
Atmosphere 07 00140 g003
Figure 4. WIOC (a) and EC (b) concentrations in precipitation in Xiamen Island during the study period.
Atmosphere 07 00140 g004
Figure 5. Relationships between the carbonaceous particle concentration in the rainwater and the precipitation amount of: (a) WIOC; and (b) EC.
Atmosphere 07 00140 g005
Figure 6. EC and WIOC daily wet deposition flux at Xiamen during the sampling period.
Atmosphere 07 00140 g006
Table 1. Seasonal average and range of EC, WIOC and WITC in precipitation at Xiamen Island in 2014.
SeasonnEC/μgC·L−1WIOC/μgC·L−1WITC/μgC·L−1
AverageRangeAverageRangeAverageRange
Spring2011.6 ± 21.60.0–90.5597.3 ± 745.974.2–2972.9608.9 ± 742.874.5–2974.9
Summer130.6 ± 0.60.0–2.6338.28 ± 242.697.3–784.9338.9 ± 242.797.6–785.0
Total337.3 ± 17.50.0–90.5495.3 ± 607.474.2–2972.9502.6 ± 606.374.5–2974.9
Note: the precipitation collected in spring only included April and May.
Table 2. Monthly wet deposition fluxes of EC, WIOC and WITC at Xiamen.
MonthWet Deposition/mgC·m−2·month−1
ECWIOCWITC
April1.814.015.8
May0.763.163.8
June0.147.847.9
July0.114.614.7
August0.243.944.1
Average0.636.737.3

