Article

Assessment of Community Exposure to Ambient Respirable Crystalline Silica near Frac Sand Processing Facilities

Air Control Techniques, P.C., 301 East Durham Road, Cary, NC 27513, USA
*
Author to whom correspondence should be addressed.
Atmosphere 2015, 6(8), 960-982; https://doi.org/10.3390/atmos6080960
Submission received: 16 June 2015 / Revised: 1 July 2015 / Accepted: 3 July 2015 / Published: 24 July 2015

Abstract

:
Due the rapid expansion of frac sand production, local residents, community leaders, and state regulatory authorities have expressed concerns regarding the lack of ambient respirable crystalline silica concentration data for areas near to these facilities. Long-term average data are needed to compare the fence line concentrations against chronic reference exposure guidelines such as the one adopted by the California Office of Environmental Health Hazard Assessment (OEHHA). This paper provides comprehensive sets of 24 h respirable crystalline silica concentration measurements compiled during multi-year sampling programs at the fence lines of four Wisconsin facilities—three frac sand mines and one frac sand processing plant. The authors adapted Environmental Protection Agency (EPA) reference method PM2.5 filter-based samplers to provide respirable (PM4) filter samples. Crystalline silica content of the PM4 particulate matter samples was measured using National Institute of Occupational Safety and Health (NIOSH) Method 7500 X-ray diffraction. The respirable crystalline silica limit of quantification was 0.31 µg/m3. The geometric mean (GM) respirable crystalline silica concentrations at the fence lines of the frac sand-producing facilities were less than 10% of the 3.0 µg/m3 California OEHHA chronic exposure level and were consistent with background concentrations throughout the upper Midwest of the U.S.

1. Introduction

OEHHA has adopted a 70-year chronic reference exposure level (REL) for ambient respirable (PM4) crystalline silica [1]. OEHHA based the REL on an extrapolation of occupational hygiene epidemiological studies, most of which used in-plant PM4 crystalline silica (The terms respirable crystalline silica and PM4 crystalline silica are used interchangeably in this paper and are consistent with common terminology in crystalline silica occupational hygiene literature) measurements. OEHHA defined the REL as an ambient concentration below which adverse, non-cancer health effects are not anticipated.
In 2005, when OEHHA published the ambient respirable crystalline silica REL, no technique for direct measurement was available. The personal samplers used for in-plant worker monitoring could not be adapted for the lower concentrations present in ambient air. To help compile data for direct comparison to the OEHHA REL, Richards and Brozell [2] developed an ambient PM4 crystalline silica sampling method that combined the high volume sampling capability of PM2.5 reference method samplers meeting the requirements of 40 CFR Part 50, Appendix L [3] with the sensitive crystalline silica analytical capabilities provided by the X-ray diffraction (XRD) analysis procedures in NIOSH Method 7500 [4]. The necessary sample flow rate to achieve a 50% cut size at four micrometers was determined to be 11.1 liters per minute based on a series of tests challenging a sharp cut cyclone equipped Rupprecht-Patashnick PM2.5 sampler (now sold under the trade name Partisol 2000i) with National Institute of Standards and Technology (NIST) traceable monodisperse microspheres.
The 50% cut point at 11.1 liters per minute sample flow rate is consistent with the 50% cut size of NIOSH Method 0600 used for industrial hygiene sampling. The sharpness of the size-efficiency curve for the modified PM2.5 filter samplers is also similar to NIOSH Method 0600 [5]. Accordingly, ambient respirable crystalline silica concentration data measured using this new method are comparable to data from health effects research studies conducted using NIOSH 0600 sampling procedures and NIOSH 7500 analytical procedures.
This new ambient sampling method provided a limit of quantification (LOQ) of 0.31 µg/m3 based on (1) a sample volume of 15.98 m3 over a 24 h sampling period and (2) a Method 7500 X-ray diffraction detection limit of 5 µg. This respirable crystalline silica measurement LOQ is approximately 10% of the California REL of 3.0 µg/m3.
This sampling and analytical approach provides a direct measurement of crystalline silica in the respirable size range. The method uses readily available commercial equipment that can be easily adapted for PM4 particulate matter sampling by adjusting the sample flow rate and by using polyvinyl chloride (PVC) filter media that are compatible with X-ray diffraction analyses. The well-established quality assurance procedures for operating U.S. EPA reference method PM2.5 filter samplers are directly applicable to an adjusted sampler used for PM4 particulate matter. Furthermore, the ambient data compiled with this measurement method are directly comparable to the extensive health effects database compiled over the past 30 years concerning occupational exposure to respirable crystalline silica.
Richards et al. [6] used this new sampling method to conduct limited sampling for respirable crystalline silica concentrations upwind and downwind of two construction sand and gravel plants in California. The South Coast Air Quality Management District (SCAQMD) [7,8] independently developed a sampling procedure similar to that developed by Richards and Brozell [2]. They used this method to measure respirable crystalline silica concentrations in Duarte, California in response to community concerns regarding respirable crystalline silica from sand and gravel plants and other sources near a school. The respirable crystalline silica sampling approaches developed independently by both Richards and Brozell [2] and the SCAQMD [7,8] provide sensitive techniques for measuring low concentrations in ambient air.
Prior to the start of this sampling program in 2012, very little ambient respirable crystalline silica data were available that were applicable to communities near frac sand-producing facilities. Both the Wisconsin Department of Natural Resources (WDNR) and the Minnesota Pollution Control Agency (MPCA) expressed concerns regarding this lack of relevant exposure data [9,10]. Sand mining and processing plants in Wisconsin decided to apply this new ambient respirable crystalline silica sampling technique to address questions and concerns raised in numerous communities near sand-producing facilities. The study presented in this paper is the first large-scale, long-term application of this measurement method.

2. Methods of Sampling and Analysis

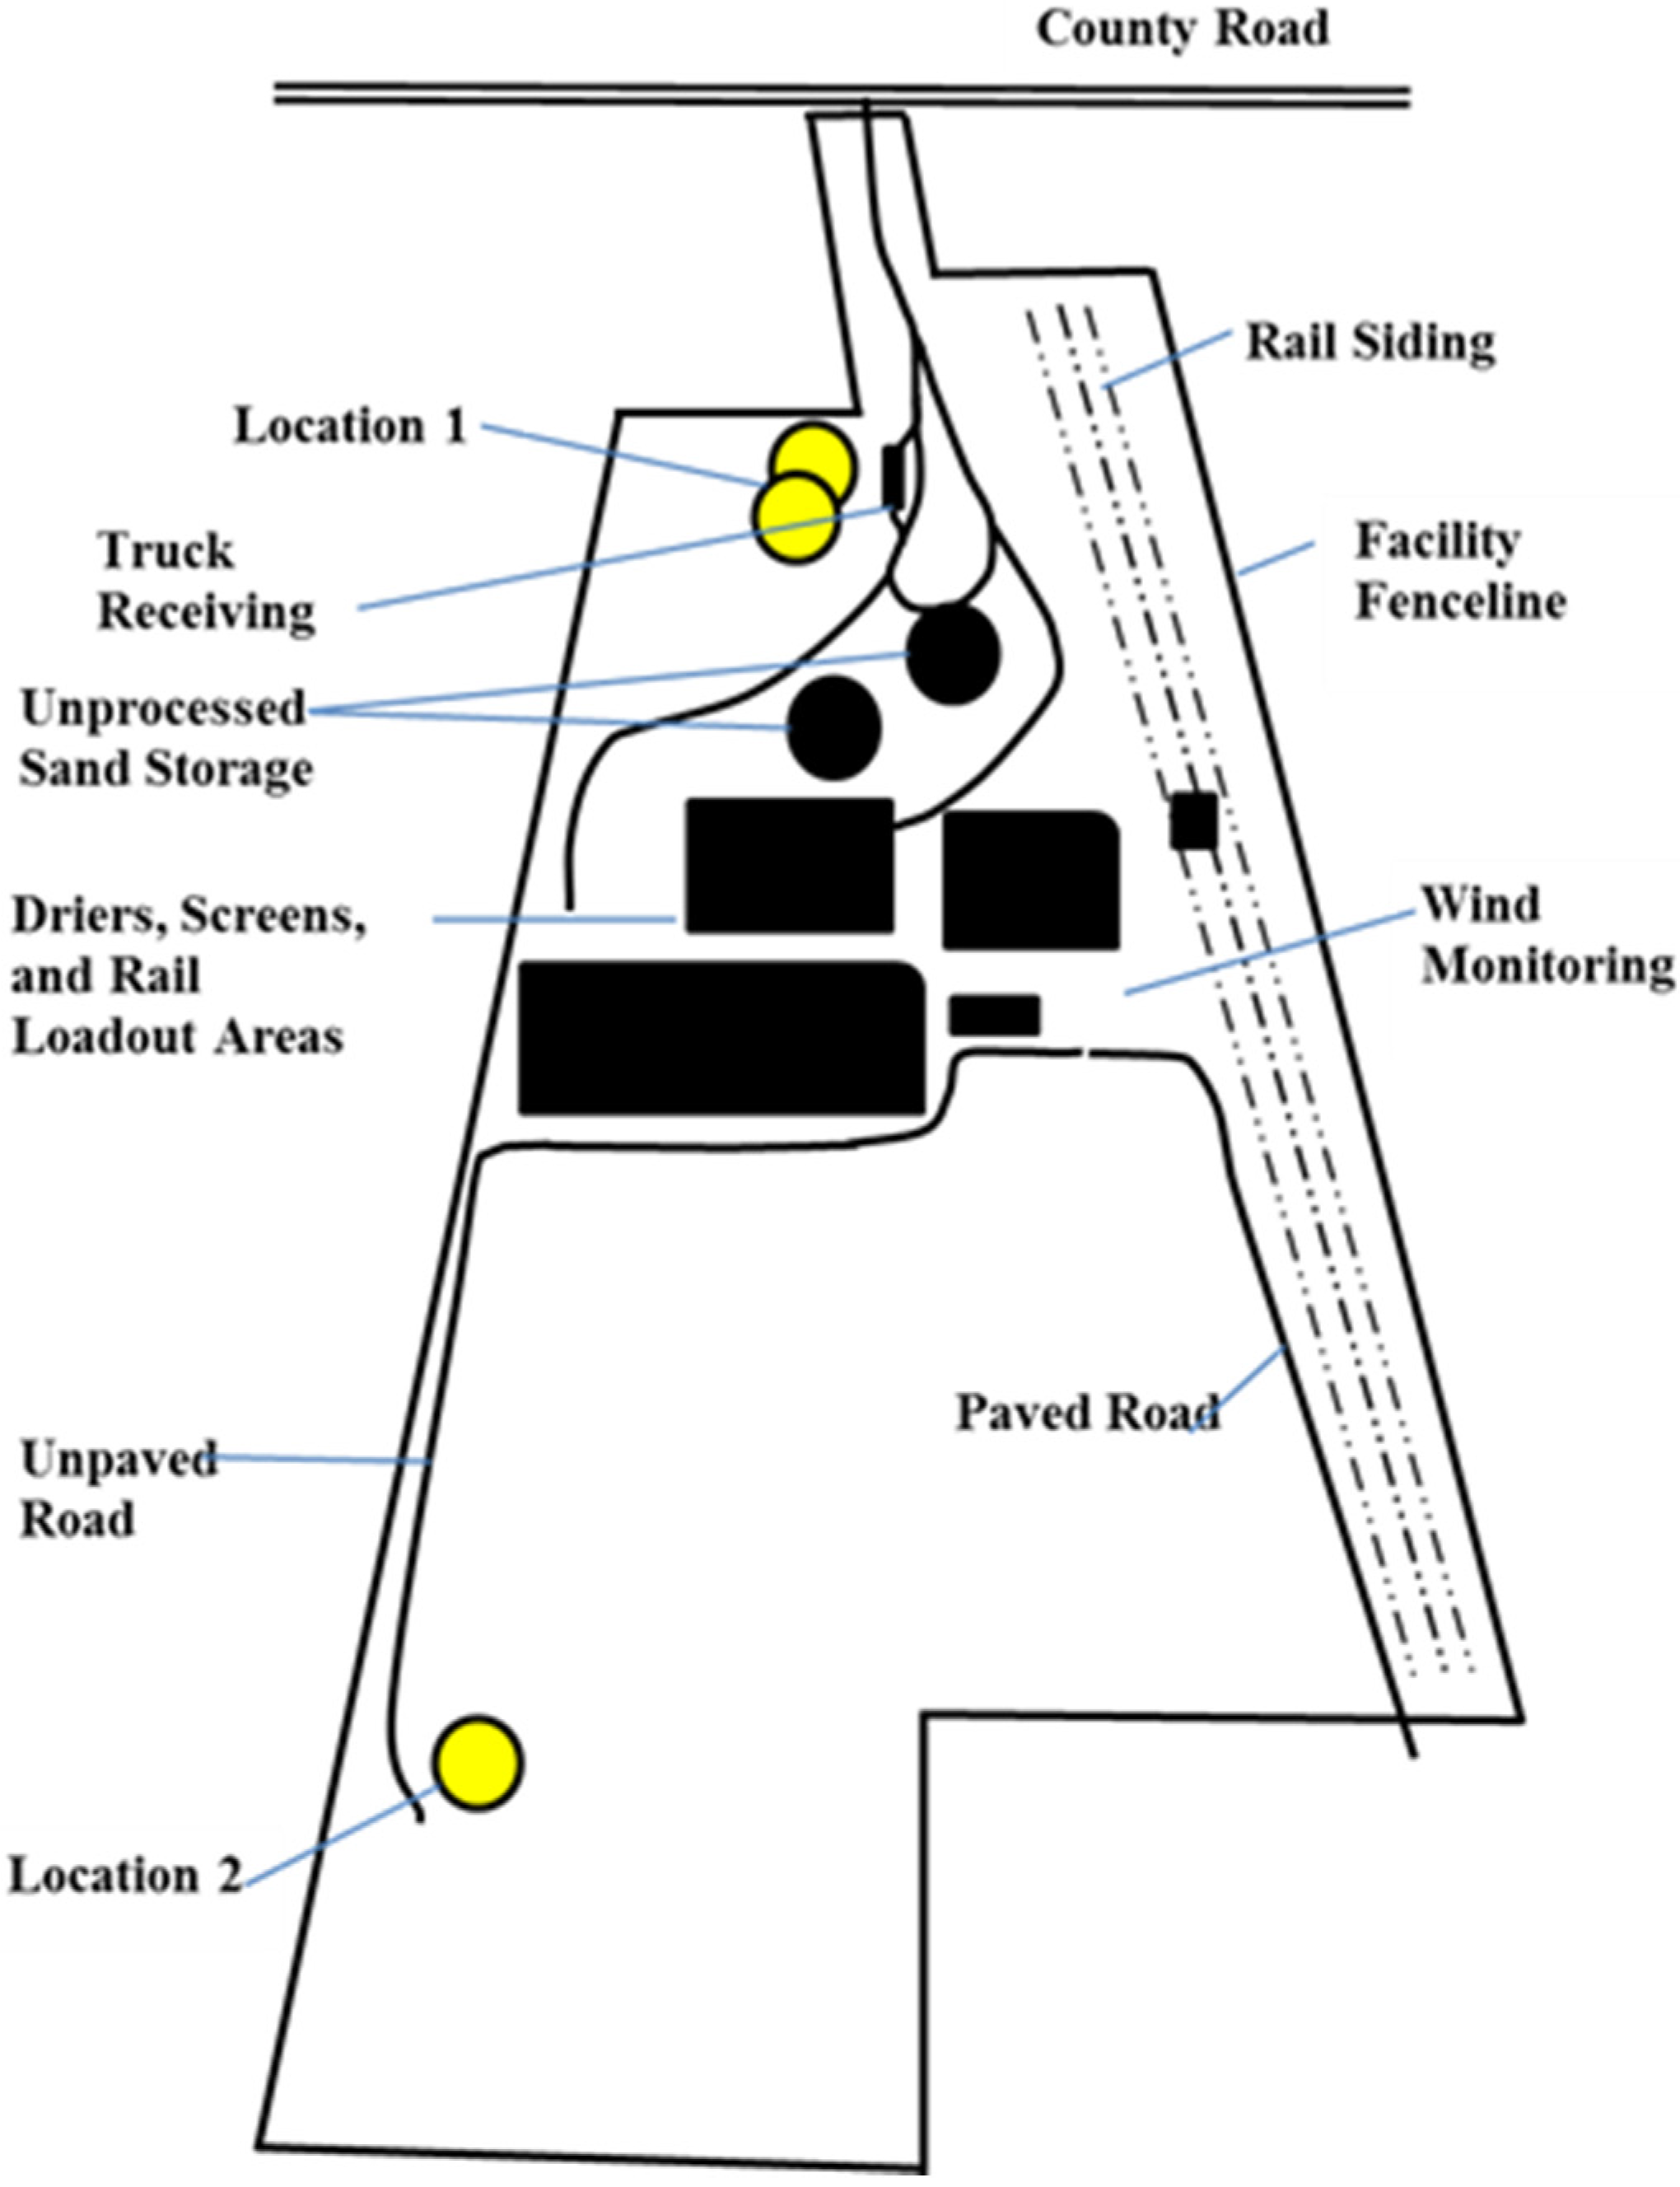
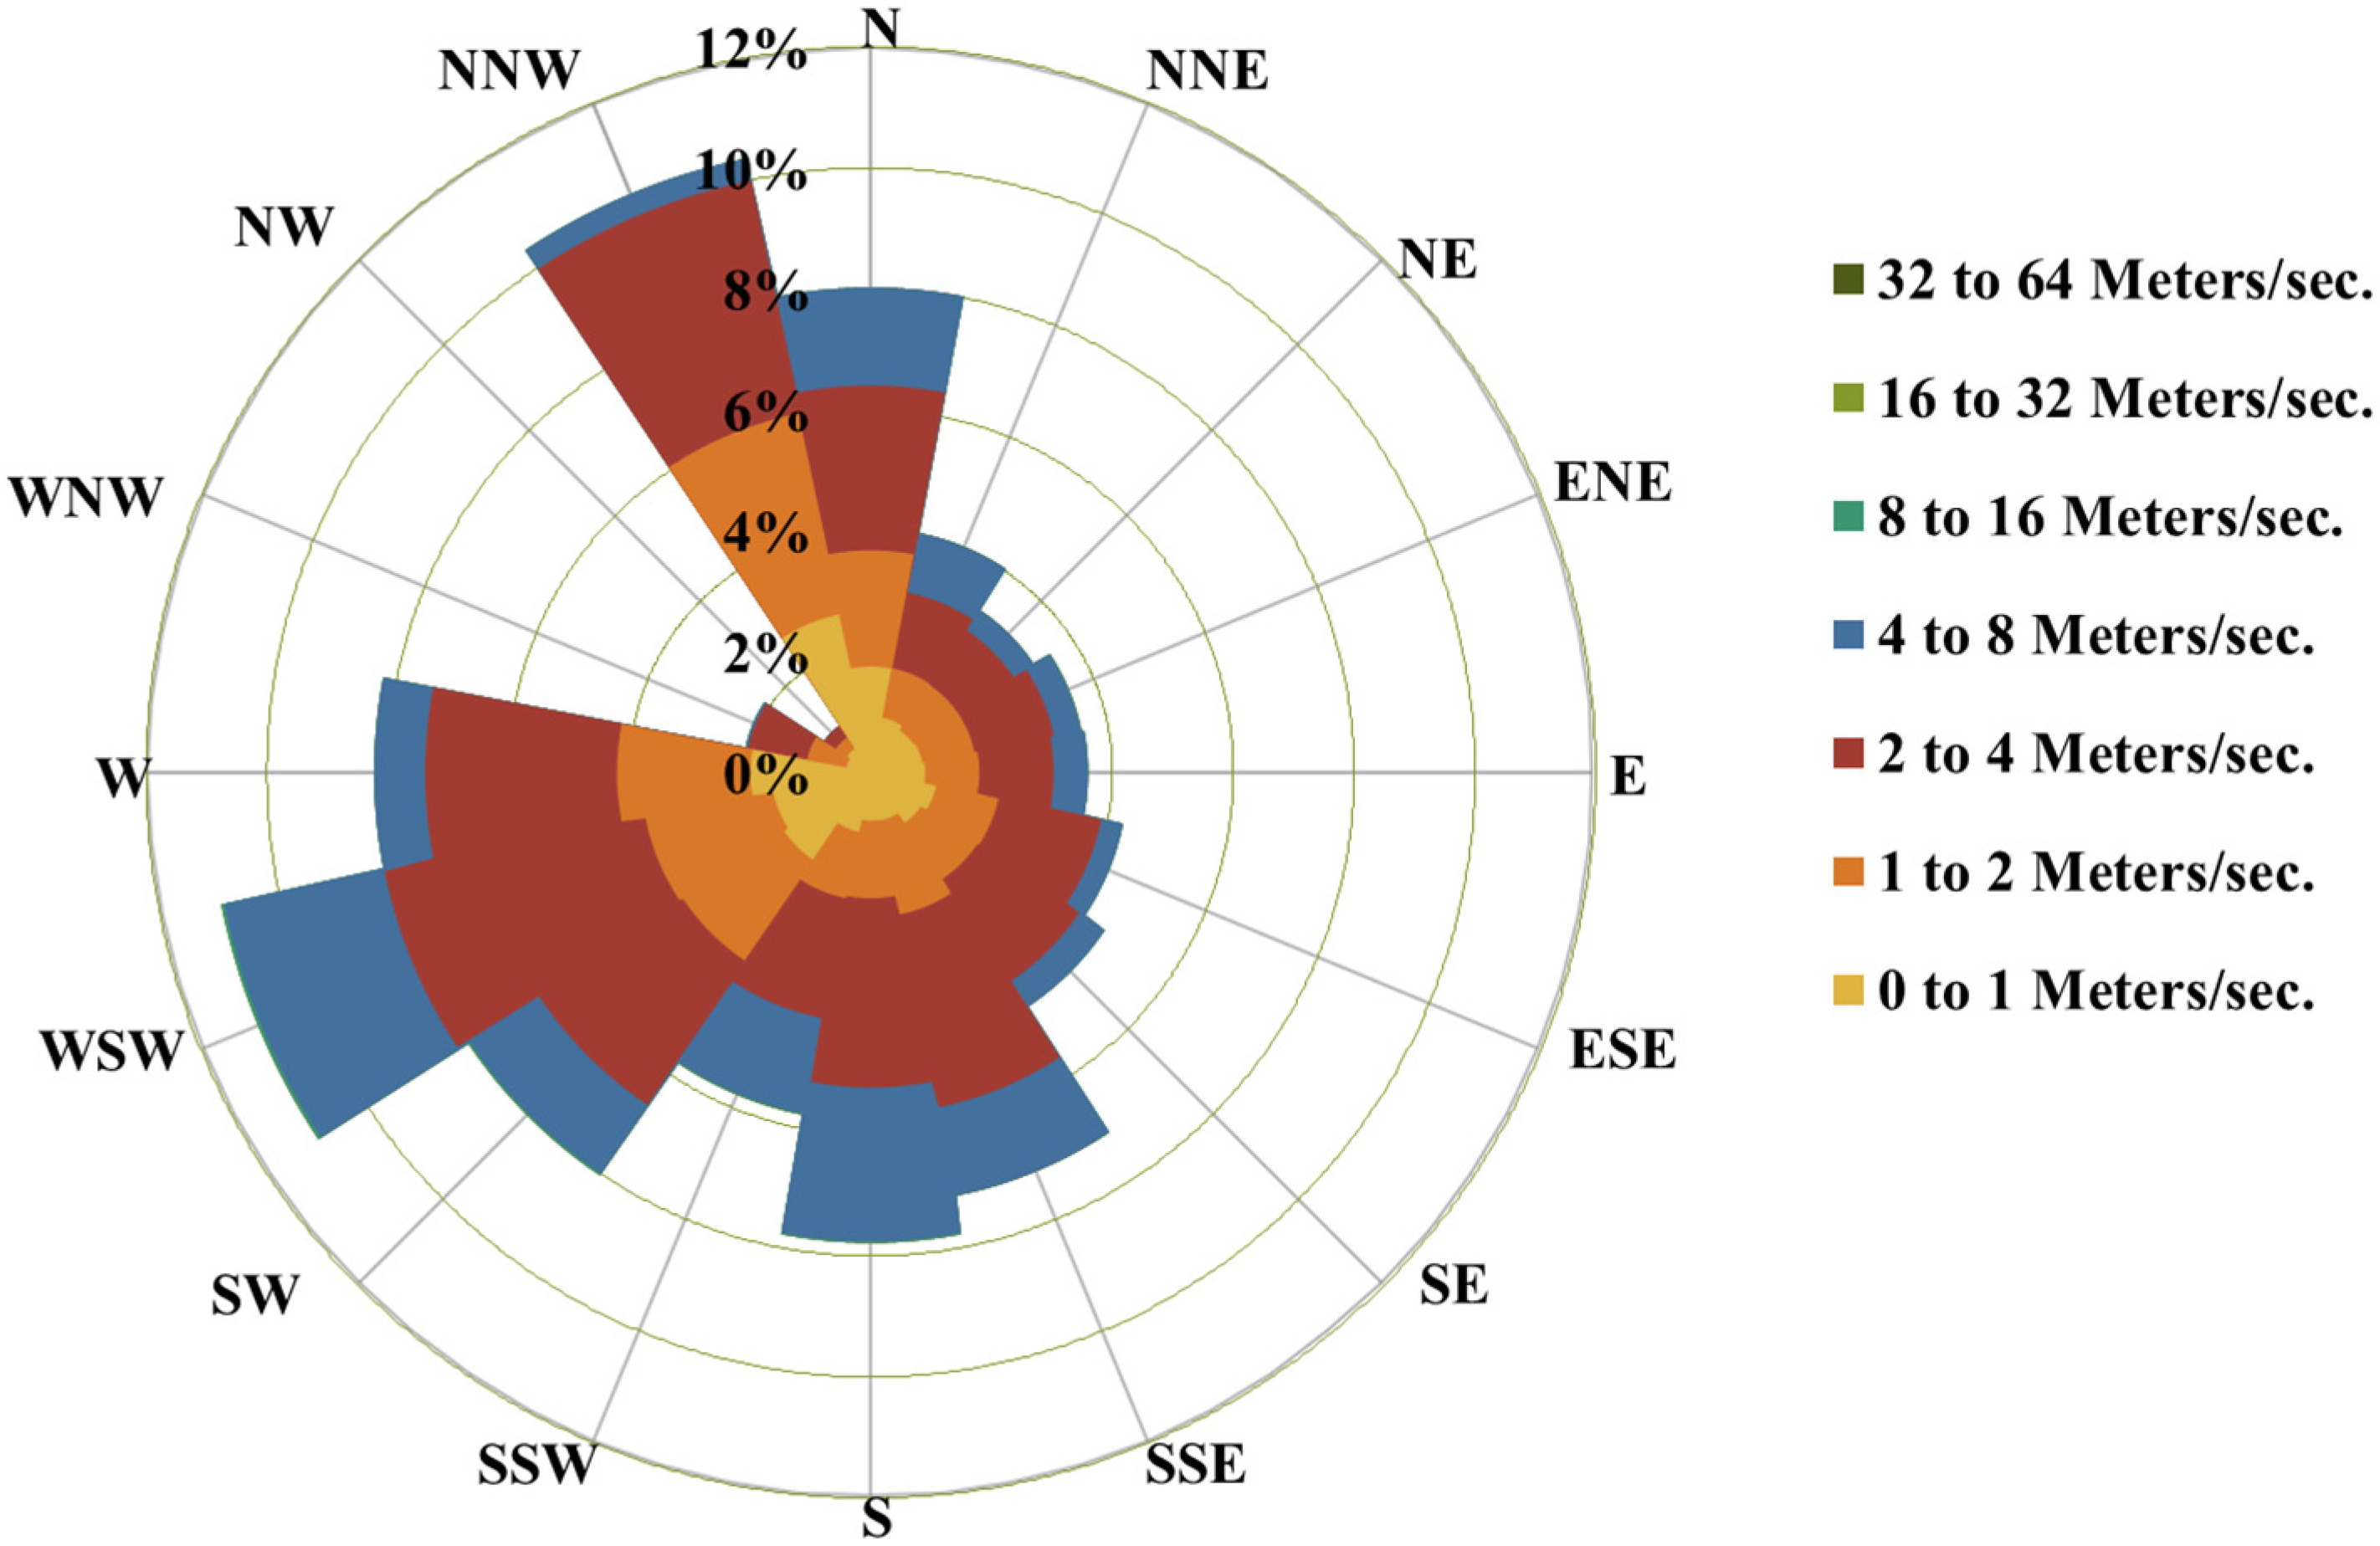
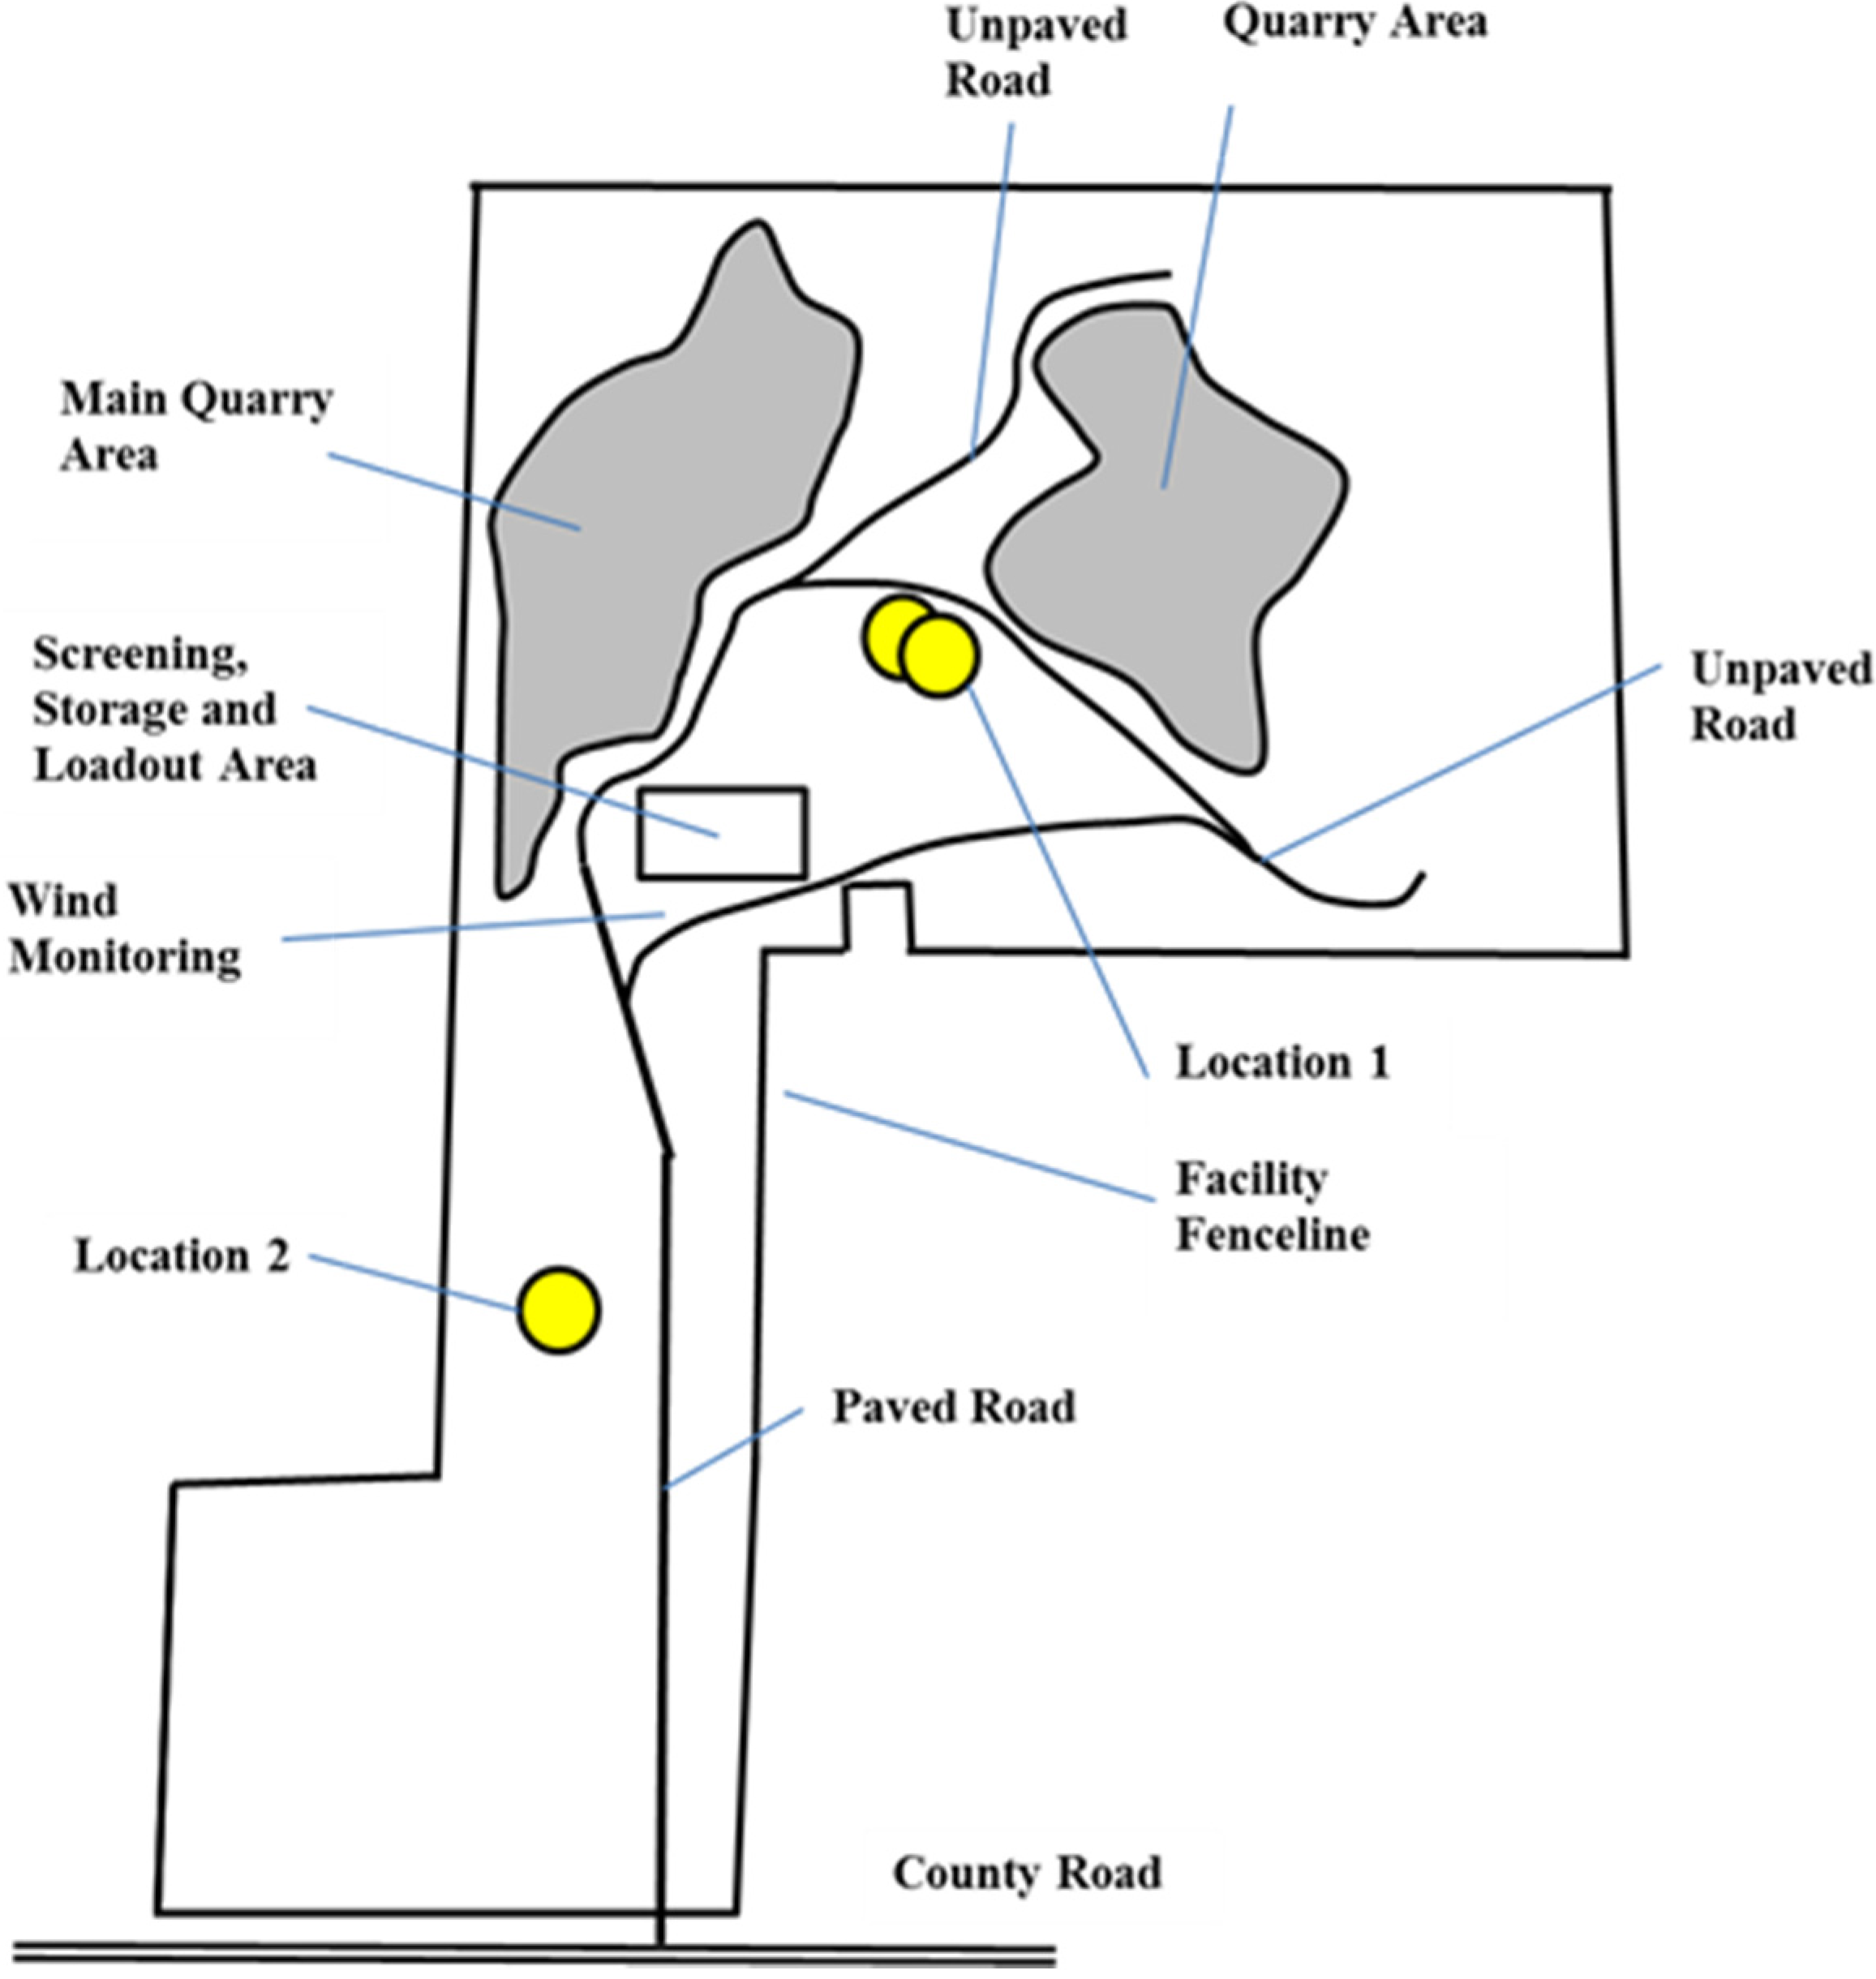
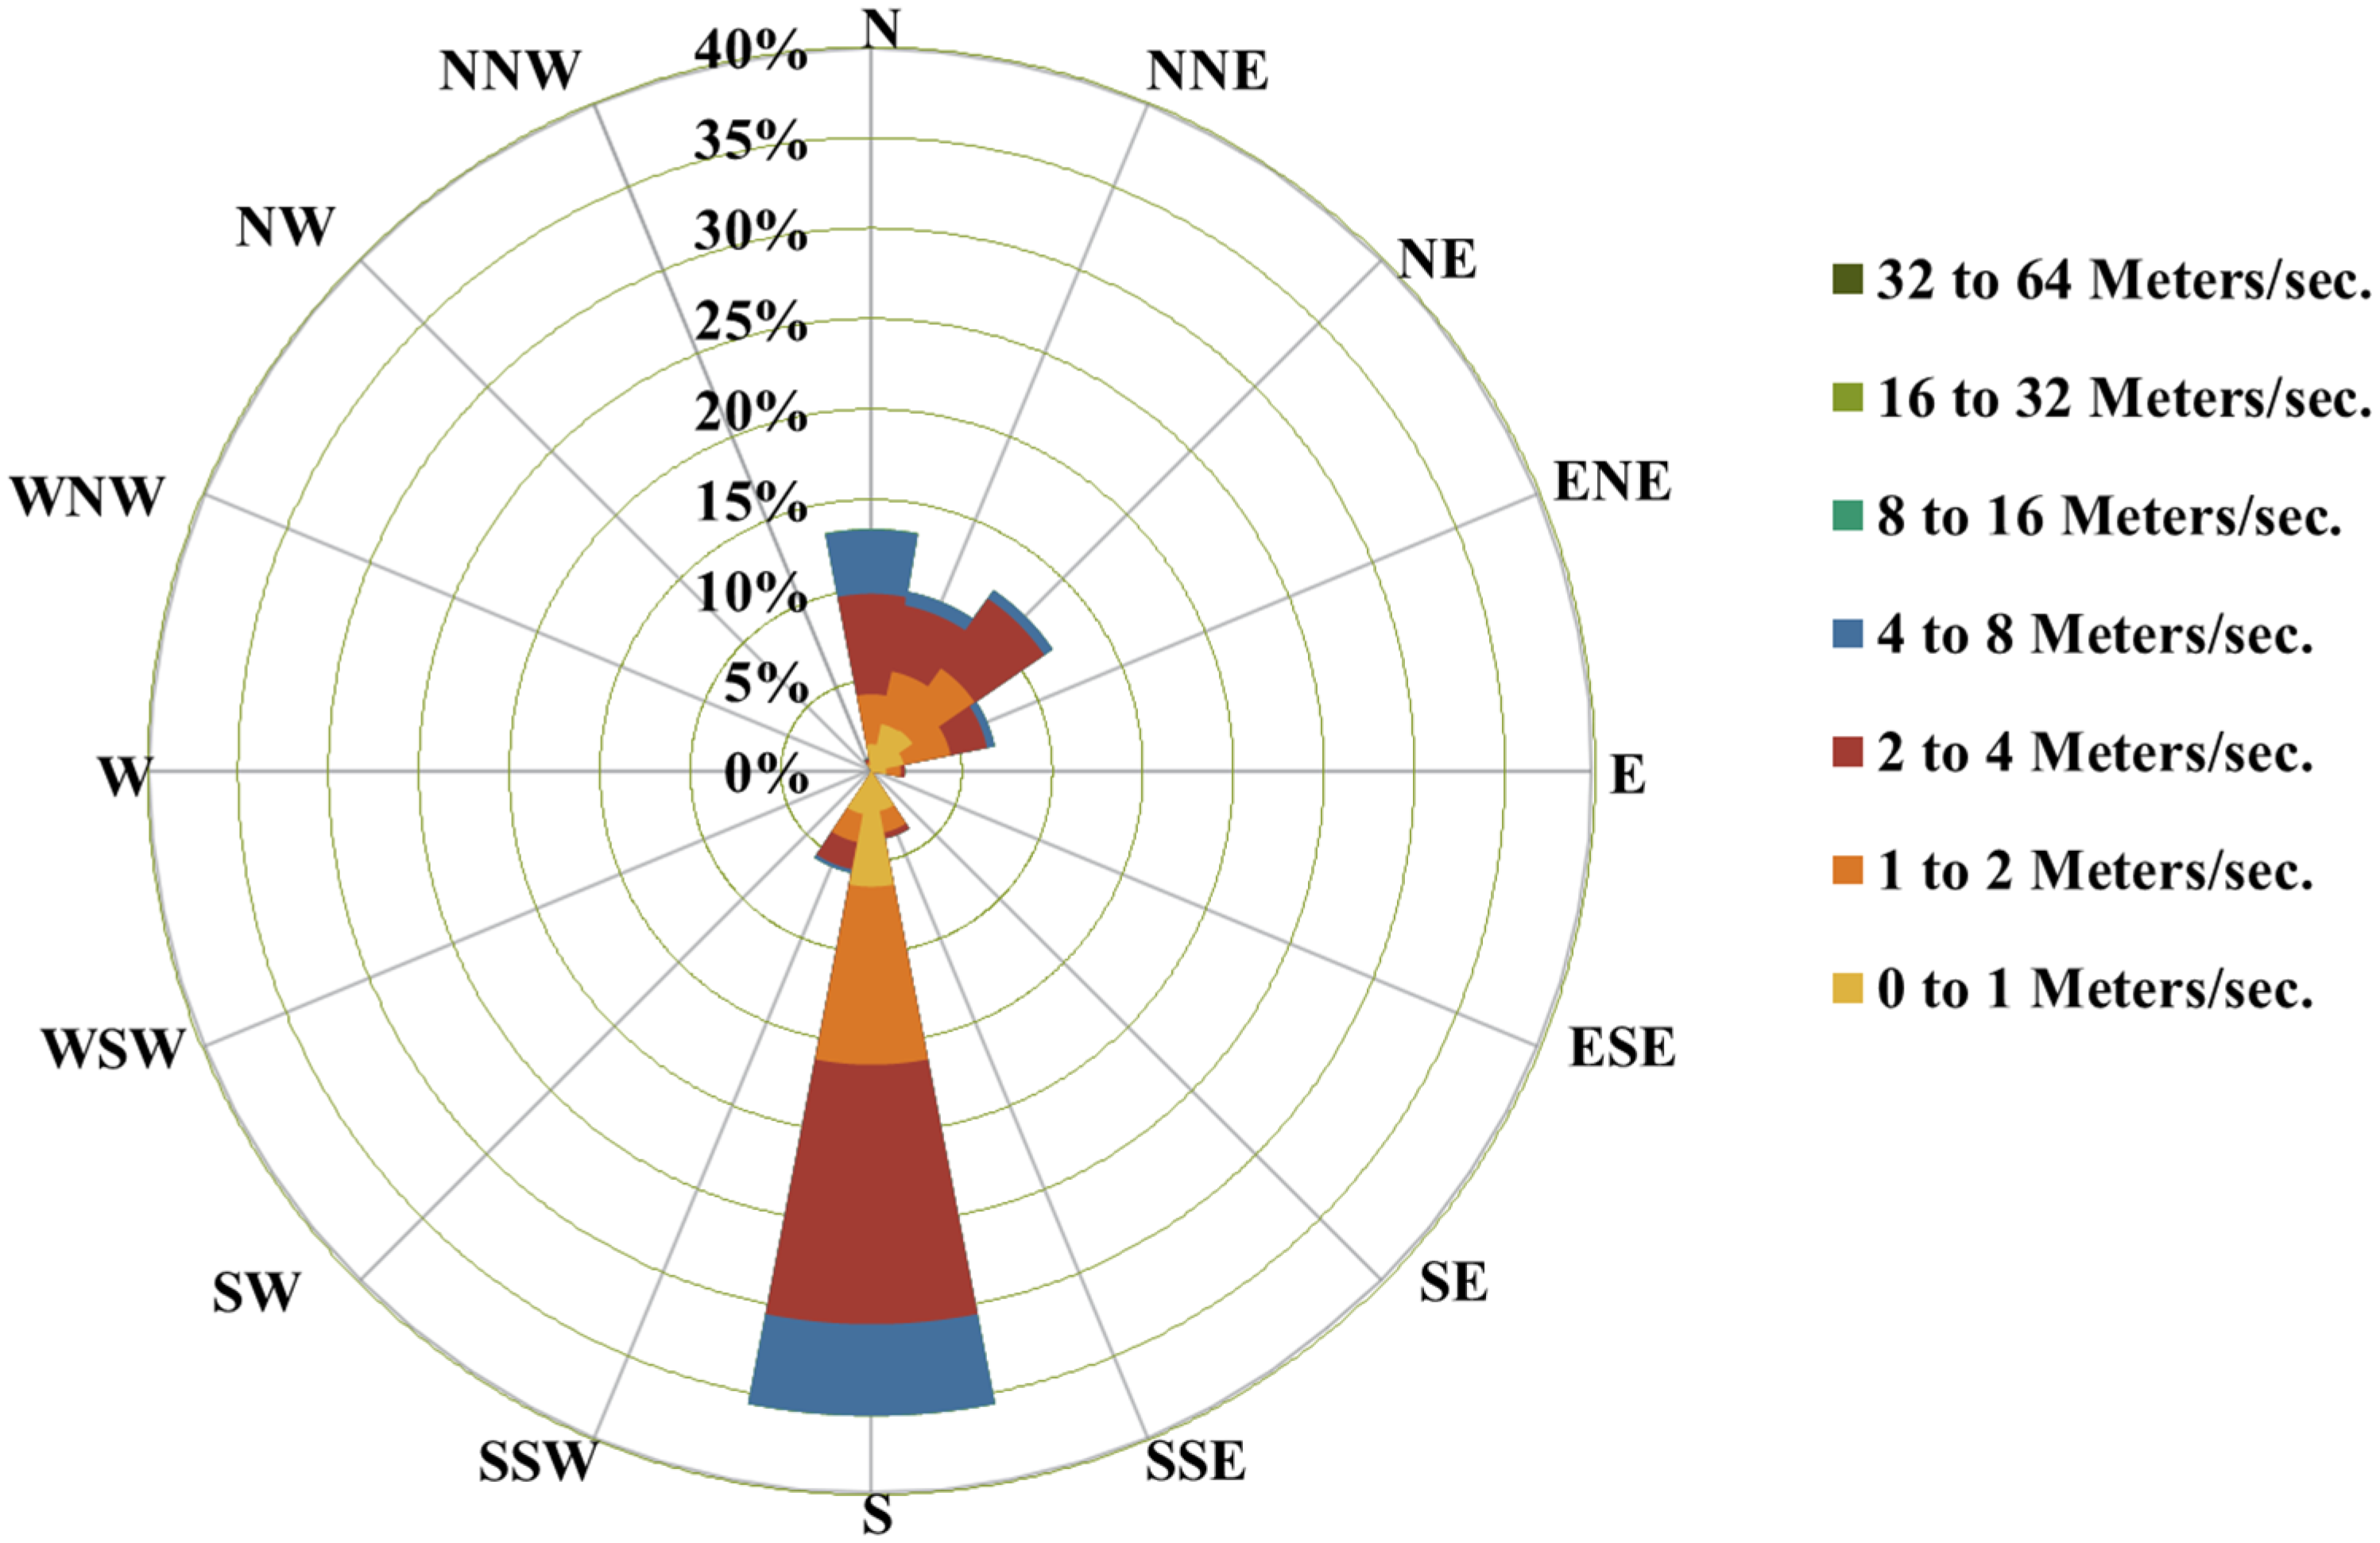
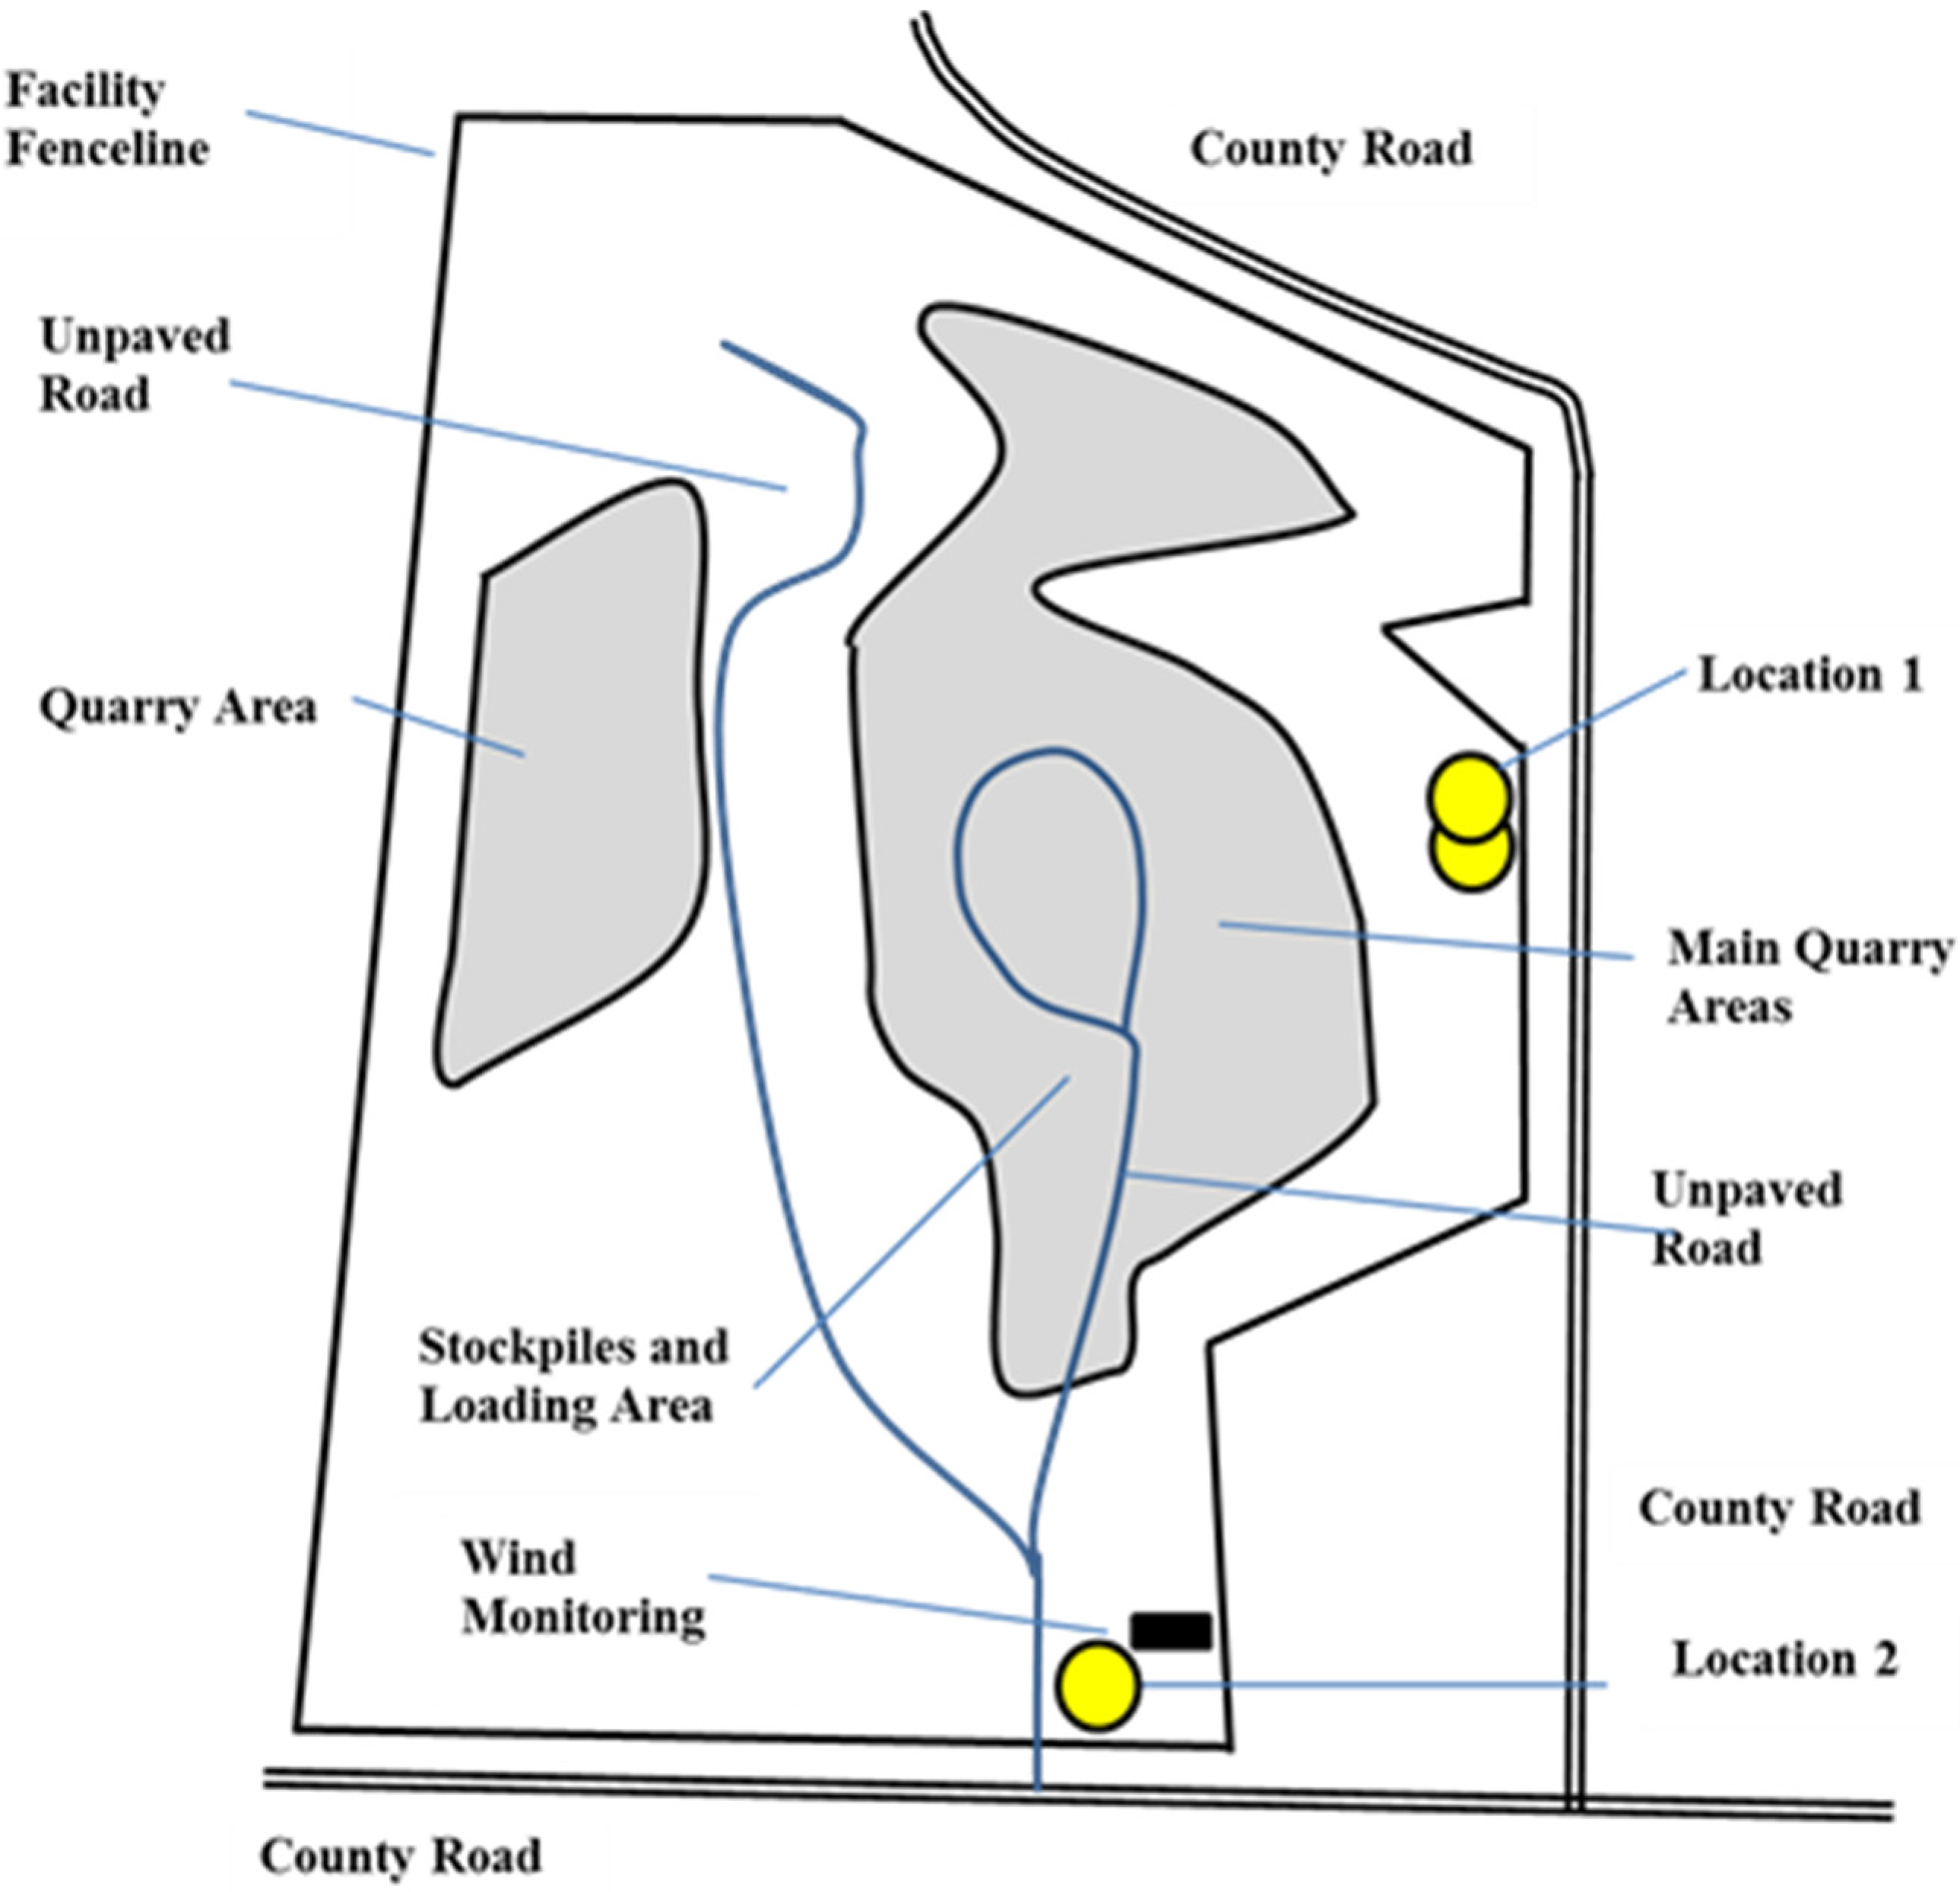
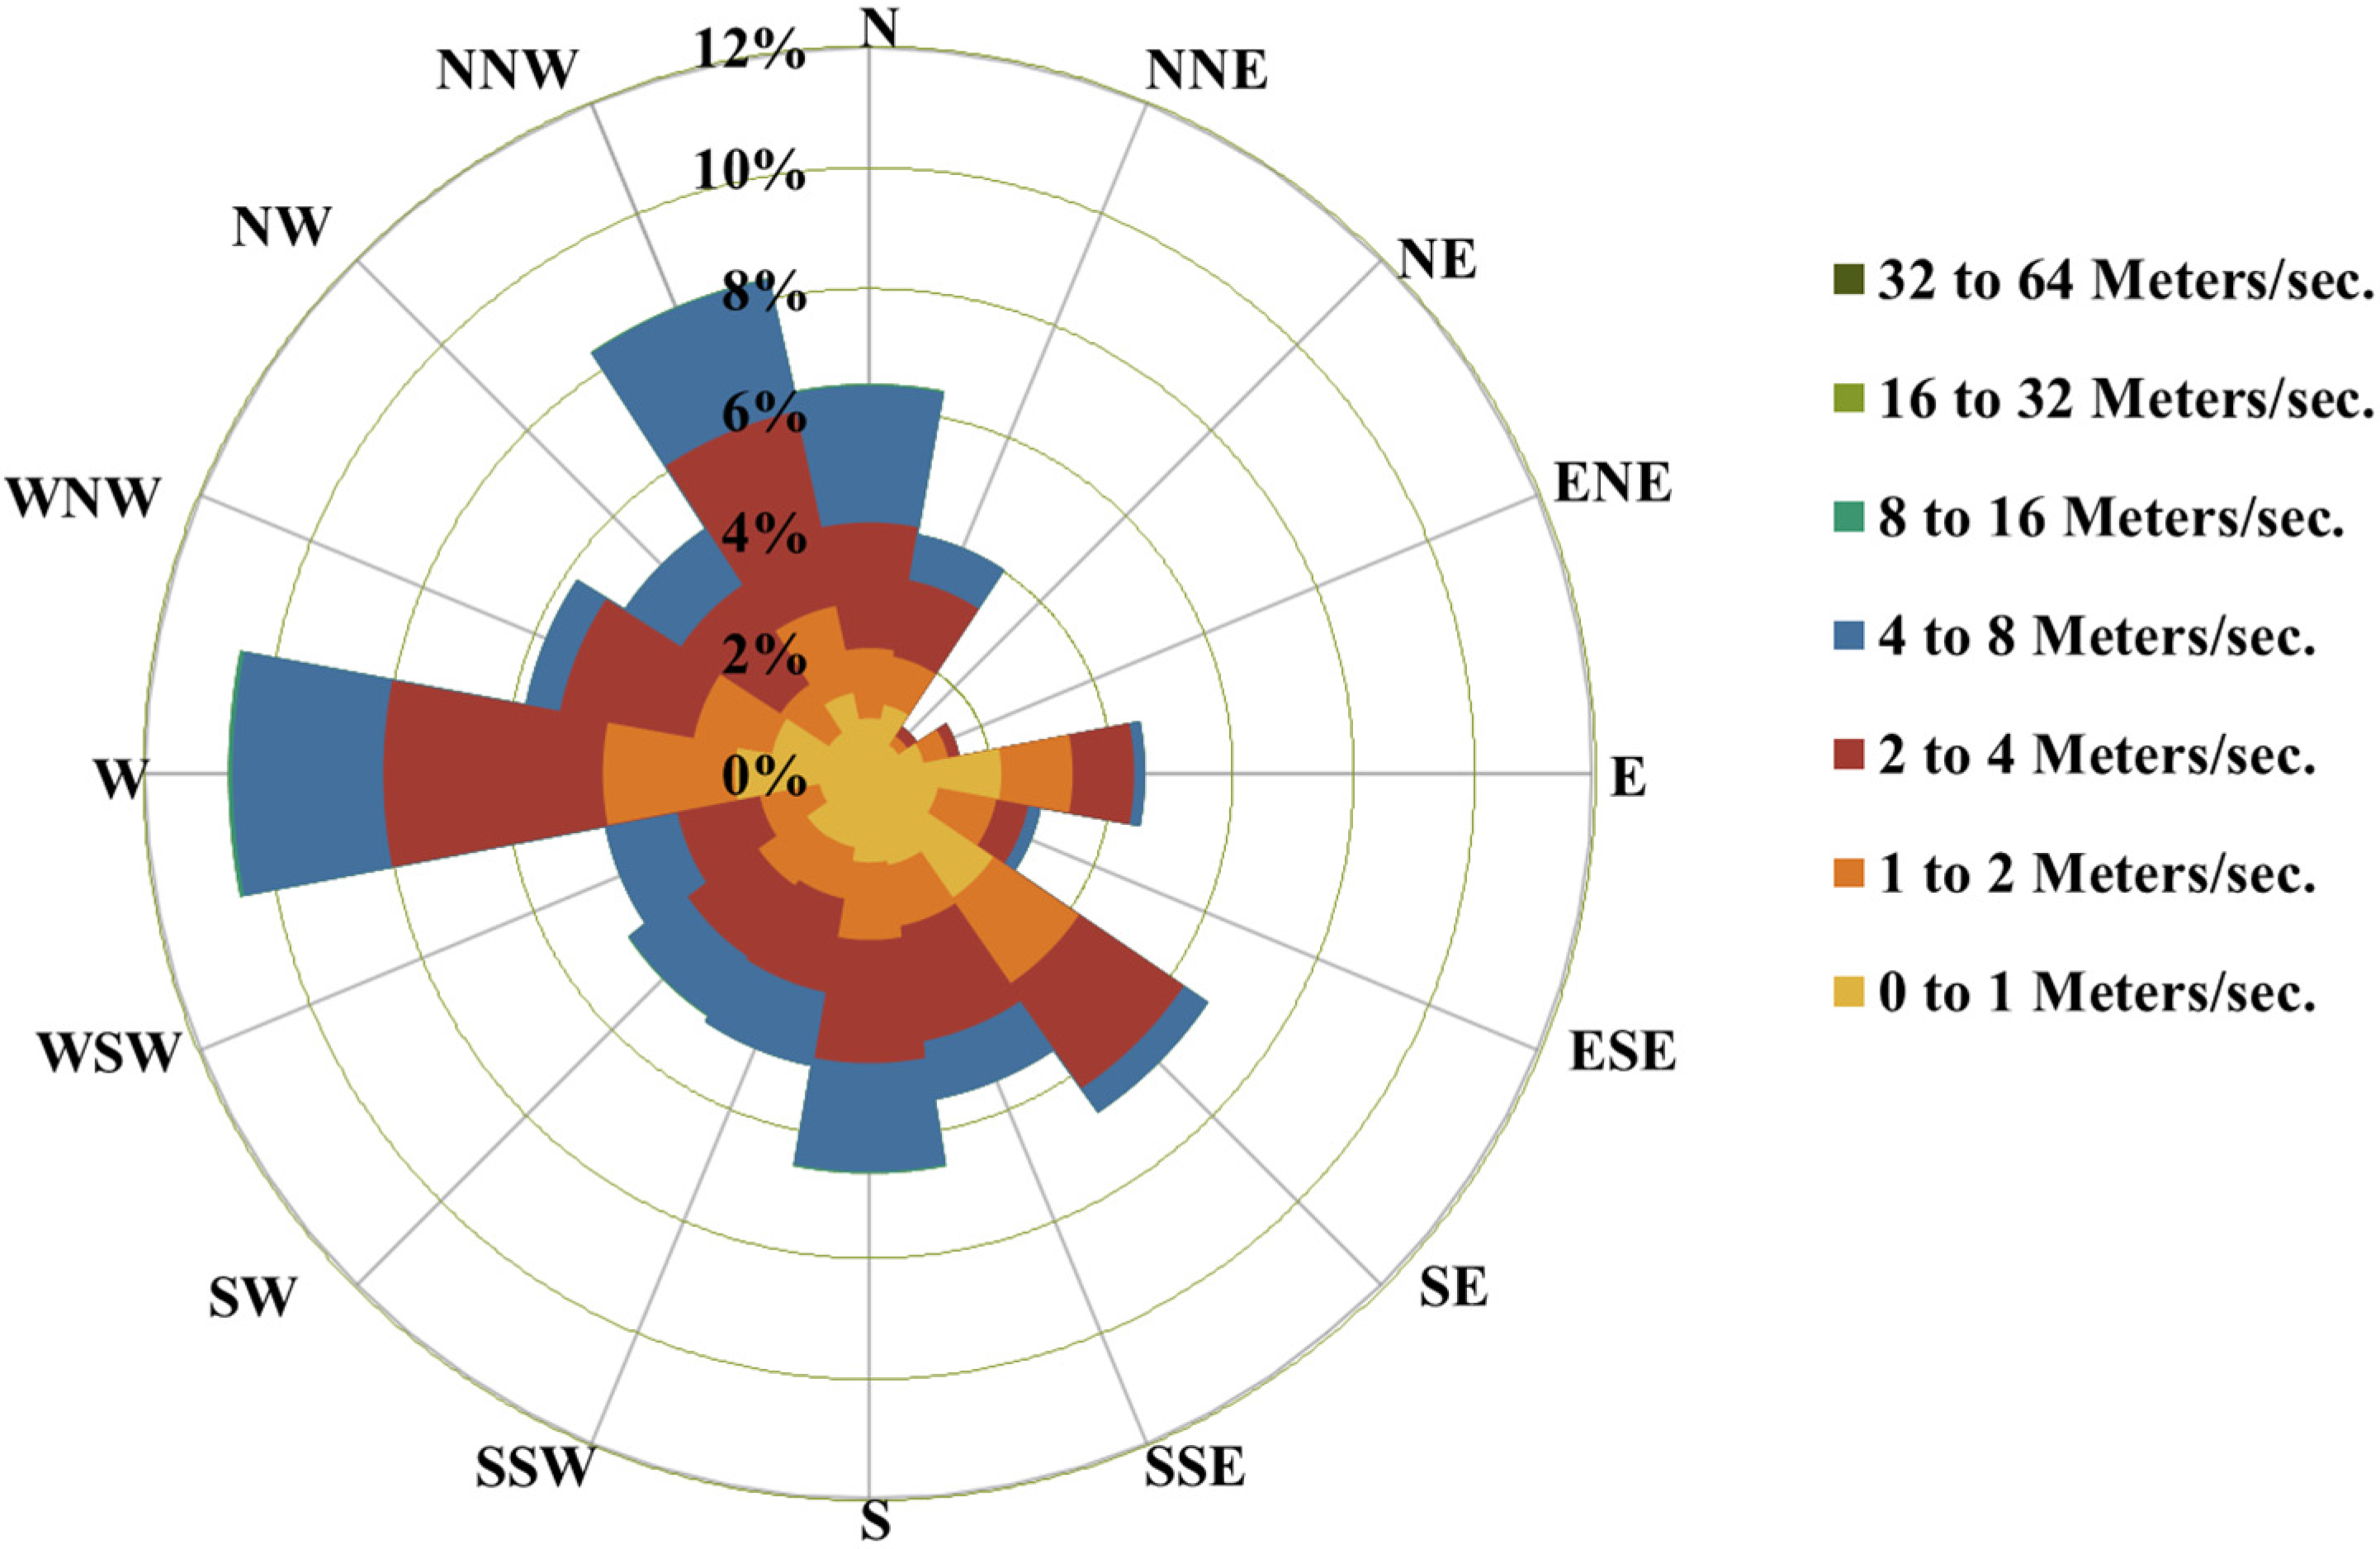
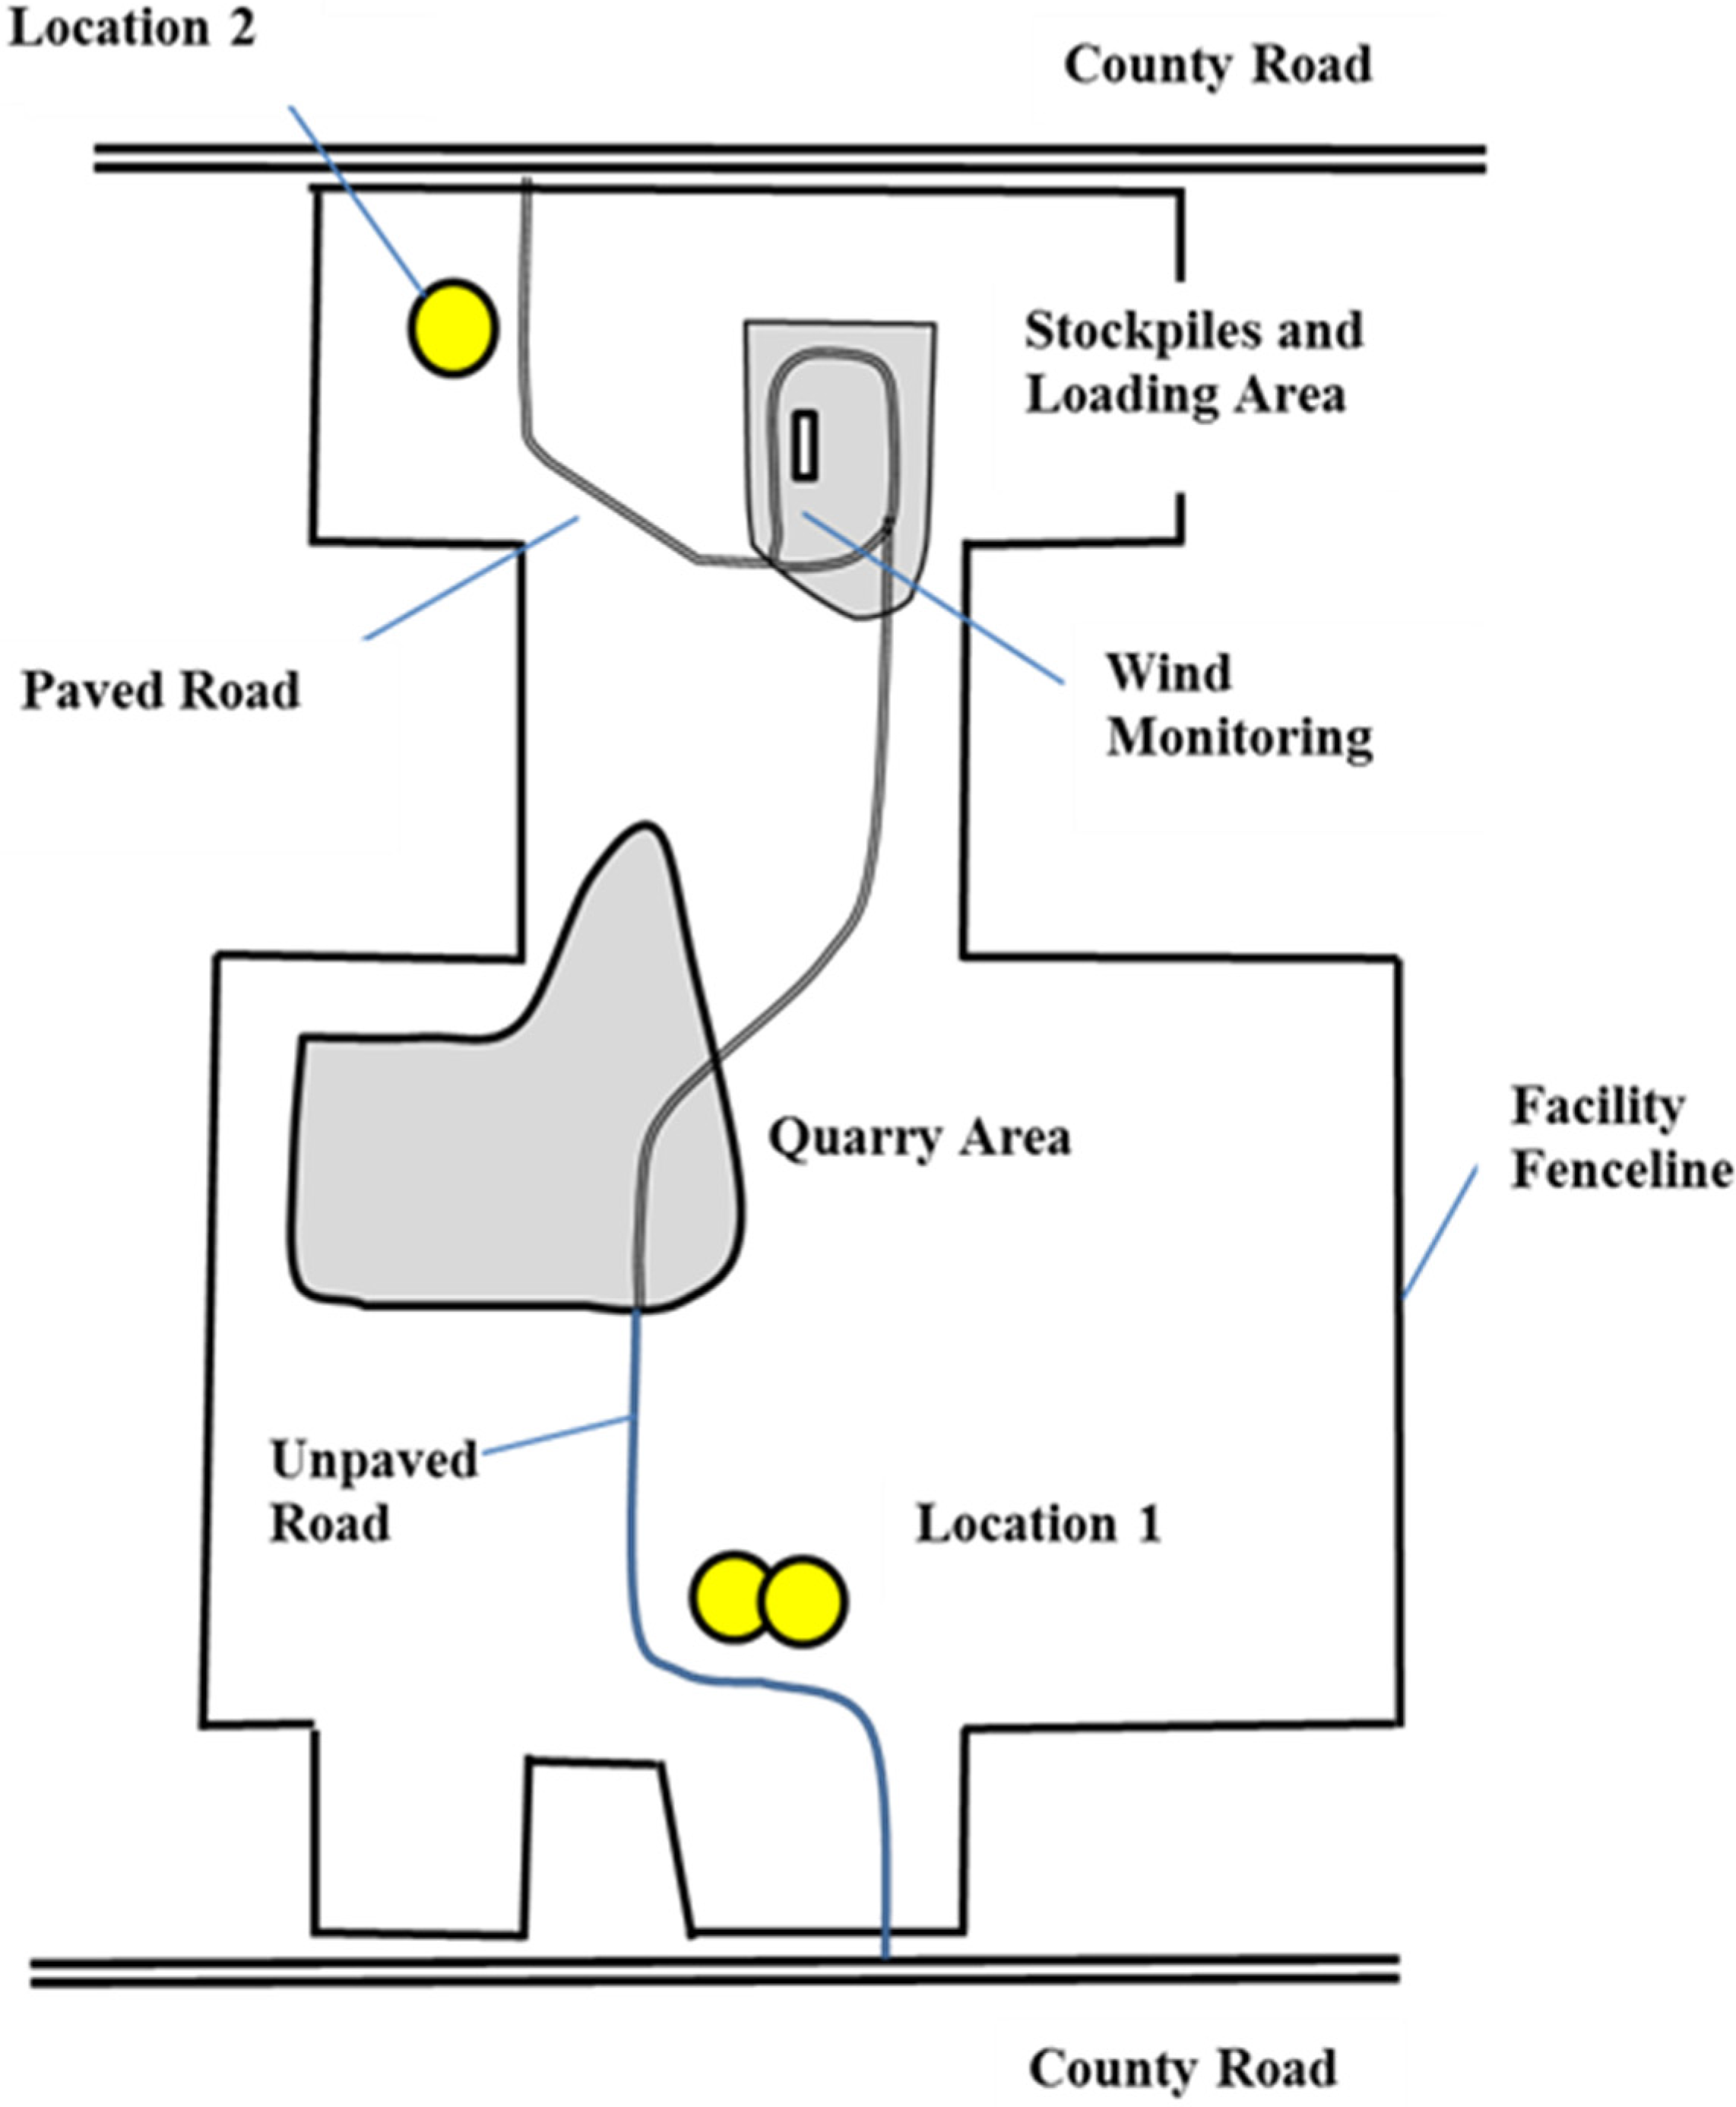
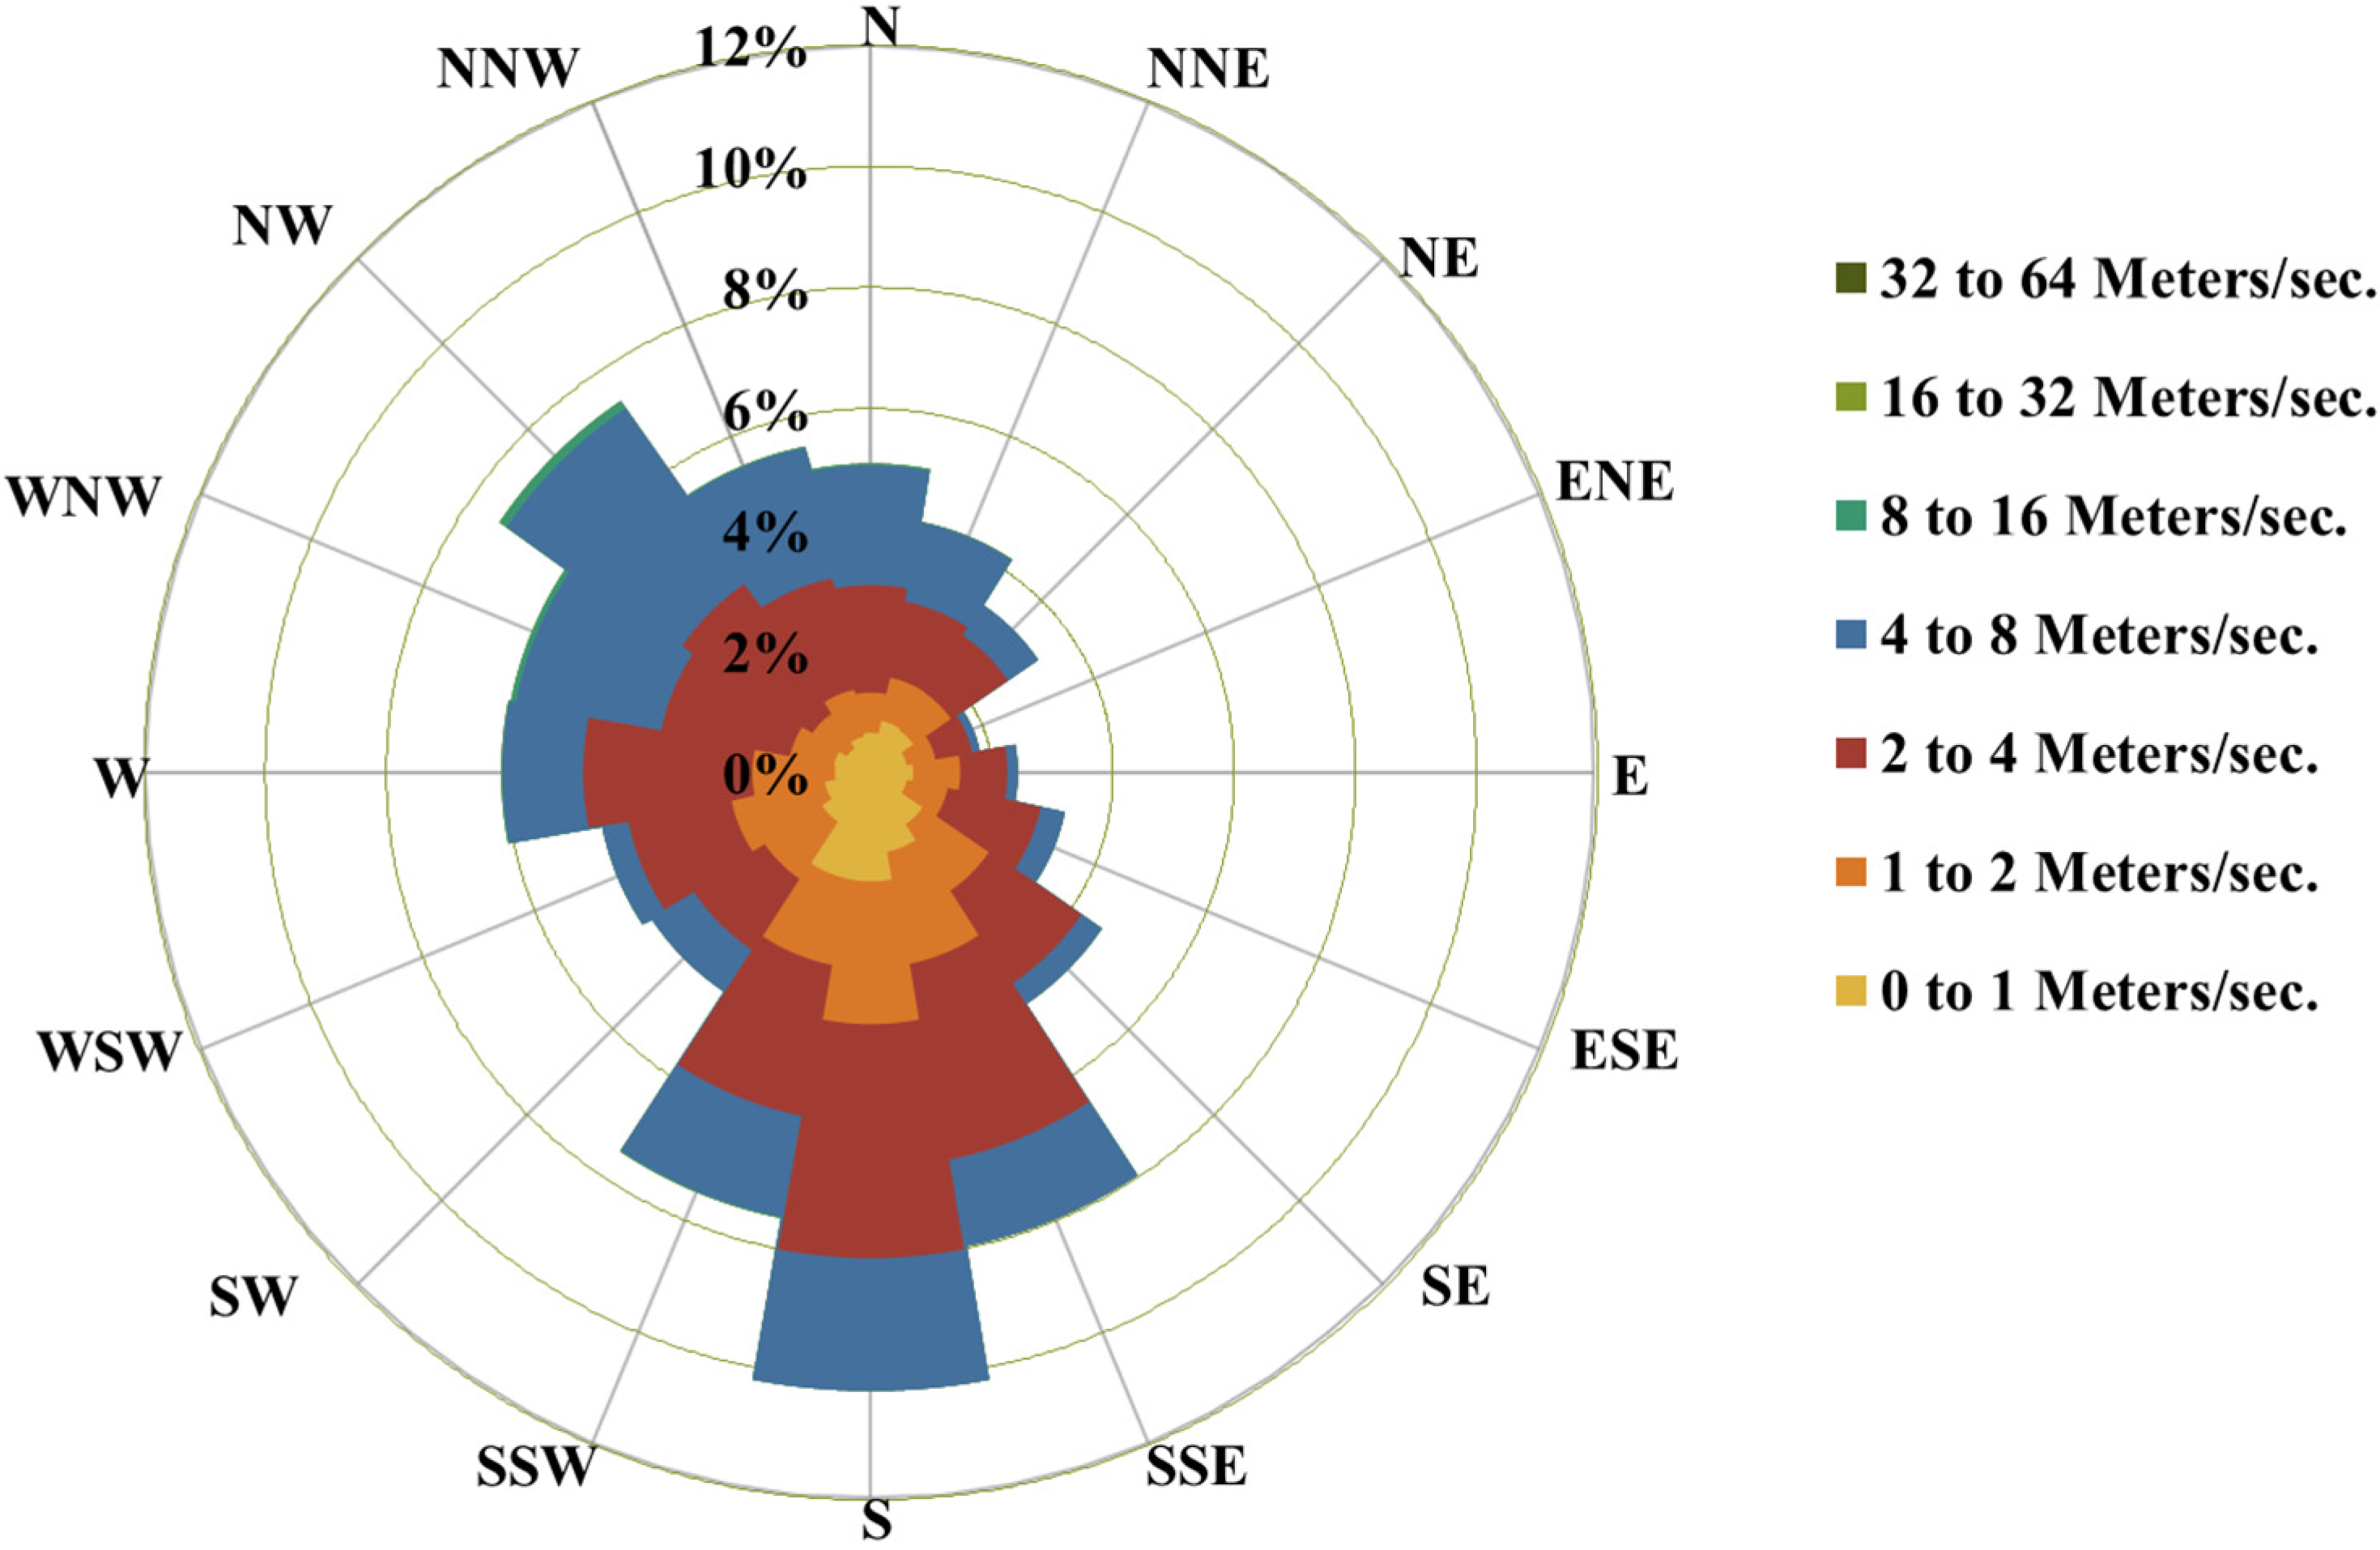
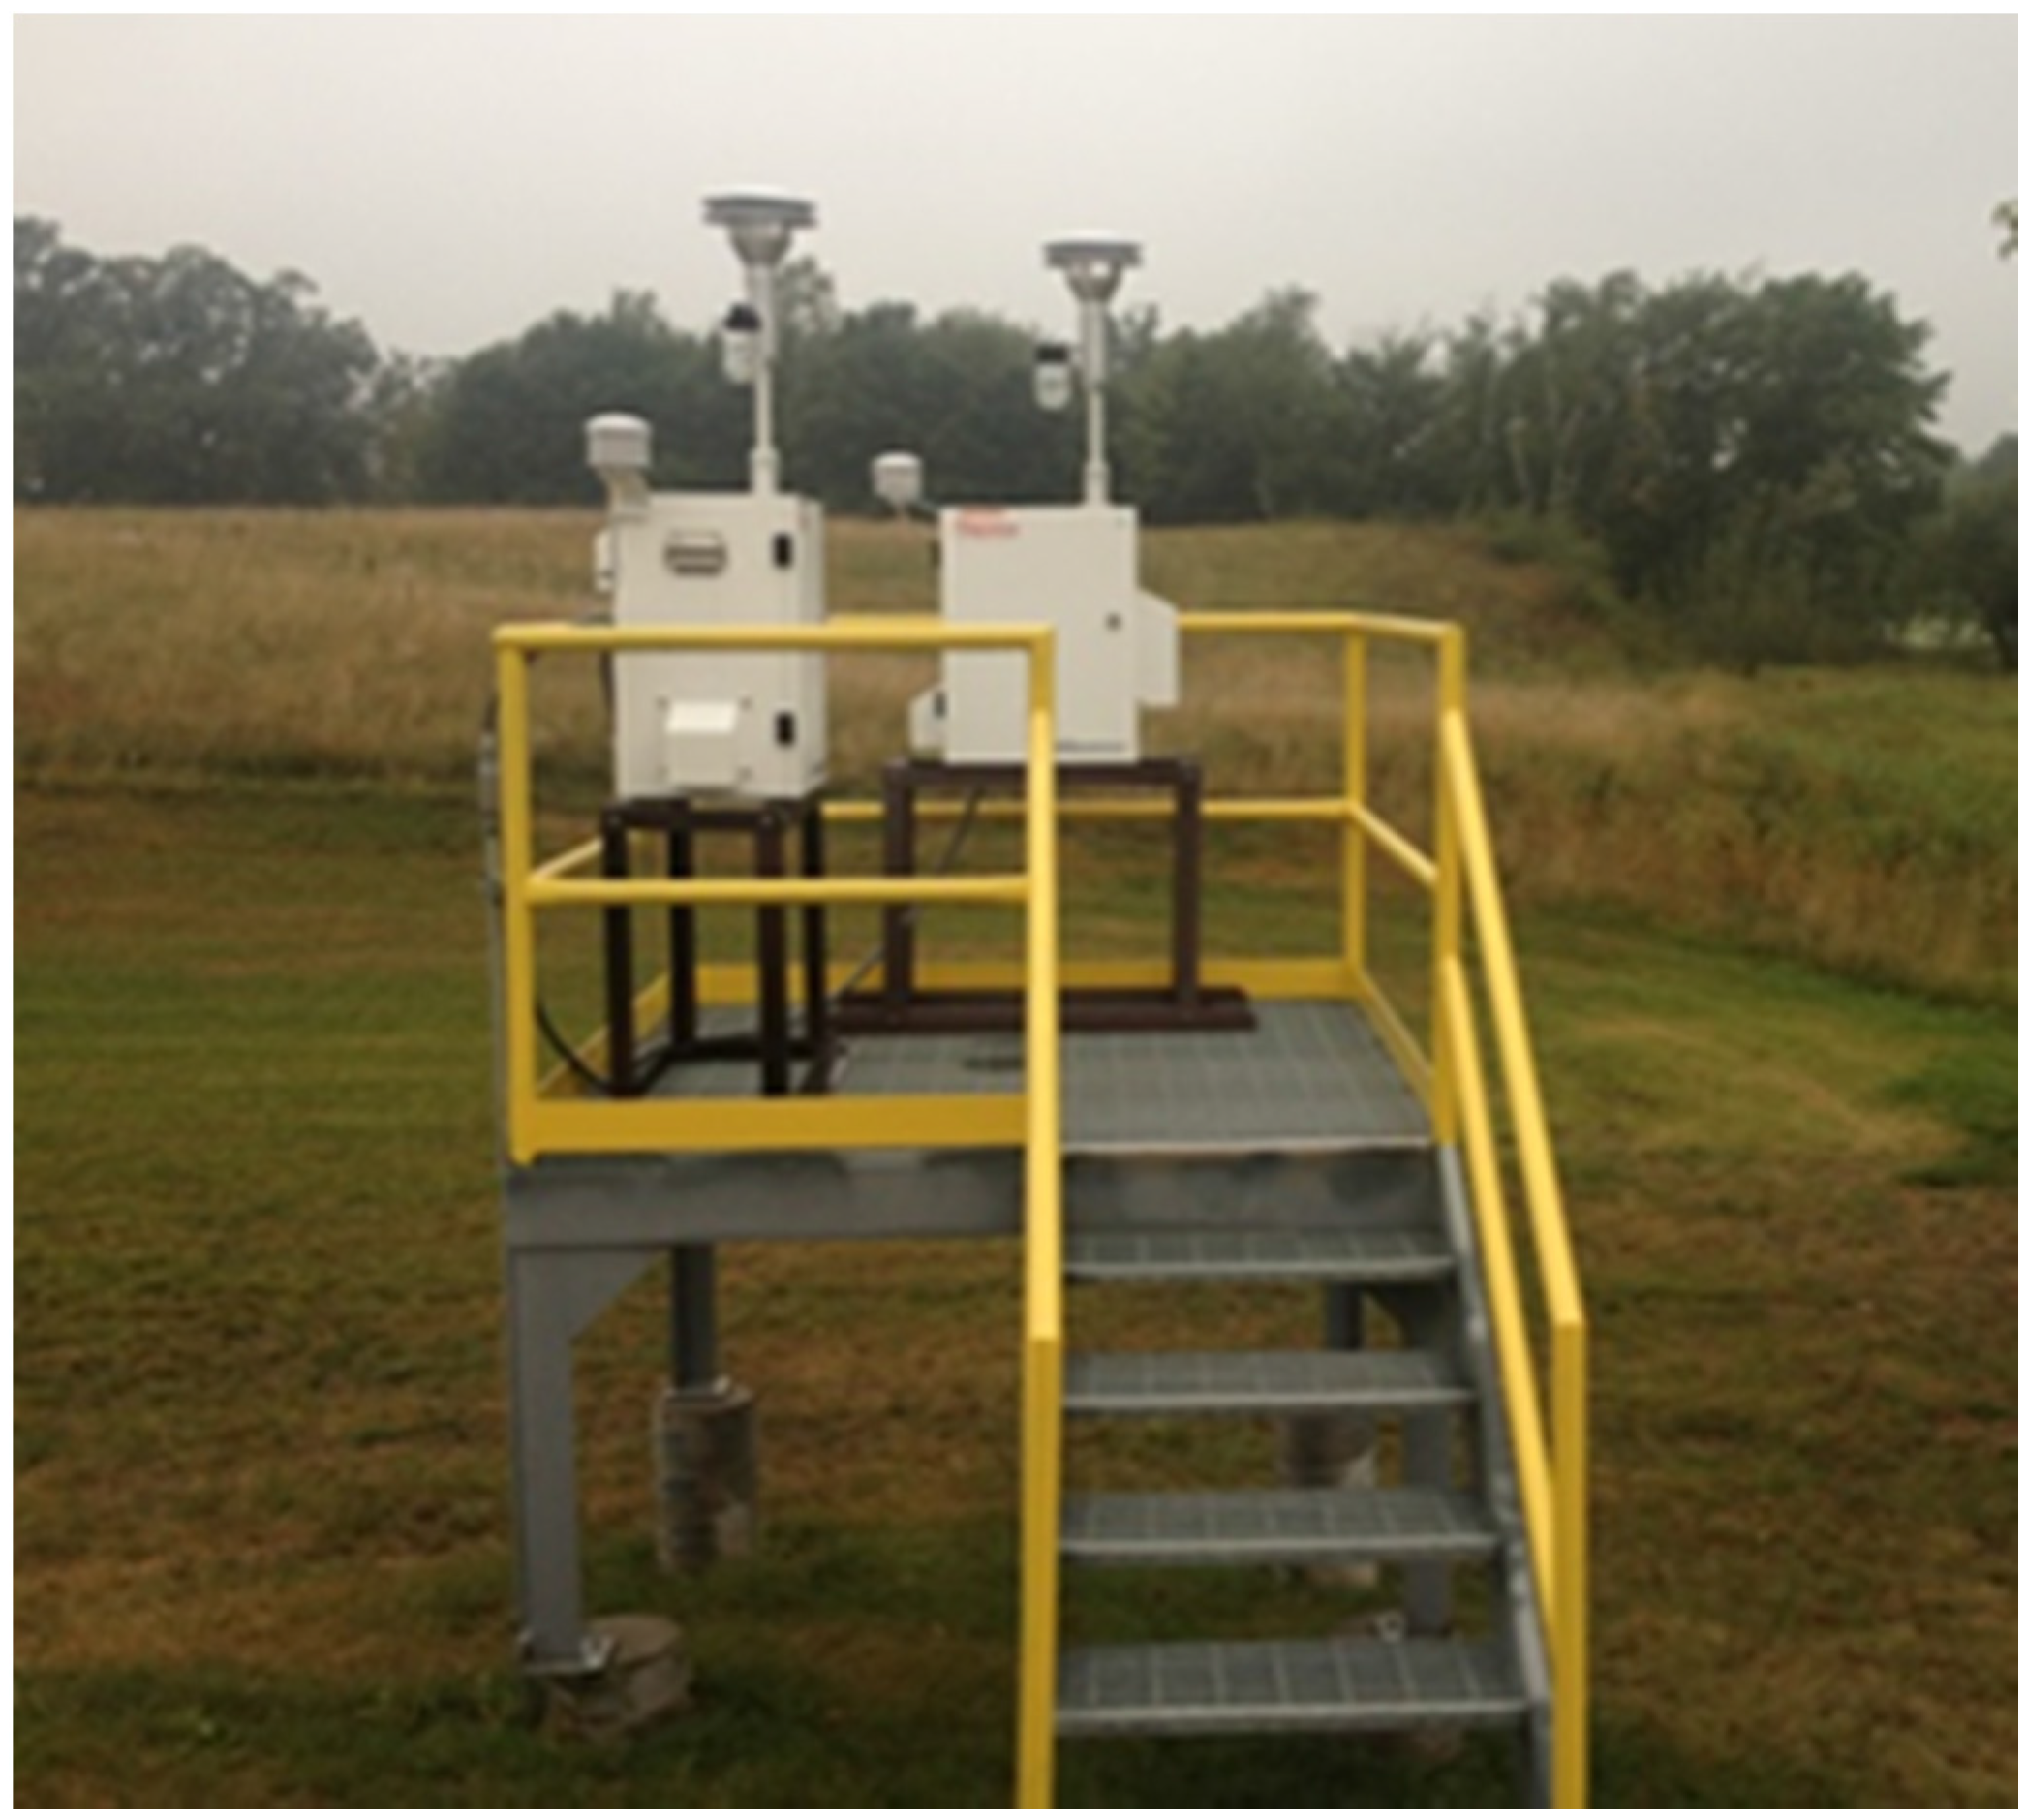
2.1. Facility and Sampling Network Characteristics

EOG Resources, Inc. (EOG, Fort Worth, TX, USA) operates three sand mines and one processing plant in Wisconsin. These four facilities, described in Table 1, include the DS mine, S&S mine, and Chippewa Falls sand processing plant in Chippewa County and the DD mine in Barron County. Air Control Techniques, P.C. installed three respirable crystalline silica sampling sites at each of the four facilities. Two samplers were located at a site termed “Location 1” near the facility fence line at a position that was downwind of possible emission sources when the wind was from a common direction. One of these instruments served as the primary sampler, and the second served as a collocated unit for sampling precision analyses. The third sampler was installed at Location 2 on the other side of the facility. The sampler locations in the facilities and the wind roses for the study period are shown in Figure 1, Figure 2, Figure 3, Figure 4, Figure 5, Figure 6, Figure 7 and Figure 8.
Table 1. Facilities conducting ambient respirable crystalline silica sampling in Wisconsin.
FacilityNumber of SamplersSampling DatesOperating Dates
Chippewa Falls Processing Plant Chippewa County, WI3Oct. 2012–Dec. 2014All months
DS Mine, Chippewa County, WI3Oct. 2012–Dec. 2014April to November each year
S&S Mine, Chippewa County, WI3Oct. 2012–Dec. 2014November to April each year
DD Mine, Barron County, WI3Nov. 2012–Dec. 2014November 2012 to April 2013
Total12--
As shown in Figure 1, the Location 1 sampling site at the Chippewa Falls sand processing plant was near the northern fence line at a spot approximately 10 m from the truck receiving building. This site was the only spot available that met the EPA siting requirements in 40 Code of Federal Regulations (CFR) Part 58, Appendix E [11] and had available electrical power. The wind direction and wind speed sensors were mounted on a 10 m pole located to the southeast of the main plant buildings in the center of the plant. The plant buildings to the west of the wind direction sensor resulted in some bias in the indicated wind directions from the north-northwest, west, and west-southwest shown in Figure 2.
Figure 1. Chippewa Falls sampler locations.
Atmosphere 06 00960 g001
Figure 2. Chippewa Falls wind rose, October 2012–December 2014.
Atmosphere 06 00960 g002
The samplers at the DS mine are shown in Figure 3. During most of 2013, the sampler positions were on the northeast side of all mine activity. During the latter part of 2013, the quarry activities were expanded to the east and northeast of the sampling site.
The measured wind directions at the DS mine were most frequently from the south. This was due primarily to the channeling of the winds by tall hills on the western side of the mine.
Figure 3. DS Mine sampler locations.
Atmosphere 06 00960 g003
Figure 4. DS Mine wind rose, October 2012–December 2014.
Atmosphere 06 00960 g004
The samplers at the S&S Mine are shown in Figure 5. Location 1 was selected due its downwind position when the winds were from the west, southwest, or south. Location 2 was next to the mine office on the southern edge of the mine.
Figure 5. S&S Mine sampler locations.
Atmosphere 06 00960 g005
Figure 6. S&S Mine wind rose, October 2012–December 2014.
Atmosphere 06 00960 g006
The sampling locations at the DD mine were oriented on a north-south axis. The Location 1 site was near the southern fence line. The Location 2 site was near the northern mine entrance. The wind direction and wind speed sensors were near the plant office on the northern side of the mine. The land around this mine is relatively flat. The topography did not influence the measured wind directions.
Figure 7. DD Mine sampling locations.
Atmosphere 06 00960 g007
Figure 8. DD Mine wind rose, October 2012–December 2014.
Atmosphere 06 00960 g008
A typical Location 1 site is shown in Figure 9. Each Location 1 site included a primary sampler and a collocated sampler. The samplers were mounted on platforms to avoid possible issues with snow accumulation. The sampler inlets were below the 7 m height limit specified by the U.S. EPA. The inlets of the primary and collocated samplers were 1 to 2 m apart. All of the sites with the exception of Chippewa Falls were surrounded by 2 m high chain link fence.
Figure 9. Primary and collocated Partisol 2000i samplers at the Chippewa Falls Location 1 site.
Atmosphere 06 00960 g009
The distances between the two sampling locations ranged from 780 m at the processing plant to 690 to 1300 m at the three mines. All eight of the sampling locations satisfied the sampling site criteria specified by the U.S. EPA in 40 CFR Part 58, Appendix E [11]. The two sampling locations were 10 to 150 m from the closest fugitive dust source and 500 to 1000 m from the most distant fugitive dust source within each facility.
The processing plant in Chippewa Falls operated 24 h per day throughout the year with some days offline for maintenance and for inventory control. The three mines operated 8 to 12 h per day for four to eight months per year. The S&S mine operated during the winter from November through early April each year. The DS mine operated from early April to mid-November each year. The DD mine operated from November 2012 through April 2013. The production rates at the four facilities ranged from 500,000 to more than 2,000,000 short tons of sand per year. The operating periods are summarized in Table 1.
The samplers operated on a once-every-third-day schedule. The sampling days matched the once-every-third-day calendar schedule [12] published by the U.S. EPA and used in U.S. EPA and state agency air monitoring networks. Accordingly, the data generated using the ambient PM4 particulate matter samplers could be compared with data generated simultaneously with state agency PM2.5 samplers.
The presence of twelve PM4 particulate matter samplers at these facilities in two adjacent counties is an especially dense population of ambient air monitors. For comparison purposes, there are only twenty-three state-operated PM2.5 samplers in the entire state of Wisconsin.

2.2. Respirable Crystalline Silica Sampling Equipment

All four facilities used Thermo Scientific Partisol 2000i (Franklin, MA, USA) Federal Reference Method (RFPS-0496-117) filter samplers designed for PM2.5 sampling and adapted for PM4 crystalline silica sampling. The Partisol instruments operated in full accordance with U.S. EPA procedures specified in 40 CFR Part 50 Appendix L [3] except for (1) a sample flow rate of 11.1 liters per minute, (2) the use of a PVC filter as specified by NIOSH Method 7500, and (3) gravimetric analysis of the filters by NIOSH Method 0600. The PM4 sampling data were based on actual temperatures and pressures to be consistent with PM2.5 sampling data compiled in accordance with 40 CFR Part 50, Appendix L.
The sampler operator performed routine maintenance of the system’s inlet and sharp cut cyclone. These maintenance activities occurred at the intervals consistent with U.S. EPA Quality Handbook [13].
The authors used the tare filter weight, final filter weight, crystalline silica weight, and sample volume to calculate the average mass concentration of respirable crystalline silica during each sampling period. The total sampling time ranged between 23 and 25 h to be consistent with 40 CFR Part 50 Appendix L Section 3.3 [3].

2.3. Crystalline Silica Analyses

The R.J. Lee Group, Inc. (R.J. Lee) laboratory in Monroeville, Pennsylvania conducted the NIOSH Method 0600 gravimetric analyses and the NIOSH Method 7500 X-Ray Diffraction (XRD) crystalline silica analyses of the filters. R.J. Lee is an accredited laboratory for NIOSH Method 7500 analyses and has extensive experience with this analytical method.
NIOSH Method 7500 for crystalline silica calls for digesting the filter media and re-depositing the dust onto a silver membrane filter for analysis. R.J. Lee is one of only a few laboratories that uses low-temperature plasma ashing. This procedure is more efficient and reliable than a muffle furnace and more effective than tetrahydrofuran digestion. The low temperature of the plasma also does not convert amorphous silica to cristobalite or induce other high-temperature chemical reactions that are possible in a muffle furnace.
R.J. Lee uses a custom filtration system that creates a small filter deposit onto the silver membrane. This small, concentrated deposit size increases the resolution of the scan by increasing the signal/noise ratio of the resulting diffraction pattern. R.J. Lee has two X-ray diffractometers––a PANalytical Cubix Pro unit dedicated to air silica analysis and a PANalytical X’Pert Pro unit, which handles both bulk and air silica analyses. R.J. Lee reported three forms of crystalline silica—quartz, cristobalite, and tridymite.

2.4. Data Analysis

The PM4 crystalline silica concentration data have been divided into sixteen sets, each comprised of the data obtained at one of eight sampling locations during the October 2012 to December 2013 period or the January 2014 to December 2014 period. The geometric means of these data sets of 120 to 150 samples were compared with the OEHHA REL of 3.0 µg/m3. Values below the LOQ of 0.31 µg/m3 were assigned a value of the LOQ/ 2 as described by Hornung and Reed [14]. Due to the large fraction of each data set below the LOQ, this substitution approach can introduce positive or negative bias into the calculation of the mean. The maximum possible bias to lower-than-true mean values was estimated by substituting the LOQ for below-LOQ values.
Upwind-to-downwind concentration differences across the facility were evaluated by compiling data for each of the four facilities from those sampling days in which the winds passed either from Location 2 to Location 1 or Location 1 to Location 2. Local background concentrations were calculated using data from both locations during days when the winds passed in a crossflow pattern to the axis of the samplers.

2.5. Program Organization

Air Control Techniques, P.C. designed the sampling program and trained the local operator of the samplers. R.J. Lee prepared the tared PVC filters and sent them to the on-site sampler operator on a routine basis. At the request of the WDNR ambient air monitoring group, the sample numbers were coded and scrambled so that R.J. Lee was blind concerning the specific facility and specific sampler providing each filter. On a biweekly basis, the filters were returned to R.J. Lee for analysis. Air Control Techniques, P.C. compiled the sampling and laboratory results.
Air Control Techniques, P.C. conducted audits of all of the samplers on a quarterly basis and three-point flow calibrations and ambient temperature, filter chamber temperature, ambient pressure, and filter chamber pressure calibrations on an annual basis. WDNR audited all twelve samplers once during the long-term sampling program.

3. Sampling Results

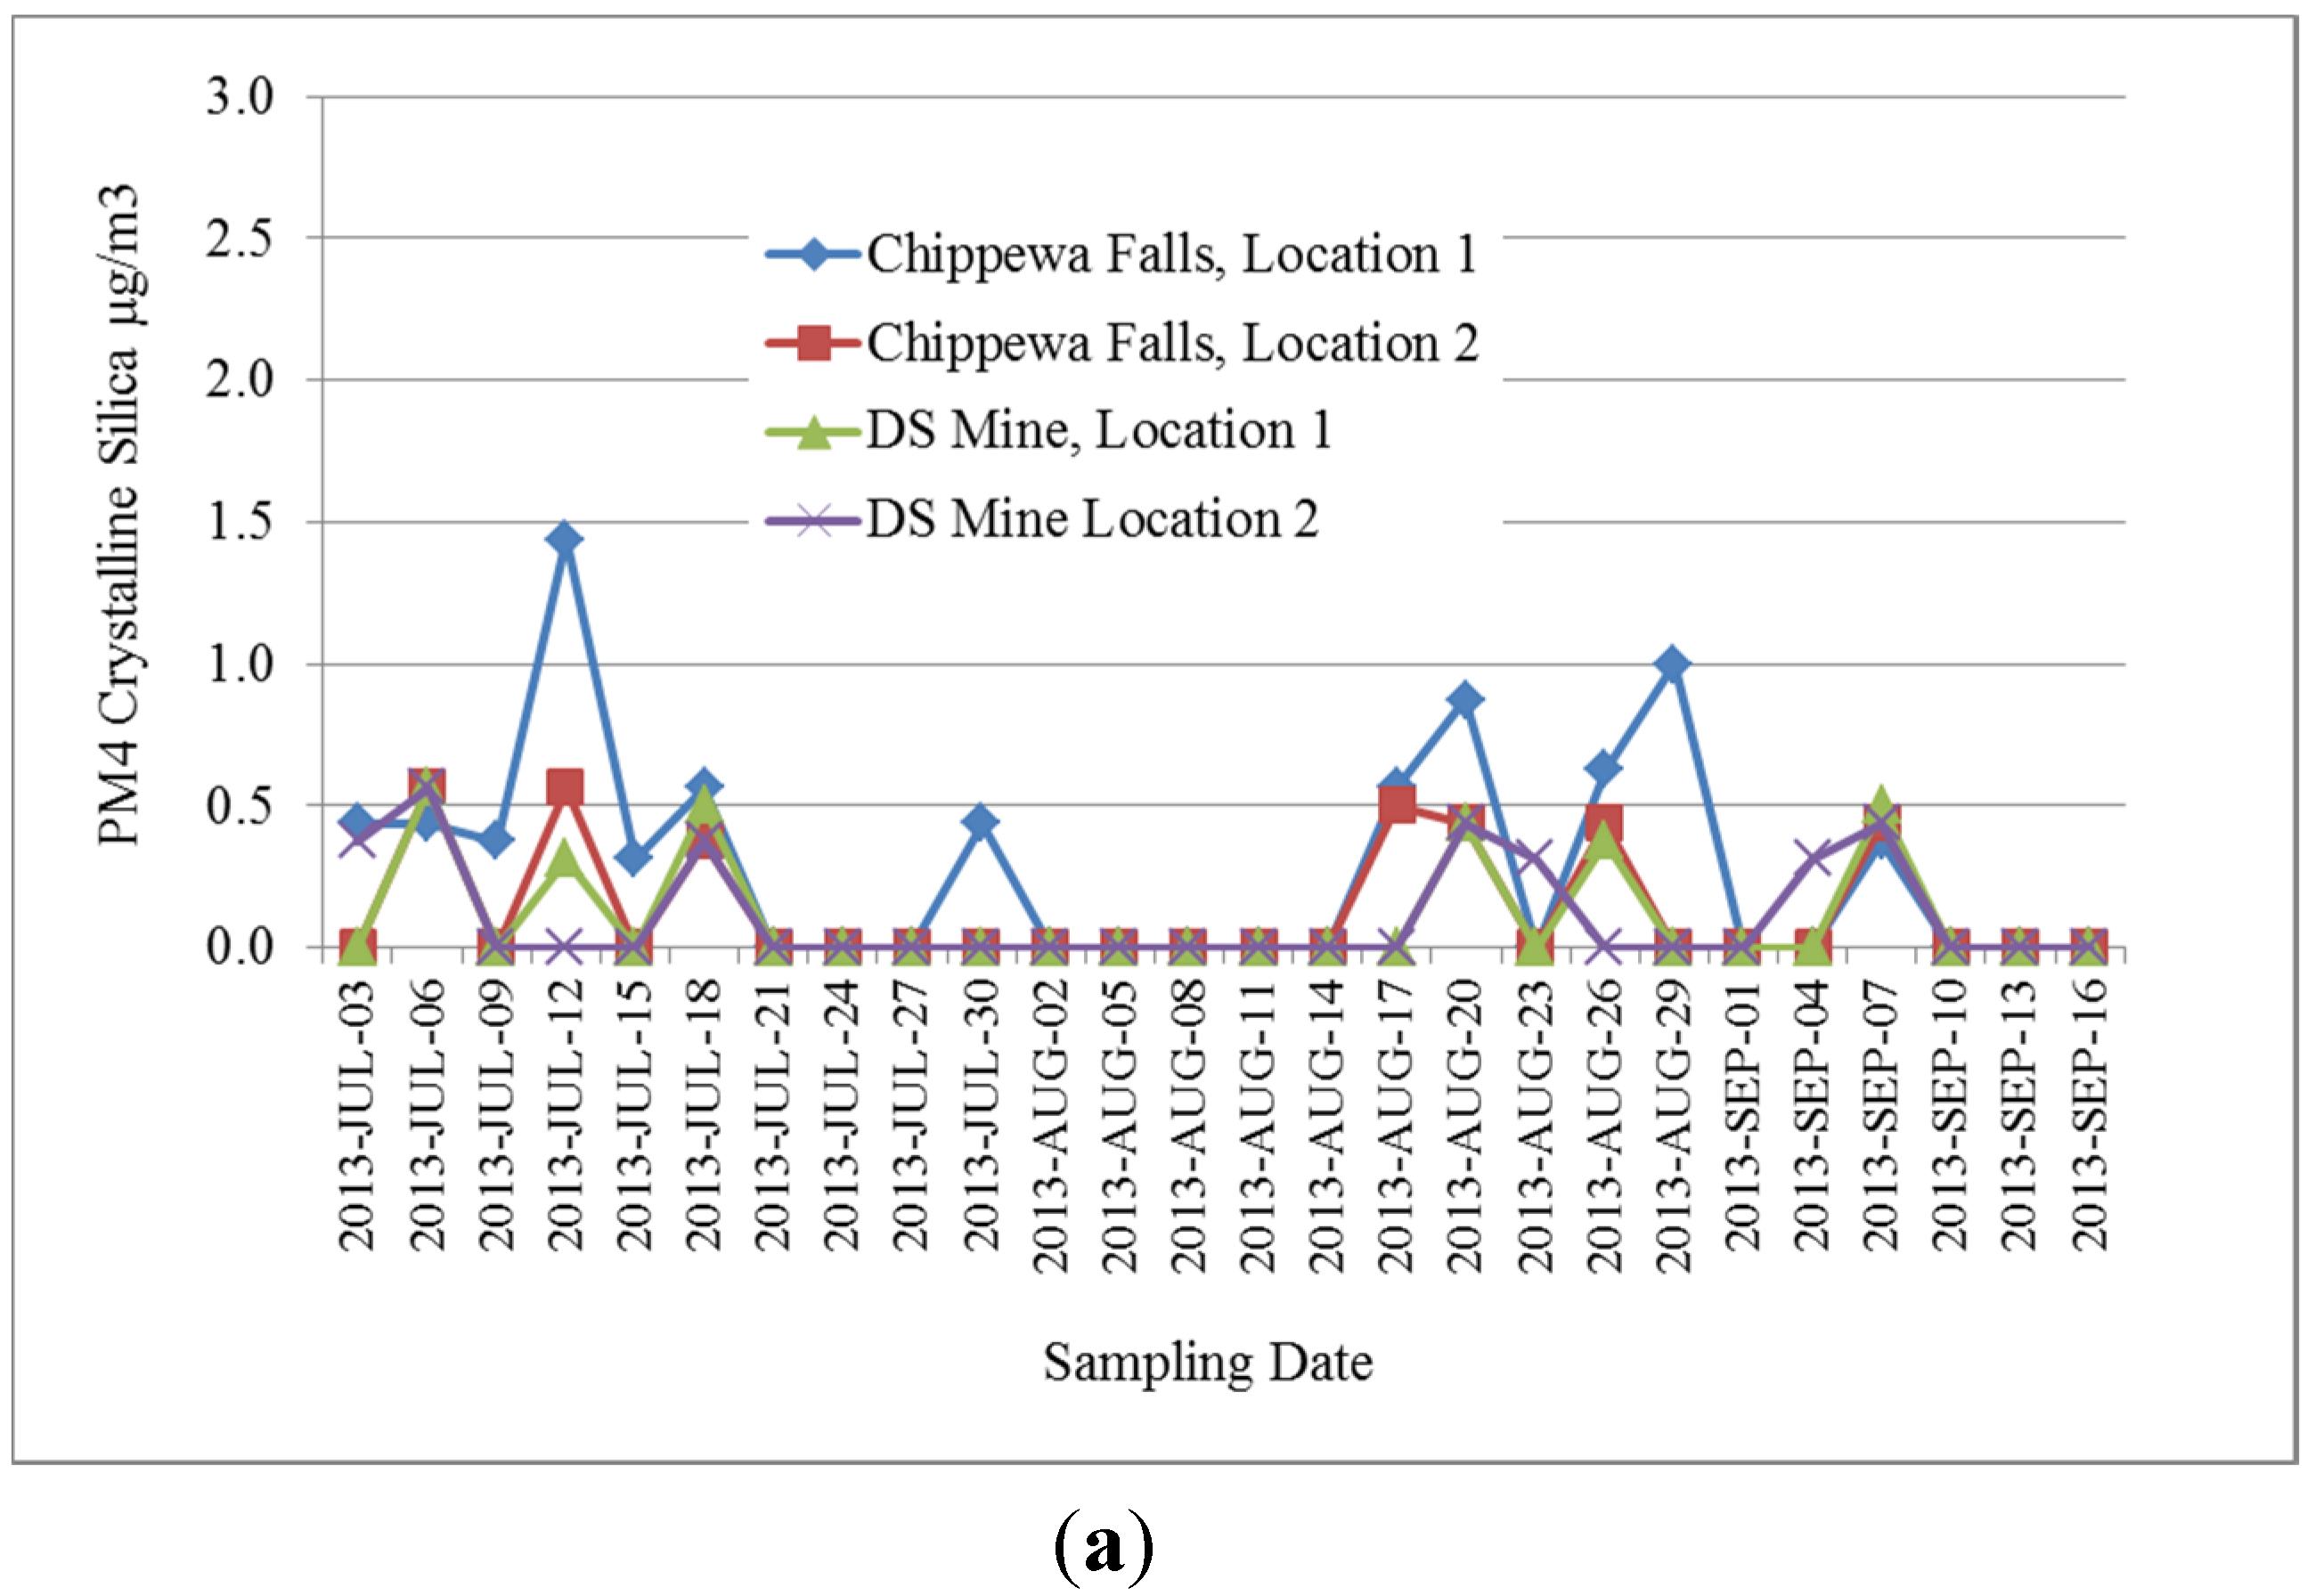
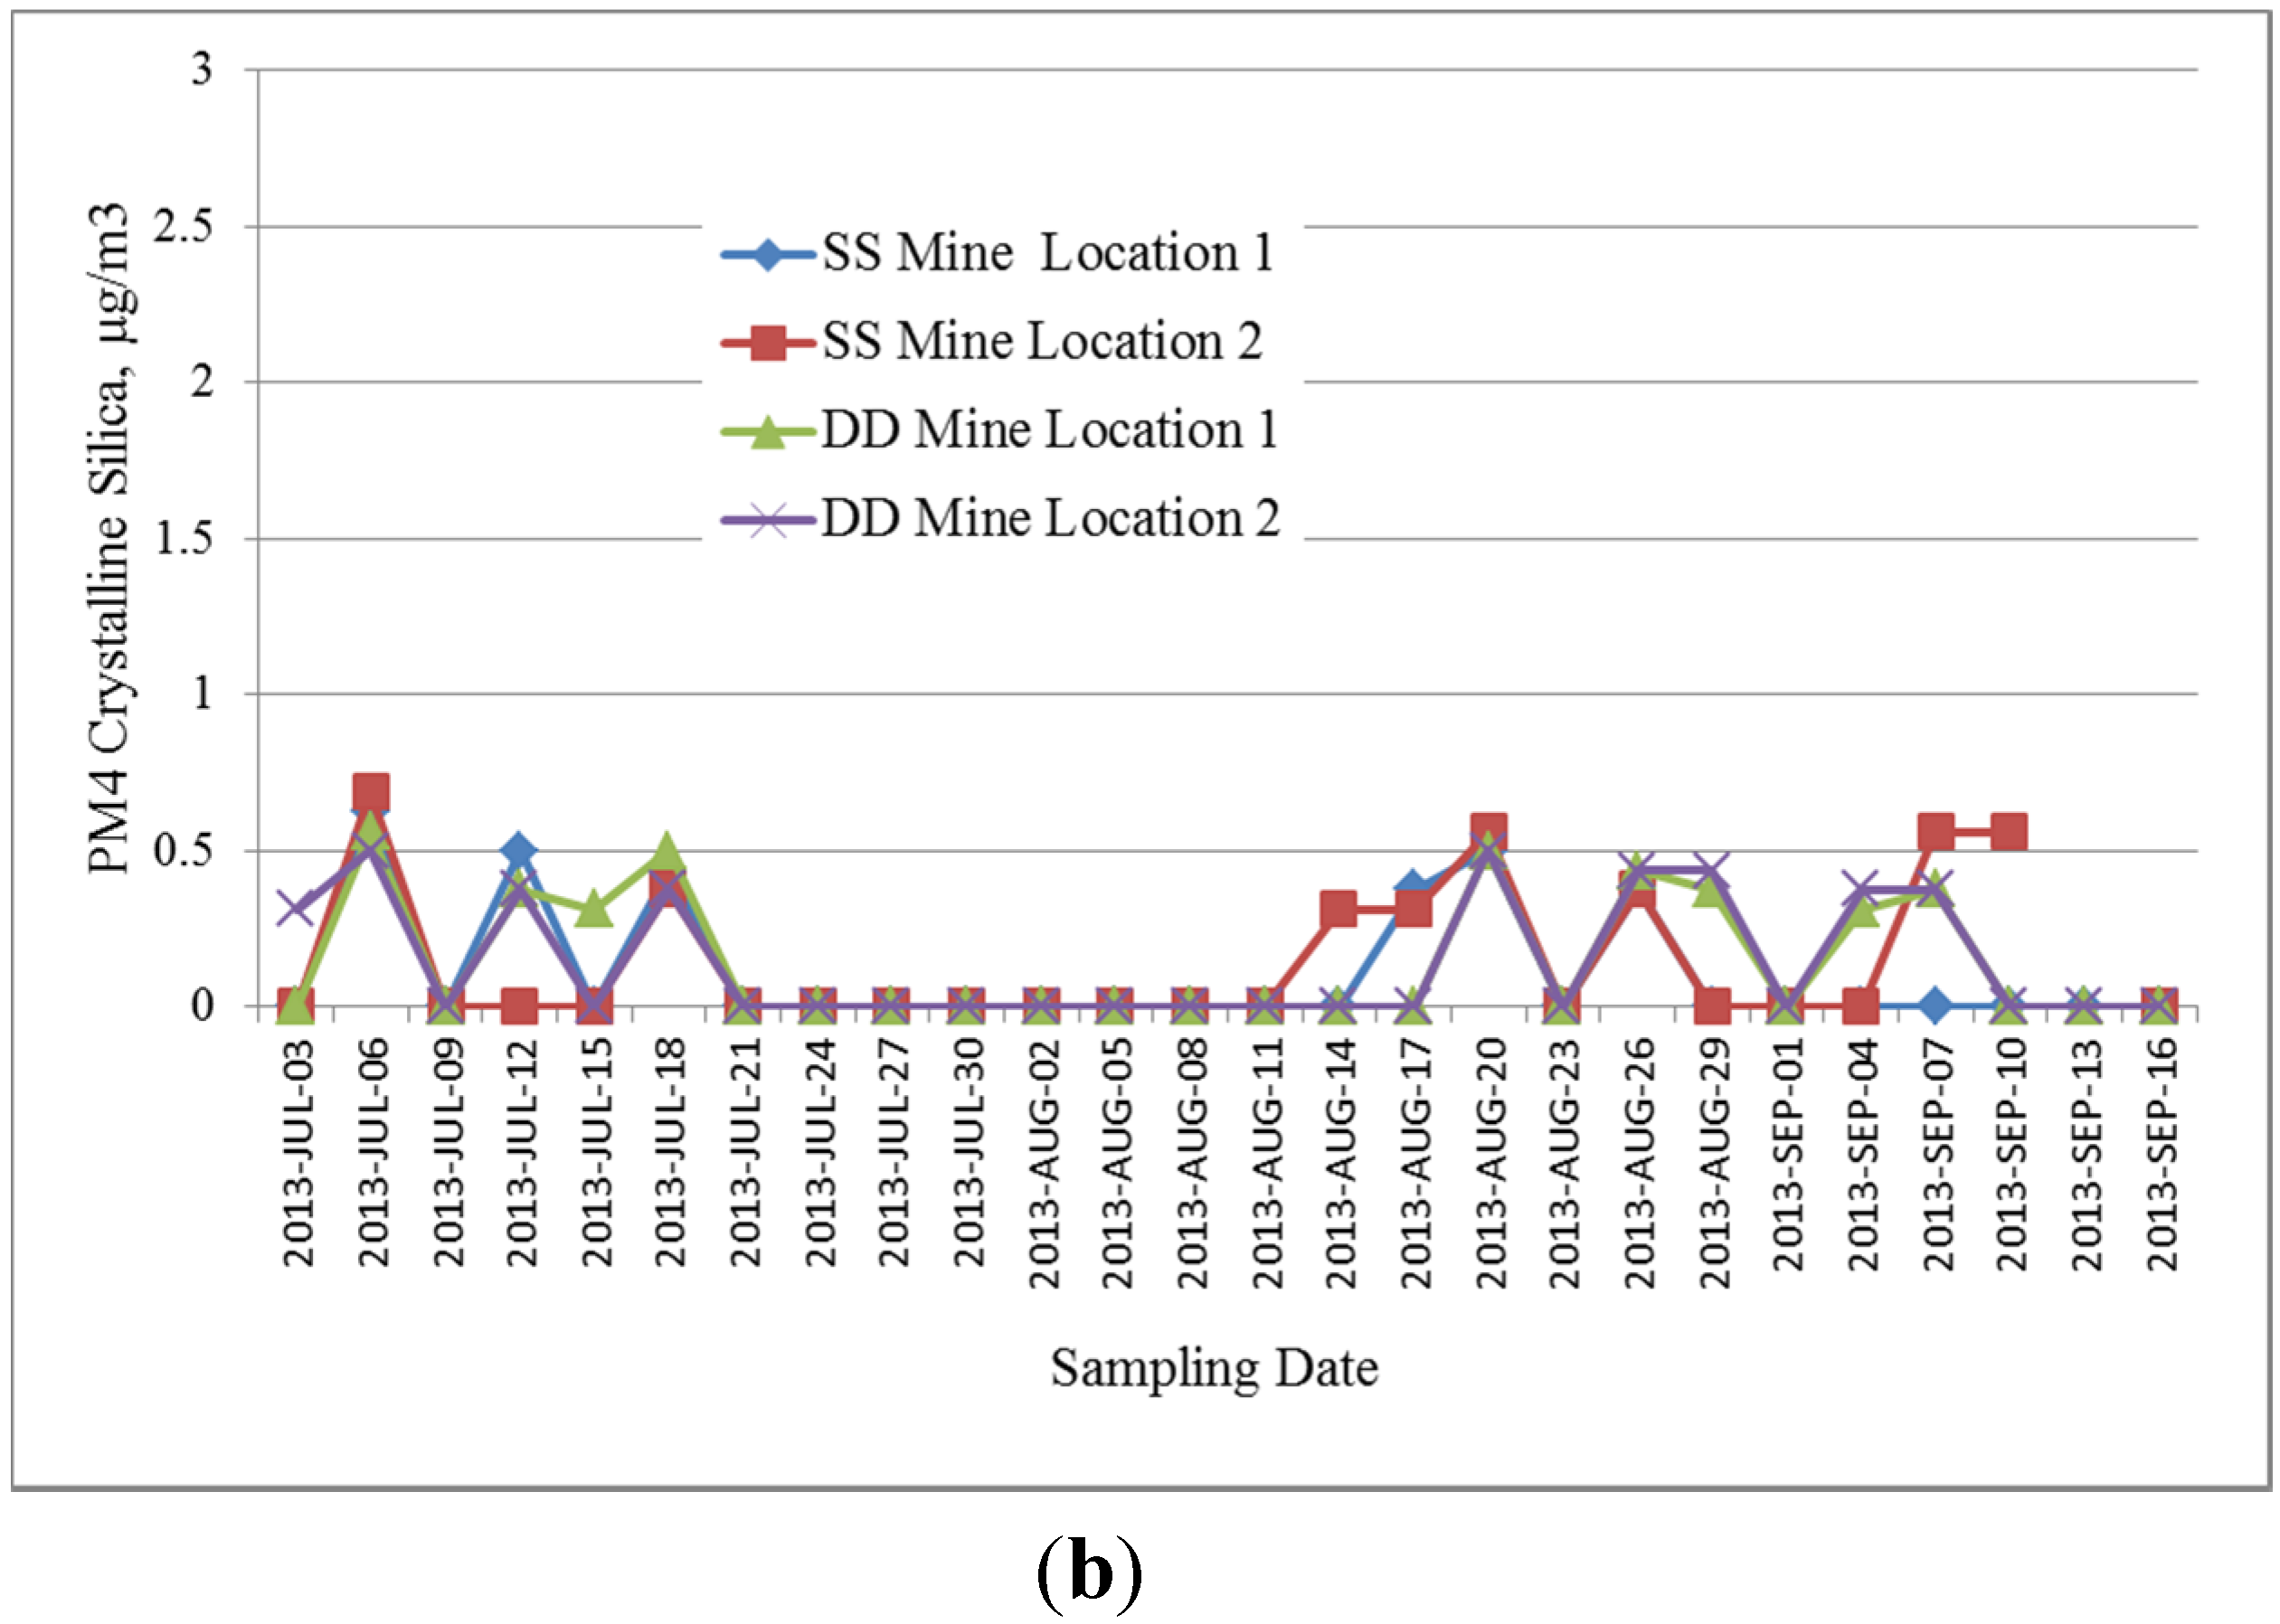
3.1. Average Respirable Crystalline Silica Concentrations

The primary focus in this study was on the comparison of long-term average respirable crystalline silica concentrations at the fence lines of frac-sand producing facilities and the OEHHA chronic exposure REL. The 2128 twenty-four hour average sample values measured from the eight different sampling locations (two per facility) at the four facilities have been divided into two sets: (1) October 2012–December 2013 and (2) January 2014–December 2014. This approach creates sixteen separate long-term measurements, each of which is at least twelve months in duration. Table 2 and Table 3 provide summaries of these twelve and fifteen-month data sets, including (1) the number of samples below the LOQ, (2) the 99th percentile values, (3) the arithmetic means, (4) the 95th upper confidence intervals (UCL) of the arithmetic means, (5) the geometric means (GM), and (6) the geometric standard deviations (GSD).
The sixteen data sets had non-detectable concentrations ranging from 68.2% to 97.5% of the 24 h measurement values. Overall, 88% of the 2128 samples had concentrations below the LOQ of 0.31 µg/m3. The geometric means calculated based on LOQ/ 2 values substituted for the below-LOQ samples ranged from 0.22 to 0.29 µg/m3. All of these geometric means were well below the OEHHA REL of 3.0 µg/m3.
The possible uncertainty in the calculated geometric means using LOQ/ 2 value substitution was estimated by re-calculating the geometric means by substituting the LOQ for below-LOQ sample values. This has a strong bias to higher-than-true mean values considering that the histograms of the detectable values do not indicate that a large number of below-LOQ values were just below the LOQ. These maximum possible geometric means ranged from 0.41 µg/m3 at the Chippewa Falls plant to 0.32 µg/m3 at the DD Mine—values well below the REL. Accordingly, whatever biases are inherent in the LOQ 2 approach in data sets with very high censored data levels do not have any significant impact on the comparison of the means with the chronic exposure REL.
Table 2. Respirable crystalline silica 24 h average concentration measurements, October 2012–December 2013.
Facility and Sampling LocationNumber > LOQNumber < LOQ% <LOQ99th%(LOQ/ 2 ) Substituted for < LOQ Values
MeanMean 95th% UCLGMGSD
µg/m3µg/m3µg/m3µg/m3µg/m3
Chippewa Falls, Location 14910668.21.340.330.360.291.59
Chippewa Falls, Location 22013386.90.650.260.270.241.33
DS Mine, Location 11913487.60.720.250.270.241.30
DS Mine, Location 21713388.70.500.240.250.231.22
S&S Mine, Location 11313791.30.500.240.250.231.21
S&S Mine, Location 22612382.61.440.300.330.261.52
DD Mine, Location 11812182.10.600.250.260.241.26
DD Mine, Location 21612188.30.810.250.270.241.33
Table 3. Respirable crystalline silica 24 h average concentration measurements, January 2014–December 2014 PM4 Crystalline Silica Data.
Facility and Sampling LocationNumber > LOQNumber < LOQ% < LOQ99th%(LOQ/ 2 ) Substituted for < LOQ Values
MeanMean 95th% UCLGMGSD
µg/m3µg/m3µg/m3µg/m3µg/m3
Chippewa Falls Location 1318573.31.060.310.340.281.55
Chippewa Falls, Location 2411496.60.310.220.280.221.09
DS Mine, Location 1611294.90.380.230.230.221.11
DS Mine, Location 2711194.10.560.240.250.231.23
S&S Mine, Location 1910992.40.730.240.260.231.27
S&S Mine, Location 2199983.90.810.270.290.251.39
DD Mine, Location 1411496.60.430.230.230.221.13
DD Mine, Location 2311597.50.420.220.230.221.11
The upper 99% percentile values ranged from 0.31 µg/m3 at Chippewa Falls Location 2 (2014 data set) to1.44 µg/m3 at S&S Mine Location 2 (Oct. 2012–Dec. 2013 data set). These values are independent of the LOQ and provide an indication of the limited variability of the 24 hour average data. The geometric standard deviations also indicated that the range of data was low.

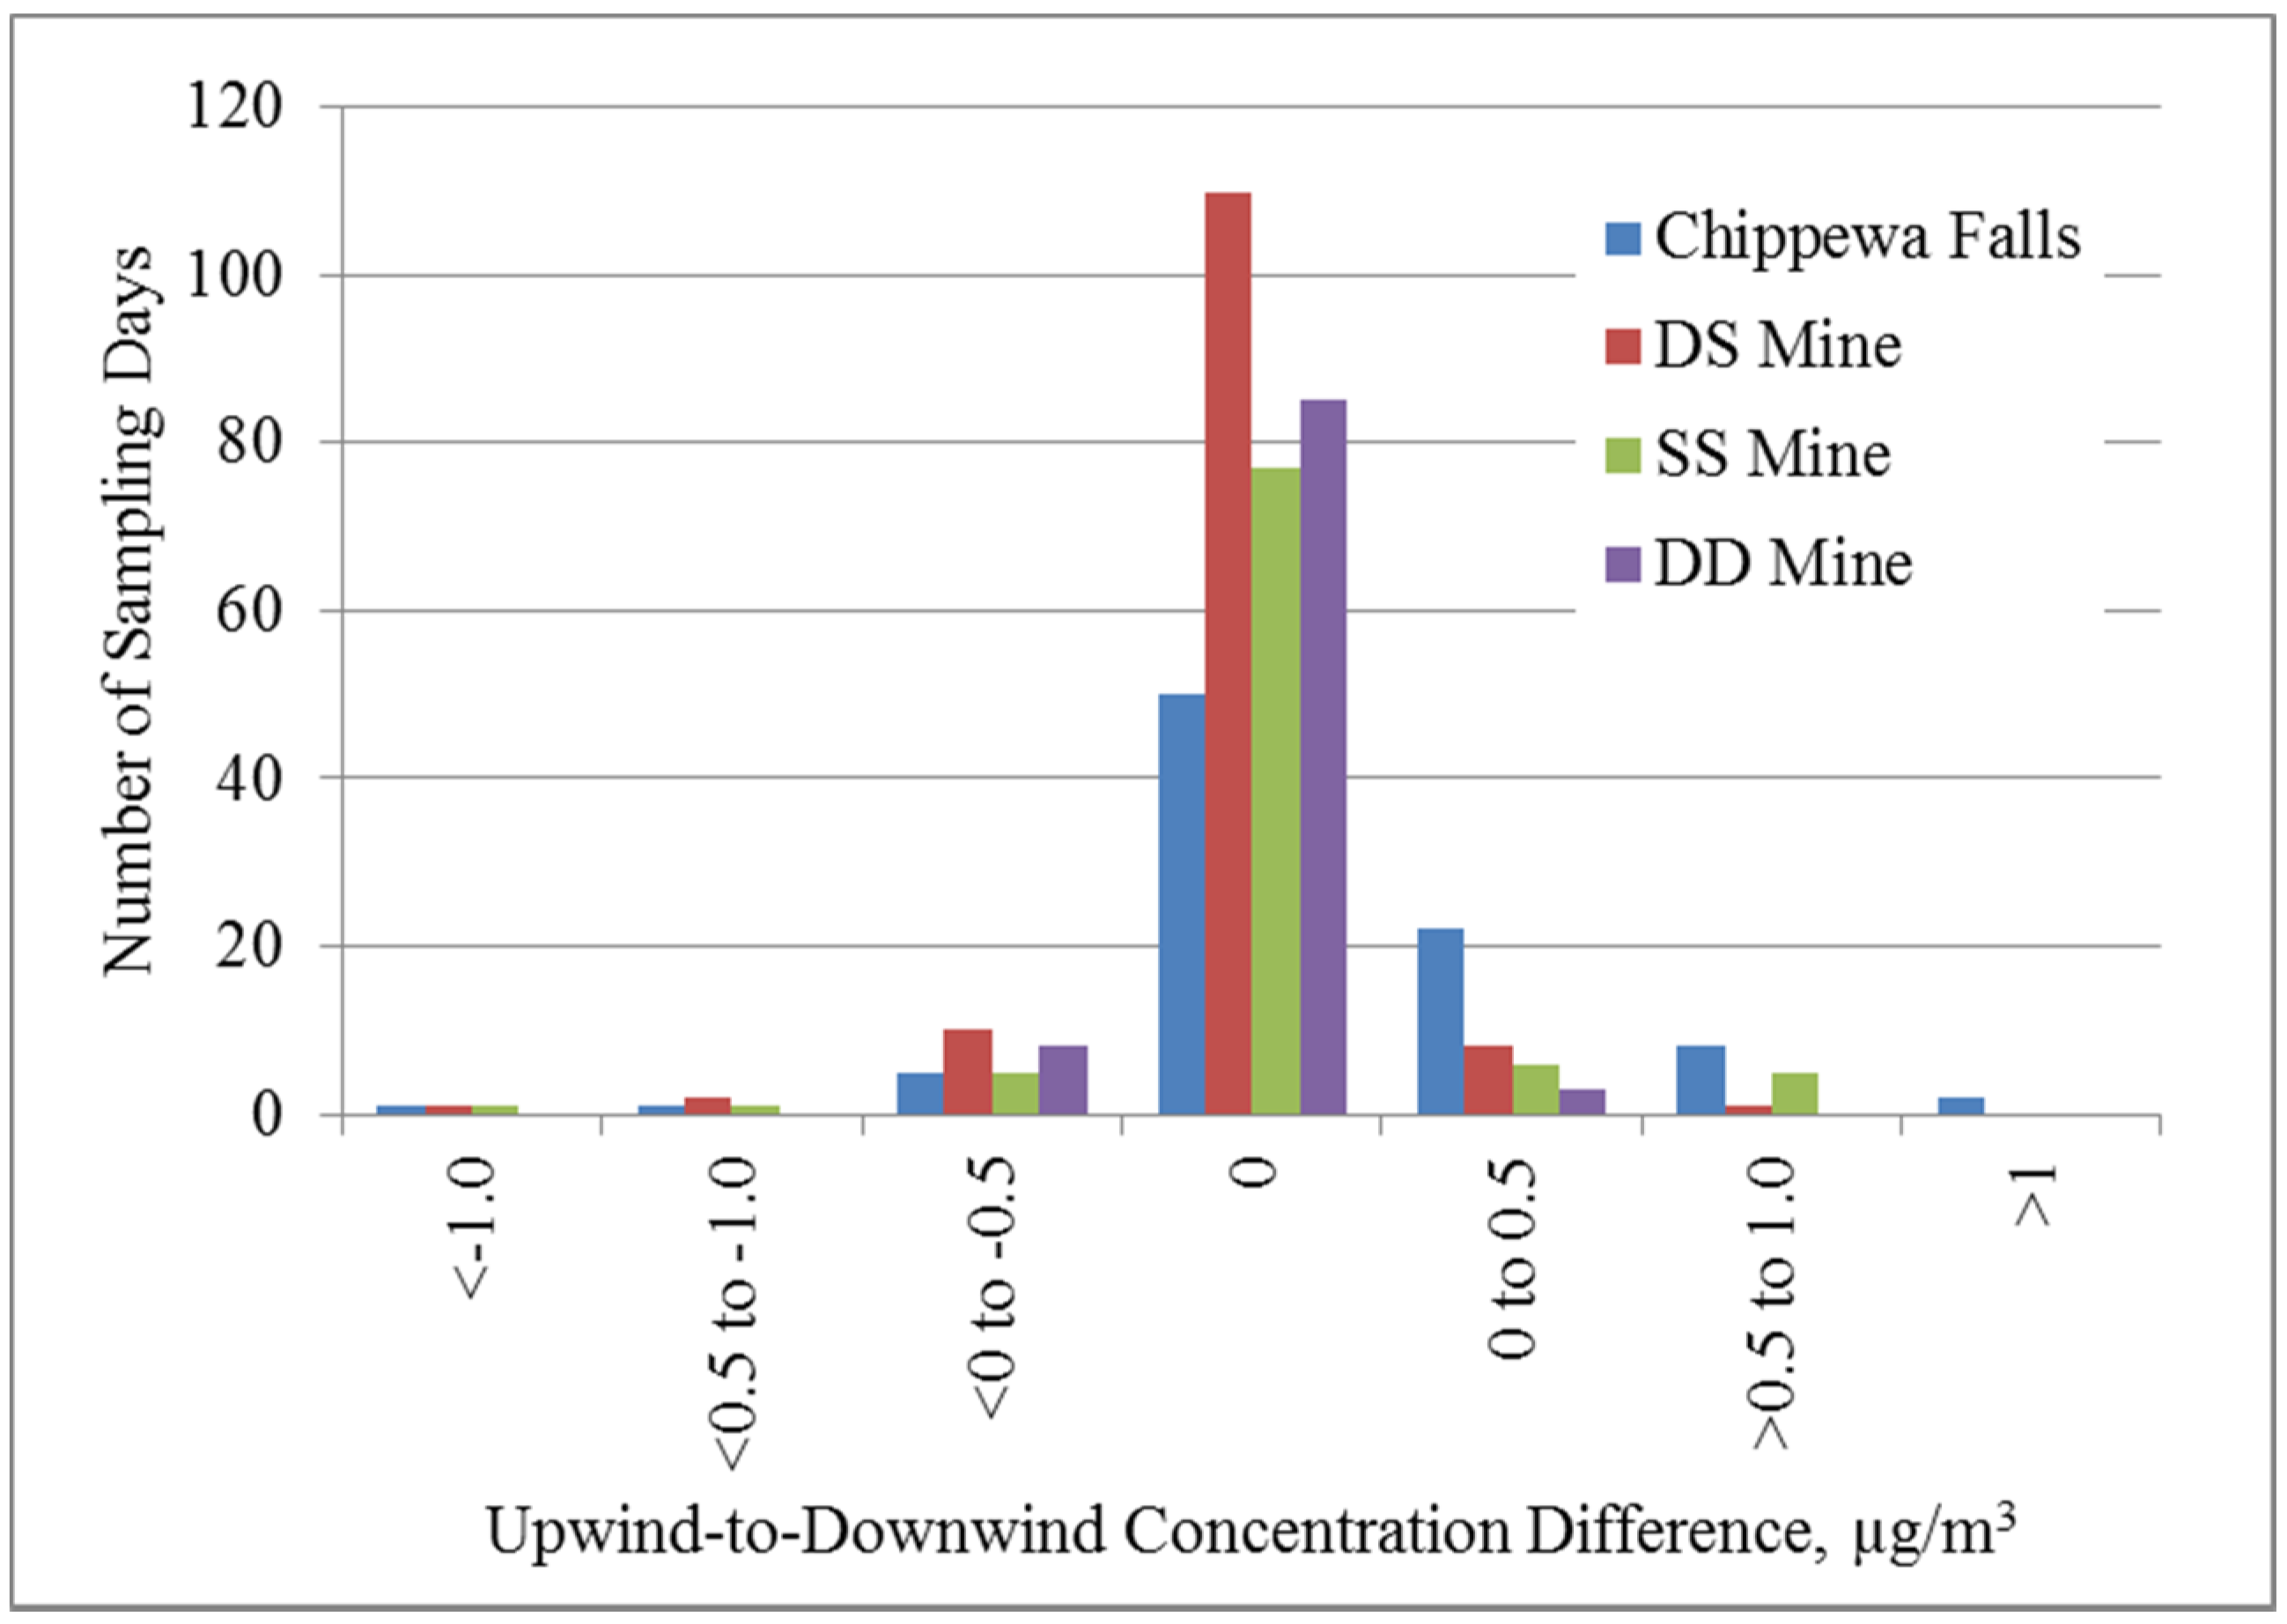
3.2. Upwind-Downwind Concentration Differences

The contributions of the facilities to the downwind concentrations of respirable crystalline silica were evaluated using upwind-to-downwind data during days in which the ambient air moved across the facility either from Location 1 to Location 2 or from Location 2 to Location 1. All of the upwind-to-downwind analyses were conducted by assigning zero values to samples below the LOQ. Using LOQ/ 2 values for below-LOQ samples potentially obscured slight differences between the concentrations measured at the two locations at each facility.
The upwind-to-downwind differences in the 24 h average concentrations ranged from approximately −1.4 µg/m3 to +1.5 µg/m3. The upwind-to-downwind differences in the respirable crystalline silica concentrations were very small at all four facilities sampled. There was no detectable change in the upwind-to-downwind concentrations on 78% of the days during which the winds moved in a consistent and identifiable upwind-to-downwind direction. Figure 10 provides examples of the upwind-to-downwind respirable crystalline silica concentrations.
Figure 10. Upwind-to-downwind PM4 crystalline silica concentration differences, October 2012 to December 2013.
Atmosphere 06 00960 g010
These very small upwind-to-downwind concentration increases and decreases indicate that the sand mining and processing facilities contribute very little, if anything, to the ambient respirable crystalline silica concentrations.

3.3. Local Background Concentrations

The local background concentrations of respirable crystalline silica summarized in Table 4 were determined based on concentrations measured by both the Location 1 and Location 2 samplers during days with dominant crosswinds. During these sampling days, the observed concentrations were due to local background concentrations of respirable crystalline silica. The three facilities clustered in Chippewa County had slightly higher background concentrations than the one mine (DD mine) located in the more rural Barron County.
The average local background concentrations listed in Table 4 are similar to the average concentrations summarized in Table 2 and Table 3 for the entire data sets compiled from October 2012 through December 2013 and from January 2014 through December 2014. This similarity suggests that the fence line concentrations of respirable crystalline silica are within the local background concentration range.
Table 4. Local background concentrations.
FacilityNumber of 24 h Samples October 2012–December 2014Respirable Crystalline Silica Concentrations
AverageMaximum µg/m3
Values Below LOQ Treated as 0.0 µg/m3Values Below LOQ Treated as LOQ/ 2 µg/m3
Chippewa Falls1940.0430.2360.56
DS Mine580.0520.2490.88
S&S Mine1820.0670.2602.10
DD Mine1240.0150.2280.63
The local background range has been further evaluated by comparing day-by-day concentration variations observed in the entire network of eight primary samplers located across an area of more than 70 km in the two-county area. The relatively consistent variations in both the upwind and downwind location sampling data at all four facilities are most apparent during summer periods when the ambient respirable crystalline silica concentrations are at a maximum. For example, data from the period July 3, 2013 through September 16, 2013 are illustrated in Figure 11a. All measured concentrations values at the eight samplers varied together regardless of wind direction and facility-specific operations. These consistent variations observed throughout the multi-year sampling program in the network of samplers suggest that measured fence line concentrations are in the local background range for Western Wisconsin. This is further indicated by the fact that both the S&S and the DD mines (Figure 11b) did not operate during the two and one-half month period addressed in Figure 11b.
Figure 11. Variations in PM4 Crystalline Silica Concentration at the (a) Chippewa Falls Plant and the DS Mine, July 3, 2013 to September 16, 2013; (b) the SS and DD Mines, July 3, 2013 to September 16, 2013.
Atmosphere 06 00960 g011aAtmosphere 06 00960 g011b
The variations in the local background concentrations were further evaluated by comparing the measured PM4 particulate matter concentrations at the Chippewa Falls processing plant with a WDNR operated PM2.5 monitoring site in Eau Claire, Wisconsin twenty three kilometers away from Chippewa Falls.
Comparisons of the PM4 particulate matter data and the WDNR PM2.5 data [15] are provided in Figure 12 and Figure 13. It is apparent that the variations in local PM2.5 particulate matter concentrations measured by WDNR at Eau Claire are very similar to the variations in PM4 particulate matter concentrations at both locations at Chippewa Falls. This suggests that most of the PM4 particulate matter measured at Chippewa Falls was background PM2.5 particulate matter.
Figure 12. Comparison of the WDNR PM2.5 data from Eau Claire with the PM4 particulate matter data from Chippewa Falls Locations 1 and 2, October 2012–December 2013.
Atmosphere 06 00960 g012
Figure 13. Comparison of the WDNR PM2.5 data from Eau Claire with the PM4 particulate matter data from Chippewa Falls Locations 1 and 2, January 2014–December 2014.
Atmosphere 06 00960 g013
The PM4 particulate matter data compiled at Chippewa Falls were very similar to the PM2.5 particulate matter data compiled by WDNR. The relatively small differences observed during some sampling days appear to be due primarily to a nearby major highway and urban sources that affected PM2.5 particulate matter air quality near the WDNR Eau Claire PM2.5 sampler but not the Chippewa Falls PM4 particulate matter samplers.
As expected, the PM4 particulate matter concentrations at Chippewa Falls were slightly higher on average than the PM2.5 particulate matter concentrations at Eau Claire due to the fact that the PM4 size range extends further into the coarse mode of ambient particulate matter. The PM2.5–PM4 particulate matter comparison suggests that the daily variations in respirable crystalline silica regional air quality are primarily due to variations in the local background concentrations.

3.4. Sampling Method Performance

The sampling programs included frequent and comprehensive quality assurance procedures. The scope of the quality assurance (QA) analyses included (1) the use of collocated samplers along with the primary sampler at each of the four facilities, (2) biweekly audits of the sample flow rates, (3) yearly three-point sample flow rate calibrations, (4) yearly ambient pressure, filter chamber pressure, ambient temperature, and filter chamber calibrations,(5) filter blank analyses, and (6) review of the five min average sampler operating data recorded by the Partisol 2000i samplers.
The use of a collocated sampler at the primary sampling location was one of the main quality assurance checks. All four facilities operated sampler networks with a collocated sampler operating every twelfth day. All four facilities achieved coefficient of variance values for the PM4 particulate matter well within the maximum allowed 10% value limit specified in 40 CFR Part 58, Appendix A [16]. Due to the fact that 88% of the respirable crystalline silica concentrations were at or below the LOQ, it was not possible to calculate the coefficient of variance for the respirable crystalline silica concentrations at any of the four facilities.
The sampling network operator for all four facilities performed sampler audits every two weeks—a frequency that is twice as high as required by 40 CFR Part 50 Appendix L [3], the EPA quality assurance handbook [13], and the sampler manufacturer’s recommendations. The purpose of the frequent audits was to confirm proper operation of the samplers as often as possible to identify problems related to sampler operation. All twelve samplers used in these studies successfully passed the sample flow rate, air temperature, filter temperature, ambient pressure, and sample gas pressure audits conducted during the long-term sampling programs.
In addition to the operator audits, Air Control Techniques, P.C. conducted an independent audit of each sampler on a quarterly basis. All twelve samplers used in these four sampling programs passed each of these quarterly audits. Each sampler also passed a WDNR audit.
Air Control Techniques, P.C. conducted three-point calibrations using an NIST traceable Chinook Engineering calibrator. The calibrations were conducted at the beginning of each study and at the twelve-month point in each study.
The Partisol instruments logged the sample flow rate, air temperature, sample gas temperature, air pressure, and electrical operating conditions every five minutes during sampling. The voluminous set of data downloaded from the eight primary samplers and the four collocated samplers demonstrated that the instruments worked extremely well throughout the long-term sampling programs.
Every tenth filter was installed in the sampler and immediately recovered. These blank filters were analyzed to check for any filter damage and contamination problems. More than 98% of the blanks had crystalline silica levels below the LOQ. There were small variations in the PM4 particulate matter levels in a small fraction of the blanks. The low blank values demonstrate that the filter handling procedures were good.
All twelve of the Partisol 2000i instruments provided data availability exceeding 98% despite an especially severe winter in 2012–2013. There were no problems with leak checks performed during routine audits. One sampling day at one site was lost due to heavy snow that prevented safe access to the sampling location. One of the instruments developed a problem with the display screen that resulted in the loss of data for three sampling days. Overall, the instruments performed extremely well.

4. Discussion

The results of this ambient respirable sampling program have been evaluated by (1) comparison of the long-term average data reported here with short-term data in previously published studies, (2) evaluation of the susceptibility of crystalline silica to form fragments in the respirable size range, and (3) evaluation of data concerning sources that could contribute to the observed background concentrations.

4.1. Comparison of Measured Data with Previous Studies

The long-term average respirable crystalline silica concentrations in this study are similar to those measured by the Minnesota Pollution Control Agency (MPCA) in Winona and Stanton, Minnesota [17]. The MPCA used sampling and analytical procedures similar to those of Richards and Brozell [2] while sampling at these two locations over an eight-month period in 2014. In the City of Winona, with a frac sand transloading operation, only two of the thirty 24 h measurements were above the LOQ of 0.31 µg/m3. The maximum measured values at Winona were 0.4 µg/m3. At the MPCA background site of Stanton [17], nine of the thirty three 24 h measurements were above the LOQ. The maximum concentration at Stanton, MN was 1.3 µg/m3. The Stanton area is dominated by agricultural sources and has no frac sand-producing facilities. Low respirable crystalline silica levels were also measured at Shakopee Sand [18] and Tiller-North Branch in Minnesota [19].
The long-term average concentration values measured in this study were lower than the shorter time period data of up to 2.8 µg/m3 of respirable crystalline silica compiled by Richards et al. [6] at the fence lines of two large sand and gravel plants in San Diego and Tracy, California. The data summarized in the present paper were similar to the 0.4 to 1.1 µg/m3 respirable crystalline silica concentrations measured by the SCAQMD [7,8] during a four-month sampling program at an elementary school close to four sand and gravel plants in Duarte, California. The concentrations measured in this study were slightly below those measured by the California Air Resources Board in Lompac, California [20]. These California-oriented studies reported slightly higher concentrations probably due to higher background concentrations in these semi-arid areas due to wind-entrained dust and also due to large agricultural operations close to several of the sampling locations.
The respirable crystalline silica concentrations measured in this study were slightly lower than the values measured by Stacey et al. [21] in communities close to construction sites in England and by the Environmental Health Board of Queensland Health at construction sites in Queensland, Australia [22]. The lower concentrations near frac sand producing facilities in Wisconsin were probably due to the lack of energy-intense frac sand handling equipment and especially hard characteristics of the grains of frac sand.
Shiraki and Holmen [23] measured higher concentrations of crystalline silica at a sand and gravel plant near Tracy, California; however, their data were limited to the analyses of PM10 samples. They could not detect crystalline silica in their PM2.5 particulate matter samples, and they did not measure respirable crystalline silica. Due to the size dependence of the crystalline silica content of particulate matter, it is difficult to convert PM10 crystalline silica concentration data to a PM4 respirable crystalline silica basis.
Saiyed et al. [24] reported high ambient crystalline exposure levels in the village of Ladakh, India at an elevation of 11,000 feet in desert air. He suspected high exposure to crystalline silica due to frequent desert wind storms and to venting of kitchen emissions. High concentrations of crystalline silica have also been reported by Bhagia [25] for slate-producing villages in India. The conditions studied by Sayied et al. and by Bhagia are not relevant to the types of possible exposures in communities near frac sand producing facilities in the Upper Midwest of the U.S.
The 24 h average respirable crystalline silica concentrations measured at the four facilities using data from days when the samplers were located crosswind were generally consistent with the 0 to 2.6% by weight crystalline silica content in PM2.5 particulate matter estimated by Davis et al. [26] for 22 urban areas in the U.S.. At annual average PM2.5 levels of 8 to 10 µg/m3 in Wisconsin [27], the estimate of Davis et al. is equivalent to 0.21 to 0.26 µg/m3. Slightly higher crystalline silica levels should be present in PM4 particulate matter considering that the PM4 size range extends slightly more than the PM2.5 size range into the coarse mode of atmospheric particulate matter.
The respirable crystalline silica concentrations measured in this study were less than the levels that could be estimated using a ratio of respirable crystalline silica of 0.1 times the PM10 concentration as discussed by EPA [28]. In 1996, when EPA published their ambient respirable crystalline silica document, there were only very limited data on respirable crystalline silica concentrations. EPA relied primarily on the data of Davis et al. [26] for the 15 micrometer 50% cut size samples.
The limited short-term ambient respirable crystalline silica data in previous publications and reports are generally consistent with the low levels measured in this study at the fence lines of all four sand-producing facilities.

4.2. Susceptibility of Frac Sand to PM4 Particle Formation

Frac sand must meet American Petroleum Institute specification RP 19C for size distribution, roundness, and crush resistance. Frac sand is used due, in part, to its especially high resistance to pulverization. High energy is needed to fracture small particles from the large grains of crystalline silica particles. Quartz, the form of crystalline silica in frac sand, is considered one of the most difficult-to-grind minerals used in industry. Due to this especially high resistance to fragmentation, the handling of frac sand has a low vulnerability to the formation of particles in the respirable size range.
The smallest grain size of frac sand that satisfies API specifications is 105 micrometers—a size that is more than 40 times larger in diameter and more than 70,000 times larger in mass than a respirable 4-micrometer (aerodynamic size) particle. The extraction, screening, and drying processes used in frac sand mining and processing do not impose the energy needed for significant attrition of the crystalline silica grains to form PM4 particles.
The as-mined sand has a high moisture content, which suppresses the release of even the binding materials between the grains of crystalline silica. Once screened and dried, the large frac sand particles are handled in equipment with high efficiency ventilation and control systems. Accordingly, low emissions are expected.

4.3. Sources Contributing to Local Background Concentrations

The localized background concentrations measured using data from samplers during crosswind flow periods indicate that in Western Wisconsin, the combined set of natural and anthropogenic sources generate localized background respirable crystalline silica concentrations that average less than 0.26 µg/m3 (values below the LOQ treated as LOQ/ 2 ) and have maximum 24 h average concentrations that are usually below 2.1 µg/m3. These levels are consistent with the probable contributions of respirable crystalline silica from the numerous farms and unpaved roads throughout the study area in Wisconsin. Contributions to ambient background concentrations are expected considering the very high respirable crystalline silica concentrations of more than 1000 µg/m3 reported in studies of farmer exposure by Nieuwenhuijsen [29], Norton and Gunter [30], Syzkman et al. [31] and Archer et al. [32]. Stopford and Stopford [33] found quartz levels in farm soil particles less than 4.25 µm that ranged from 10.5% to 44.5% by weight, and Gillette [34] has suggested that global transport of soil dusts contributes to ambient levels of crystalline silica in distant urban areas. Agricultural sources almost certainly are a major contributor to local background concentrations in areas such as Wisconsin. All four facilities sampled in this project were bounded on at least two sides by active farms.
The long-term average PM4 crystalline silica concentrations measured at the four facilities were very similar to estimated maximum crystalline silica concentrations calculated by the WDNR [9] based on PM2.5 elemental silicon data compiled from 2001 to 2009 at three U.S. EPA-operated PM2.5 speciation sites in Wisconsin. WDNR calculated maximum crystalline silica concentrations of 0.10 µg/m3 in Mayville (Dodge County), 0.14 µg/m3 in Milwaukee (Milwaukee County), and 0.32 µg/m3 in Waukesha (Waukesha County). In calculating these maximum concentrations, WDNR assumed that 100% of the elemental silicon was in the form of crystalline silica.

4.4. Additional Research Needed

Additional sampling is needed to evaluate respirable crystalline silica concentrations at the fence lines of other industrial, agricultural, and community sources. More long-term average concentration data are needed concerning the seasonal variability of background concentrations, especially in arid areas subject to wind entrainment of crystalline silica containing soil. Analysis of the respirable crystalline silica levels contributed by globally transported desert dust would be helpful in analyzing daily variations in measured concentrations. Procedures for characterizing concentration data below the LOQ of 0.31 µg/m3 would be helpful in analyzing the data, especially the background concentrations.
The variability in the susceptibility to attrition of grains of sand in various soils and rocks would be helpful in evaluating site-to-site differences in respirable crystalline silica concentrations.

5. Conclusions

The geometric mean respirable crystalline silica concentration for the entire data set was 0.26 µg/m3 when values below the limit of quantification were treated as LOQ/ 2 concentrations. The long-term average concentrations for the entire data set of 2128 twenty-four hour respirable crystalline silica measurements and the long-term averages at each of the four facilities were less than 10% of the California OEHHA [1] 70-year chronic reference level of 3.0 µg/m3.
All four facilities operated samplers in an upwind-downwind configuration. Analyses of the data during days when the air moved across the facilities over the samplers indicated that the respirable crystalline silica concentrations changed from −1.4 µg/m3 to +1.5 µg/m3. There were no significant differences in the upwind-to-downwind long-term concentrations for the three sand-producing mines and the processing plant. The measured respirable crystalline silica levels were in the background concentration range. Accordingly, these data indicate that the exposure to respirable crystalline silica near frac sand producing facilities is the same as exposures in areas throughout this region.
The PM2.5 U.S. EPA Federal Reference Method samplers adapted for PM4 particulate matter sampling worked well in all four sand mine and sand processing facility sampling programs. The sampling and analytical techniques provided a sensitive lower limit of quantification of 0.31 µg/m3. Comparisons of the PM4 particulate matter data compiled from primary and collocated samplers demonstrated precise results. All twelve of the primary and collocated samplers passed routine audits conducted on both a biweekly and quarterly basis over more than a two-year period. Filter blank analyses confirmed proper field and laboratory procedures.
The sampling and analytical procedures used in this study are readily available to others wishing to evaluate ambient PM4 crystalline silica concentrations. Samplers meeting the design requirements of 40 CFR Part 50, Appendix L [3] and equipped with PM2.5 50% cut size sharp cut cyclones can be modified for respirable particulate matter sampling by adjusting the sample flow rate from 16.7 liters per minute to 11.1 liters per minute. The crystalline silica fraction of the PM4 particulate matter samples can be measured using NIOSH Method 7500 X-Ray Diffraction analyses with an LOQ of 5 µg. PVC filters with an average pore size of five micrometers are used to facilitate the X-Ray Diffraction analyses. These filters are identical to those used for occupational exposure sampling. The respirable crystalline silica measurement technique uses commercially available EPA reference method samplers and well-established NIOSH analytical procedures.

Acknowledgements

The authors gratefully acknowledge the significant contributions of the numerous individuals and organizations participating in this study. Brian Imholte of Kraemer Mining, Inc. operated the samplers and conducted the biweekly sampler audits. EOG Resources, Inc. provided financial support for purchasing the samplers, purchasing the meteorological monitoring instruments, and operating the network of samplers. WDNR personnel provided assistance in the review of some of the sampling program protocols and in an annual field audit of the samplers. R.J. Lee Group, Inc. personnel conducted the NIOSH Method 7500 crystalline silica analyses.

Author Contributions

John Richards and Todd Brozell jointly designed the sampling program and selected the sampling locations. John Richards prepared the test program protocols. Todd Brozell trained the operator and conducted the on-site quarterly audits. John Richards and Todd Brozell jointly reviewed the data and prepared the paper.

Conflicts of Interest

The authors have no financial interests in the facilities sampled. The authors served as independent contractors to the facilities to select the sampling equipment, select the sampling locations, prepare the test program protocols, train the sampler operator, conduct quarterly audits of all of the samplers, and reduce the data compiled throughout the sampling program.

References

  1. California Office of Environmental Health Hazard Assessment. Chronic Toxicity Summary, Silica (Crystalline, Respirable). 2005. Available online: www//oehha.ca.gov/air/chronic_rels/pdf/SILICAcREL_Final.pdf (accessed on 31 May 2015). [Google Scholar]
  2. Richards, J.; Brozell, T. Ambient PM4 Crystalline Silica Monitoring Method Development; Report to CalCIMA; California Construction and Industrial Materials Association: Sacramento, CA, USA, 2005. [Google Scholar]
  3. U.S. Environmental Protection Agency. Reference Method for the Determination of Fine Particulate Matter as PM2.5 in the Atmosphere. 40 CFR Part 50, Appendix L. 1997. Available online: http://www.gpo.gov/fdsys/granule/CFR-2011-title40-vol2/CFR-2011-title40-vol2-part50-appL (accessed on 31 May 2015). [Google Scholar]
  4. National Institute of Occupational Safety and Health. Method 7500, Silica, Crystalline by XRD (Filter Deposition). Issue 4; 2003. Available online: http://www.cdc.gov/niosh/docs/2003-154/pdfs/7500.pdf (accessed on 31 May 2015). [Google Scholar]
  5. National Institute of Occupational Safety and Health. Method 0600, Particles Not Otherwise Regulated, Respirable. 1998. Available online: www.cdc.gov/niosh/docs/2003-154/pdfs/0600.pdf (accessed on 31 May 2015). [Google Scholar]
  6. Richards, J.; Brozell, T.; Rea, C.; Boraston, G.; Hayden, J. PM4 crystalline silica emission factors and ambient concentrations at aggregate-producing sources in California. Air Waste Manag. J. 2005, 59, 1287–1296. [Google Scholar] [CrossRef]
  7. South Coast Air Quality Management District. Sampling and Analysis of Samples Collected in the Cities of Duarte and Azusa; Report MA 2006-01; South Coast Air Management District: Diamond Bar, CA, USA, 2006.
  8. South Coast Air Quality Management District (2008). Sampling and Analysis of Samples Collected in the Cities of Duarte and Azusa, Follow-Up #4. Report MA 2008-03. 2008. Available online: http://www.azusarock.com/docs/AQMD2008FollowUp.pdf (accessed on 31 May 2015).
  9. Wisconsin Department of Natural Resources. Report to the Natural Resources Board, Silica Study. August 2011. Available online: http://dnr.wi.gov/topic/AirQuality/documents/FinalSilicaReport.pdf (accessed on 31 May 2015). [Google Scholar]
  10. Minnesota Environmental Quality Board. Report on Silica Sand. 20 March 2003. Available online: https://www.eqb.state.mn.us/sites/default/files/documents/March%20Final%20Silica%20Sand%20report%20with%20award%20sticker.pdf (accessed on 12 July 2015).
  11. U.S Environmental Protection Agency. Probe and Monitoring Path Siting Criteria for Ambient Air Quality Monitoring. 40 CFR Part 58, Appendix E. Amended; 15 January 2013. Available online: http://www.ecfr.gov/cgi-bin/text-idx?tpl=/ecfrbrowse/Title40/40cfr58_main_02.tpl (accessed on 13 July 2015). [Google Scholar]
  12. U.S. Environmental Protection Agency. Sampling Schedule Calendar. Available online: www.epa.gov/ttnamti1/calendar.html (accessed on 12 July 2015).
  13. U.S. Environmental Protection Agency. Quality Assurance Handbook for Air Pollution Measurement Systems Volume II Ambient Air Quality Monitoring Program. EPA Publication EPA-454/B-13-003; May 2013. Available online: http://www.epa.gov/ttnamti1/files/ambient/pm25/qa/QA-Handbook-Vol-II.pdf (accessed on 13 July 2015). [Google Scholar]
  14. Hornung, R.W.; Reed, L.D. Estimation of average concentration in the presence of nondetectable values. Appl. Occup. Environ. Hyg. 1990, 5, 46–51. [Google Scholar] [CrossRef]
  15. Treutel, Jason; (Wisconsin Department of Natural Resources); Richards, John; (Air Control Techniques, P.C.). Personal communication, 2015.
  16. U.S Environmental Protection Agency. Quality Assurance Requirements for SLAMS, SPMs, and PSD Air Monitoring. 40 CFR Part 58, Appendix A. Amended; 15 January 2013. Available online: http://www.ecfr.gov/cgi-bin/text-idx?SID=84ef9f0996c2e59ff713c5ea7a8f4ffd&mc=true&node=ap40.6.58_161.a&rgn=div9 (accessed on 16 July 2015). [Google Scholar]
  17. Minnesota Pollution Control Agency. Winona Community Air Monitoring, January 2014–September 2014. January 2015. Available online: http://www.pca.state.mn.us/index.php/view-document.html?gid=21302 (accessed on 16 July 2015).
  18. Minnesota Pollution Control Agency. Shakopee Sand (Previously Great Plains Sand) Ambient Air Monitoring, July 2012–December 2013. April 2014. Available online: http://www.pca.state.mn.us/index.php/air/air-quality-and-pollutants/air-pollutants/silica-sand-mining/air-monitoring-data-at-minnesota-silica-sand-facilities.html#shakopee-sands (accessed on 31 May 2015).
  19. Minnesota Pollution Control Agency. Tiller-North Branch Ambient Air Monitoring, November 2012–December 2013. April 2014. Available online: http://www.pca.state.mn.us/index.php/air/air-quality-and-pollutants/air-pollutants/silica-sand-mining/air-monitoring-data-at-minnesota-silica-sand-facilities.html#tiller-north-branch (accessed on 31 May 2015).
  20. California Environmental Protection Agency, Air Resources Board. Pilot Monitoring Study of Crystalline Silica in Ambient Air in Lompoc, California. 2003. Available online: http://www.cdpr.ca.gov/docs/specproj/lompoc/arbsilica_0403.pdf (accessed on 31 May 2015). [Google Scholar]
  21. Stacey, P.; Thorpe, A.; Roberts, P. Levels of Respirable Dust and Respirable Crystalline Silica at Construction Sites. Report of the Health and Safety Laboratory, England; 2011. Available online: http://www.hse.gov.uk/research/rrpdf/rr878.pdf (accessed on 31 May 2015). [Google Scholar]
  22. Environmental Health Board, Queensland Health. Health Risk Assessment of Community Exposure to Silica from Airport Link/Northern Busway Construction Activities. 2012. Available online: https://www.ehp.qld.gov.au/air/pdf/airportlink-qh-report.pdf (accessed on 31 May 2015). [Google Scholar]
  23. Shiraki, R.; Holmén, B.A. Airborne respirable silica near a sand and gravel facility in central California: XRD and elemental analysis to distinguish source and background quartz. Environ. Sci. Technol. 2002, 36, 4956–4961. [Google Scholar] [CrossRef] [PubMed]
  24. Saiyed, H.N.; Sharma, Y.K.; Sadhu, H.G.; Norboo, T.; Patel, P.D.; Patel, T.S.; Venkaiah, K.; Kashyap, S.K. Non-occupational pneumoconiosis at high altitude villages in central Ladakh. Br. J. Ind. Med. 1991, 48, 825–829. [Google Scholar] [CrossRef] [PubMed]
  25. Bhagia, L.J. Non-occupational exposure to silica dust in vicinity of slate pencil industry, India. Environ. Monit. Assess. 2009, 151, 477–482. [Google Scholar] [CrossRef] [PubMed]
  26. Davis, B.; Johnson, R.; Stevens, R.; Courtney, W.; Safriet, D. The quartz content and elemental composition of aerosols from selected sites of the EPA Inhalable Particulate Network. Atmos. Environ. 1984, 18, 771–782. [Google Scholar] [CrossRef]
  27. Wisconsin Department of Natural Resources. Wisconsin Air Quality Trends. April 2014. Available online: http://dnr.wi.gov/files/PDF/pubs/am/AM523.pdf (accessed on 31 May 2015). [Google Scholar]
  28. U.S. Environmental Protection Agency (EPA). Ambient Levels of Noncancer Health Effects of Inhalable Crystalline and Amorphous Silica; U.S. EPA: Washington, DC, USA, 1996.
  29. Nieuwenhuijsen, M.J.; Noderer, K.S.; Schenker, M.B.; Vallyathan, V.; Olenchock, S. Personal exposure to dust endotoxin and crystalline silica in California agriculture. Ann. Occup. Hyg. 1995, 32, 24–31. [Google Scholar]
  30. Norton, M.R.; Gunter, M.F. Relationships between respiratory diseases and quartz-rich dust in Idaho, U.S.A. Am. Mineral. 1999, 84, 1009–1019. [Google Scholar]
  31. Syzkman, J.; Mintz, D.; Creilson, J.; Wayland, M. Impact of April 2001 Asian Dust Event on Particulate Matter Concentrations in the United States. U.S. EPA Trends Report; 2001. Available online: http://www.epa.gov/airtrends/aqtrnd03/pdfs/1_asiandust.pdf (accessed on 31 May 2015). [Google Scholar]
  32. Archer, J.; Cooper, G.; Reist, P.; Storm, J.; Nylander-French, L. Exposure to respirable crystalline silica in Eastern North Carolina farm workers. Am. Ind. Hyg. Assoc. J. 2002, 63, 750–755. [Google Scholar] [CrossRef]
  33. Stopford, C.; Stopford, W. Respirable quartz content of farm soil. Appl. Occup. Environ. Hyg. 1995, 10, 196–199. [Google Scholar] [CrossRef]
  34. Gillette, D. Soil derived dust as a source of silica: Aerosol properties, emissions, deposition, and transport. J. Expo. Anal. Environ. Epidemiol. 1995, 7, 303–311. [Google Scholar]

