Article

Atmospheric Black Carbon along a Cruise Path through the Arctic Ocean during the Fifth Chinese Arctic Research Expedition

1
Institute of Polar Environment, School of Earth and Space Sciences, University of Science and Technology of China, Hefei 230026, China
2
Chinese Academy of Meteorological Sciences, Beijing 100081, China
*
Authors to whom correspondence should be addressed.
Atmosphere 2014, 5(2), 292-306; https://doi.org/10.3390/atmos5020292
Submission received: 21 February 2014 / Revised: 16 April 2014 / Accepted: 22 April 2014 / Published: 5 May 2014

Abstract

:
From July to September 2012, during the fifth Chinese National Arctic Research Expedition (CHINARE), the concentrations of black carbon (BC) aerosols inside the marine boundary layer were measured by an in situ aethalometer. BC concentrations ranged from 0.20 ng∙m−3 to 1063.20 ng∙m−3, with an average of 75.74 ng∙m−3. The BC concentrations were significantly higher over the mid-latitude and coastal areas than those over the remote ocean and high latitude areas. The highest average concentration was found over offshore China (643.44 ng∙m−3) during the cruise, while the lowest average was found over the Arctic Ocean (5.96 ng∙m−3). BC aerosol was found mainly affected by the terrestrial input and displayed seasonal and spatial variations. Compared with the results from the third and fourth CHINARE of summer 2008, and summer 2010, the inter-annual variation of BC over the Arctic Ocean was negligible.

1. Introduction

Black carbon (BC) aerosol is a kind of amorphous carbon released to the atmosphere by incomplete combustion of fossil and biomass fuels [1]. It can be found in the atmosphere, soil, snow, ice, ocean and lake sediments. BC is the main component in atmospheric aerosols absorbing sunlight and can hardly be depleted through chemical reactions in the atmosphere. It is mainly removed by rain and snowfall [2]. Compared with greenhouse gases in the atmosphere, such as CO2, CH4, and O3, black carbon has a wider absorption band from ultraviolet to infrared. Therefore, the black carbon in the atmosphere can influence the earth-air energy balance system through absorbing solar and atmospheric radiation, thus affecting the climate. Previous studies pointed out that BC aerosol may be the second major cause of global warming, just following CO2. The direct radiation forcing of BC can reach up to 0.9 W∙m−2, which is 55% of that caused by CO2, and larger than the other greenhouse gases, such as methane, chlorofluorocarbons and ozone [3]. The process of forming BC also releases scattered aerosols, such as sulfate, nitrate and organic carbon, which have a cooling effect on Earth’s radiation budget. Previous studies implied that scattered aerosols can greatly increase the BC positive radiation forcing [4].
The Arctic Ocean is surrounded by Eurasia and the North American mainland, with a high population density. Climate change in this region has caused great concern in academic fields and society. Since 1970, more and more scholars began to research the influence of human activities on the climate and the ecological environment of the Arctic regions. IPCC pointed out that, in the trend of global warming, the Arctic warming rate is almost two times the average rate of the world [5], while the Arctic sea ice area is reduced by a rate of 2.7% per ten years [6]. Although BC is a short-lived atmospheric component, compared with other greenhouse gases, its radioactive forcing has an important impact on the climate of the Arctic region [7]. Black carbon was identified in the Arctic haze aerosols by Rosen et al. [8] and in Arctic snow by Clarke and Noone [9]. The BC polluted ice surfaces can effectively reduce the ice albedo, make ice absorb more solar radiation and, thus, lead to the accelerated melting of the ice and an increased temperature [10]. The Arctic Monitoring and Assessment Program (AMAP) reported that the effect BC has on Arctic warming by its high radiative forcing is nearly four times that of the global average of 0.6 °C per year BC has garnered wide attention as an important component of atmospheric aerosols, because of its impact on the Arctic climate.
During the fifth Chinese Arctic Research Expedition (CHINARE 2012), BC concentrations over oceans were measured in situ. This study provides updated information on the spatial distribution of BC over oceans from low latitudes to high latitudes and the scientific foundation for future evaluation and research on climate and environment change in the Arctic regions.

2. Experimental Methods

2.1. The Cruise Route

BC concentrations were monitored on the icebreaker, Xuelong, during the 5th CHINARE 2012. The icebreaker set sail from Qingdao on 2 July 2012, and came back to Shanghai Harbor on 27 September 2012. The research regions included offshore China, the Sea of Japan, the Northwest Pacific, the Bering Sea, the Chukchi Sea and the Arctic Ocean (Figure 1). Especially, different from previous CHINAREs, the icebreaker passed through the Arctic Ocean along the northern sea route and visited Iceland during this cruise. The entire route lasted for more than 80 days and sailed more than 18,500 nautical miles. The navigation in the ice region (sea ice amount >80%) was up to 5370 nautical miles with a northernmost point of 87°40′N.
Figure 1. The route of the 5th Chinese Arctic Research Expedition (CHINARE).
Atmosphere 05 00292 g001

2.2. Observation and the Data Processing

An aethalometer (Model AE31, by Magee Scientific Co.) was placed on the icebreaker and used to monitor BC concentrations over oceans along the cruise. The aethalometer uses an LED light source with seven wavelengths (central wavelengths: 370, 470, 520, 590, 660, 880 and 950 nm). Five-minute averaged BC concentrations were recorded. Details of the observation method were described by Tang et al. [11]. Generally, the instrument was installed in the meteorological room, under the forecastle cab of the Xuelong. The sampling inlet used specific plastic tubes of 3/8-inch (1 inch = 0.025 m) diameter and extended to the left rear of the sample observation deck atop the cab. The air inlet was about 1.5 m higher than the deck fence and 30 m higher than the sea surface. The engine is in the rear of the vessel. BC were not affected by the plume during the normal voyage. However, when the vessel stopped, it sailed at low speed or the relative directions were from the rear, it may have been influenced by the ship’s emissions. Considering ship speed, relative wind speed and direction and other information, abnormal data was removed, and a “smooth baseline” was used as a reference. This baseline is obtained by applying a moving spline smoothing method to the five-minute BC dataset. Disturbed data with values 3-sigma (hourly standard deviation) higher than baseline in the 5-minute original record were excluded [11]. Then, hourly average values were calculated. Effective data obtained after the processing accounted for about 80.07% of the total original data.

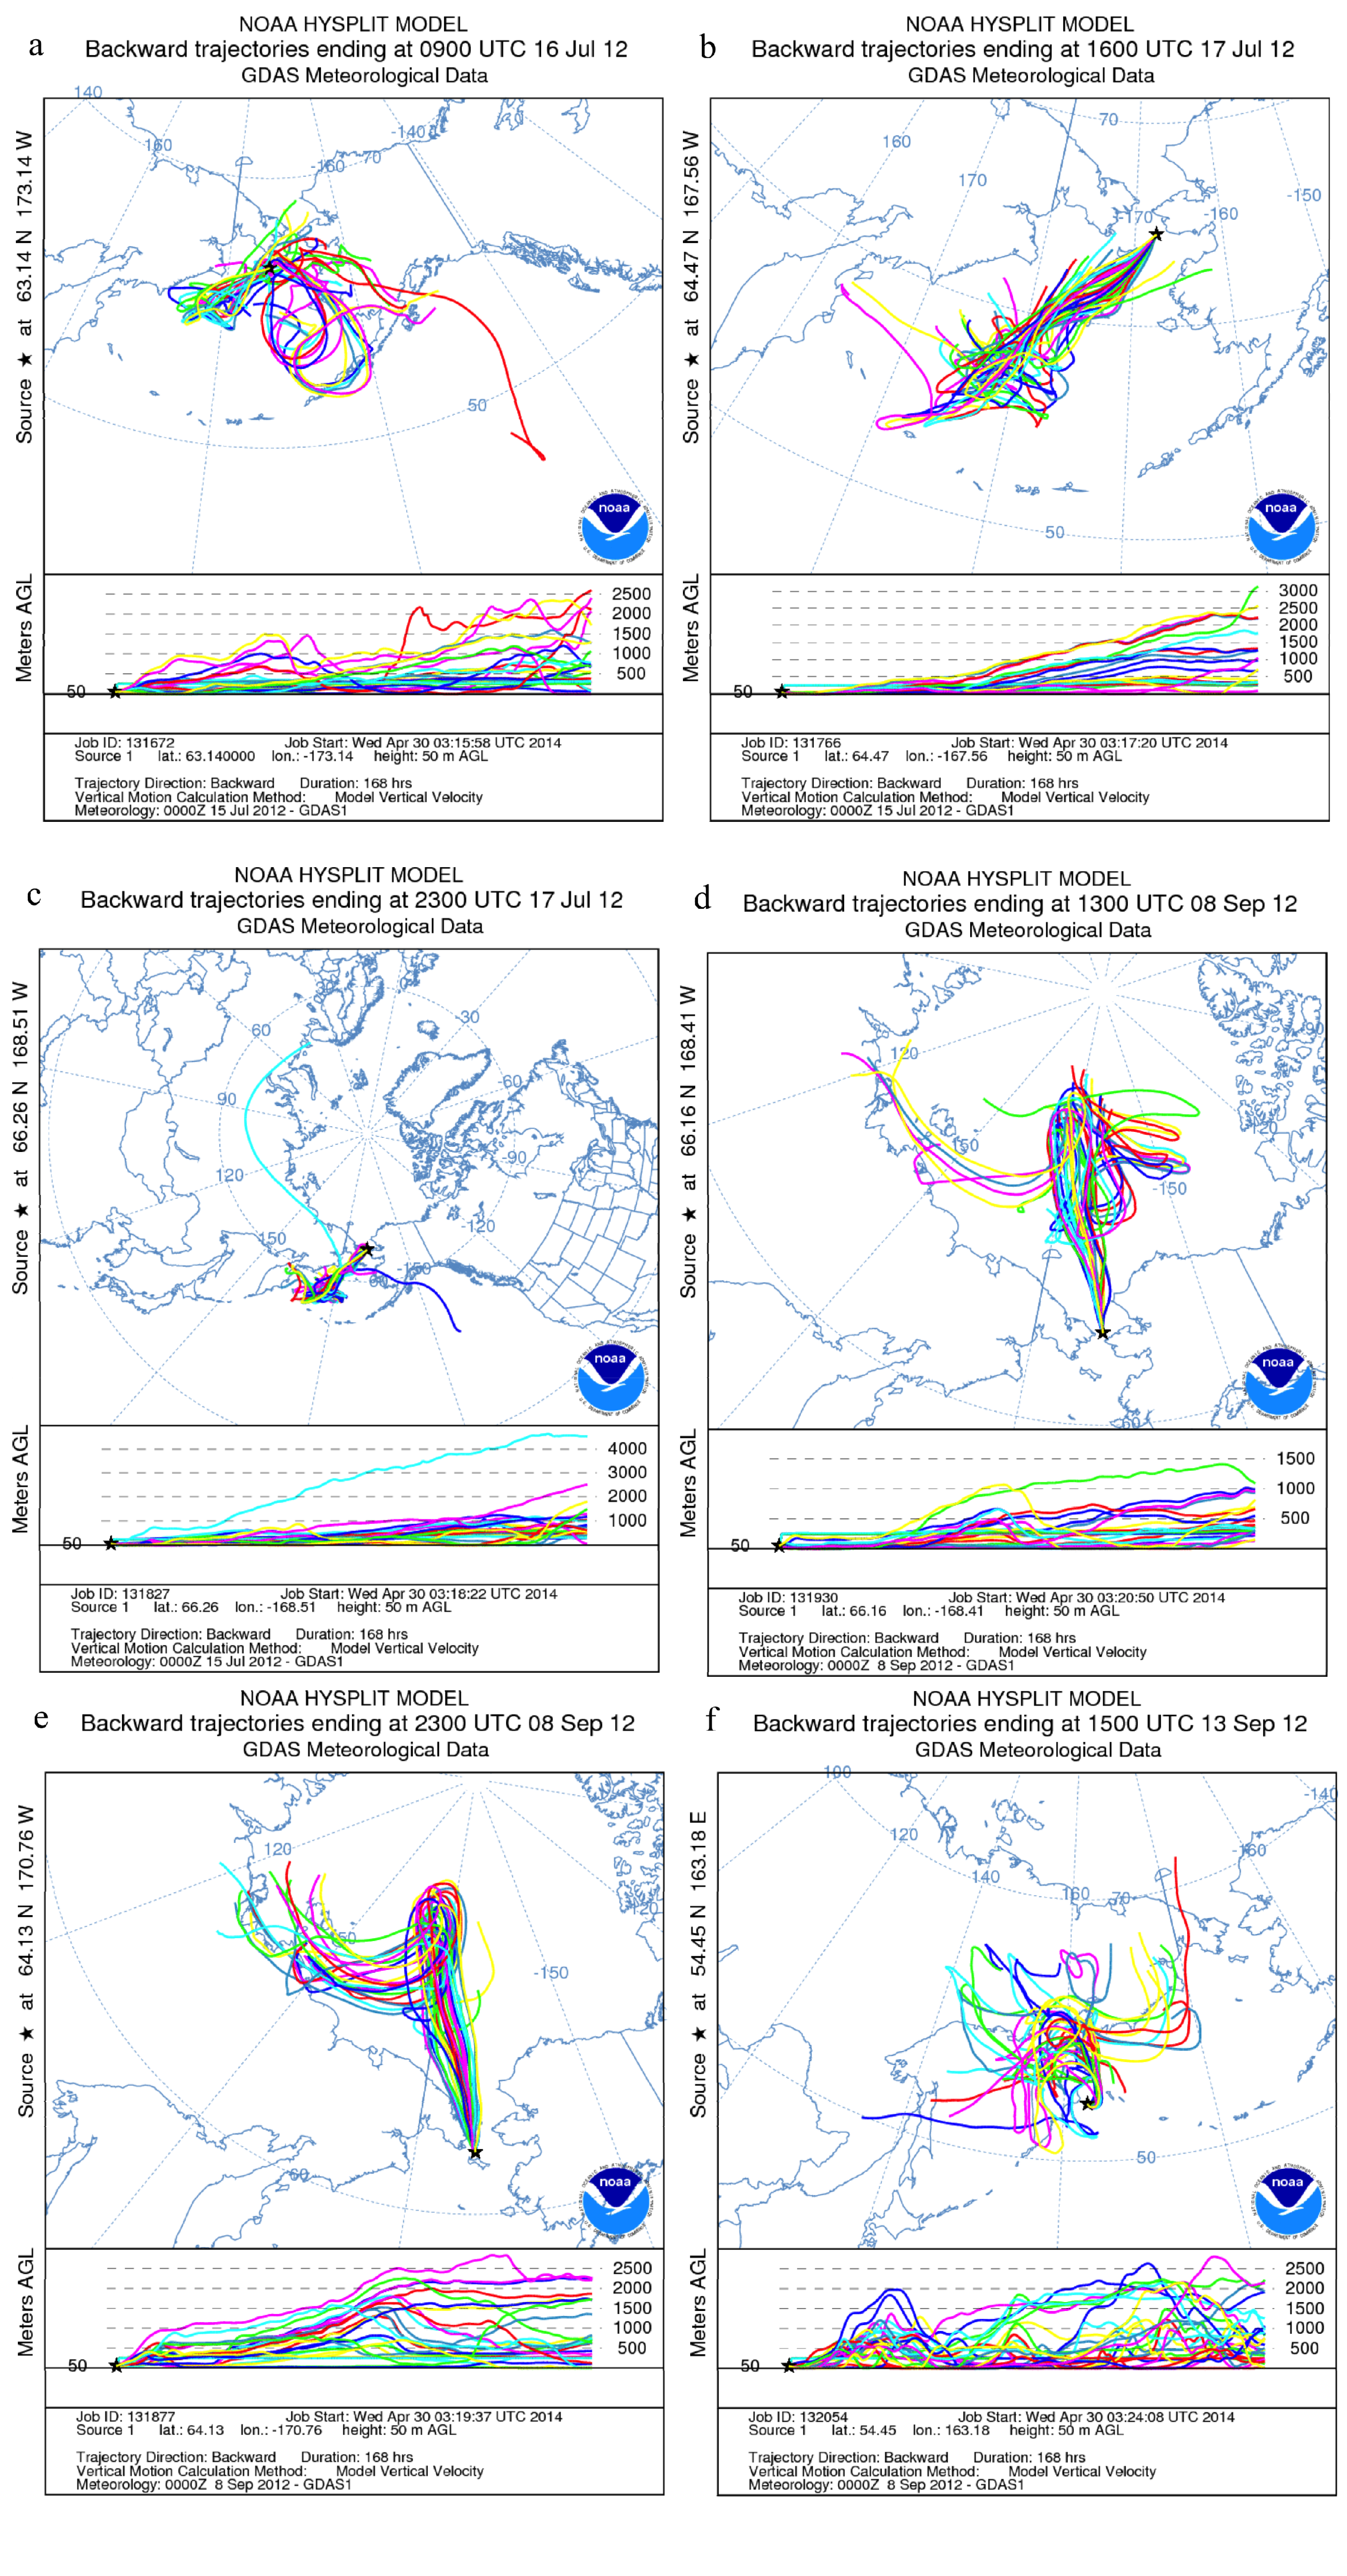
2.3. Air Mass Back Trajectories

In order to identify the origin of air masses and the source of aerosols, air mass back trajectories (BTs) were traced by the transmission diffusion model of HYSPLIT (hybrid single-particle Lagrangian integrated trajectory) from the Air Resources Laboratory of the United States National Oceanic and Atmospheric Administration [12]. Seven-day BTs were shown for each significant site at the altitude of 50 m above sea level.

3. Results and Discussion

3.1. Temporal and Spatial Variation of Hourly Average Concentration

Hourly averaged concentrations of BC during the cruise are presented in Figure 2. There is no data over the coastal regions of Russia, because the instrument was shut down, due to sovereign reasons. BC concentrations over oceans varied by a wide range from 0.20 ng∙m−3 to 1063.20 ng∙m−3, with an average of 75.74 ± 163.07 ng∙m−3. Here, the entire cruise was divided into different parts, referring to spatial and temporal variations (Table 1).
Figure 2. Hourly average concentrations of black carbon aerosols along the fifth CHINARE. (a) Departing route; (b) return route.
Atmosphere 05 00292 g002
The highest average concentration was found over offshore China during the return route (643.44 ± 152.15 ng∙m−3) with a median of 603.33 ng∙m−3. The Sea of Japan during the return route also had quite high BC concentrations, with a mean value of 443.87 ± 266.09 ng∙m−3 and a median value of 460.61 ng∙m−3. In addition, BC concentrations over the Sea of Japan, offshore China and the coastal region of Iceland were at relatively high levels. Additionally, those over the Northwest Pacific Ocean, the Bering Sea, the Chukchi Sea and the Arctic Ocean were at relatively low levels. The lowest average concentration of BC occurred over the high latitude Arctic Ocean (5.96 ± 4.58 ng∙m−3), with a median of 4.87 ng∙m−3.
Generally, due to the significant impact of human activities, BC concentrations over coastal regions, such as offshore China, the Sea of Japan and the coastal region of Iceland, were much higher than those over remote oceans, such as the Arctic Ocean. According to hourly averaged data, BC concentrations in the anchorage of Yangtze River Estuary on 23 September 2012, significantly increased to 753.76 ng∙m−3. This may cause a higher average concentration over offshore China than that over the Sea of Japan.
The average concentrations of BC over remote oceans in the mid-latitude areas (30°~60°N), such as the south edge of the Okhotsk Sea, the Northwest Pacific Ocean, the Bering Sea and the Bering Strait, were similar: about 15–33 ng∙m−3. For these areas, BC concentrations were stable, and the standard deviations were relatively small, indicating that BC was well mixed in the boundary layer during long-range transport. Nevertheless, for the Bering Strait, some high BC concentrations were observed, due to the input from nearby land. These data would be discussed, especially in Section 3.4.
Table 1. Black carbon concentrations of different seas along the fifth CHINARE Arctic route.
NumberSea NamesTimeAverage/ng∙m3SD/ng·m3Median/ng∙m3
1Offshore China6.27–7.3.2012192.81102.80203.27
2Sea of Japan7.3–7.6.2012170.8969.19170.75
3Sea of Okhotsk7.6–7.8.201232.8123.6425.69
4Northwest Pacific Ocean7.8–7.11.201215.187.9513.00
5Bering Sea and Bering Strait7.11–7.19.201221.8912.9821.50
6Chukchi and East Siberian Sea7.19–7.24.201221.8115.6715.11
7Barents Sea7.31–8.2.20129.405.397.88
8Norwegian Sea8.2–8.14.201214.669.9811.56
9Iceland8.16–8.20.2012142.61114.26136.04
10Greenland Sea8.22–8.24.201211.034.5310.19
11High latitude Arctic Ocean8.24–9.6.20125.964.584.87
12Chukchi and East Siberian Sea9.6–9.7.201219.519.7016.95
13Bering Sea and Bering Strait9.8–9.14.201218.2313.4513.49
14Northwest Pacific Ocean9.14–9.19.201224.2416.4719.26
15Sea of Japan9.19–9.21.2012443.87266.09460.61
16Offshore China9.21–9.23.2012643.44152.15603.33
In the high latitude areas, including the Chukchi and East Siberia Sea, the Norwegian Sea, the Barents Sea, the Greenland Sea and the high latitude area of the Arctic Ocean, BC concentrations were obviously lower than those in the middle latitudes and coastal seas. Large distances from human activities and low temperatures with a weak exchange and mixing effect of air masses caused low BC concentrations in these regions. The results in the Arctic Ocean will be specifically discussed in the following section.

3.2. BC Concentration in the Arctic Region

In the Arctic, the deposition of BC aerosols in the snow or ice surface can change the physical and chemical properties of snow or ice and make the surface absorb solar radiation more effectively [9]. Therefore, BC can accelerate the melting of snow and ice, cause tundra or the sea surface to be exposed to air and, thus, stimulate a stronger climate warming effect [13]. In the dry winter, aerosols from high latitudes migrate to the Arctic region. They gather and form an Arctic haze [14,15,16,17], heating the lower atmosphere, causing the warming effect. Accompanied with Arctic haze, the warming effect of BC is also greatly enhanced and even could cause surface air temperature to rise by 0.5 °C [7]. Many studies showed that BC aerosol is a very effective warming component in the Arctic, and its impact on mountain snow and glaciers is even comparable with CO2 [7,18,19].
The ice core records in Greenland showed that BC concentrations increased significantly since the industrial revolution and decreased since the Soviet Union’s industrial decline [20]. Due to the fast economic development of Asia in the late 20th century, BC concentrations increased again [20]. Although the ice cores can be used to reconstruct the variation of BC concentration in long time scales, for a better understanding of the transmission mechanism and atmospheric effects of BC in the Arctic, in situ observation is necessary.
According to an observation from 1989 to 2003 in Barrow and Alert by Sharma et al. [21], the annual average concentration of BC aerosol was about 25 ng∙m−3. Eleftheriadis et al. [22] found that the annual average concentration of BC observed at Zeppelin during 1998 to 2007 reached 39 ng∙m−3. Besides, BC concentrations in summer were generally lower than those in winter and annual averages. For example, in China’s Yellow River Station, the BC concentration observed during a summer expedition was 15 ng∙m−3 [23]; while the average concentration during summer was only 7 ng∙m−3 in Zeppelin [22]. The phenomenon in which BC had a higher concentration in winter was in accordance with the seasonal variations of BC in ice cores [20]. It was associated with the change of the Arctic front position. Studies showed that the Arctic front moves northward in the summer and, thus, prevents pollution from the surrounding continents to the higher latitude area. However, the Arctic front moves southward in winter to about 50°N, so more pollutants can be transported to the Arctic from lands in lower latitudes [24].
Furthermore, air masses at these stations were influenced by different meteorological conditions [24,25], such as ground inversion and katabatic wind, so the observed results varied significantly. On the other hand, being affected by the industrial emissions, forest fires and other factors, BC concentrations were quite different from year to year.
Some studies on BC aerosol in the Arctic have been conducted [5,21,22,23,26,27,28,29,30,31,32,33] (Table 2). In this study, the average concentration of BC in the Arctic Ocean (north of 72 °N) was 5.96 ng∙m−3. Compared to previous studies in summer, our results showed a lower concentration than that at Zeppelin, Yellow River Station and Alert, but higher than that at Barrow station. Unlike stations affected by the local geographic and meteorological conditions and human activities, this expedition comprised a large spatial range, and the result in this study could represent the average concentration of BC in the Arctic marine atmosphere.

3.3. Comparison with Previous CHINARE Results

The results were compared with the average concentrations of BC over the Arctic Ocean during the third and fourth CHINARE in 2008 and 2010 [32] (Figure 3). The cruise during the fifth CHINARE passed through the Arctic Ocean via the northern sea route. The sea located at more than 72°N was divided into smaller regions, such as the Barents Sea, the Norwegian Sea and the Greenland Sea, in order to provide a more detailed distribution of BC aerosol. During the return route, the vessel passed through the high latitude Arctic Ocean. Obviously, the BC concentrations over the Arctic Ocean were geographically different (Table 1). The lowest was found to be in the central Arctic Ocean. In addition, the BC level was relatively high in the Chukchi and East Siberian than the Barents Sea, Greenland Sea and Norwegian Sea. However, despite the cruise routes being somewhat different, the BC concentrations of the Arctic Ocean among three campaigns were not significantly different. One of the potential reasons may be due to the change in the position of the Arctic front in summer. As previously reported, the Arctic front moves southward in summer, so that it reduces the input of BC from lower latitude regions [24]. In the event of long-range transport, the air mass will be also mix uniformly. In addition, there are no obvious local sources of BC in the Arctic Ocean. Consequently, the BC concentrations are kept stable in the Arctic Ocean compared to other regions.
Table 2. Black carbon concentrations at Arctic land sites and the Arctic Ocean.
Site or RoutePeriodBC Concentration/ng∙m−3Ref.
Ny-Ålesund (78.9°N, 11.9°E)April 1977–May 197968 (3~174)[26]
1990–199280[27]
Zeppelin, Ny-Ålesund (78.9°N, 11.9°E)1998–200739 (0~80)[22]
June–September 1998–2007 0~10
Yellow River Station, Ny-Ålesund (78.9°N, 11.9°E)Summer 2005–200815[23]
Norwegian part of the ArcticJune–September 1980 5[28]
Barrow (71.2°N, 156.6°W)1986–199510~5,000[29]
1988–199326 (1~300)[5]
1989–200320~40[21]
January 1989–December 199070 (16~320)[30]
2006–2007a14.1[33]
2006–August 2007a3.4
Alert (82.4°N, 62.3°W)1989–20028~96[31]
1989–200325~73[21]
2004–200552.2[33]
August 2004–200514.3
Arctic OceanAugust 2008 6.4 (3.0~10.7)[32]
August 20106.9
High latitude Arctic Ocean (>72°N)August 20125.96This work
Notes: a Barrow Station used the Particle Soot Absorption Photometer for observation, which is different from the other stations and this work. The directly measured data are the aerosol absorption coefficient (Labs). Labs are converted to equivalent black carbon concentration (EBC) via the empirical conversion formula, EBC (ng∙m−3) = Labs (M∙m−1) × 1000/19 (m2∙g−1). This formula is taken from the National Oceanic and Atmospheric Administration/Global Monitoring Division, USA.
Figure 3. Black carbon (BC) concentrations of the same sea areas during the third, fourth and fifth CHINARE-Arctic.
Atmosphere 05 00292 g003
Besides over the Arctic Ocean, BC concentrations over other seas during the three cruises were also compared in Figure 3. The spatial variation of BC during the three cruises showed similar characteristics, e.g., high concentrations in mid-latitudes and coastal areas and low levels in high latitudes and remote oceans. The average concentrations of BC over the same seas during the third, fourth and fifth CHINARE-Arctic were very close. However, the average concentration over offshore China during the fourth one was higher than that during the third and fifth CHINARE. The difference between the three expeditions in the offshore China area may be due to the different residence time and meteorological conditions in the anchorage. In addition, the amount of data in this area was limited, and this area is deeply affected by regional human activities. Generally, the interannual change of BC concentration in the same areas in recent years was small.

3.4. Impact of Terrestrial Transport

As concluded in Table 1, besides significant difference among different seas, BC concentrations also changed even in the same seas during the departing route and the return route of the fifth CHINARE. Over offshore China and the Sea of Japan, the BC average concentration during the return route (September) was higher than that during the departing route (July). A similar phenomenon was also observed during previous CHINAREs. This seasonal variations were associated with monsoon and the related transport of air masses [34]. As a terrigenous composition, BC over oceans is dominated by transport from continents [11].
During the departing route in July, offshore China and the Sea of Japan were controlled by a summer monsoon prevailing from the southeast direction. Therefore, the transport from lands to oceans was relatively weak. However, during the return route in September, the summer monsoon was greatly weakened or generally disappeared, so the transport from continents to oceans significantly enhanced. The change of the monsoon caused BC concentrations during the return route to be higher than those during the departing route.
Figure 4. Seven-day air mass backward trajectories of some special locations belonging to offshore China and the Sea of Japan. (a,b,c) Departing route; (d,e,f) return route. HYSPLIT, hybrid single-particle Lagrangian integrated trajectory.
Atmosphere 05 00292 g004
Figure 5. Seven-day air mass backward trajectories of some special locations around the Bering Strait and the Kamchatka Peninsula. (a,b,c) Departing route, (d,e,f) Return route.
Atmosphere 05 00292 g005
BC concentrations at some similar locations during the departing and return route were selected to discuss the influence of transport. As presented in Figure 4, although both the two sites were near the shore of China, Qingdao (Figure 4a) and Shanghai (Figure 4f), the origin of the air mass was quite different. When departing from Qingdao, the air mass was mostly derived from the Pacific Ocean. When returning to Shanghai, the air mass mainly came from mainland China. The change of air mass origin caused much higher BC concentrations near Shanghai than those near Qingdao. A similar situation occurred in offshore China and the Sea of Japan. As shown in Figure 4b,c, air masses over offshore China and the Sea of Japan in June and early July originated from remote oceans, so the concentrations of BC were relatively low. Nonetheless, the air mass over these areas was mostly from inland and coastal cities and, thus, led to high-level BC aerosols. BC concentrations over the Northwest Pacific Ocean varied in such a way.
BC concentrations over the Bering Sea and the Bering Strait, the Chukchi Sea and the East Sea of Siberia during the departing route were a little higher than those during the return route. It was found that the voyage was closer to the mainland in both of these two sea areas during the departing route. Specifically, while passing through the Bering Sea and the Bering Strait during the departing route, the vessel stayed for a long time around St. Lawrence Island, Port Noam and Cape Prince of Wales. During this time, the BC average concentration was relatively high. During the return route, the vessel sailed near the Kamchatka Peninsula, but BC concentrations did not increase significantly. During the departing route (Figure 5a,b,c), when the vessel sailed through the Bering Sea to the Bering Strait area, seven-day air mass backward trajectories showed that the air mass came from mid-latitude continents. The air mass brought a high-level BC aerosol and caused relatively higher BC concentrations. During the return route (Figure 5d,e,f), the vessel also passed through St. Lawrence Island and Port Noam. The air mass over these areas mainly came from the higher latitude Arctic, where human activities were limited. In addition, the backward trajectories near Kamchatka Peninsula showed that the air mass was not from the lower latitudes during the return route. Therefore, BC concentrations in this area did not increase and caused lower concentrations during the return route than those during the departing route.

4. Summary

During the fifth CHINARE in July to September 2012, BC in the marine boundary layer ranged from 0.20 ng∙m−3 to 1063.20 ng∙m−3, with an average of 75.74 ng∙m−3. Because BC was strongly impacted by human activities and originated from continents, the concentrations were significantly higher in the mid-latitude and coastal area than those in remote oceans and the high latitude area. The highest average concentration of BC was found over offshore China and the Sea of Japan, and the value during the return route (~200 ng∙m−3) was much higher than that during the departing route (400–700 ng∙m−3). This difference was caused by a monsoon and the change of the air mass origin, e.g., marine origin during the departing route and land origin during the return route, respectively. The central Arctic Ocean had the lowest BC concentration, and the average was only 5.96 ng∙m−3. Compared with the results from the third and fourth CHINARE, BC concentrations over the Arctic Ocean in recent years were relatively stable. Besides, along the whole cruise, BC concentrations also showed a similar spatial variation with previous studies.

Acknowledgements

This work was supported by the Program of China Polar Environment Investigation and Assessment (Project No. CHINARE2011-2015), the China National Natural Science Foundation (Project No. 41025020, 41176170) and the fifth China Arctic Research Expedition. The authors appreciate the assistance of all staff aboard the Xuelong during data collection and the NOAA Air Resources Laboratory (ARL) for the HYSPLIT transport and dispersion model on the Internet.

Author Contributions

Zhouqing Xie and Lingen Bian supervised the research. Lingen Bian and Juan Yu performed the field campaign. Chen Sun involved the data analysis. All of authors contributed to the discussion of results. Jie Xing, Qihou Hu and Zhouqing Xie wrote the manuscript.

Conflicts of Interest

The authors declare no conflict of interest.

References

  1. Andreae, M.O.; Crutzen, P.J. Atmospheric aerosols: Biogeochemical sources and role in atmospheric chemistry. Science 1997, 276, 1052–1058. [Google Scholar] [CrossRef]
  2. Penner, J.E.; Novakov, T. Carbonaceous particles in the atmosphere: A historical perspective to the Fifth International Conference on Carbonaceous Particles in the Atmosphere. J. Geophys. Res.: Atmos. 1996, 101, 19373–19378. [Google Scholar] [CrossRef]
  3. Ramanathan, V.; Carmichael, G. Global and regional climate changes due to black carbon. Nat. Geosci. 2008, 1, 221–227. [Google Scholar] [CrossRef]
  4. Chung, S.H.; Seinfeld, J.H. Global distribution and climate forcing of carbonaceous aerosols. J. Geophys. Res.: Atmos. 2002. [Google Scholar] [CrossRef]
  5. Arctic Climate Impact Assessment (ACIA). Arctic Climate Impact Assessment; Cambridge University Press: Cambridge, UK, 2005. [Google Scholar]
  6. Forster, P.; Ramaswamy, V.; Artaxo, P.; Berntsen, T.; Betts, R.; Fahey, D.W.; Haywood, J.; Lean, J.; Lowe, D.C.; Myhre, G. Changes in atmospheric constituents and in radiative forcing. In Climate Change 2007: The Physical Science Basis. Contribution of Working Group I to the Fourth Assessment Report of the Intergovernmental Panel on Climate Change; Cambridge University Press: Cambridge, UK, 2007; pp. 163–167. [Google Scholar]
  7. Quinn, P.; Shaw, G.; Andrews, E.; Dutton, E.; Ruoho-Airola, T.; Gong, S. Arctic haze: Current trends and knowledge gaps. Tellus B 2007, 59, 99–114. [Google Scholar] [CrossRef]
  8. Rosen, H.; Novakov, T.; Bodhaine, B. Soot in the Arctic. Atmos. Environ. 1981, 15, 1371–1374. [Google Scholar] [CrossRef]
  9. Clarke, A.D.; Noone, K.J. Soot in the Arctic snowpack: A cause for perturbations in radiative transfer. Atmos. Environ. 1985, 19, 2045–2053. [Google Scholar] [CrossRef]
  10. Jacobson, M.Z. Strong radiative heating due to the mixing state of black carbon in atmospheric aerosols. Nature 2001, 409, 695–697. [Google Scholar] [CrossRef]
  11. Tang, J.; Bian, L.; Yan, P.; Lu, C. The observational study of black carbon aerosol over the cruise during the Third National Arctic Research Expedition of China. Acta Oceanol. Sin. 2011, 33, 60–68. (in Chinese). [Google Scholar]
  12. Draxler, R.; Rolph, G. HYSPLIT (HYbrid Single-Particle Lagrangian Integrated Trajectory). 2011. Available online: http://ready.arl.noaa.gov/HYSPLIT.php (accessed on 22 April 2014).
  13. Koch, D.; Hansen, J. Distant origins of Arctic Black Carbon: A Goddard Institute for Space Studies ModelE experiment. J. Geophys. Res. 2005. [Google Scholar] [CrossRef]
  14. Barrie, L.A. Arctic air pollution: An overview of current knowledge. Atmos. Environ. 1986, 20, 643–663. [Google Scholar] [CrossRef]
  15. Hansen, A.; Rosen, H.; Novakov, T. The aethalometer—An instrument for the real-time measurement of optical absorption by aerosol particles. Sci. Total Environ. 1984, 36, 191–196. [Google Scholar] [CrossRef]
  16. Iversen, T.; Joranger, E. Arctic air pollution and large scale atmospheric flows. Atmos. Environ. 1985, 19, 2099–2108. [Google Scholar] [CrossRef]
  17. Klonecki, A.; Hess, P.; Emmons, L.; Smith, L.; Orlando, J.; Blake, D. Seasonal changes in the transport of pollutants into the Arctic troposphere-model study. J. Geophys. Res.: Atmos. 2003. [Google Scholar] [CrossRef]
  18. Flanner, M.G.; Zender, C.S.; Randerson, J.T.; Rasch, P.J. Present-day climate forcing and response from black carbon in snow. J. Geophys. Res.: Atmos. 2007. [Google Scholar] [CrossRef]
  19. Hansen, J.; Nazarenko, L. Soot climate forcing via snow and ice albedos. Proc. Natl. Acad. Sci. USA 2004, 101, 423–428. [Google Scholar] [CrossRef]
  20. McConnell, J.R.; Edwards, R.; Kok, G.L.; Flanner, M.G.; Zender, C.S.; Saltzman, E.S.; Banta, J.R.; Pasteris, D.R.; Carter, M.M.; Kahl, J.D. 20th-century industrial black carbon emissions altered arctic climate forcing. Science 2007, 317, 1381–1384. [Google Scholar] [CrossRef]
  21. Sharma, S.; Andrews, E.; Barrie, L.; Ogren, J.; Lavoue, D. Variations and sources of the equivalent black carbon in the high Arctic revealed by long-term observations at Alert and Barrow: 1989–2003. J. Geophys. Res.: Atmos. 2006. [Google Scholar] [CrossRef]
  22. Eleftheriadis, K.; Vratolis, S.; Nyeki, S. Aerosol black carbon in the European Arctic: Measurements at Zeppelin station, Ny-Ålesund, Svalbard from 1998–2007. Geophys. Res. Lett. 2009. [Google Scholar] [CrossRef]
  23. Zhan, J.; Chen, L.; Zhang, Y.; Xulin, Y.; Wei, L. Prospect of research on Arctic black carbon aerosol. Chin. J. Polor Res. 2010, 22, 56–68. (in Chinese). [Google Scholar] [CrossRef]
  24. Treffeisen, R.; Herber, A.; Ström, J.; Shiobara, M.; Yamanouchi, T.; Yamagata, S.; Holmén, K.; Kriews, M.; Schrems, O. Interpretation of Arctic aerosol properties using cluster analysis applied to observations in the Svalbard area. Tellus B 2004, 56, 457–476. [Google Scholar] [CrossRef]
  25. Nyeki, S.; Coulson, G.; Colbeck, I.; Eleftheriadis, K.; Baltensperger, U.; Beine, H. Overview of aerosol microphysics at Arctic sunrise: measurements during the NICE renoxification study. Tellus B 2005, 57, 40–50. [Google Scholar] [CrossRef]
  26. Heintzenberg, J. Size-segregated measurements of particulate elemental carbon and aerosol light absorption at remote Arctic locations. Atmos. Environ. 1982, 16, 2461–2469. [Google Scholar] [CrossRef]
  27. Heintzenberg, J.; Leck, C. Seasonal variation of the atmospheric aerosol near the top of the marine boundary layer over Spitsbergen related to the Arctic sulphur cycle*. Tellus B 1994, 46, 52–67. [Google Scholar]
  28. Lannefors, H.; Heintzenberg, J.; HANSSON, H.C. A comprehensive study of physical and chemical parameters of the Arctic summer aerosol; results from the Swedish expedition Ymer-80. Tellus B 1983, 35, 40–54. [Google Scholar]
  29. Polissar, A.V.; Hopke, P.K.; Paatero, P.; Malm, W.C.; Sisler, J.F. Atmospheric aerosol over Alaska: 2. Elemental composition and sources. J. Geophys. Res.: Atmos. 1998, 103, 19045–19057. [Google Scholar] [CrossRef]
  30. Hopper, J.; Worthy, D.; Barrie, L.; Trivett, N. Atmospheric observations of aerosol black carbon, carbon dioxide and methane in the high Arctic. Atmos. Environ. 1994, 28, 3047–3054. [Google Scholar] [CrossRef]
  31. Sharma, S.; Lavoué, D.; Cachier, H.; Barrie, L.; Gong, S. Long-term trends of the black carbon concentrations in the Canadian Arctic. J. Geophys. Res.: Atmos. 2004. [Google Scholar] [CrossRef]
  32. Tang, J.; Bian, L.; Yan, P.; Lai, X.; Lu, C. On board measurement of black carbon aerosols over the Arctic Ocean in summer. Adv. Polar Sci. 2011, 22, 253–259. [Google Scholar]
  33. World Meteorological Organization World Data Center for Aerosols. Available online: http://wdca.jrc.it/ (accessed on 29 April 2014).
  34. Liu, Y.; Zhou, M. Temporal and spatial characteristics of aerosols over the East China Sea. Acta Oceanol. Sin. 1999, 21, 32–40. [Google Scholar]

