Article

Variability of Aerosol Optical Depth and Altitude for Key Aerosol Types over Southern West Africa via CALIPSO/CALIOP Observations

1
Laboratoire des Sciences et Technologie de l’Environnement, Université Jean Lorougnon Guede, Daloa P.O. Box 150, Côte d’Ivoire
2
Laboratoire des Sciences de la Matière, de l’Environnement et de l’Energie Solaire, Université Félix Houphouet Boigny, Abidjan P.O. Box 582, Côte d’Ivoire
3
Laboratoire d’Aérologie, Université de Toulouse, CNRS, IRD, 31400 Toulouse, France
4
Institute of Ecology and Environmental Sciences (iEES-Paris) Paris, UMR IRD 242, Univ Paris Est Créteil, Sorbonne Université, CNRS, INRA, Université de Paris, F-93143 Bondy, France
5
Université de Paris-Cité and Univ Paris Est Créteil, CNRS, LISA, F-75013 Paris, France
6
LMI IESOL, Centre IRD-ISRA de Bel Air, Dakar P.O. Box 1386, Senegal
*
Author to whom correspondence should be addressed.
Atmosphere 2024, 15(4), 396; https://doi.org/10.3390/atmos15040396
Submission received: 9 February 2024 / Revised: 15 March 2024 / Accepted: 18 March 2024 / Published: 23 March 2024
(This article belongs to the Special Issue Natural Sources Aerosol Remote Monitoring (2nd Edition))

Abstract

:
The atmosphere of southern West Africa (SWA) is one of the world’s most aerosol-laden regions. This study investigated the seasonal variability of aerosol optical thickness using photometric and CALIPSO/CALIOP observations. The mean daily aerosol optical thickness (AOD) at 550 nm over the 11 AERONET stations in SWA ranged from 0.35 in the Sahel area to 0.49 in the Guinea coast area and a maximum of 0.53 observed in the Savanna area. The AERONET and CALIOP observations reveal a seasonal variability of AOD that is comparable across all sub-regions studied. The seasonal variation of the AOD spectral dependency was related to the change in the occurrence of the CALIOP-derived aerosol types, and in particular to the contribution of dust to the AOD. We also observed a north–south gradient of 2 km in the mean extinction height of the dust layer, being at 4 km and 6 km high in the Sahel and Guinea areas, respectively. This gradient is attributed to the northward migration of the monsoon flow.

1. Introduction

Aerosol concentrations in the troposphere are highly dependent on geographical location, meteorological and environmental conditions [1]. Atmospheric aerosols have a significant impact on the Earth’s radiation balance, and therefore on climate change [2,3,4]. Aerosols can have far-reaching effects on air quality and public health [5,6].
The atmospheric aerosol load in Western Africa is affected by both natural and anthropogenic aerosol sources. Aeolian mineral aerosol (hereinafter called dust) is emitted all year round in the arid and semi-arid areas of North Africa, with seasonal variations in the intensity and direction of long-range transport [7,8,9,10,11,12]. The contribution of North Africa dust sources to the global loading of dust is about 50% [13] and the dust emission is estimated to be between 400 Tg yr−1 and 2200 Tg yr−1 [14], making this the world’s largest source of mineral aerosols. The deforestation and the burning of agricultural waste all over sub-Saharan Africa is a major source of biomass burning smoke aerosol [15]. The combustion budget of North Africa for biomass burning is the second largest in the world and was estimated to be between 430 and 461 T(C)g yr−1 between 2003 and 2008 [16]. The main anthropogenic sources of combustion particulate emissions in West Africa are domestic fires, road traffic, landfill fires, industries and thermal power plants [17]. The anthropogenic aerosol emissions in West Africa are expected to increase significantly due to the population growth, land use change and economic development [18]. In particular, there is a growing concern about the impact of the increasing anthropogenic aerosol emissions on the southern part of West Africa (hereinafter called southern West Africa, SWA) regional climate and the West African monsoon system [19].
The seasonal excursion of the intertropical convergence zone (ITCZ) and the West African monsoon are key meteorological systems that controls the winds, temperature, clouds and precipitation over SWA [20,21]. The ITZC over SWA becomes a marked discontinuity called the intertropical front (ITF) that separates the dry air masses of the Harmattan regime in the North and the monsoon flow in the south of West Africa. Harmattan is a cool dry wind that blows from the northeast or east in the western Sahara and is strongest from late November to mid-March. It is characterized by cold, dry, dust-laden wind, and also significant fluctuations in the ambient temperatures of the day and night. The northward migration of the IFT is located around 9° N in January and moves northward up to 18° N in August. The Guinea zone (south of 8° N) has two rainy seasons and two dry seasons. The Savanna zone (between 8° N and 12° N) and the Sahel zone (12° N to 16° N) have only one rainy season, the duration of which depends on the latitude [22,23]. Both aeolian dust and biomass burning emissions and transportation have a pronounced seasonal cycle. The north-easterly winds of the Harmattan flow are a major pathway for the southward advection of continental aerosols towards the Gulf of Guinea [24,25,26,27,28]. The Gulf of Guinea is one of the regions with the highest aerosol optical thickness in the world [29,30] due to the accumulation of continental aerosols. The shores of the Gulf of Guinea experience the highest aerosol concentrations during the winter long dry season between December and March [31,32]. Such high concentrations may impact the West African monsoon regime and the precipitation amounts [19,33,34,35].
Several field experiments have documented the aerosol optical and chemical properties in West Africa [21,36,37] leading to a simplified meridional–vertical cross-section of the meteorological conditions affecting aerosol transport in SWA [37]. However, the seasonal and latitudinal variations of the so-called “Harmattan front” are still poorly investigated. This study gathers ground-based and satellite aerosol observations to characterize the seasonal variability of the dust layers’ southward intrusion.

2. Materials and Methods

2.1. Geographical Area

SWA’s climate is marked by a precipitation gradient from south to north, leading contrasting ecosystems (Figure 1). We have divided the domain into 3 distinct regional boxes between longitudes 7° W and 13° E: Guinea (4° to 8° N, lower box in Figure 1), Savanna (8° to 12° N, middle box) and Sahel (12° to 16° N, upper box). The ombrotype of the Guinea zone is mainly “subhumid”, with forest ecosystems in the eastern part classified as “humid”. Two “dry” areas corresponding to a mix of dry forest and savanna can be identified in the Guinea box: the V-Baoulé [38] in the west and the Dahomey gap [39] in the east, the latter going down to the coast. The savanna box is mainly composed of a savanna ecosystem and dry forest (ombrotype “dry” and “sub-humid”). The Sahel box corresponds to the semi-arid and arid ombrotypes. The Bodélé depression (Figure 1) located in the North-East of the domain is a major source of dust which is active throughout the year, with a peak in May and a minimum in August [40,41].

2.2. Sun Photometer Observations

AERONET (AErosol RObotic NETwork) is a network of ground-based sunphotometers dedicated to the observation of atmospheric aerosols [43]. AERONET provides long-term, continuous, and easily accessible public domain databases on the optical, microphysical, and radiative properties of aerosols for scientific research. The instrument and measurement protocol are described by Eck et al. [44]. The Cimel CE-318 sunphotometer tracks the Sun thanks to a two-axis robot that can move in the zenithal and azimuthal planes with an accuracy of 0.05°. The direct atmospheric transmission of the Sun’s irradiance is measured at 8 wavelengths between 340 and 1020 nm with 1.2° field-of-view. The solar extinction is used to compute the spectral aerosol optical depth (AOD). Our analysis utilises the Level 2 of the version 3 spectral AOD daily product [45]. The uncertainty is estimated to be ≈0.01–0.02. The sunphotometer also measures the sky’s radiance at solar elevation angles for several azimuth angles (almucantar scans) at 4 wavelengths (440, 670, 870, and 1020 nm). The almucantar scans observations are used to retrieve optically equivalent column-integrated volume size distributions, aerosol refractive indices, and additional aerosol parameters like the single scattering albedo and the asymmetry parameter according to the algorithm proposed by Dubovik and King [46] and Dubovik et al. [47].
We have selected 11 stations (Table 1) that are operating or have previously operated in SWA: 6 stations in the Sahel box, 2 stations in the Savanna box and 3 in the Guinea box.
The Angström exponent (AE) expresses the relative contribution to optical thickness of coarse aerosols compared with fine aerosols, with values varying between approximately 0 for pure coarse dust particles and 2 for predominantly fine particles [48,49]. AE is derived from the AOD measured at two different wavelengths λ 1 and λ 2 by
A E = l o g ( A O D ( λ 1 ) / A O D ( λ 2 ) ) / l o g ( λ 1 / λ 2 )
Holben et al. [50] suggest that AE below 0.4 indicate that aerosols are dominated by coarse particles, while higher values indicate a contribution from mainly fine and submicronic aerosols. The variation of AE with wavelength can provide additional information about aerosol size distributions for intermediate AE values [51]. Here, we used a single AE value computed between λ 1 = 440 nm and λ 2 = 870 nm.
The concurrent changes in AOD and AE are often used to identify the aerosol type in relation to the emission source (i.e., dust or biomass burning by-products) [32,52,53,54]. Dust days are identified as having high AOD and low AE, while biomass-burning events or polluted days are identified as having a high AOD and a high AE. Thresholds depend on the location and number of observations available and are statistically defined. However, the statistics may be biased by the number of data sets available for each station. To compensate for this statistical bias, we randomly selected an equal number of days for each station, evenly distributed over the year (around 600 days in all), and we calculated the means and standard deviations of AOD and AE. Note that AOD means are reported as geometrical means because the AOD statistical distribution is not a normal distribution. Based on the sub-sampling of all the stations, the days with an AE ≥ 1.12 are classified as polluted days and the days with an AE ≤ 0.3 are classified as dust days. Those threshold corresponds to the mean (AE) ± 1 × SD of the sub-sample. To avoid a bias due to low AOD, we consider only the days with an AOD ≥ 0.11, corresponding to the mean (AOD) ± 1 × SD of the sub-sample.

2.3. CALIOP Observations

The NASA/CNES CALIPSO satellite was launched in April 2006. The CALIOP lidar on the CALIPSO satellite records the attenuated backscatter profiles of the atmosphere at 532 and 1064 nm with a spatial resolution of 333 m along-track [55], day and night. At the Earth’s surface, the CALIOP footprint has a diameter of around 70 m. The depolarisation of the return laser beam is measured at 532 nm. CALIPSO’s orbit is 99 min sun-synchronous and its ground track is repeated every 16 days. The CALIOP sensor can continuously observe atmospheric aerosols on a global scale and extract their optical signatures [56] by providing high-resolution aerosol vertical distribution characteristics to effectively determine aerosol types [57,58,59].
The CALIOP aerosol type identification algorithm uses the lidar measured integrated attenuated backscatter and volume depolarisation ratio, the type of surface, and the altitude of the scattering layer [60]. In this study, we have used 16 years (2007–2022) of the standard version (4) of the CALIPSO level 2 aerosol extinction profile product (05kmAPro) with a uniform horizontal resolution of 5 km. CALIOP aerosol data have been widely used to evaluate aerosol model simulations for several aerosol types [61,62,63] and to study the spatio-temporal distribution and transport of several major aerosol types, such as dust and smoke aerosols [64,65,66,67]. The major updates implemented in the CALIPSO aerosol subtyping algorithm defined in the most recent version. Its 4 data products include the following aerosol typology: marine aerosols (hereinafter called clean_marine), dust (dust), dusty marine (dusty_marine), polluted dust (polluted_dust), continental (clean_continental), polluted continental/smoke (polluted_continental) and high smoke plumes (elevated_smoke) [68]. The new type of dusty marine aerosol is introduced to identify mixtures of marine dust and aerosols in the marine boundary layer that were incorrectly classified as polluted dust over the oceans. The elevated_smoke subtype replaces smoke aerosol to translate the layers identified as high smoke above the planetary boundary layer. The polluted continent/smoke type in V4 modifies the polluted continent and smoke types due to the similarity of their optical properties measured by CALIOP (depolarisation and colour ratio).
The CALIOP data have been aggregated on the geographical boxes presented above and by the latitude strip of 1° between 7° W and 13° E. Extinction profiles at 532 nm were extracted based on the aerosol type along each orbit to compute daily (day and night orbit) averages for each aerosol type. Monthly averages of AODs and extinction profiles were computed when at least 10 daily observations per month are available. A mean extinction height H m [63] was estimated from the monthly mean extinction profiles for each aerosol type.
H m = i = 1 n z i b e x t / i = 1 n b e x t
b e x t is the extinction coefficient of level i and z i is its altitude. H m is an alternative parameter to the scale height [69,70] although both metrics show similar behaviours.

3. Results

3.1. Aerosol Optical Depth and Angström Exponent

The overall average for all sites is 0.40 (geometrical standard deviation, log(SD) = 0.71) and 0.51 (SD = 0.39) for the AOD and AE, respectively. The AERONET located in the Sahel has the lowest mean AOD (Table 2). Djougou station has the highest mean AOD (0.53); however, it has the smallest number of observations (see Table 1). In the Guinea zone, Koforidua_ANUC has a higher mean AOD (AOD = 0.49) than LAMTO_STATION (AOD = 0.41) and CATUC_Bamenda (AOD = 0.40). The low AE observed at Agoufou (AE = 0.27) is associated with the largest number of dust days (65.3% of the observations). The four other stations in the Sahel have a very similar number of dust days (around 51%), but the number is lower than for Agoufou. The percentage of dust days for the Guinea stations remains below 5%. Only 30% of the days are classified as dust or polluted days at LAMTO_STATION and Koforidua_ANUC, indicating that most of the time, the atmosphere is composed of a mix of aerosols.

3.2. Aerosol Optical Depth Annual Cycle

The seasonality can be observed by analysing the AOD monthly mean annual cycle across all sites (Figure 2). The guinea box shows a maximum AOD during the winter (DJF). The AOD reaches its maximum in January at LAMTO_STATION (AOD = 0.77), and in February at CATUC_Bamenda (0.99) and Koforidua_ANUC (1.13). The minimum AOD is reached in September at LAMTO_STATION (AOD = 0.21) and at CATUC_Bamenda (0.17), and in October at Koforidua_ANUC (0.25). A secondary maximum is observed in August for all three stations. The Savanna box has a similar trend but with the maxima shifted to February for Ilorin (AOD = 1.06) and to March for Djougou (AOD = 0.96). There is no secondary maximum in August. Minimum AODs are all observed in September around 0.25. The Sahel box exhibits different behaviour to the two other boxes. For most of the sites in the Sahel box, the maximum AOD is observed in March or April, ranging from 0.62 at IER_Cinzana to 0.84 at Ouagadougou. The maximum is shifted to May for the easternmost station, DMN_Maine_Soroa (AOD = 0.87) and the June for the northernmost station, Agoufou (AOD = 0.84). A secondary maximum is observed in October and the minimum AOD (≈0.25) is reached in August and during the winter (DJF) period.
The seasonal cycles of CALIOP AOD in the different geographical boxes are similar to the AERONET seasonal cycle. CALIOP AODs maxima and minima are observed in the same period of time as the AERONET sites. In the Sahel box, a maximum AOD above 0.6 is observed between March and June, while the minimum AODs are obtained in August and during the winter period. As CALIOP observations are averaged over a 20° longitude band, the averages do not reflect the East–West variability observed for AERONET measurements. This can explain the absence of a secondary peak in the Guinean zone in August. The maximum AODs (around 1.0) for these two zones are observed in winter, while the minima are 0.4 in summer.

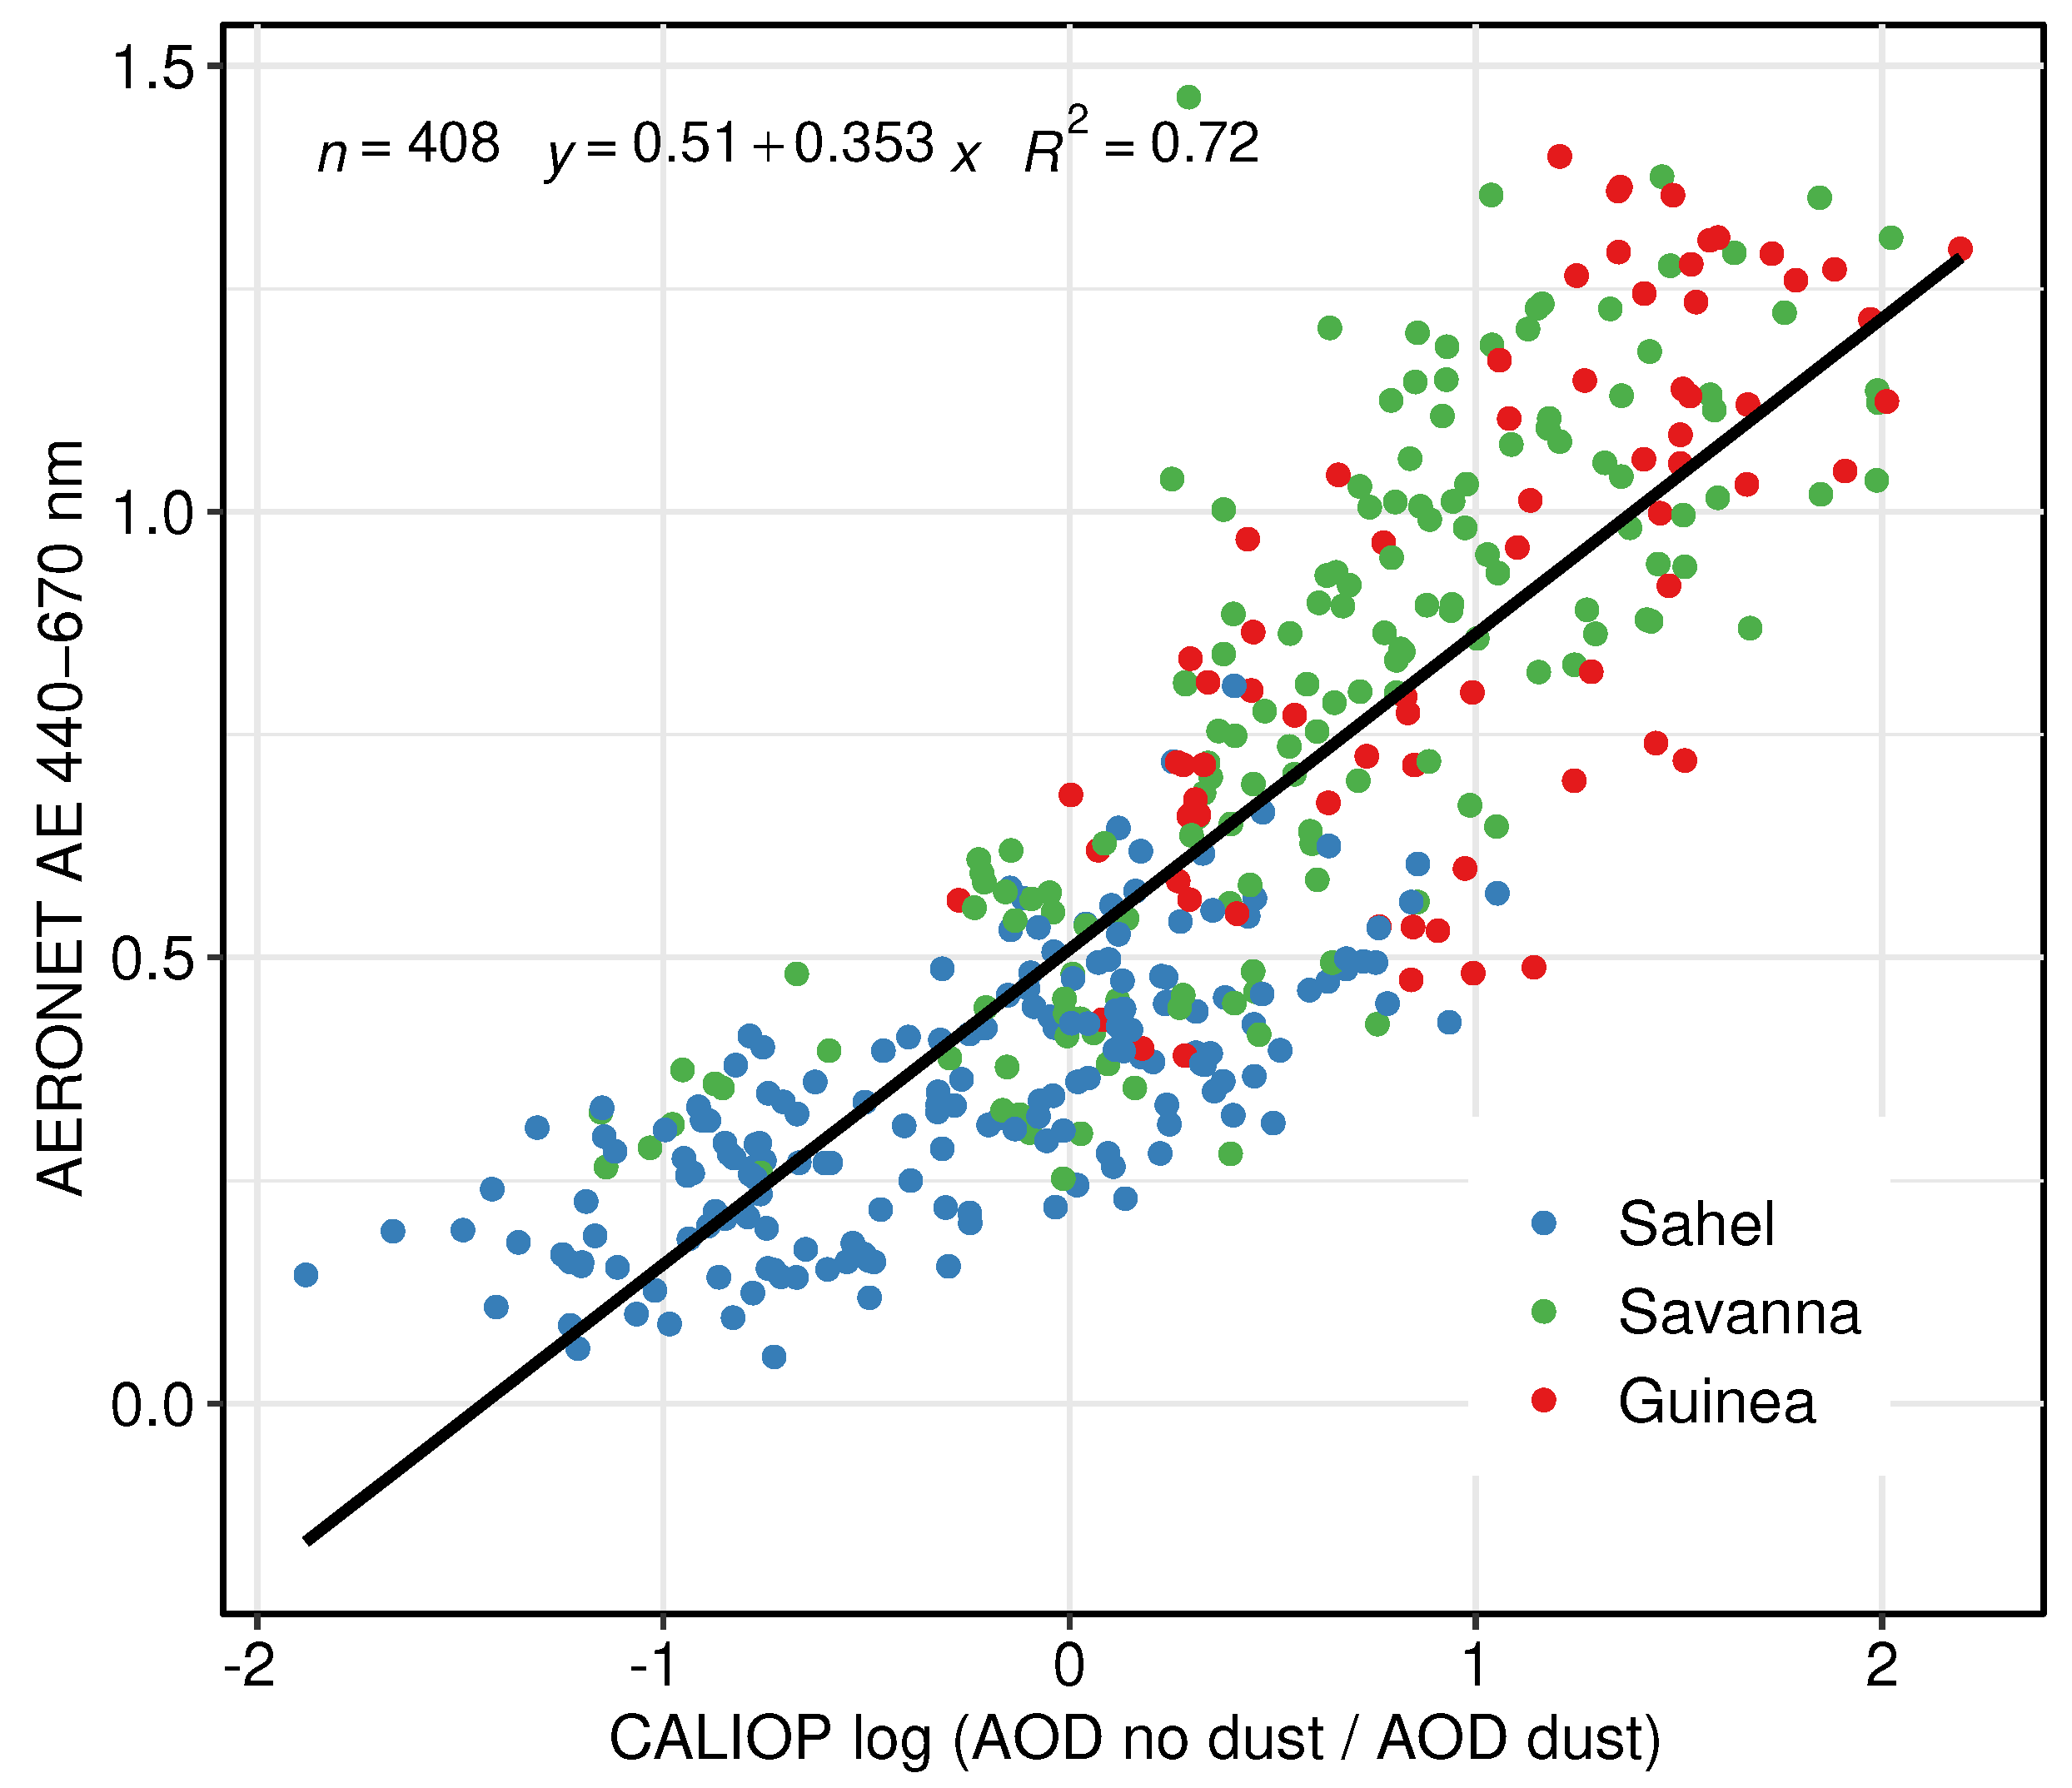
3.3. Angström Exponent and CALIOP Aerosol Type

The AE monthly mean annual cycle (Figure 3) shows a minimum between March and June for all three areas. The increase in AE starts as early as April in the Guinea box, while it takes place in June for the Savanna and Sahel boxes. In the Sahel boxes, all AE monthly means are below 0.6 and remain below 0.25 from March to June for all the sites. The highest AEs observed in August and December are concurrent with the lowest AODs (Figure 2). The lowest AE is observed in Agoufou (AE = 0.04) during the heart of the dust season. A similar seasonal pattern to the one observed in the Sahel box can be observed for the sites in the Savanna box; however, this occurs with AE that surpasses 1.0 during the summer (JJA) period. For the Savanna and Guinea boxes, there is an east–west gradient in the AE, with the AE being higher in the eastern part of the boxes (Ilorin and CATUC_Bamenda). Throughout the year, the AEs are higher in the Guinea box than in the two other boxes. The AEs are around 1.4 during the JJA period and reach a minimum of around 0.5 during MAM.
The monthly mean annual cycle of the relative abundance of the CALIOP aerosol type to the total AOD (Figure 3) displays a marked seasonal cycle that has some similarities with the AE monthly mean annual cycle. In the Sahel box, dust and polluted_dust are the main aerosol types, respectively corresponding to 48.5% and 25.5% of total AOD over the year. The other types are mainly elevated_smoke and polluted_continental, contributing 15.8% and 20.4%, respectively. There is a clear increase in the polluted_continental contribution between June and September corresponding to the simultaneous increase in the AE. The contribution of the elevated_smoke type is the highest in October and November, at around 22%. While the polluted_dust contribution remains steady over the year, the contribution of dust is at its maximum in April. The contribution of the polluted_continental in the Savanna box is greater than in the Sahel box but can be observed all year round, with a maximum in summer (JJA) and a minimum in March. Like continental aerosols, smoke aerosols contribute significantly to the total aerosol load in summer, with a contribution of 20.3% in August, while their contribution is only 9.3% in March. Inversely, the contribution of dust is minimum in summer (around 25%) and maximum in February (around 57%). As it includes an ocean surface, the Guinea box shows an additional clean_marine and dusty_marine aerosol type. The overall contribution of dust subtypes (dust, polluted_dust and dusty_marine) is at its maximum in DJF (around 75%). The contribution of elevated_smoke can be observed all year round, with a maximum at 19.2% in summer (JJA).
There is a clear similarity between the seasonal cycle of the relative contribution of CALIOP aerosol types to the AOD and the AERONET AE exponent for all the considered areas. In particular, the dust fraction tends to modulate the seasonal variation of AE. As the contribution of dust to the AOD increases, the AE decreases. We found that the monthly mean AERONET AEs and the ratio of no-dust CALIOP AOD (all types except dust type ) to the dust (dust type) CALIOP AOD (Figure 4) are highly correlated (Pearson coefficient of determination r 2 = 0.72) considering the whole region. When considering each zone separately, the correlation is lower ( r 2 = 0.53 for the Sahel area, 0.54 for Guinea and 0.63 for Savanna), but still significant.

3.4. Altitude of the Transport

All three geographical areas have similar seasonal (excluding summer) average profiles of the CALIOP extinction coefficient at 532 nm (Figure 5). During the winter period (DJF), the maximum extinction coefficient for dust is at 1 km and for polluted_dust is at 1.5 km. This maximum shifts to 2 km during MAM period and to 2.5 km during the summer period (JJA). The extinction coefficient profiles of polluted_dust are very close in Savanna and Sahel for all seasons. In the Guinea zone, we note the absence of a layer between 0.5 km and 1.5 km, which is present during JJA in the other zones.
The mean extinction height H m of the continental dust aerosol subtypes (namely dust and polluted_dust) reveals a well-defined seasonal cycle (Figure 6). The size of the boxes (interquartile range, IQR) in Figure 6 reflects the H m interannual variability. On average, the IQR is 0.37 km and 0.64 km for polluted_dust and dust, respectively. The IQR increases during the summer and early autumn, particularly in the Guinea box. H m IQR can be as high as 1.8 km in October for the Guinea box for the dust type. In the Guinea box, H m for the dust stays below 3 km between November and March and starts to increase in April. The maximum altitude, which is reached in August, increases from 4 km on average in the Sahel box to about 6 km in the Guinea box. A steady increase in H m of about 0.3 km per month is observed in the Savanna and Sahel boxes between January and August. H m decreases during the second half of the year. In the Guinea box, there is a large variability in the year-to-year altitude of the dust altitude in the decreasing trend, as highlighted by the larger IQR in Figure 6. The minimum altitude is in December for all three boxes at about 2 km. H m for the polluted_dust has different seasonal behaviour. H m is between 1.8 km and 3.8 km (Guinea box) or 2.8 km (Sahel and Savanna boxes). We observe a significant drop of 1.5 km in H m in the Guinea box between September and October.

4. Discussion

The seasonal cycle of AOD in SWA is driven by the natural variability of aerosol emissions, wind and rainfall patterns. As revealed by the CALIOP and AERONET data analysis, the aerosols in SWA are a mixture of combustion and pollution particles and dust. The AOD spectral dependency (namely AE) is largely influenced by the contribution of the mineral dust AOD. The larger the contribution of dust to the AOD, the lower the AE for the atmospheric column, and we have found that the AERONET AE is nicely correlated with the ratio of CALIOP non-dust AOD to CALIOP dust AOD over the whole studied area.
The highest contribution of dust occurs in spring (MAM) due to the activation of the Bodélé dust source by the northeasterlies due to the ridging of the Lybian high [71]. During spring, the dust layer is uplifted as shown by the CALIOP mean extinction height. The increase in the dust layer in April is due to the northward motion of the inter-tropical front [37]. Although dust transport toward the Gulf of Guinea is weakened during the summer months, the mean extinction height of dust layers is at around 6 km altitude during JJA, thus indicating transport at greater heights.
Biomass burning associated with human land-use activities is a significant contributor to the aerosol load in the SWA atmosphere [72,73]. Biomass burning occurs during the dry season [16] all over SWA. Biomass burning emits particles in the accumulation mode associated with AEs around 1.8 [74]. The mixing of biomass burning by-products with dust leads to an intermediate mean AEs between 0.5 and 1.0 in DJF. In the Sahel, as there is less available fuel to burn, the emissions of combustion aerosols have less impact on AE. Over the Guinea area, there is a clear increase in the AOD during the summer period, which is associated with high AEs, and an increase in the contribution of the elevated_smoke and polluted_continental types. The increase in AE is consistent with previous findings indicating a regional-scale advection of biomass burning by-products by easterly winds in summer [75]. Aged biomass burning is advected from central Africa to SWA above the monsoon layer and partially entrained within the monsoon layer [76,77].
We used an average of CALIOP day and night observations. There were some differences between CALIOP observations made during the day and those made at night because of the mechanisms by which aerosols are emitted and transported, and the possible impact of relative humidity. However, these differences were smoothed out by using seasonal averages. On average, we have estimated that the difference between CALIOP night-time or daytime AODs compared with an average of the two is ±5%. This difference is of the same order of magnitude as the AOD diurnal variability [78]. This difference is +3% on average for H m . The differences may be greater at daily scales, however.

5. Conclusions

SWA atmosphere is characterised by a complex and intense mixing of different aerosol types. Although mineral dust is present all year long, the summer period shows a significant contribution of biomass burning pollution that impacts the aerosol properties. The seasonal cycle of AOD given by CALIOP satellite and local sun photometer observations is consistent over SWA region. The CALIOP aerosol classification indicates that the AE variability is largely influenced by the relative apportionment of dust and no-dust aerosol types. The dust altitude has a pronounced seasonal cycle with a maximum in summer and a minimum in winter. While there is a steady increase in the dust altitude, most probably due to the increase in solar heating and convection, the northward migration of the IFT creates a discontinuity by shifting the dust towards higher altitudes. Our study is based on monthly averages from relatively large geographical boxes that are characteristic of West African ecosystems. However, the investigation of the variation of aerosol types and their relative optical thickness from CALIOP at day scale and over regions of smaller geographical extent remains difficult due to the low spatial coverage of the lidar. The focus of future research will be on analyzing CALIOP and meteorological data over time to gain a better understanding of the relationship between monsoon and aerosol loading at seasonal and interannual scales.

Author Contributions

Conceptualization, methodology, writing, original draft preparation and review—A.F.N. and J.-F.L.; methodology—J.-F.L.; resources—J.-L.R. and A.F.; review and editing—M.A. and V.Y. All authors have read and agreed to the published version of the manuscript.

Funding

This project has received funding from the European Union’s Horizon 2020 research and innovation programme under the Marie Skłodowska-Curie grant agreement No 871944. A.N. benefited from a mobility grant from the French Embassy in Côte d’Ivoire (service de coopération et d’action culturelle).

Institutional Review Board Statement

Not Applicable.

Informed Consent Statement

Not Applicable.

Data Availability Statement

The AERONET data can be accessed at https://aeronet.gsfc.nasa.gov/, accessed on 1 March 2024. CALIOP 5 km extinction profiles were downloaded from the NASA/LaRC Atmospheric Science Data Center (ASDC, https://asdc.larc.nasa.gov/project/CALIPSO, accessed on 1 March 2024).

Acknowledgments

The authors wish to thank the Service National d’Observation PHOTONS, a component of the ACTRIS-FR (Aerosol Cloud and Trace gas InfraStruture) instratructure, and all the PIs and Co-Is and the site managers for establishing and maintaining the AERONET (Aerosol Robotic Network) sites used in this investigation and for providing open access to the data. Data were processed at ICARE (https://www.icare.univ-lille.fr/, accessed on 21 March 2024) data center. We would like to extend our warmest thanks to the CALIPSO/CALIOP team for maintaining free data sharing.

Conflicts of Interest

The authors declare no conflicts of interest.

References

  1. Seinfeld, J.H.; Pandis, S.N. Atmospheric Chemistry and Physics: From Air Pollution to Climate Change, 2nd ed.; John Wiley and Sons: Hoboken, NJ, USA, 2006. [Google Scholar]
  2. Charlson, R.J.; Schwartz, S.E.; Hales, J.M.; Cess, R.D.; Coakley, J.A.; Hansen, J.E.; Hofmann, D.J. Climate Forcing by Anthropogenic Aerosols. Science 1992, 255, 423–430. [Google Scholar] [CrossRef]
  3. Haywood, J.; Boucher, O. Estimates of the direct and indirect radiative forcing due to tropospheric aerosols: A review. Rev. Geophys. 2000, 38, 513–543. [Google Scholar] [CrossRef]
  4. Yu, H.; Kaufman, Y.J.; Chin, M.; Feingold, G.; Remer, L.A.; Anderson, T.L.; Balkanski, Y.; Bellouin, N.; Boucher, O.; Christopher, S.; et al. A review of measurement-based assessments of the aerosol direct radiative effect and forcing. Atmos. Chem. Phys. 2006, 6, 613–666. [Google Scholar] [CrossRef]
  5. Dockery, D.W.; Pope, C.A. Acute Respiratory Effects of Particulate Air Pollution. Annu. Rev. Public Health 1994, 15, 107–132. [Google Scholar] [CrossRef]
  6. Burnett, R.T.; Pope, C.A., III; Ezzati, M.; Olives, C.; Lim, S.S.; Mehta, S.; Shin, H.S.; Singh, G.; Hubbell, B.; Brauer, M.; et al. An Integrated Risk Function for Estimating the Global Burden of Disease Attributable to Ambient Fine Particulate Matter Exposure. Environ. Health Perspect. 2014, 122, 397–403. [Google Scholar] [CrossRef]
  7. Carlson, T. Synoptic histories of three African easterly waves during the summers of 1968 and 1969. Mon. Weather Rev. 1969, 97, 256–276. [Google Scholar] [CrossRef]
  8. Carlson, T.; Prospero, J.S. The large scale movement of Saharan air outbreaks over the northern equatorial Atlantic. J. Appl. Meteorol. Climatol. 1972, 11, 283–297. [Google Scholar] [CrossRef]
  9. Prospero, J.M.; Carlson, T.N. Saharan air outbreaks over the tropical North Atlantic. Pure Appl. Geophys. 1980, 119, 677–691. [Google Scholar] [CrossRef]
  10. Swap, R.; Garstang, M.; Greco, S.; Talbot, R.; Kållberg, P. Saharan dust in the Amazon Basin. Tellus B Chem. Phys. Meteorol. 1992, 44, 133–149. [Google Scholar] [CrossRef]
  11. Kaufman, Y.J.; Koren, I.; Remer, L.A.; Tanre, D.; Ginoux, P.; Fan, S. Dust transport and deposition observed from the Terra-Moderate Resolution Imaging Spectroradiometer ( MODIS) spacecraft over the Atlantic ocean. J. Geophys. Res. Atmos. 2005, 110, D10S12. [Google Scholar] [CrossRef]
  12. Ben-Ami, Y.; Koren, I.; Rudich, Y.; Artaxo, P.; Martin, S.T.; Andreae, M.O. Transport of North African dust from the Bodélé depression to the Amazon Basin: A case study. Atmos. Chem. Phys. 2010, 10, 7533–7544. [Google Scholar] [CrossRef]
  13. Kok, J.F.; Adebiyi, A.A.; Albani, S.; Balkanski, Y.; Checa-Garcia, R.; Chin, M.; Colarco, P.R.; Hamilton, D.S.; Huang, Y.; Ito, A.; et al. Contribution of the world’s main dust source regions to the global cycle of desert dust. Atmos. Chem. Phys. 2021, 21, 8169–8193. [Google Scholar] [CrossRef]
  14. Huneeus, N.; Schulz, M.; Balkanski, Y.; Griesfeller, J.; Prospero, J.; Kinne, S.; Bauer, S.; Boucher, O.; Chin, M.; Dentener, F.; et al. Global dust model intercomparison in AeroCom phase I. Atmos. Chem. Phys. 2011, 11, 7781–7816. [Google Scholar] [CrossRef]
  15. Bond, T.C. A technology-based global inventory of black and organic carbon emissions from combustion. J. Geophys. Res. 2004, 109, D14. [Google Scholar] [CrossRef]
  16. Kaiser, J.W.; Heil, A.; Andreae, M.O.; Benedetti, A.; Chubarova, N.; Jones, L.; Morcrette, J.J.; Razinger, M.; Schultz, M.G.; Suttie, M.; et al. Biomass burning emissions estimated with a global fire assimilation system based on observed fire radiative power. Biogeosciences 2012, 9, 527–554. [Google Scholar] [CrossRef]
  17. Keita, S.; Liousse, C.; Assamoi, E.M.; Doumbia, T.; N’Datchoh, E.T.; Gnamien, S.; Elguindi, N.; Granier, C.; Yoboué, V. African anthropogenic emissions inventory for gases and particles from 1990 to 2015. Earth Syst. Sci. Data 2021, 13, 3691–3705. [Google Scholar] [CrossRef]
  18. Liousse, C.; Assamoi, E.; Criqui, P.; Granier, C.; Rosset, R. Explosive growth in African combustion emissions from 2005 to 2030. Environ. Res. Lett. 2014, 9, 035003. [Google Scholar] [CrossRef]
  19. Knippertz, P.; Evans, M.J.; Field, P.R.; Fink, A.H.; Liousse, C.; Marsham, J.H. The possible role of local air pollution in climate change in West Africa. Nat. Clim. Chang. 2015, 5, 815–822. [Google Scholar] [CrossRef]
  20. Nicholson, S.E. The ITCZ and the Seasonal Cycle over Equatorial Africa. Bull. Am. Meteorol. Soc. 2018, 99, 337–348. [Google Scholar] [CrossRef]
  21. Knippertz, P.; Coe, H.; Chiu, J.C.; Evans, M.J.; Fink, A.H.; Kalthoff, N.; Liousse, C.; Mari, C.; Allan, R.P.; Brooks, B.; et al. The DACCIWA Project: Dynamics–Aerosol–Chemistry–Cloud Interactions in West Africa. Bull. Am. Meteorol. Soc. 2015, 96, 1451–1460. [Google Scholar] [CrossRef]
  22. Chudeau, R. Le climat de l’Afrique occidentale et équatoriale. Ann. Geogr. 1916, 25, 429–462. [Google Scholar] [CrossRef]
  23. Nicholson, S.E. Climate of the Sahel and West Africa. In Oxford Research Encyclopedia of Climate Science; Oxford University Press: Oxford, UK, 2018. [Google Scholar] [CrossRef]
  24. McTainsh, G. Harmattan dust deposition in northern Nigeria. Nature 1980, 286, 587–588. [Google Scholar] [CrossRef]
  25. Adeyefa, Z.D.; Holmgren, B.; Adedokun, J.A. Spectral solar irradiance under Harmattan conditions. Renew. Energy 1995, 6, 989–996. [Google Scholar] [CrossRef]
  26. Engelstaedter, S.; Washington, R. Atmospheric controls on the annual cycle of North African dust. J. Geophys. Res. Atmos. 2007, 112, D3. [Google Scholar] [CrossRef]
  27. Klose, M.; Shao, Y.; Karremann, M.K.; Fink, A.H. Sahel dust zone and synoptic background. Geophys. Res. Lett. 2010, 37, 9. [Google Scholar] [CrossRef]
  28. Knippertz, P.; Todd, M. The central west Saharan dust hot spot and its relation to African easterly waves and extratropical disturbances. Atmosphere 2010, 115, D12117. [Google Scholar] [CrossRef]
  29. Kaufman, Y.J.; Tanré, D.; Boucher, O. A satellite view of aerosols in the climate system. Nature 2002, 419, 215–223. [Google Scholar] [CrossRef]
  30. Mehta, M.; Singh, N.; Anshumali. Global trends of columnar and vertically distributed properties of aerosols with emphasis on dust, polluted dust and smoke–inferences from 10-year long CALIOP observations. Remote. Sens. Environ. 2018, 208, 120–132. [Google Scholar] [CrossRef]
  31. Djossou, J.; Léon, J.F.; Akpo, A.B.; Liousse, C.; Yoboué, V.; Bedou, M.; Bodjrenou, M.; Chiron, C.; Galy-Lacaux, C.; Gardrat, E.; et al. Mass concentration, optical depth and carbon composition of particulate matter in the major southern West African cities of Cotonou (Benin) and Abidjan (Côte d’Ivoire). Atmos. Chem. Phys. 2018, 18, 6275–6291. [Google Scholar] [CrossRef]
  32. Léon, J.F.; Akpo, A.B.; Bedou, M.; Djossou, J.; Bodjrenou, M.; Yoboué, V.; Liousse, C. PM2.5 surface concentrations in southern West African urban areas based on sun photometer and satellite observations. Atmos. Chem. Phys. 2021, 21, 1815–1834. [Google Scholar] [CrossRef]
  33. Huang, J.; Zhang, C.; Prospero, J.M. Large-scale effect of aerosols on precipitation in the West African Monsoon region. Q. J. R. Meteorol. Soc. 2009, 135, 581–594. [Google Scholar] [CrossRef]
  34. Yoon, J.H.; Rasch, P.J.; Wang, H.; Vinoj, V.; Ganguly, D. The role of carbonaceous aerosols on short-term variations of precipitation over North Africa. Atmos. Sci. Lett. 2016, 17, 407–414. [Google Scholar] [CrossRef]
  35. Pante, G.; Knippertz, P.; Fink, A.H.; Kniffka, A. The potential of increasing man-made air pollution to reduce rainfall over southern West Africa. Atmos. Chem. Phys. 2021, 21, 35–55. [Google Scholar] [CrossRef]
  36. Redelsperger, J.L.; Thorncroft, C.D.; Diedhiou, A.; Lebel, T.; Parker, D.J.; Polcher, J. African Monsoon Multidisciplinary Analysis: An International Research Project and Field Campaign. Bull. Am. Meteorol. Soc. 2006, 87, 1739–1746. [Google Scholar] [CrossRef]
  37. Haywood, J.M.; Pelon, J.; Formenti, P.; Bharmal, N.; Brooks, M.; Capes, G.; Chazette, P.; Chou, C.; Christopher, S.; Coe, H.; et al. Overview of the Dust and Biomass-burning Experiment and African Monsoon Multidisciplinary Analysis Special Observing Period-0. J. Geophys. Res. 2008, 113, D23. [Google Scholar] [CrossRef]
  38. Peltre, P. Le V Baoulé: Côte d’Ivoire Centrale, Héritage Géomorpho Logique et Paléoclimatique dans le Tracé du Contact Forêt-Savane. Ph.D. Thesis, Éditions de l’Office de la Recherche Scientifique et Technique Outre-Mer, Bondy, France, 1977. [Google Scholar]
  39. Dupont, L.M.; Weinelt, M. Vegetation history of the savanna corridor between the Guinean and the Congolian rain forest during the last 150,000 years. Veg. Hist. Archaeobotany 1996, 5, 273–292. [Google Scholar] [CrossRef]
  40. Washington, R.; Todd, M.; Middleton, N.J.; Goudie, A.S. Dust-Storm Source Areas Determined by the Total Ozone Monitoring Spectrometer and Surface Observations. Ann. Assoc. Am. Geogr. 2003, 93, 297–313. [Google Scholar] [CrossRef]
  41. Todd, M.C.; Washington, R.; Martins, J.V.; Dubovik, O.; Lizcano, G.; M’Bainayel, S.; Engelstaedter, S. Mineral dust emission from the Bodélé Depression, northern Chad, during BoDEx 2005. J. Geophys. Res. Atmos. 2007, 112, D6. [Google Scholar] [CrossRef]
  42. Sayre, R.; Comer, P.J.; Hak, J.J.; Josse, C.; Bow, J.; Warner, H.; Larwanou, M.; Kelbessa, E.; Bekele, T.; Kehl, H.; et al. A New Map of Standardized Terrestrial Ecosystems of Africa. In African Geographical Review; Association of American Geographers: Washington, DC, USA, 2013; pp. 1–24. [Google Scholar]
  43. Holben, B.N.; Eck, T.F.; Slutsker, I.; Tanré, D.; Buis, J.P.; Setzer, A.; Vermote, E.; Reagan, J.A.; Kaufman, Y.J.; Nakajima, T.; et al. AERONET—A Federated Instrument Network and Data Archive for Aerosol Characterization. Remote. Sens. Environ. 1998, 66, 1–16. [Google Scholar] [CrossRef]
  44. Eck, T.F.; Holben, B.N.; Giles, D.M.; Slutsker, I.; Sinyuk, A.; Schafer, J.S.; Smirnov, A.; Sorokin, M.; Reid, J.S.; Sayer, A.M.; et al. AERONET Remotely Sensed Measurements and Retrievals of Biomass Burning Aerosol Optical Properties During the 2015 Indonesian Burning Season. J. Geophys. Res. Atmos. 2019, 124, 4722–4740. [Google Scholar] [CrossRef]
  45. Giles, D.M.; Sinyuk, A.; Sorokin, M.G.; Schafer, J.S.; Smirnov, A.; Slutsker, I.; Eck, T.F.; Holben, B.N.; Lewis, J.R.; Campbell, J.R.; et al. Advancements in the Aerosol Robotic Network (AERONET) Version 3 database—Automated near-real-time quality control algorithm with improved cloud screening for Sun photometer aerosol optical depth (AOD) measurements. Atmos. Meas. Tech. 2019, 12, 169–209. [Google Scholar] [CrossRef]
  46. Dubovik, O.; King, M.D. A flexible inversion algorithm for retrieval of aerosol optical properties from Sun and sky radiance measurements. J. Geophys. Res. Atmos. 2000, 105, 20673–20696. [Google Scholar] [CrossRef]
  47. Dubovik, O.; Sinyuk, A.; Lapyonok, T.; Holben, B.N.; Mishchenko, M.; Yang, P.; Eck, T.F.; Volten, H.; Muñoz, O.; Veihelmann, B.; et al. Application of spheroid models to account for aerosol particle nonsphericity in remote sensing of desert dust. J. Geophys. Res. 2006, 111, D11. [Google Scholar] [CrossRef]
  48. Hamonou, E.; Chazette, P.; Balis, D.; Dulac, F.; Schneider, X.; Galani, E.; Ancellet, G.; Papayannis, A. Characterization of the Vertical Structure of Saharan Dust Export to the Mediterranean Basin. J. Geophys. Res. Atmos. 1999, 104, 22257–22270. [Google Scholar] [CrossRef]
  49. Léon, J.F.; Derimian, Y.; Chiapello, I.; Tanré, D.; Podvin, T.; Chatenet, B.; Diallo, A.; Deroo, C. Aerosol Vertical Distribution and Optical Properties over M’Bour (16.96 W; 14.39 N), Senegal from 2006 to 2008. Atmos. Chem. Phys. 2009, 9, 9249–9261. [Google Scholar] [CrossRef]
  50. Holben, B.N.; Tanré, D.; Smirnov, A.; Eck, T.F.; Slutsker, I.; Abuhassan, N.; Newcomb, W.W.; Schafer, J.S.; Chatenet, B.; Lavenu, F.; et al. An emerging ground-based aerosol climatology: Aerosol optical depth from AERONET. J. Geophys. Res. Atmos. 2001, 106, 12067–12097. [Google Scholar] [CrossRef]
  51. Schuster, G.L.; Dubovik, O.; Holben, B.N. Angstrom exponent and bimodal aerosol size distributions. J. Geophys. Res. Atmos. 2006, 111, D7. [Google Scholar] [CrossRef]
  52. Kaskaoutis, D.G.; Kambezidis, H.D.; Hatzianastassiou, N.; Kosmopoulos, P.G.; Badarinath, K.V.S. Aerosol climatology: On the discrimination of aerosol types over four AERONET sites. Atmos. Chem. Phys. Discuss. 2007, 2007, 6357–6411. [Google Scholar] [CrossRef]
  53. Toledano, C.; Wiegner, M.; Groß, S.; Freudenthaler, V.; Gasteiger, J.; Müller, D.; Müller, D.; Schladitz, A.; Weinzierl, B.; Torres, B.; et al. Optical properties of aerosol mixtures derived from sun-sky radiometry during SAMUM-2. Tellus B Chem. Phys. Meteorol. 2011, 63, 635–648. [Google Scholar] [CrossRef]
  54. Verma, S.; Prakash, D.; Ricaud, P.; Payra, S.; Attié, J.L.; Soni, M. A New Classification of Aerosol Sources and Types as Measured over Jaipur, India. Aerosol Air Qual. Res. 2015, 15, 985–993. [Google Scholar] [CrossRef]
  55. Winker, D.M.; Vaughan, M.A.; Omar, A.; Hu, Y.; Powell, K.A.; Liu, Z.; Hunt, W.H.; Young, S.A. Overview of the CALIPSO Mission and CALIOP Data Processing Algorithms. J. Atmos. Ocean. Technol. 2009, 26, 2310–2323. [Google Scholar] [CrossRef]
  56. Huang, J.P.; Liu, J.J.; Chen, B.; Nasiri, S.L. Detection of anthropogenic dust using CALIPSO lidar measurements. Atmos. Chem. Phys. 2015, 15, 11653–11665. [Google Scholar] [CrossRef]
  57. Huang, Z.; Nee, J.B.; Chiang, C.W.; Zhang, S.; Jin, H.; Wang, W.; Zhou, T. Real-Time Observations of Dust–Cloud Interactions Based on Polarization and Raman Lidar Measurements. Remote. Sens. 2018, 10, 1017. [Google Scholar] [CrossRef]
  58. Liu, Z.; Kar, J.; Zeng, S.; Tackett, J.; Vaughan, M.; Avery, M.; Pelon, J.; Getzewich, B.; Lee, K.P.; Magill, B.; et al. Discriminating between clouds and aerosols in the CALIOP version 4.1 data products. Atmos. Meas. Tech. 2019, 12, 703–734. [Google Scholar] [CrossRef]
  59. Niu, H.; Kang, S.; Gao, W.; Wang, Y.; Paudyal, R. Vertical distribution of the Asian tropopause aerosols detected by CALIPSO. Environ. Pollut. 2019, 253, 207–220. [Google Scholar] [CrossRef]
  60. Omar, A.H.; Winker, D.M.; Vaughan, M.A.; Hu, Y.; Trepte, C.R.; Ferrare, R.A.; Lee, K.P.; Hostetler, C.A.; Kittaka, C.; Rogers, R.R.; et al. The CALIPSO Automated Aerosol Classification and Lidar Ratio Selection Algorithm. J. Atmos. Ocean. Technol. 2009, 26, 1994–2014. [Google Scholar] [CrossRef]
  61. Yu, H.; Chin, M.; Winker, D.M.; Omar, A.H.; Liu, Z.; Kittaka, C.; Diehl, T. Global view of aerosol vertical distributions from CALIPSO lidar measurements and GOCART simulations: Regional and seasonal variations. J. Geophys. Res. 2010, 115, D4. [Google Scholar] [CrossRef]
  62. Nabat, P.; Somot, S.; Mallet, M.; Chiapello, I.; Morcrette, J.J.; Solmon, F.; Szopa, S.; Dulac, F.; Collins, W.; Ghan, S.; et al. A 4-D climatology (1979–2009) of the monthly tropospheric aerosol optical depth distribution over the Mediterranean region from a comparative evaluation and blending of remote sensing and model products. Atmos. Meas. Tech. 2013, 6, 1287–1314. [Google Scholar] [CrossRef]
  63. Koffi, B.; Schultz, M.; Breon, F.M.; Dentener, F.; Steensen, B.; Griesfeller, J.; Winker, D.; Balkanski, B.; Bauer, S.E.; Bellouin, N.; et al. Evaluation of the aerosol vertical distribution in global aerosol models through comparison against CALIOP measurements: AeroCom phase II results. J. Geophys. Res.-Atmos. 2016, 121, 7254–7283. [Google Scholar] [CrossRef]
  64. Mona, L.; Liu, Z.; Müller, D.; Omar, A.; Papayannis, A.; Pappalardo, G.; Sugimoto, N.; Vaughan, M. Lidar Measurements for Desert Dust Characterization: An Overview. Adv. Meteorol. 2012, 2012, e356265. [Google Scholar] [CrossRef]
  65. Wu, Y.; Han, Y.; Voulgarakis, A.; Wang, T.; Li, M.; Wang, Y.; Xie, M.; Zhuang, B.; Li, S. An agricultural biomass burning episode in eastern China: Transport, optical properties, and impacts on regional air quality. J. Geophys. Res. Atmos. 2017, 122, 2304–2324. [Google Scholar] [CrossRef]
  66. Senghor, H.; Machu, E.; Hourdin, F.; Gaye, A.T. Seasonal cycle of desert aerosols in western Africa: Analysis of the coastal transition with passive and active sensors. Atmos. Chem. Phys. 2017, 17, 8395–8410. [Google Scholar] [CrossRef]
  67. Léon, J.F.; Martiny, N.; Merlet, S. A Multi Linear Regression Model to Derive Dust PM10 in the Sahel Using AERONET Aerosol Optical Depth and CALIOP Aerosol Layer Products. Remote. Sens. 2020, 12, 3099. [Google Scholar] [CrossRef]
  68. Kim, M.H.; Omar, A.H.; Tackett, J.L.; Vaughan, M.A.; Winker, D.M.; Trepte, C.R.; Hu, Y.; Liu, Z.; Poole, L.R.; Pitts, M.C.; et al. The CALIPSO version 4 automated aerosol classification and lidar ratio selection algorithm. Atmos. Meas. Tech. 2018, 11, 6107–6135. [Google Scholar] [CrossRef]
  69. Hayasaka, T.; Meguro, Y.; Sasano, Y.; Takamura, T. Stratification and Size Distribution of Aerosols Retrieved from Simultaneous Measurements with Lidar, a SunPhotometer, and an Aureolemeter. Appl. Opt. 1998, 37, 961–970. [Google Scholar] [CrossRef]
  70. Hayasaka, T.; Satake, S.; Shimizu, A.; Sugimoto, N.; Matsui, I.; Aoki, K.; Muraji, Y. Vertical distribution and optical properties of aerosols observed over Japan during the Atmospheric Brown Clouds-East Asia Regional Experiment 2005. J. Geophys. Res. Atmos. 2007, 112, D22. [Google Scholar] [CrossRef]
  71. Washington, R. Atmospheric Controls on Mineral Dust Emission from the Bodélé Depression, Chad: The Role of the Low Level Jet. Geophys. Res. Lett. 2005, 32, 17. [Google Scholar] [CrossRef]
  72. Giglio, L.; Csiszar, I.; Justice, C.O. Global distribution and seasonality of active fires as observed with the Terra and Aqua Moderate Resolution Imaging Spectroradiometer (MODIS) sensors. J. Geophys. Res. 2006, 111, G2. [Google Scholar] [CrossRef]
  73. Roberts, G.; Wooster, M.J.; Lagoudakis, E. Annual and diurnal african biomass burning temporal dynamics. Biogeosciences 2009, 6, 849–866. [Google Scholar] [CrossRef]
  74. Eck, T.F.; Holben, B.N.; Reid, J.S.; Dubovik, O.; Smirnov, A.; O’Neill, N.T.; Slutsker, I.; Kinne, S. Wavelength Dependence of the Optical Depth of Biomass Burning, Urban, and Desert Dust Aerosols. J. Geophys. Res. 1999, 104, 31333. [Google Scholar] [CrossRef]
  75. Haslett, S.L.; Taylor, J.W.; Evans, M.; Morris, E.; Vogel, B.; Dajuma, A.; Brito, J.; Batenburg, A.M.; Borrmann, S.; Schneider, J.; et al. Remote biomass burning dominates southern West African air pollution during the monsoon. Atmos. Chem. Phys. 2019, 19, 15217–15234. [Google Scholar] [CrossRef]
  76. Deroubaix, A.; Flamant, C.; Menut, L.; Siour, G.; Mailler, S.; Turquety, S.; Briant, R.; Khvorostyanov, D.; Crumeyrolle, S. Interactions of atmospheric gases and aerosols with the monsoon dynamics over the Sudano-Guinean region during AMMA. Atmos. Chem. Phys. 2018, 18, 445–465. [Google Scholar] [CrossRef]
  77. Flamant, C.; Deroubaix, A.; Chazette, P.; Brito, J.; Gaetani, M.; Knippertz, P.; Fink, A.H.; Coetlogon, G.d.; Menut, L.; Colomb, A.; et al. Aerosol distribution in the northern Gulf of Guinea: Local anthropogenic sources, long-range transport, and the role of coastal shallow circulations. Atmos. Chem. Phys. 2018, 18, 12363–12389. [Google Scholar] [CrossRef]
  78. Smirnov, A.; Holben, B.N.; Eck, T.F.; Slutsker, I.; Chatenet, B.; Pinker, R.T. Diurnal variability of aerosol optical depth observed at AERONET (Aerosol Robotic Network) sites. Geophys. Res. Lett. 2002, 29, 30-1–30-4. [Google Scholar] [CrossRef]
Figure 1. Ombrotypes of Southern West Africa (adapted from [42], location of the AERONET stations, geographical boxes used in the study and geographical location of the Bodélé depression.
Atmosphere 15 00396 g001
Figure 2. Monthly mean annual cycle of (left) AERONET aerosol optical depth at 550 nm at the selected AERONET sites in the (A) Sahel, (B) Savanna and (C) Guinea geographical boxes, and (right) CALIOP aerosol optical depth at 532 nm for the (D) Sahel, (E) Savanna and (F) Guinea geographical boxes.
Atmosphere 15 00396 g002
Figure 3. Monthly mean annual cycle of (left) Angström Exponent at the selected AERONET sites in the (A) Sahel, (B) Savanna and (C) Guinea geographical boxes, and (right) relative contribution of the CALIOP aerosol type to the CALIOP AOD for the (D) Sahel, (E) Savanna and (F) Guinea geographical boxes.
Atmosphere 15 00396 g003
Figure 4. Regression plot of the monthly mean AERONET Angström exponent against the ratio of no-dust CALIOP AOD to CALIOP dust AOD.
Atmosphere 15 00396 g004
Figure 5. Mean seasonal CALIOP extinction profiles at 532 nm for (top row, (AC)) dust aerosol type in (A) Sahel, (B) Savanna and (C) Guinea geographical boxes, and for (bottom row, (DF)) polluted_dust aerosol type in (D) Sahel, (E) Savanna and (F) Guinea geographical boxes.
Atmosphere 15 00396 g005
Figure 6. Boxplot of the monthly annual cycle of the CALIOP-derived scale height (left column, AC) dust aerosol type in (A) Sahel, (B) Savanna and (C) Guinea geographical boxes, and for (right column, DF) polluted_dust aerosol type in (D) Sahel, (E) Savanna and (F) Guinea geographical boxes.
Atmosphere 15 00396 g006
Table 1. AERONET geographical location, period of observations, (N) number of days of observations during the period and corresponding ombrotype.
Station NameGeographical LocationPeriodNOmbrotype
Agoufou(15.3° N, 1.5° W)October 2002–April 20112000Arid
Banizoumbou(13.5° N, 2.7° E)October 1995–April 20226478Semi-arid
CATUC_Bamenda(5.9° N, 10.2° E)December 2016–January 2022796Humid
DMN_Maine_Soroa(13.2° N,12.0° E)November 2005–July 20101011Arid
Djougou(9.8° N, 1.6° E)February 2004–May 2007652Sub-humid
IER_Cinzana(13.3° N, 5.9° W)June 2004–Octpber 20214474Dry
Ilorin(8.5° N, 4.7° E)April 1998–March 20213892Sub-humid
Koforidua_ANUC(6.1° N, 0.3° W)December 2015–January 20221353Sub-humid
LAMTO-STATION(6.2° N, 5.0° W)November 1997–November 20211306Sub-humid
Ouagadougou(12.4° N, 1.5° W)November 1994–September 20071724Dry
Zinder_Airport(13.8° N, 9.0° E)May 2009–April 20222873Semi-arid
Table 2. AERONET AOD and AE means and standard deviations and percentage of dust and pollution days.
Station NameAOD (±log(SD))AE (±SD)Dust (%)Pollution (%)
Agoufou0.38 (±0.74)0.27 (±0.23)65.30.4
Banizoumbou0.37 (±0.71)0.35 (±0.25)51.20.8
CATUC_Bamenda0.40 (±0.78)1.06 (±0.37)3.644.6
DMN_Maine_Soroa0.35 (±0.68)0.39 (±0.31)49.82.3
Djougou0.53 (±0.61)0.58 (±0.36)26.411.0
IER_Cinzana0.35 (±0.68)0.34 (±0.25)51.30.7
Ilorin0.49 (±0.71)0.72 (±0.36)12.015.1
Koforidua_ANUC0.49 (±0.69)0.85 (±0.35)3.526.5
LAMTO-STATION0.41 (±0.63)0.84 (±0.35)5.025.0
Ouagadougou0.39 (±0.65)0.41 (±0.26)40.41.5
Zinder_Airport0.38 (±0.72)0.35 (±0.25)51.40.6
Disclaimer/Publisher’s Note: The statements, opinions and data contained in all publications are solely those of the individual author(s) and contributor(s) and not of MDPI and/or the editor(s). MDPI and/or the editor(s) disclaim responsibility for any injury to people or property resulting from any ideas, methods, instructions or products referred to in the content.

