
Light-Duty Vehicle Brake Emission Factors
 , , and
Abstract
:1. Introduction
2. Background
3. Research According to GTR 24
3.1. Emission Factors per Brake Corner
3.2. Mass (Wear) Loss and Airborne Fraction
3.3. PM2.5 to PM10
3.4. ECE vs. NAO Pads
3.5. Advanced Discs
3.6. Brake Particle Filters or Collection Systems
3.7. Electrified Vehicles
4. Discussion
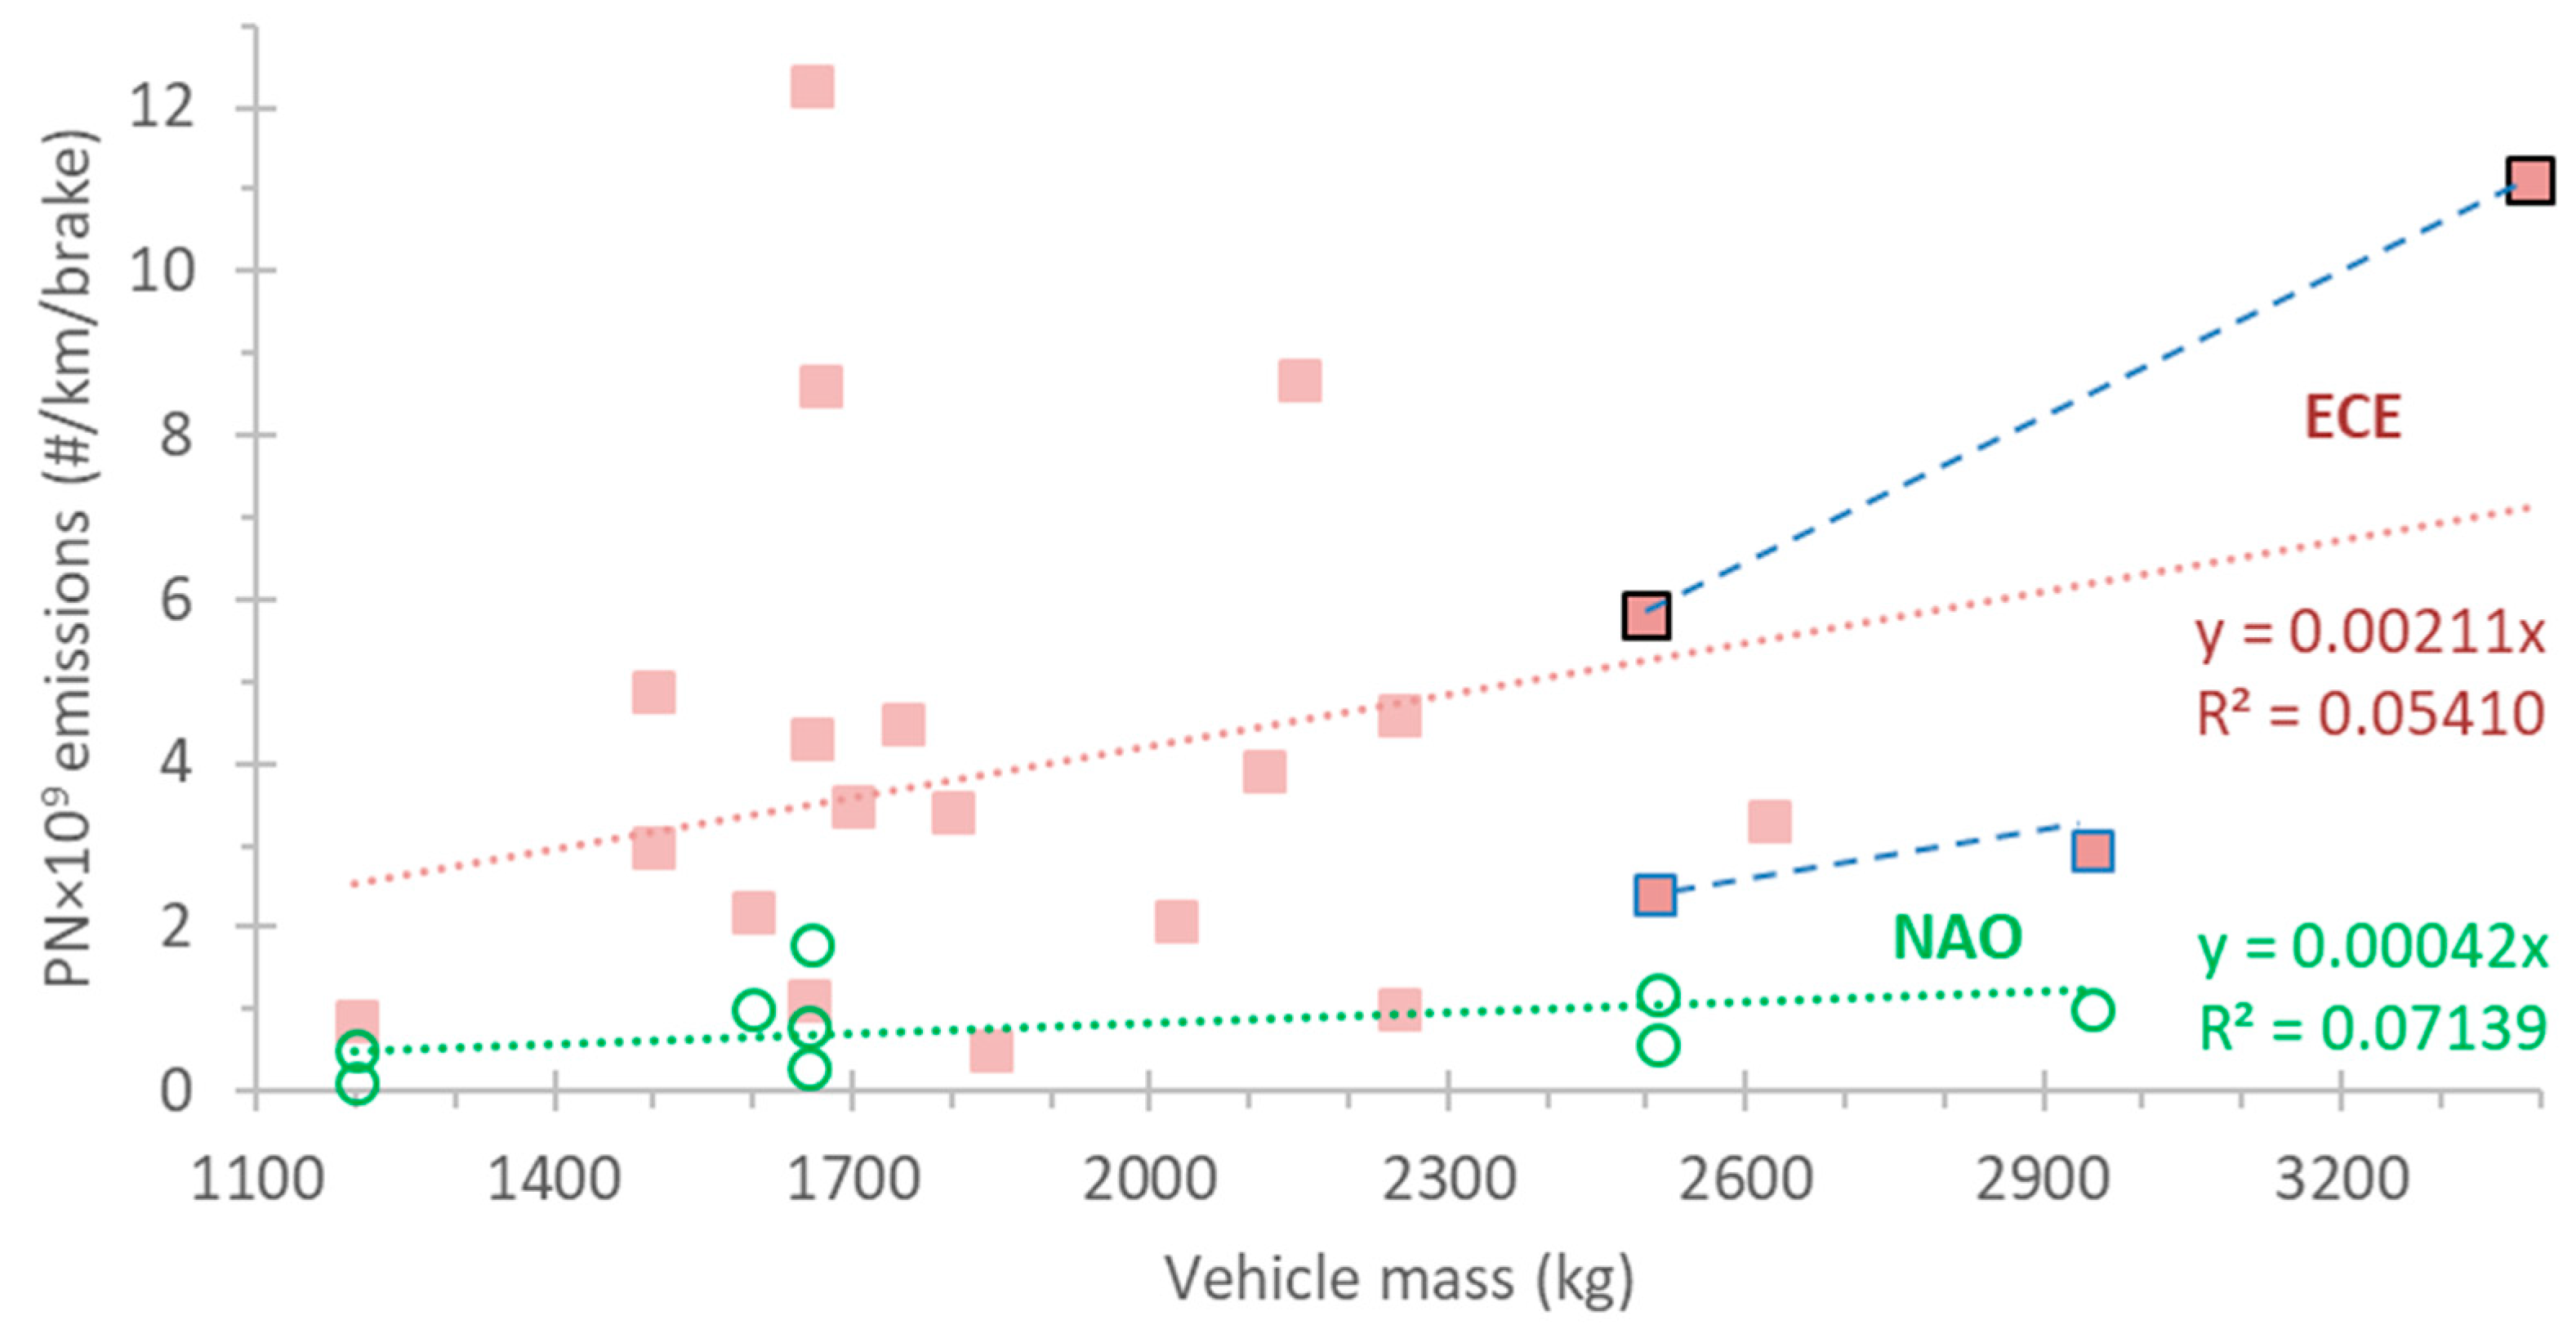
4.1. Emission Factors and Vehicle Mass
4.2. Comparison with International Organization of Motor Vehicle Manufacturers (OICA) Data
4.3. Brake Emission Factors at Vehicle Level
4.4. Roadside and Tunnel Studies
4.5. Emission Inventories
4.6. Total vs. Solid Particles
5. Conclusions
- The airborne and/or PM10 fraction to total wear is 40–45% on average.
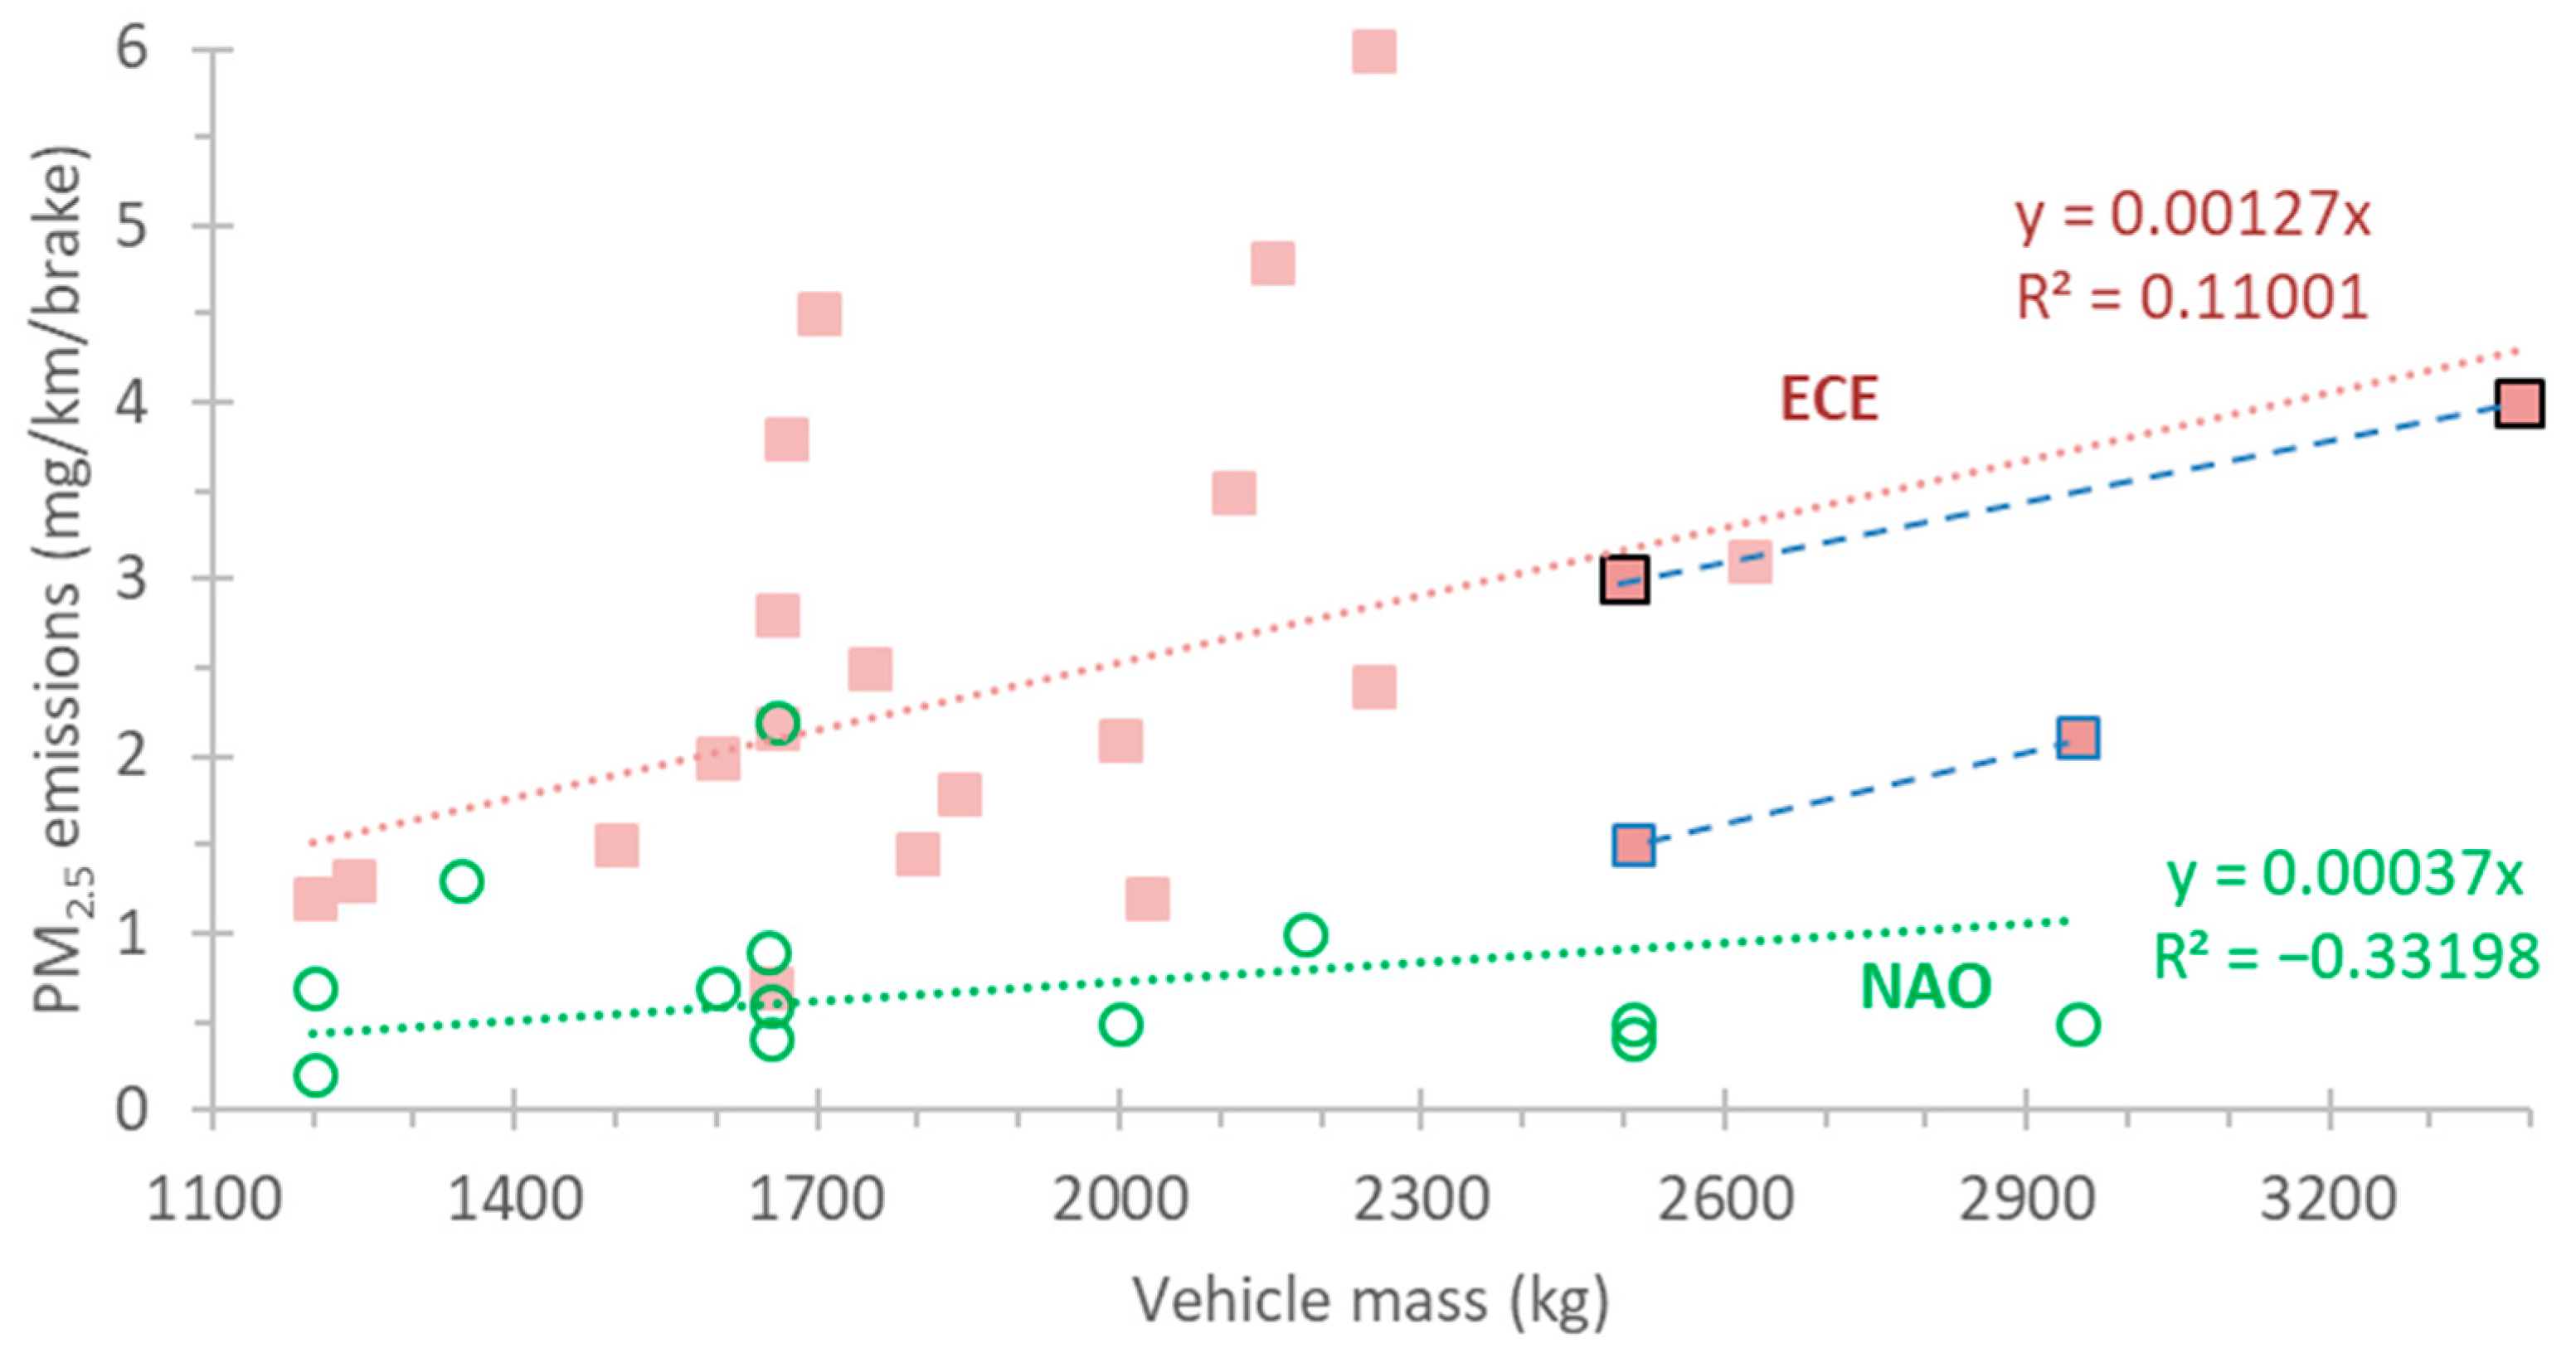
- The PM2.5 to PM10 ratio is in the order of 40–45%.
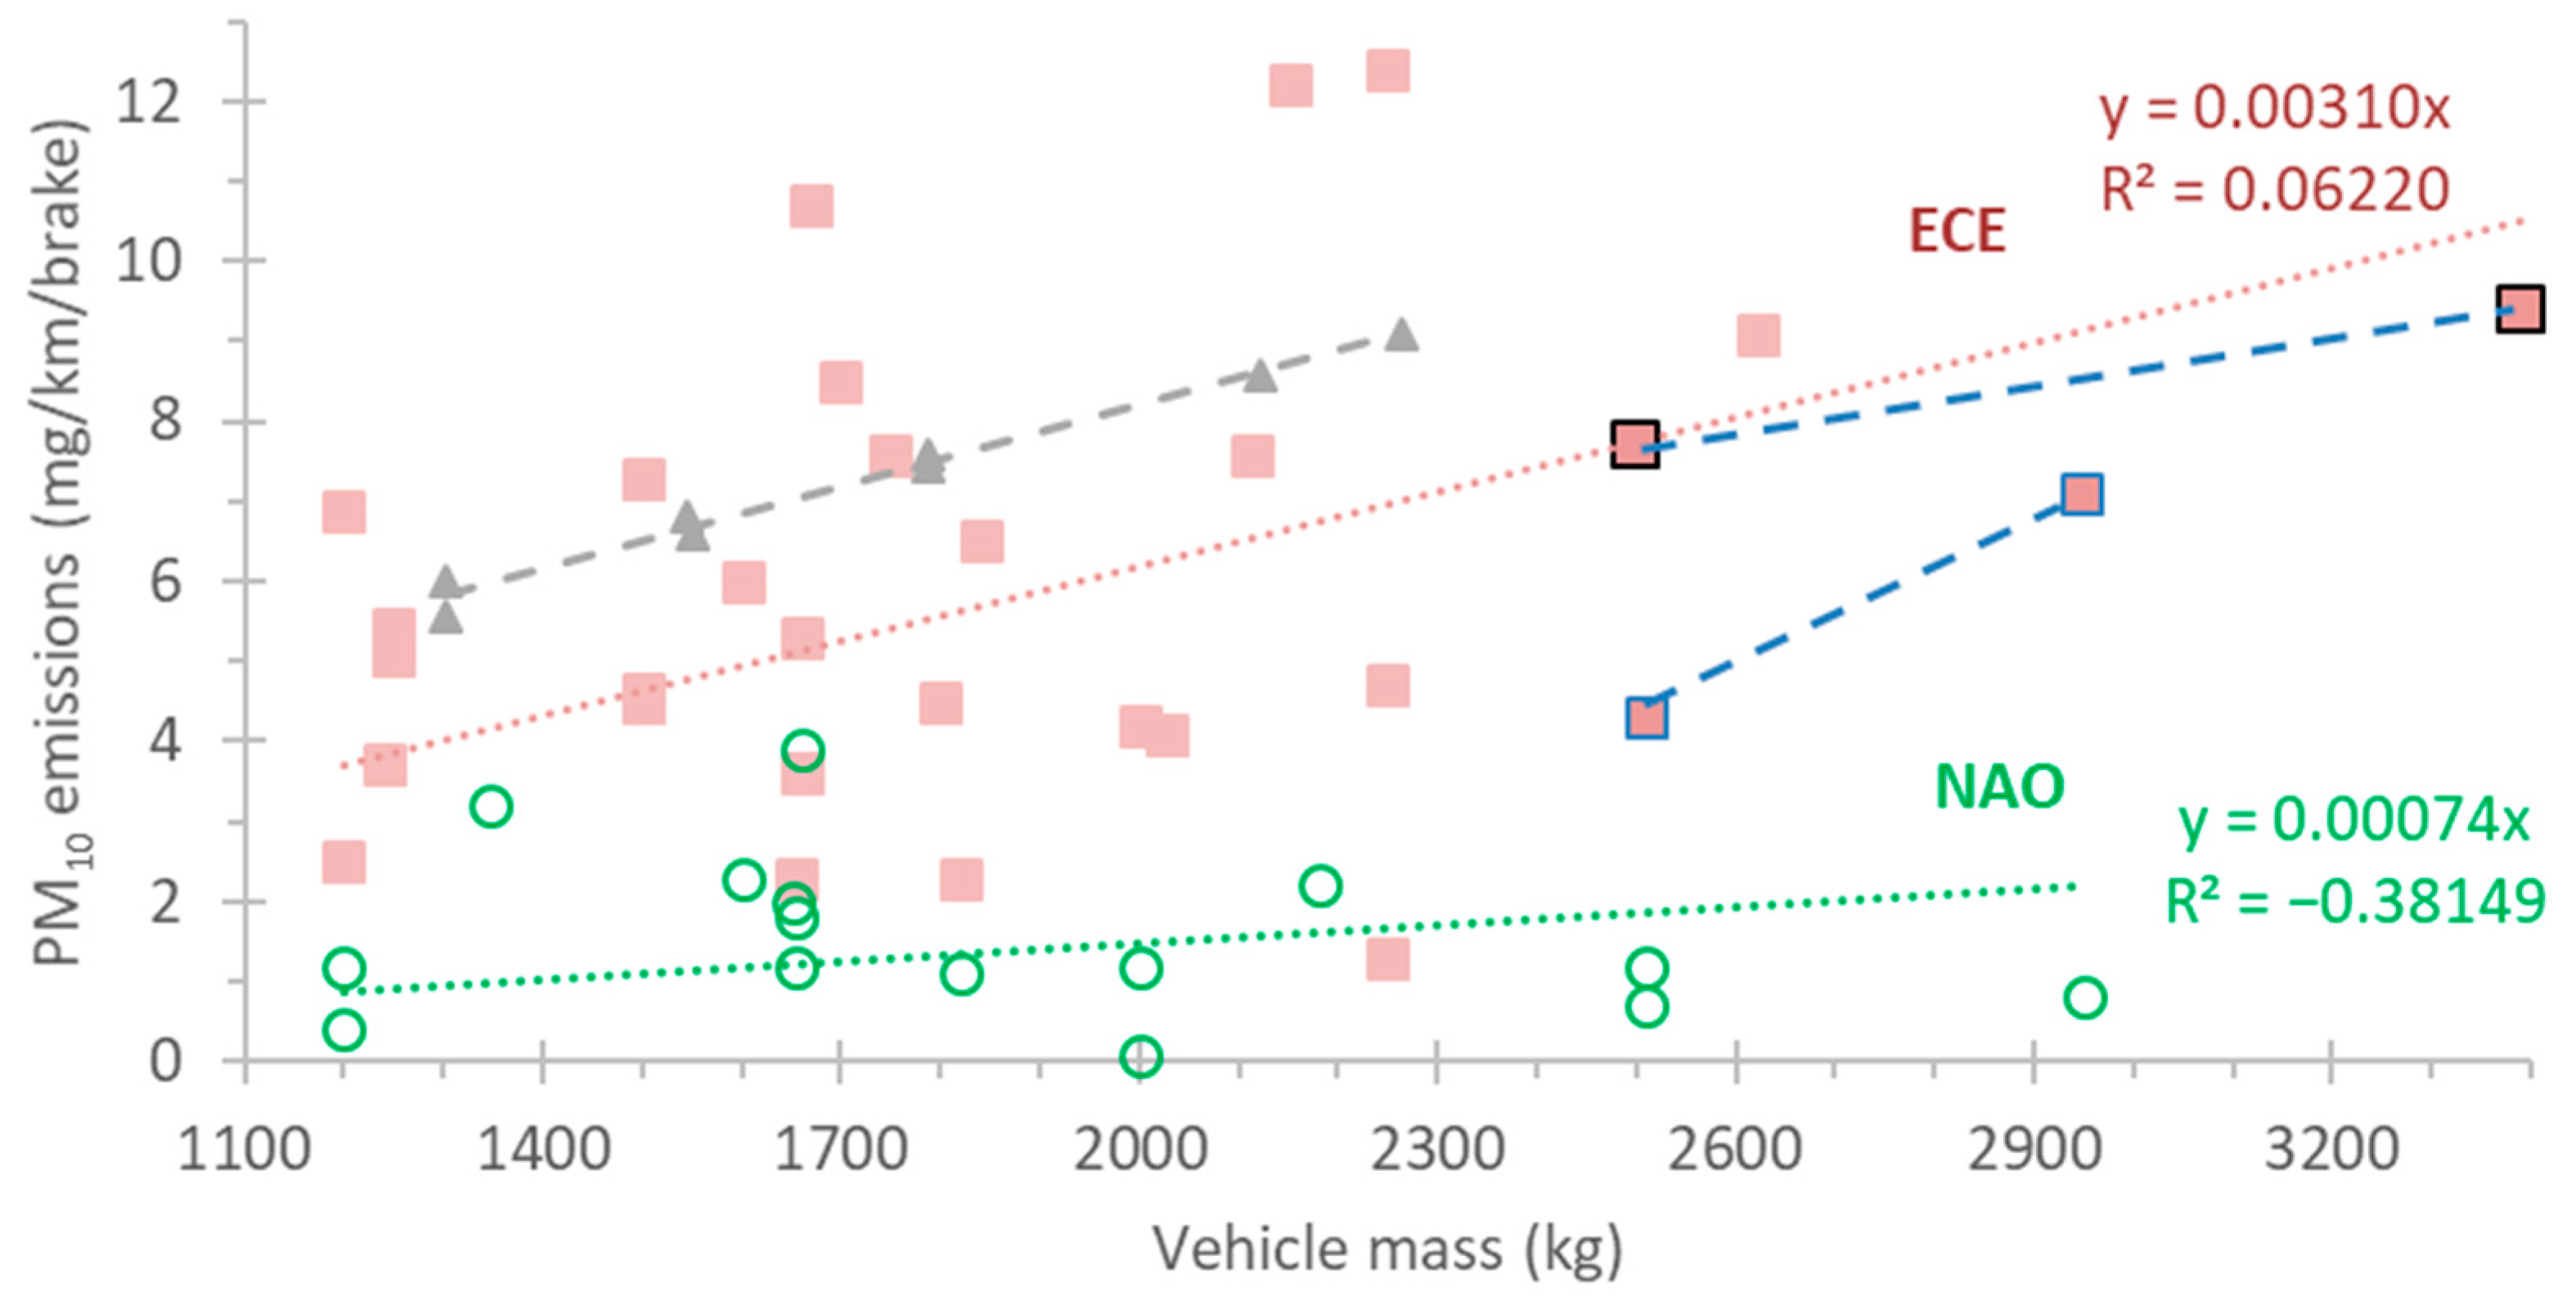
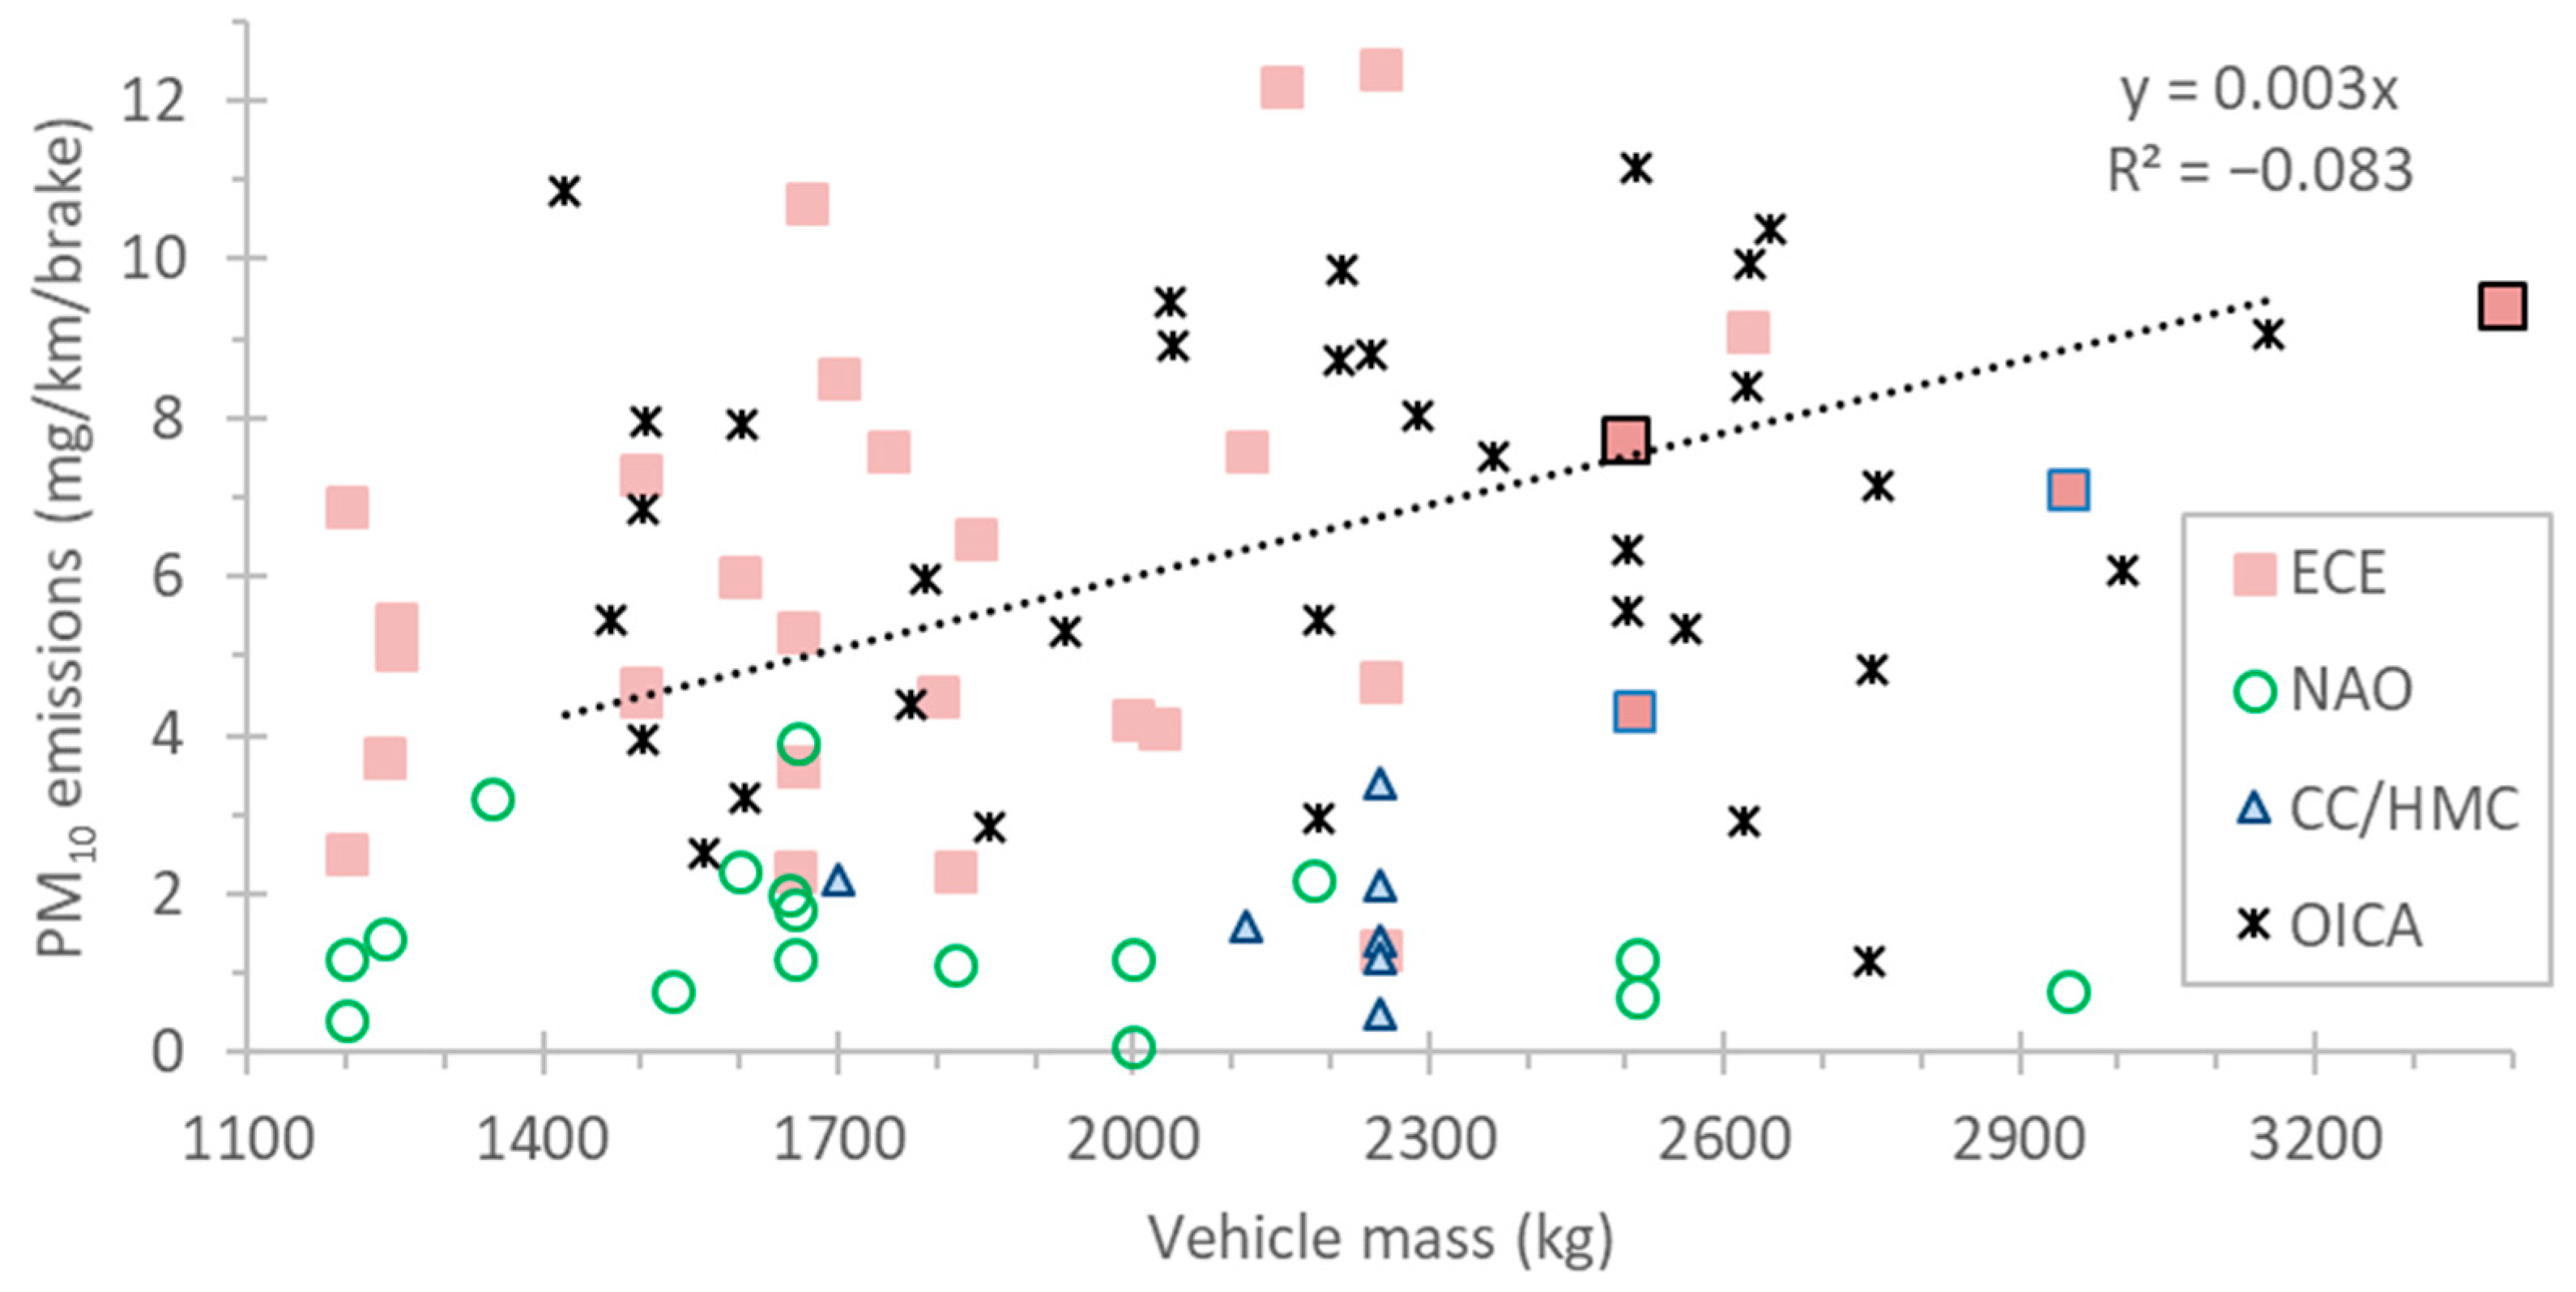
- ECE (i.e., low metal and semi metallic) pads with gray cast iron (GCI) discs emit on average around 3 mg/km/brake per 1000 kg of vehicle mass. However, there is a large variability and the exact value depends on the brake and/or disc combination. The emission factor at vehicle level is around 2.83 to 3 times higher.
- NAO pads can reduce the emissions by at least 60%.
- Advanced discs (coated GCI or carbon ceramic) can reduce the emissions by 60–80%. This may be further enhanced when appropriate pads are applied.
- Brake dust filter can reduce the emission from around 50% (passive systems) to 75% (active systems).
- The electrification of vehicles can reduce the emissions up to 60–80% due to regenerative braking. Lower reductions are observed with lower electrification levels.
- Roadside measurements of brake emissions estimate lower emission factors than those estimated in this review paper.
- The emission inventories are in quite good agreement with the emission factors of this review.
Author Contributions
Funding
Institutional Review Board Statement
Informed Consent Statement
Data Availability Statement
Conflicts of Interest
Appendix A


References
- Health Effects Institute. State of Global Air 2020; Health Effects Institute: Boston, MA, USA, 2020. [Google Scholar]
- Belis, C.A.; Karagulian, F.; Larsen, B.R.; Hopke, P.K. Critical Review and Meta-Analysis of Ambient Particulate Matter Source Apportionment Using Receptor Models in Europe. Atmos. Environ. 2013, 69, 94–108. [Google Scholar] [CrossRef]
- European Environment Agency. Air Quality in Europe: 2020 Report; Publications Office: Luxembourg, 2020. [Google Scholar]
- European Commission. Directorate General for Internal Market, Industry, Entrepreneurship and SMEs. In Euro 7 Impact Assessment Study; Publications Office: Luxembourg, 2022. [Google Scholar]
- EEA National Emissions Reported to the Convention on Long-Range Transboundary Air Pollution (LRTAP Convention). Available online: https://www.eea.europa.eu/en/datahub/datahubitem-view/5be6cebc-ed2b-4496-be59-93736fc4ad78?activeaccordion=2023 (accessed on 7 January 2024).
- EEA EIONET Central Data Repository, 2023. Available online: https://cdr.eionet.europa.eu/ (accessed on 7 January 2024).
- Air Quality Expert Group (AQEG) Non-Exhaust Emissions from Road Traffic. UK, 2019. Available online: https://uk-air.defra.gov.uk/assets/documents/reports/cat09/1907101151_20190709_Non_Exhaust_Emissions_typeset_Final.pdf (accessed on 7 January 2024).
- Fussell, J.C.; Franklin, M.; Green, D.C.; Gustafsson, M.; Harrison, R.M.; Hicks, W.; Kelly, F.J.; Kishta, F.; Miller, M.R.; Mudway, I.S.; et al. A Review of Road Traffic-Derived Non-Exhaust Particles: Emissions, Physicochemical Characteristics, Health Risks, and Mitigation Measures. Environ. Sci. Technol. 2022, 56, 6813–6835. [Google Scholar] [CrossRef]
- EMEP/EEA. EMEP/EEA Air Pollutant Emission Inventory Guidebook 2019 1.A.3.b.vi-Vii Road Tyre and Brake Wear 2019. 2009. Available online: https://www.eea.europa.eu/publications/emep-eea-guidebook-2019/part-b-sectoral-guidance-chapters/1-energy/1-a-combustion/1-a-3-b-vi/view (accessed on 7 January 2024).
- Grigoratos, T.; Mathissen, M.; Vedula, R.; Mamakos, A.; Agudelo, C.; Gramstat, S.; Giechaskiel, B. Interlaboratory Study on Brake Particle Emissions—Part I: Particulate Matter Mass Emissions. Atmosphere 2023, 14, 498. [Google Scholar] [CrossRef]
- Aranke, O.; Algenaid, W.; Awe, S.; Joshi, S. Coatings for Automotive Gray Cast Iron Brake Discs: A Review. Coatings 2019, 9, 552. [Google Scholar] [CrossRef]
- Mulani, S.M.; Kumar, A.; Shaikh, H.N.E.A.; Saurabh, A.; Singh, P.K.; Verma, P.C. A Review on Recent Development and Challenges in Automotive Brake Pad-Disc System. Mater. Today: Proc. 2022, 56, 447–454. [Google Scholar] [CrossRef]
- Ghouri, I.; Barker, R.; Brooks, P.; Kosarieh, S.; Barton, D. The Effects of Corrosion on Particle Emissions from a Grey Cast Iron Brake Disc; 2022-01–1178; SAE International: Warrendale, PA, USA.
- Perricone, G.; Matějka, V.; Alemani, M.; Valota, G.; Bonfanti, A.; Ciotti, A.; Olofsson, U.; Söderberg, A.; Wahlström, J.; Nosko, O.; et al. A Concept for Reducing PM 10 Emissions for Car Brakes by 50%. Wear 2018, 396–397, 135–145. [Google Scholar] [CrossRef]
- Vasiljević, S.; Glišović, J.; Stojanović, B.; Vencl, A. Review of the Coatings Used for Brake Discs Regarding Their Wear Resistance and Environmental Effect. Proc. Inst. Mech. Eng. Part J J. Eng. Tribol. 2022, 236, 1932–1949. [Google Scholar] [CrossRef]
- Seo, H.; Park, J.; Kim, Y.C.; Lee, J.J.; Jang, H. Effect of Disc Materials on Brake Emission during Moderate-Temperature Braking. Tribol. Int. 2021, 163, 107185. [Google Scholar] [CrossRef]
- Dizdar, S.; Lyu, Y.; Lampa, C.; Olofsson, U. Grey Cast Iron Brake Discs Laser Cladded with Nickel-Tungsten Carbide—Friction, Wear and Airborne Wear Particle Emission. Atmosphere 2020, 11, 621. [Google Scholar] [CrossRef]
- Güney, B.; Mutlu, I. Tribological Properties of Brake Discs Coated with Cr2O3—40% Tio2 by Plasma Spraying. Surf. Rev. Lett. 2019, 26, 1950075. [Google Scholar] [CrossRef]
- Holzgaßner, L.; Singh, R.; Bernhardt, S. Particle Emission Reduction for Brake Discs via High-Performance Cold Spray Coating. Presented at the Chassis; Tech Plus: Munich, Germany, 2023. [Google Scholar]
- Day, A.; Bryant, D. Braking of Road Vehicles, 2nd ed.; Butterworth-Heinemann: Kidlington, UK; Cambridge, MA, USA, 2022; ISBN 978-0-12-822005-4. [Google Scholar]
- Borawski, A. Conventional and Unconventional Materials Used in the Production of Brake Pads—Review. Sci. Eng. Compos. Mater. 2020, 27, 374–396. [Google Scholar] [CrossRef]
- Sinha, A.; Ischia, G.; Menapace, C.; Gialanella, S. Experimental Characterization Protocols for Wear Products from Disc Brake Materials. Atmosphere 2020, 11, 1102. [Google Scholar] [CrossRef]
- Woo, S.-H.; Kim, Y.; Lee, S.; Choi, Y.; Lee, S. Characteristics of Brake Wear Particle (BWP) Emissions under Various Test Driving Cycles. Wear 2021, 480–481, 203936. [Google Scholar] [CrossRef]
- Wahlström, J.; Söderberg, A.; Olander, L.; Jansson, A.; Olofsson, U. A Pin-on-Disc Simulation of Airborne Wear Particles from Disc Brakes. Wear 2010, 268, 763–769. [Google Scholar] [CrossRef]
- Woo, S.-H.; Jang, H.; Na, M.Y.; Chang, H.J.; Lee, S. Characterization of Brake Particles Emitted from Non-Asbestos Organic and Low-Metallic Brake Pads under Normal and Harsh Braking Conditions. Atmos. Environ. 2022, 278, 119089. [Google Scholar] [CrossRef]
- Reich, A.; Sarda, A.; Semsch, M. Drag Torque in Disk Brakes: Significance, Measurement and Challenges. SAE Int. J. Commer. Veh. 2015, 8, 276–282. [Google Scholar] [CrossRef]
- Danner, C.; Pein, A. Preview on Future Developments of Non-Exhaust Emissions. In 12th International Munich Chassis Symposium 2021; Pfeffer, P., Ed.; Proceedings; Springer: Berlin/Heidelberg, Germany, 2022; pp. 497–513. ISBN 978-3-662-64549-9. [Google Scholar]
- Storch, L.; Hamatschek, C.; Hesse, D.; Feist, F.; Bachmann, T.; Eichler, P.; Grigoratos, T. Comprehensive Analysis of Current Primary Measures to Mitigate Brake Wear Particle Emissions from Light-Duty Vehicles. Atmosphere 2023, 14, 712. [Google Scholar] [CrossRef]
- Cha, S.; Carter, P.; Bradow, R.L. Simulation of Automobile Brake Wear Dynamics and Estimation of Emissions; 831036; SAE: Warrendale, PA, USA, 1983. [Google Scholar]
- Tutuianu, M.; Bonnel, P.; Ciuffo, B.; Haniu, T.; Ichikawa, N.; Marotta, A.; Pavlovic, J.; Steven, H. Development of the World-Wide Harmonized Light Duty Test Cycle (WLTC) and a Possible Pathway for Its Introduction in the European Legislation. Transp. Res. Part D Transp. Environ. 2015, 40, 61–75. [Google Scholar] [CrossRef]
- Mathissen, M.; Grochowicz, J.; Schmidt, C.; Vogt, R.; Farwick zum Hagen, F.H.; Grabiec, T.; Steven, H.; Grigoratos, T. A Novel Real-World Braking Cycle for Studying Brake Wear Particle Emissions. Wear 2018, 414–415, 219–226. [Google Scholar] [CrossRef]
- Luhana, L.; Sokhi, R.S.; Warner, L.; Mao, H.; Boulter, P.; McCrae, I.; Wright, J.; Osborn, D. Measurement of Non-Exhaust Particulate Matter; Deliverable to Particulates project; TRL: Berkshire, UK, 2004. [Google Scholar]
- Grigoratos, T.; Martini, G. Brake Wear Particle Emissions: A Review. Environ. Sci. Pollut. Res. 2015, 22, 2491–2504. [Google Scholar] [CrossRef]
- Kukutschová, J.; Filip, P. Review of Brake Wear Emissions. In Non-Exhaust Emissions; Academic Press: London, UK, 2018; pp. 123–146. ISBN 978-0-12-811770-5. [Google Scholar]
- Wahid, S.M.S. Automotive Brake Wear: A Review. Environ. Sci Pollut Res 2018, 25, 174–180. [Google Scholar] [CrossRef]
- Perricone, G.; Alemani, M.; Wahlström, J.; Olofsson, U. A Proposed Driving Cycle for Brake Emissions Investigation for Test Stand. Proc. Inst. Mech. Eng. Part D J. Automob. Eng. 2020, 234, 122–135. [Google Scholar] [CrossRef]
- Semadeni-Davies, A.; Coulson, G.; Gadd, J.; Somervell, E.; Longely, I.; Olivares, G. Determining the Ecological and Air Quality Impacts of Particulate Matter from Brake and Tyre Wear and Road Surface Dust: Stage 1, Literature Review and Recommendations for Developing New Emission Factors for New Zealand; Waka Kotahi, N.Z., Ed.; Transport Agency: Wellington, New Zealand, 2021; ISBN 978-1-990044-37-3. [Google Scholar]
- Guo, D.; Wei, H.; Guo, Y.; Wang, C.; Yin, Z. Non-Exhaust Particulate Matter Emission from Vehicles: A Review. E3S Web Conf. 2021, 268, 01015. [Google Scholar] [CrossRef]
- Rahimi, M.; Bortoluzzi, D.; Wahlström, J. Input Parameters for Airborne Brake Wear Emission Simulations: A Comprehensive Review. Atmosphere 2021, 12, 871. [Google Scholar] [CrossRef]
- Piscitello, A.; Bianco, C.; Casasso, A.; Sethi, R. Non-Exhaust Traffic Emissions: Sources, Characterization, and Mitigation Measures. Sci. Total Environ. 2021, 766, 144440. [Google Scholar] [CrossRef]
- Liu, Y.; Wu, S.; Chen, H.; Federici, M.; Perricone, G.; Li, Y.; Lv, G.; Munir, S.; Luo, Z.; Mao, B. Brake Wear Induced PM10 Emissions during the World Harmonised Light-Duty Vehicle Test Procedure-Brake Cycle. J. Clean. Prod. 2022, 361, 132278. [Google Scholar] [CrossRef]
- Wang, Y.; Yin, H.; Yang, Z.; Su, S.; Hao, L.; Tan, J.; Wang, X.; Niu, Z.; Ge, Y. Assessing the Brake Particle Emissions for Sustainable Transport: A Review. Renew. Sustain. Energy Rev. 2022, 167, 112737. [Google Scholar] [CrossRef]
- Feo, M.L.; Torre, M.; Tratzi, P.; Battistelli, F.; Tomassetti, L.; Petracchini, F.; Guerriero, E.; Paolini, V. Laboratory and On-Road Testing for Brake Wear Particle Emissions: A Review. Environ. Sci. Pollut. Res. 2023, 30, 100282–100300. [Google Scholar] [CrossRef]
- Garg, B.D.; Cadle, S.H.; Mulawa, P.A.; Groblicki, P.J.; Laroo, C.; Parr, G.A. Brake Wear Particulate Matter Emissions. Environ. Sci. Technol. 2000, 34, 4463–4469. [Google Scholar] [CrossRef]
- Westerlund, K.-G.; Johansson, C. Emissions of Metals and Particulate Matter Due to Wear of Brake Linings in Stockholm. In Air Pollution X; Brebbia, C.A., Martin-Duque, J.F., Eds.; WIT Press: Southampton, UK, 2002; ISBN 1-85312-916-X. [Google Scholar]
- Sanders, P.G.; Xu, N.; Dalka, T.M.; Maricq, M.M. Airborne Brake Wear Debris: Size Distributions, Composition, and a Comparison of Dynamometer and Vehicle Tests. Environ. Sci. Technol. 2003, 37, 4060–4069. [Google Scholar] [CrossRef]
- Iijima, A.; Sato, K.; Yano, K.; Kato, M.; Kozawa, K.; Furuta, N. Emission Factor for Antimony in Brake Abrasion Dusts as One of the Major Atmospheric Antimony Sources. Environ. Sci. Technol. 2008, 42, 2937–2942. [Google Scholar] [CrossRef]
- Hagino, H.; Oyama, M.; Sasaki, S. Airborne Brake Wear Particle Emission Due to Braking and Accelerating. Wear 2015, 334–335, 44–48. [Google Scholar] [CrossRef]
- Hagino, H.; Oyama, M.; Sasaki, S. Laboratory Testing of Airborne Brake Wear Particle Emissions Using a Dynamometer System under Urban City Driving Cycles. Atmos. Environ. 2016, 131, 269–278. [Google Scholar] [CrossRef]
- Perricone, G.; Alemani, M.; Metinöz, I.; Matějka, V.; Wahlström, J.; Olofsson, U. Towards the Ranking of Airborne Particle Emissions from Car Brakes—A System Approach. Proc. Inst. Mech. Eng. Part D J. Automob. Eng. 2017, 231, 781–797. [Google Scholar] [CrossRef]
- Farwick zum Hagen, F.H.; Mathissen, M.; Grabiec, T.; Hennicke, T.; Rettig, M.; Grochowicz, J.; Vogt, R.; Benter, T. On-Road Vehicle Measurements of Brake Wear Particle Emissions. Atmos. Environ. 2019, 217, 116943. [Google Scholar] [CrossRef]
- Mathissen, M.; Grigoratos, T.; Lahde, T.; Vogt, R. Brake Wear Particle Emissions of a Passenger Car Measured on a Chassis Dynamometer. Atmosphere 2019, 10, 556. [Google Scholar] [CrossRef]
- Hesse, D.; Augsburg, K. Real Driving Emissions Measurement of Brake Dust Particles; 2019-01–2138; SAE: Warrendale, PA, USA, 2019. [Google Scholar]
- Vojtíšek-Lom, M.; Vaculík, M.; Pechout, M.; Hopan, F.; Arul Raj, A.F.; Penumarti, S.; Horák, J.S.; Popovicheva, O.; Ondráček, J.; Doušová, B. Effects of Braking Conditions on Nanoparticle Emissions from Passenger Car Friction Brakes. Sci. Total Environ. 2021, 788, 147779. [Google Scholar] [CrossRef]
- Kim, S.-H.; Shim, W.; Kwon, S.-U.; Lee, J.-J.; Seo, M.-W.; Kim, J.-K.; Pee, J.-H.; Kim, J.-Y. The Impact of Composition in Non-Steel and Low-Steel Type Friction Materials on Airborne Brake Wear Particulate Emission. Tribol. Lett. 2020, 68, 118. [Google Scholar] [CrossRef]
- Park, J.; Joo, B.; Seo, H.; Song, W.; Lee, J.J.; Lee, W.K.; Jang, H. Analysis of Wear Induced Particle Emissions from Brake Pads during the Worldwide Harmonized Light Vehicles Test Procedure (WLTP). Wear 2021, 466–467, 203539. [Google Scholar] [CrossRef]
- Kim, S.-H.; Jeong, M.H.; Kim, J.; Shim, W.; Kwon, S.-U.; Lee, J.-J.; Huh, S.H.; Pee, J.-H.; Kim, J.-Y. Dynamometric Investigation on Airborne Particulate Matter (PM) from Friction Materials for Automobile: Impact of Abrasive and Lubricant on PM Emission Factor. Lubricants 2021, 9, 118. [Google Scholar] [CrossRef]
- Woo, S.-H.; Jang, H.; Lee, S.-B.; Lee, S. Comparison of Total PM Emissions Emitted from Electric and Internal Combustion Engine Vehicles: An Experimental Analysis. Sci. Total Environ. 2022, 842, 156961. [Google Scholar] [CrossRef]
- Andersson, J.; Campbell, M.; Marshall, I.; Kramer, L.; Norris, J. Measurement of Emissions from Brake and Tyre Wear. Final Report—Phase 1; Ricardo: Shoreham-by-Sea, UK, 2022. [Google Scholar]
- Huber, M.P.; Murg, J.; Fischer, P. Assessing a Vehicle’s Real-World Brake Wear Particle Emissions on Public Roads. In Proceedings of the EuroBrake 2023, EB2023-TST-002, Barcelona, Spain, 12–14 September 2023. [Google Scholar]
- Zhang, Q.; Fang, T.; Men, Z.; Wei, N.; Peng, J.; Du, T.; Zhang, X.; Ma, Y.; Wu, L.; Mao, H. Direct Measurement of Brake and Tire Wear Particles Based on Real-World Driving Conditions. Sci. Total Environ. 2024, 906, 167764. [Google Scholar] [CrossRef]
- zum Hagen, F.H.F.; Mathissen, M.; Grabiec, T.; Hennicke, T.; Rettig, M.; Grochowicz, J.; Vogt, R.; Benter, T. Study of Brake Wear Particle Emissions: Impact of Braking and Cruising Conditions. Environ. Sci. Technol. 2019, 53, 5143–5150. [Google Scholar] [CrossRef]
- Mamakos, A.; Arndt, M.; Hesse, D.; Augsburg, K. Physical Characterization of Brake-Wear Particles in a PM10 Dilution Tunnel. Atmosphere 2019, 10, 639. [Google Scholar] [CrossRef]
- Hagino, H. Sensitivity and Reproducibility of Brake Wear Particle Emission Measurements Using JARI System. In Proceedings of the 50th PMP Meeting, Brussels, Belgium, 3–4 April 2019. [Google Scholar]
- Mamakos, A.; Arndt, M.; Hesse, D.; Hamatschek, C.; Augsburg, K. Comparison of Particulate Matter and Number Emissions from a Floating and a Fixed Caliper Brake System of the Same Lining Formulation; 2020-01–1633; SAE: Warrendale, PA, USA, 2020. [Google Scholar]
- Mamakos, A.; Huber, M.P.; Arndt, M.; Reingruber, H.; Steiner, G.; Weidinger, C. Design of a Laboratory Sampling System for Brake Wear Particle Measurements; 2022-01–1179; SAE: Warrendale, PA, USA, 2022. [Google Scholar]
- Agudelo, C.; Vedula, R.T.; Collier, S.; Stanard, A. Brake Particulate Matter Emissions Measurements for Six Light-Duty Vehicles Using Inertia Dynamometer Testing; 2020-01–1637; SAE: Warrendale, PA, USA, 2020. [Google Scholar]
- Gramstat, S.; Mertens, T.; Waninger, R.; Lugovyy, D. Impacts on Brake Particle Emission Testing. Atmosphere 2020, 11, 1132. [Google Scholar] [CrossRef]
- Gramstat, S.; Mertens, T.; Waninger, R.; Augsburg, K.; Hamatschek, C.; Hesse, D. Functional Coatings of Gray-Cast Iron Brake Discs—Impact on the Tribology. In Berichte aus dem µ-Club 2020; Mayer, R., Ed.; Springer: Berlin/Heidelberg, Germany, 2021; pp. 162–170. ISBN 978-3-662-63027-3. [Google Scholar]
- Hamatschek, C.; Augsburg, K.; Schobel, D.; Gramstat, S.; Stich, A.; Gulden, F.; Hesse, D. Comparative Study on the Friction Behaviour and the Particle Formation Process between a Laser Cladded Brake Disc and a Conventional Grey Cast Iron Disc. Metals 2023, 13, 300. [Google Scholar] [CrossRef]
- Hesse, D.; Hamatschek, C.; Augsburg, K.; Weigelt, T.; Prahst, A.; Gramstat, S. Testing of Alternative Disc Brakes and Friction Materials Regarding Brake Wear Particle Emissions and Temperature Behavior. Atmosphere 2021, 12, 436. [Google Scholar] [CrossRef]
- Huber, M.P.; Fischer, P.; Mamakos, A.; Steiner, G.; Klug, A. Measuring Brake Wear Particles with a Real-Driving Emissions Sampling System on a Brake Dynamometer; 2022-01–1180; SAE: Warrendale, PA, USA, 2022. [Google Scholar]
- Mathissen, M.; Grigoratos, T.; Gramstat, S.; Mamakos, A.; Vedula, R.; Agudelo, C.; Grochowicz, J.; Giechaskiel, B. Interlaboratory Study on Brake Particle Emissions Part II: Particle Number Emissions. Atmosphere 2023, 14, 424. [Google Scholar] [CrossRef]
- Hagino, H. Brake Wear Particle Emission Measurements Based on Real Driving Cycles in Several Urban Areas in a Laboratory Testing; EB2023-TST-009. In Proceedings of the EuroBarakes 2023, Barcelona, Spain, 12–14 September 2023. [Google Scholar]
- Sin, A. Comparison of Different Tribological Couples Respect to Pm10 Emissions; EB2023-EFA-010. In Proceedings of the EuroBrake 2023, Barcelona, Spain, 12–14 September 2023. [Google Scholar]
- Adamczak, L. At Source Brake Dust Active Filtering System; EB2023-EFA-008. In Proceedings of the EuroBrake 2023, Barcelona, Spain, 12–14 September 2023. [Google Scholar]
- Hagino, H.; Iwata, A.; Okuda, T. Iron Oxide and Hydroxide Speciation in Emissions of Brake-Wear Particles from Different Friction Materials Using X-Ray Absorption Fine Structure. Atmosphere 2023, 15, 49. [Google Scholar] [CrossRef]
- Hagino, H. Investigation of Brake-Wear Particle Emissions from Regenerative-Friction Brake Coordination Systems via Dynamometer Testing. Atmosphere 2024, 15, 75. [Google Scholar] [CrossRef]
- Grigoratos, T.; Mamakos, A.; Vedula, R.; Arndt, M.; Lugovyy, D.; Hafenmayer, C.; Moisio, M.; Agudelo, C.; Giechaskiel, B. Characterization of Laboratory Particulate Matter (PM) Mass Setups for Brake Emission Measurements. Atmosphere 2023, 14, 516. [Google Scholar] [CrossRef]
- Stojanovic, N.; Abdullah, O.I.; Grujic, I.; Boskovic, B. Particles Formation Due to the Wear of Tires and Measures for the Wear Reduction: A Review. Proc. Inst. Mech. Eng. Part D J. Automob. Eng. 2022, 236, 3075–3089. [Google Scholar] [CrossRef]
- Candeo, S.; Leonardi, M.; Gialanella, S.; Straffelini, S. Influence of Contact Pressure and Velocity on the Brake Behaviour and Particulate Matter Emissions. Wear 2023, 514–515, 204579. [Google Scholar] [CrossRef]
- Steege, R.; Welp, D.; Lange, J. The Contribution of Brake Emissions to the Total Vehicle Emissions. In 6th International Munich Chassis Symposium 2015; Pfeffer, P., Ed.; Proceedings; Springer: Wiesbaden, Germany, 2015; pp. 585–603. ISBN 978-3-658-09710-3. [Google Scholar]
- Hamatschek, C.; Hesse, D.; Augsburg, K.; Gramstat, S.; Stich, A. Comparison of the Particle Emission Behaviour of Automotive Drum and Disc Brakes. In 12th International Munich Chassis Symposium 2021; Pfeffer, P., Ed.; Proceedings; Springer: Berlin/Heidelberg, Germany, 2022; pp. 541–563. ISBN 978-3-662-64549-9. [Google Scholar]
- Wahlström, J.; Lyu, Y.; Matjeka, V.; Söderberg, A. A Pin-on-Disc Tribometer Study of Disc Brake Contact Pairs with Respect to Wear and Airborne Particle Emissions. Wear 2017, 384–385, 124–130. [Google Scholar] [CrossRef]
- Kılıç, H.; Mısırlı, C. Investigation of Tribological Behavior of 20NiCrBSi-WC12Co Coated Brake Disc by HVOF Method. Mater. Res. Express 2020, 7, 016560. [Google Scholar] [CrossRef]
- Fieldhouse, J.D.; Gelb, J. New Developments of an On-Vehicle Brake Pad Waste Collection System. SAE Int. J. Passeng. Cars -Mech. Syst. 2016, 9, 1245–1254. [Google Scholar] [CrossRef]
- Hascoët, M.; Adamczak, L. At Source Brake Dust Collection System. Results Eng. 2020, 5, 100083. [Google Scholar] [CrossRef]
- Gramstat, S.; Hascoet, M.; Rocca-Serra, C.; Adamczak, L. Potentials and Challenges of a Brake Particle Emission Collecting System; 2020-01–1635; SAE: Warrendale, PA, USA, 2020. [Google Scholar]
- Hwang, I.S.; Lee, Y.L. A Study on the Pressure Drop Characteristics of a Passive Filter System for Collecting Fine Brake Dust. Int.J. Automot. Technol. 2021, 22, 1257–1265. [Google Scholar] [CrossRef]
- Hwang, I.S.; Park, J.-T.; Lee, Y.L. Feasibility of a Porous Ceramic Filter for Collecting Brake Fine Dust. Int.J. Automot. Technol. 2022, 23, 521–527. [Google Scholar] [CrossRef]
- Woo, S.-H.; Lee, G.; Han, B.; Lee, S. Development of Dust Collectors to Reduce Brake Wear PM Emissions. Atmosphere 2022, 13, 1121. [Google Scholar] [CrossRef]
- Keller, F.; Wörz, T.; Beck, A.; Kopriva, M.; Uhlir, M.; Pfannkuch, S. Development of an Active Brake Dust Particle Filter System to Reduce Brake Dust Emissions. EB2023-EFA-007. In Proceedings of the EuroBrake 2023, Barcelona, Spain, 12–14 September 2023. [Google Scholar]
- Timmers, V.R.J.H.; Achten, P.A.J. Non-Exhaust PM Emissions from Electric Vehicles. Atmos. Environ. 2016, 134, 10–17. [Google Scholar] [CrossRef]
- Beddows, D.C.S.; Harrison, R.M. PM10 and PM2.5 Emission Factors for Non-Exhaust Particles from Road Vehicles: Dependence upon Vehicle Mass and Implications for Battery Electric Vehicles. Atmos. Environ. 2021, 244, 117886. [Google Scholar] [CrossRef]
- Smit, R. Non-Exhaust PM Emissions from Battery Electric Vehicles (BEVs)—Does the Argument against Electric Vehicles Stack up? TER (Transport Energy/Emission Research Pty Ltd.): Australia, 2020. Available online: https://www.transport-e-research.com/_files/ugd/d0bd25_029571fc6c8a4d80a46adc23dd74ebfd.pdf (accessed on 7 January 2024).
- Liu, Y.; Chen, H.; Gao, J.; Li, Y.; Dave, K.; Chen, J.; Federici, M.; Perricone, G. Comparative Analysis of Non-Exhaust Airborne Particles from Electric and Internal Combustion Engine Vehicles. J. Hazard. Mater. 2021, 420, 126626. [Google Scholar] [CrossRef]
- Hooftman, N.; Oliveira, L.; Messagie, M.; Coosemans, T.; Van Mierlo, J. Environmental Analysis of Petrol, Diesel and Electric Passenger Cars in a Belgian Urban Setting. Energies 2016, 9, 84. [Google Scholar] [CrossRef]
- Jung, H. Fuel Economy of Plug-In Hybrid Electric and Hybrid Electric Vehicles: Effects of Vehicle Weight, Hybridization Ratio and Ambient Temperature. WEVJ 2020, 11, 31. [Google Scholar] [CrossRef]
- ACEA Making the Transition to Zero-Emission Mobility. 2022 Progress Report. Available online: https://www.acea.auto/publication/2022-progress-report-making-the-transition-to-zero-emission-mobility/ (accessed on 7 January 2024).
- Koupal, J.; DenBleyker, A.; Kishan, S.; Vedula, R.; Agudelo, C. Brake Wear Particulate Matter Emissions Modeling; Eastern Research Group: Boston, MA, USA, 2021. [Google Scholar]
- Dimopoulos Eggenschwiler, P.; Schreiber, D.; Habersatter, J. Brake Particle PN and PM Emissions of a Hybrid Light Duty Vehicle Measured on the Chassis Dynamometer. Atmosphere 2023, 14, 784. [Google Scholar] [CrossRef]
- Bondorf, L.; Köhler, L.; Grein, T.; Epple, F.; Philipps, F.; Aigner, M.; Schripp, T. Airborne Brake Wear Emissions from a Battery Electric Vehicle. Atmosphere 2023, 14, 488. [Google Scholar] [CrossRef]
- Men, Z.; Zhang, X.; Peng, J.; Zhang, J.; Fang, T.; Guo, Q.; Wei, N.; Zhang, Q.; Wang, T.; Wu, L.; et al. Determining Factors and Parameterization of Brake Wear Particle Emission. J. Hazard. Mater. 2022, 434, 128856. [Google Scholar] [CrossRef]
- Timmers, V.R.J.H.; Achten, P.A.J. Non-Exhaust PM Emissions from Battery Electric Vehicles. In Non-Exhaust Emissions; Elsevier: Amsterdam, The Netherlands, 2018; pp. 261–287. ISBN 978-0-12-811770-5. [Google Scholar]
- Maricq, M.M. Engine, Aftertreatment, Fuel Quality and Non-Tailpipe Achievements to Lower Gasoline Vehicle PM Emissions: Literature Review and Future Prospects. Sci. Total Environ. 2023, 866, 161225. [Google Scholar] [CrossRef]
- Kolbeck, K.; Schröder, T.; Schlichting, M.; Bacher, H. Evaluation of Different Influencing Parameters on the Result of Brake Particle Emission Measurements; EB2022-FBR-011. In Proceedings of the EuroBrake 2022, Online, 17–19 May 2022. [Google Scholar]
- European Commission; EEA Climate and Energy in the EU. Data. Country Comparison. 2023. Available online: https://climate-energy.eea.europa.eu/topics/transport/emissions-from-cars/data (accessed on 7 January 2024).
- OICA OICA Views on Brake Wear Particles. Presented at the PMP Webex, Online, 2021. Available online: https://wiki.unece.org/display/trans/pmp+web+conference+01.12.2021 (accessed on 7 January 2024).
- Thorpe, A.J.; Harrison, R.M.; Boulter, P.G.; McCrae, I.S. Estimation of Particle Resuspension Source Strength on a Major London Road. Atmos. Environ. 2007, 41, 8007–8020. [Google Scholar] [CrossRef]
- Abu-Allaban, M.; Gillies, J.A.; Gertler, A.W.; Clayton, R.; Proffitt, D. Tailpipe, Resuspended Road Dust, and Brake-Wear Emission Factors from on-Road Vehicles. Atmos. Environ. 2003, 37, 5283–5293. [Google Scholar] [CrossRef]
- Bukowiecki, N.; Lienemann, P.; Hill, M.; Furger, M.; Richard, A.; Amato, F.; Prévôt, A.S.H.; Baltensperger, U.; Buchmann, B.; Gehrig, R. PM10 Emission Factors for Non-Exhaust Particles Generated by Road Traffic in an Urban Street Canyon and along a Freeway in Switzerland. Atmos. Environ. 2010, 44, 2330–2340. [Google Scholar] [CrossRef]
- Amato, F.; Favez, O.; Pandolfi, M.; Alastuey, A.; Querol, X.; Moukhtar, S.; Bruge, B.; Verlhac, S.; Orza, J.A.G.; Bonnaire, N.; et al. Traffic Induced Particle Resuspension in Paris: Emission Factors and Source Contributions. Atmos. Environ. 2016, 129, 114–124. [Google Scholar] [CrossRef]
- Lawrence, S.; Sokhi, R.; Ravindra, K. Quantification of Vehicle Fleet PM 10 Particulate Matter Emission Factors from Exhaust and Non-Exhaust Sources Using Tunnel Measurement Techniques. Environ. Pollut. 2016, 210, 419–428. [Google Scholar] [CrossRef]
- Charron, A.; Polo-Rehn, L.; Besombes, J.-L.; Golly, B.; Buisson, C.; Chanut, H.; Marchand, N.; Guillaud, G.; Jaffrezo, J.-L. Identification and Quantification of Particulate Tracers of Exhaust and Non-Exhaust Vehicle Emissions. Atmos. Chem. Phys. 2019, 19, 5187–5207. [Google Scholar] [CrossRef]
- Zhang, J.; Peng, J.; Song, C.; Ma, C.; Men, Z.; Wu, J.; Wu, L.; Wang, T.; Zhang, X.; Tao, S.; et al. Vehicular Non-Exhaust Particulate Emissions in Chinese Megacities: Source Profiles, Real-World Emission Factors, and Inventories. Environ. Pollut. 2020, 266, 115268. [Google Scholar] [CrossRef]
- Hicks, W.; Beevers, S.; Tremper, A.H.; Stewart, G.; Priestman, M.; Kelly, F.J.; Lanoisellé, M.; Lowry, D.; Green, D.C. Quantification of Non-Exhaust Particulate Matter Traffic Emissions and the Impact of COVID-19 Lockdown at London Marylebone Road. Atmosphere 2021, 12, 190. [Google Scholar] [CrossRef]
- Beddows, D.C.S.; Harrison, R.M.; Gonet, T.; Maher, B.A.; Odling, N. Measurement of Road Traffic Brake and Tyre Dust Emissions Using Both Particle Composition and Size Distribution Data. Environ. Pollut. 2023, 331, 121830. [Google Scholar] [CrossRef]
- Liu, J.; Peng, J.; Men, Z.; Fang, T.; Zhang, J.; Du, Z.; Zhang, Q.; Wang, T.; Wu, L.; Mao, H. Brake Wear-Derived Particles: Single-Particle Mass Spectral Signatures and Real-World Emissions. Environ. Sci. Ecotechnology 2023, 15, 100240. [Google Scholar] [CrossRef]
- Hesse, D.; Hamatschek, C.; Feißel, T.; Sachse, H.; Augsburg, K.; Gramstat, S. Investigations on the Deposition Behaviour of Brake Wear Particles on the Wheel Surface; 2021-01–1301; SAE: Warrendale, PA, USA, 2021. [Google Scholar]
- EPA. Brake and Tire Wear Emissions from Onroad Vehicles in MOVES3. Report EPA-420-R-20-014, 2020. Available online: https://www.epa.gov/sites/default/files/2020-11/documents/420r20014.pdf (accessed on 7 January 2024).
- Agudelo, C. California Air Resources Board (CARB) Updates to Brake EMissions FACtors (EMFAC) Using Dynamometer Tests for Light-Duty Vehicles. In Proceedings of the 26th ETH Nanoparticles Conference, Zurich, Switzerland, 20–22 June 2023. [Google Scholar]
- NAEI Fleet Weighted Road Transport Emission Factors 2020. Available online: https://naei.beis.gov.uk/data/ef-transport (accessed on 7 January 2024).
- DCE—Danish Centre for Environment and Energy Non-Exhaust Emission Factors. Available online: https://envs.au.dk/fileadmin/envs/Emission_inventories/Emission_factors/Emf_internet__Non-ex-PM-HM.htm (accessed on 7 January 2024).
- PBL—Netherlands Environmental Assessment Agency Methods for Calculating the Emissions of Transport in the Netherlands. 2021. Available online: https://www.pbl.nl/en/publications/methods-for-calculating-the-emissions-of-transport-in-the-netherlands-2021 (accessed on 7 January 2024).
- Vasiljević, S.; Glišović, J.; Lukić, J.; Miloradović, D.; Stanojević, M.; Đorđević, M. Analysis of Parameters Influencing the Formation of Particles during the Braking Process: Experimental Approach. Atmosphere 2023, 14, 1618. [Google Scholar] [CrossRef]


| Year | Ref. | Type | Pad | Vehicle or Mass | PM10 mg/km/V | PM2.5 mg/km/V | PN × 109 #/km/V | Comments |
|---|---|---|---|---|---|---|---|---|
| 1983 | [29] | D | Asbestos | n/a | 7.8 | - | - | Dyno, urban |
| 2000 | [44] | D | SM × 5 | PCs | 3.1–5.2 | 2.1–3.5 | - | Estim. from pad life |
| 2000 | [44] | D + Drum | SM × 2 | PT | 7.5 | 5.5 | - | Estim. from pad life |
| 2002 | [45] | all | all | all | 7.0 | - | - | Estim. from 40% of wear rate |
| 2003 | [46] | D | LM | Mid PC | 8.2 mg/stop/B | - | - | Wind tunnel, urban driving |
| 2003 | [46] | D | SM | PT | 2.0 mg/stop/B | - | - | |
| 2003 | [46] | D | NAO | Large PC | 1.8 mg/stop/B | - | - | |
| 2004 | [32] | D | n/a | PC | 1.8 | Mass loss (Motorway) | ||
| 2004 | [32] | D + Drum | n/a | PC × 4 | 4.7–20.5 | Mass loss (Urban − Motorw.) | ||
| 2008 | [47] | n/a | NAO × 3 | 2000 | 5.8 mg/stop/V | - | n/a | Estimated from pad life |
| 2015 | [48] | D | NAO | PC | 0.67 | 0.53 | n/a | Dyno, JC08 cycle |
| and | and | D | NAO | PC | 1.38 | 1.00 | n/a | Dust monitor |
| 2016 | [49] | Drum | NAO | Mid PT | 0.16 | 0.11 | n/a | |
| 2017/18 | [14,50] | D | NAO | 1500 | 8.5–9.2 mg/stop/B | 1530/stop/B | Dyno, SAE J2707, ELPI | |
| 2017/20 | [36,50] | D | LM × 4 | 1500 | 13.7–46.4 mg/stop/B | 80–910/stop/B | Dyno, SAE J2707, ELPI | |
| 2019 | [51] | D + HMC | LM | Mid PC | 4.0–6.0 ** | - | 570–3700 ** | On road, LACT, DustTrak |
| 2019 | [52] | D + HMC | proto | 1600 | - | - | 10 | Chassis, LACT, CS + CPC10 |
| 2019 | [53] | D | n/a | Van 2286 | - | - | 5–20 | On-road, PEMS23 |
| 2021 | [54] | D | n/a | 1840 | - | - | 33 | Dyno, WLTP-B, ELPI |
| 2020 | [55] | D | LM | n/a | 1.9–3.1 | - | - | Dyno, WLTP-E, OPC |
| 2020 | [55] | D | NM | n/a | 0.2–2.3 | - | - | Dyno, WLTP-E, OPC |
| 2021 | [56] | D | LM | n/a | 7–21 | - | 7–30 | Dyno, WLTP-E, ELPI |
| 2021 | [56] | D | NM | n/a | 1.5–5.0 | - | 23–47 | Dyno, WLTP-E, ELPI |
| 2021 | [57] | D | LM | Mid PC | 7.4 | - | - | Dyno, WLTP-E |
| 2022 | [58] | D | LM | 1300 * | 17.1 ** | 6.3 | - | Dyno, WLTP-E, APS |
| 2022 | [58] | D | NAO | 1300 * | 3.3 ** | 2.3 | - | Dyno, WLTP-E, APS |
| 2022 | [41] | D | LM | 1400 * | 7.0 | - | - | Dyno, WLTP-B, ELPI |
| 2022 | [59] | D | ECE | 2310 | 2.5–4.5 | - | 5.6–14 | On road, chassis, ELPI |
| 2023 | [60] | D | ECE | 1800 | 10.2 ** | 3.1 ** | 37 ** | On road RDE, PM, CPC |
| 2023 | [61] | D | SM | n/a | 9.3–15.3 | 2.0–3.5 | - | Dyno, RDE braking, PM |
| 2023 | [61] | D | Ceramic | n/a | 3.1 | 0.7 | - | Dyno, RDE braking, PM |
| Year | Ref. | Axle | Type | Pad | Mass kg | PM10 mg/km/B | PM2.5 mg/km/B | PN × 109 #/km/B | Comments |
|---|---|---|---|---|---|---|---|---|---|
| 2019 | [62] | F | D | LM | 1500 | 4.6 | - | 4.9 | Mid-sized, LACT cycle |
| 2019 | [63] | F | D | ECE | 1500 | 4.5 | 1.5 | 1.5 | Mid-sized |
| 2019 | [64] | F | D | ECE | 1200 | 2.5 * | 1.2 * | 0.8 * | City car |
| 2019 | [64] | F | D | NAO | 1200 | 1.2 * | 0.7 * | 0.5 * | City car |
| 2019 | [64] | F | D | NAO | 1200 | 0.4 * | 0.2 * | 0.1 * | City car |
| 2020 | [65] | F | D | ECE | 1750 | 7.6 | 2.5 | 4.5 | Also [66] |
| 2020 | [65] | F | D | ECE | 2150 | 12.2 | 4.8 | 8.7 | |
| 2020 | [67] | F | D | NAO | 2500 | 1.2 | 0.5 | 1.1 | Pick-up truck (8% payload) |
| 2020 | [67] | F | D | NAO | 2500 | 0.7 | 0.4 | 0.6 | Pick-up truck (8% payload) |
| 2020 | [67] | F | D | NAO | 2950 | 0.8 | 0.5 | 0.8 | Pick-up truck (67% payload) |
| 2020 | [67] | F | D | LM | 2500 | 4.3 | 1.5 | 2.9 | Pick-up truck (8% payload) |
| 2020 | [67] | F | D | LM | 2950 | 7.1 | 2.1 | 3.2 | Pick-up truck (67% payload) |
| 2020 | [67] | F | D | NAO | 2182 | 2.2 * | 1.0 * | - | Mini van |
| 2020 | [67] | F | D | NAO | 1651 | 2.0 * | 0.9 * | - | Class C |
| 2020 | [67] | F | D | NAO | 1655 | 1.8 | 0.6 | 1.2 | Class C |
| 2020 | [67] | F | D | NAO | 1655 | 1.2 | 0.4 | 1.0 | Class C |
| 2020 | [67] | F | D | LM | 1655 | 2.3 | 0.7 | 2.4 | Class C |
| 2020 | [67] | F | D | NAO | 1347 | 3.2 | 1.3 | - | Compact |
| 2020 | [68] | F | D | ECE | n/a | - | - | 3.1 | |
| 2020 | [68] | F | D | NAO | n/a | - | - | 0.8 | |
| 2021 | [23] | F | D | NAO | 2000 | 0.1 | 0.05 | - | |
| 2021 | [69,70] | F | D | ECE | (1700) | 8.5 | 4.5 | 3.5 | Medium sedan |
| 2021 | [69,70] | F | CC | ECEopt | (1700) | 2.2 | 1.1 | 1.5 | Medium sedan |
| 2021 | [71] | F | D | LM | 2250 | 4.7 | 2.4 | 1.0 | Class J |
| 2021 | [71] | F | HMC | LM | 2250 | 2.1 | 1.2 | 1.3 | Class J |
| 2021 | [71] | F | CC | LM | 2250 | 1.4 | 0.9 | 0.8 | Class J |
| 2021 | [71] | F | D | LM | 2250 | 12.4 | 6.0 | 4.6 | Class J |
| 2021 | [71] | F | HMC | LM | 2250 | 3.4 | 1.8 | 0.5 | Class J |
| 2021 | [71] | F | CC | LM | 2250 | 1.2 | 0.8 | 0.6 | Class J |
| 2022 | [72] | F | D | ECE | 1800 | 4.5 | 1.45 | 3.4 | Luxury sedan |
| 2022 | [25] | F | D | LM | 2000 | 4.2 | 2.1 | ||
| 2022 | [25] | F | D | NAO | 2000 | 1.2 | 0.5 | - | |
| 2023 | [10,73] | F | D | ECE | 1600 | 6.0 | 2.0 | 2.2 | Class C |
| 2023 | [10,73] | F | D | NAO | 1600 | 2.3 | 0.7 | 1.0 | Class C (as above) |
| 2023 | [10,73] | F | D | ECE | 1668 | 10.7 | 3.8 | 8.6 | Class J |
| 2023 | [10,73] | F | D | ECE | 2623 | 9.1 | 3.1 | 3.3 | SUV |
| 2023 | [10,73] | R | Drum | n/a | 1253 | 0.5 | 0.3 | 1.7 | Super mini |
| 2023 | [10,73] | F | D | ECE | 2500 | 7.7 | 3.0 | 5.8 | LCV (28% payload) |
| 2023 | [10,73] | F | D | ECE | 3390 | 9.4 | 4.0 | 11.1 | LCV (90% payload) |
| 2023 | [28] | F | D | LM | 1660 | 5.3 | 2.8 | 4.3 | Class C |
| 2023 | [28] | F | D | NAO | 1660 | 3.9 | 2.2 | 1.8 | Class C |
| 2023 | [28] | R | D | ECE | 1660 | 1.5 | 0.9 | 5.1 | Class C |
| 2023 | [28] | R | Drum | (LM) | 2041 | 1.1 | 0.8 | 2.8 | Class C |
| 2023 | [28] | R | Drum | (LM) | 2041 | 0.7 | 0.6 | 1.1 | Class C |
| 2023 | [28] | R | Drum | (NAO) | 2041 | 0.3 | 0.3 | 0.5 | Class C |
| 2023 | [28] | F | D | ECE | 2113 | 7.6 | 3.5 | 3.9 | Class J |
| 2023 | [28] | F | HMC | ECEopt | 2113 | 1.6 | 1.0 | 1.4 | Class J |
| 2023 | [60] | F | D | ECE | 2027 | 4.1 | 1.2 | 2.1 | Luxury sedan |
| 2023 | [74] | F | D | ECE | 1840 | 6.5 | 1.8 | 0.5 | Japanese market |
| 2023 | [75] | F | D | LM | 1820 | 2.3 | - | - | Corrected with ×0.7/2 |
| 2023 | [75] | F | D | NAO | 1820 | 1.1 | - | - | Corrected with ×0.7/2 |
| 2023 | [75] | F | D | LM | 2250 | 1.3 | - | - | Corrected with ×0.7/2 |
| 2023 | [75] | F | D | HMC | 2250 | 0.5 | - | - | Corrected with ×0.7/2 |
| 2023 | [76] | F | D | ECE | 1500 | 7.3 | - | - | Segment D |
| 2023 | [76] | F | D | ECE | 1250 | 5.4 | - | - | Segment B |
| 2023 | [76] | F | D | ECE | 1200 | 6.9 | - | - | Segment B |
| 2023 | [76] | F | D | ECE | 1250 | 5.1 | - | - | Segment B |
| 2023 | [61] | F | D | (SM) | n/a | 5.7 | 1.2 | - | Average of two |
| 2023 | [61] | F | D | Ceramic | n/a | 3.2 | 0.8 | - | Estimated from figure |
| 2023 | [77] | F | D | ECE | 1240 | 3.7 | 1.3 | - | - |
| 2023 | [77] | F | D | NAO | 1240 | 1.4 | 0.6 | - | - |
| 2023 | [78] | F | D | NAO | 1533 | 0.8 | 0.2 | 0.1 | - |
| Year | Ref. | Airborne/Mass Loss | PM10/Mass Loss | Comment |
|---|---|---|---|---|
| 1973 | - | 2–22% | - | Cited in [29] |
| 1980 | - | 55% | - | Cited in [29] |
| 1983 | [29] | 32% | - | - |
| 2000 | [44] | 16–35% * | 14–30% | 86% from airborne |
| 2003 | [46] | 50% | 40% | 80% from airborne |
| 2008 | [47] | 63% | 60–62% | 95–98% from airborne |
| 2016 | [49] | 2–29% | - | |
| 2017 | [50] | 35–58% | - | |
| 2019 | [63] | - | 57% | Based on recovered deposited mass |
| 2020 | [36] | 37% | - | |
| 2020 | [67] | <10% | - | |
| 2019 | [62] | 49% | - | |
| 2021 | [71] | - | 24–51% | 30–40% with CC and HMC |
| 2022 | [25] | - | 28% | Both LM and NAO |
| 2023 | [10] | - | 35–48% | 21% for Drum |
| 2023 | [28] | - | 40% | |
| 2023 | [76] | - | 48–57% | |
| 2023 | [61] | - | 66% | Six SM and ceramic pads |
| 2023 | [77] | - | 35–40% | Both ECE and NAO |
| 2023 | [78] | - | 25% | NAO |
| Year | Ref. | PM10 | PM2.5 | PN | Comment |
|---|---|---|---|---|---|
| 2003 | [46] | 78% | - | - | - |
| 2018 | [14] | 65% | - | - | - |
| 2019 | [64] | 52–84% | 42–83% | 40–88% | 2 × NAO |
| 2020 | [67] | 84–89% | 73–76% | 75–79% | Pickup truck |
| 2020 | [67] | 22–48% | 14–43% | 50–58% | 2 × NAO |
| 2020 | [68] | - | - | 75% | - |
| 2021 | [69] | - | - | 75% | - |
| 2022 | [58] | 80% | 64% | - | - |
| 2022 | [25] | 72–77% | 64–78% | - | 3 cycles |
| 2023 | [10,73] | 62% | 65% | 55% | - |
| 2023 | [28] | 26% | 22% | 58% | - |
| 2023 | [75] | 55% | - | - | - |
| 2023 | [81] | - | - | 64% | - |
| 2023 | [77] | 62% | 55% | - | - |
| Year | Ref. | Wear | PM10 | PM2.5 | PN | Comment |
|---|---|---|---|---|---|---|
| 2017 | [84] | 43–72% | 38–57% | 44–67% | HMC 1 | |
| 2019 | [18] | 32% | - | - | - | HMC 2 |
| 2020 | [85] | 56% | - | - | - | HMC 3 |
| 2020 | [17] | 21% | - | - | 57% | HMC 4 |
| 2021 | [16] | 78–84% | 94% * | - | 83–91% | CC |
| 2021 | [69] | - | 74% | 76% | 57% | CC (+opt. pad) |
| 2021 | [71] | - | 55% | 50% | (30% incr.) | HMC 5 |
| 2021 | [71] | - | 70% | 63% | 10% | CC |
| 2021 | [71] | - | 73% | 70% | 89% | HMC 5 |
| 2021 | [71] | - | 90% | 87% | 87% | CC |
| 2023 | [28] | - | 79% | 71% | 64% | CC |
| 2023 | [75] | 63% | - | - | HMC |
| Year | Ref. | PM | PN | Comments | |
|---|---|---|---|---|---|
| 2016 | [86] | 92% | - | Passive | At ventilated disc |
| 2020 | [87] | 68–95% | 50–90% | Active | Grooved pad. 84% at WLTP-B |
| 2020 | [88] | 75% | 40–50% | Active | Grooved pad. Negligible improvement with passive |
| 2021 | [89] | 20–39% | - | Passive | Can increase with smaller gap to the disc |
| 2022 | [90] | 53% | - | Passive | Ceramic filter porosity 52% |
| 2022 | [91] | - | 50–80% | Passive | Inertial separator. Above 2.2 μm. WLTP-B |
| 2022 | [91] | 60–75% | >50% | Passive | Inertial separator and ESP. Above 0.5 μm. WLTP-B |
| 2023 | [92] | 61% | - | Active | WLTP-B. Collection efficiency 80% with continuous sampling |
| 2023 | [76] | 77% | - | Active | WLTP-B. Collection efficiency 84% with continuous sampling |
| Category | PCs Share | PCs Activity | LCVs Share | LCVs Activity | Regenerative Braking |
|---|---|---|---|---|---|
| Petrol | 53.0% | 37.5% | 7.7% | 3.2% | 0% |
| Diesel | 41.1% | 57.2% | 90.5% | 95.3% | 0% |
| HEV | 1.5% | 2.0% | 0.3% | 0.4% | 10–48% |
| PHEV | 0.4% | 0.6% | 0.1% | 0.1% | 66% |
| BEV | 0.4% | 0.6% | 0.3% | 0.3% | 83% |
| other | 3.6% | 2.0 | 1.2% | 0.7% | 0% |
| Year | Ref. | Type | Pad | Vehicle or Mass | PM10 mg/km/V | PM2.5 mg/km/V | PN × 109 #/km/V | Comments |
|---|---|---|---|---|---|---|---|---|
| 2020 | [67] | Disc | NAO | 1600 | 2.0–2.3 | 1.0–1.4 | 1.3–8.9 | PHEV |
| 2021 | [100] | Disc | n/a | (1800) | 0.9 | - | - | BEV |
| 2023 | [28] | Disc | ECE | 1660 | 5.7 (−62%) | 3.4 (−57%) | 7.3 (−40%) | PHEV |
| 2023 | [28] | Disc | ECE | 1660 | 3.1 (−79%) | 2.3 (−71%) | 2.1 (−82%) | BEV |
| 2023 | [101] | Disc | ECE | 1350 | 10.5 | 4.5 | 141 | HEV, Chassis, WLTP-E |
| 2023 | [102] | Disc | ECE | 1228 | - | - | 0.5 * (−4%) | Chassis, WLTP-B |
| 2023 | [102] | Disc | ECE | 1228 | - | - | 0.5 * (−65%) | Chassis, WLTP-E |
| 2023 | [102] | Disc | ECE | 1228 | - | - | 4 * (<90%) | Chassis, RDE |
| 2023 | [78] | Disc | NAO | 1533 | 0.3 (−86%) | 0.14 (−78%) | 0.05 (−84%) | PHEV, WLTP-B ** |
| Category | Mass kg | PM10 mg/km/B | PM2.5 mg/km/B | PN × 109 #/km/B | Comment |
|---|---|---|---|---|---|
| ECE (all) | 1902 | 6.0 | 2.5 | 3.9 | Average Table 2 |
| ECE (PCs) | 1752 | 5.8 | 2.5 | 3.5 | Average Table 2 |
| ECE (LCVs) | 2838 | 7.1 | 2.7 | 5.6 | Average Table 2 |
| ECE | 1525 | 4.7 | 1.9 | 3.2 | Based on Figure 2 |
| ECE (N1-III) | 1760 | 5.5 | 2.2 | 3.7 | Based on Figure 2 |
| ECE (N1-III) | 2250 | 7.0 | 2.9 | 4.7 | Based on Figure 2 |
| NAO | 1807 | 1.7 | 0.8 | 0.7 | Average Table 2 |
| CC and HMC | 2152 | 1.8 | 1.1 | 1.0 | Average Table 2 |
| Drum | 1844 | 0.7 | 0.5 | 1.5 | Average Table 2 |
| Scenario | Mass kg | PM10 mg/km/V | PM2.5 mg/km/V | PN #/km/V | Comments |
|---|---|---|---|---|---|
| ECE | 1525 | 13.4 | 5.5 | 9.1 | EFB,ECE × 2.83 |
| ECE | 1760 | 15.4 | 6.3 | 10.5 | EFB,ECE × 2.83 |
| ECE | 2250 | 19.7 | 8.1 | 13.4 | EFB,ECE × 2.83 |
| ECE + Drum | 1760 | 12.2 | 5.5 | 10.5 | 2 × EFB,ECE + 2 × EFB,Drum |
| ECE + Drum | 2250 | 15.3 | 6.7 | 12.5 | 2 × EFB,ECE + 2 × EFB,Drum |
| NAO | all | 4.7 | 2.2 | 2.1 | EFB,NAO × 2.83 |
| NAO | 1525–2250 | 5.4–7.9 | 2.5–3.6 | 4.1–6.0 | −60% from ECE |
| CC/HMC + NAO | all | 6.9 | 3.8 | 3.5 | 2 × EFB,CC + 2 × EFB,NAO |
| Electrification share in fleet 2020 | |||||
| PC | 1525 | 13.1 | 5.4 | 8.9 | Fleet activity Table 7 |
| LCV | 2250 | 19.6 | 8.0 | 13.4 | Fleet activity Table 7 |
| Year | Ref. | PM10 mg/km/V | PM2.5 mg/km/V | Comments |
|---|---|---|---|---|
| 2003 | [110] | 0–80 | 0–5 | Freeway exits, North Carolina, USA |
| 2004 | [32] | 6.9 | - | Tunnel London, UK (13% HDV, incl. tire wear) |
| 2010 | [111] | 8.0 | - | Urban, Zurich, CH (9% vans) |
| 2010 | [111] | 1.6 | - | Interurban freeway, Zurich, CH (15% vans) |
| 2016 | [112] | 1.6–6 | Urban and ring road, Paris, France | |
| 2016 | [113] | 3.8–4.4 | - | Tunnel, London, UK (8% HDVs) |
| 2019 | [114] | 9.2 | - | Grenoble, France (PC and HDV) |
| 2020 | [115] | 0.3–1.0 | 0.1–0.5 | Tunnels in four cities, China |
| 2021 | [116] | 12.9 | - | Urban, London, UK (3.2% HDV) |
| 2023 | [117] | 4.4–7.4 | - | Birmingham, UK (3% HDV) |
| 2023 | [118] | - | 0.28 | Urban tunnel, Tianjin, China (gasoline) |
| Year | Ref. | PM10 | PM2.5 | Source |
|---|---|---|---|---|
| 2022 | [9] | 12 | 4.8 | EEA, COPERT (PC ICE) |
| 2022 | 9.5 | 3.8 | EEA, COPERT (PC HEV) | |
| 2022 | 6.5 | 2.6 | EEA, COPERT (PC PHEV) | |
| 2022 | 3.3 | 1.3 | EEA, COPERT (PC BEV) | |
| 2022 | 12 | 4.8 | EEA, COPERT (LCV N1-I) | |
| 2022 | 17 | 6.7 | EEA, COPERT (LCV N1-II/III) | |
| 2020 | [122] | 8.4 | 3.3 | NAEI UK (PC) |
| 2020 | 13.1 | 5.7 | NAEI UK (LCV) | |
| 2020 | [95] | 6.2 | 2.4 | Australia, COPERT Australia (ICE) |
| 2020 | 4.3 | 1.6 | Australia, COPERT Australia (BEV) | |
| 2020 | [120] | 13.8 | 1.7 | US EPA, MOVES3 (PC) |
| 2020 | 15.3 | 1.9 | US EPA, MOVES3 (LCV) | |
| 2021 | [121] | 3–10 | 1–3 | CARB, EMFAC (PC) |
| 2021 | 14 | 4.5 | CARB, EMFAC (LCV) | |
| 2021 | [123] | 9.1 | 3.6 | DCE, CORPEM (PC) |
| 2021 | [124] | 10 | - | PBL NL (PC) |
Disclaimer/Publisher’s Note: The statements, opinions and data contained in all publications are solely those of the individual author(s) and contributor(s) and not of MDPI and/or the editor(s). MDPI and/or the editor(s) disclaim responsibility for any injury to people or property resulting from any ideas, methods, instructions or products referred to in the content. |
© 2024 by the authors. Licensee MDPI, Basel, Switzerland. This article is an open access article distributed under the terms and conditions of the Creative Commons Attribution (CC BY) license (https://creativecommons.org/licenses/by/4.0/).
Share and Cite
Giechaskiel, B.; Grigoratos, T.; Dilara, P.; Karageorgiou, T.; Ntziachristos, L.; Samaras, Z. Light-Duty Vehicle Brake Emission Factors. Atmosphere 2024, 15, 97. https://doi.org/10.3390/atmos15010097
Giechaskiel B, Grigoratos T, Dilara P, Karageorgiou T, Ntziachristos L, Samaras Z. Light-Duty Vehicle Brake Emission Factors. Atmosphere. 2024; 15(1):97. https://doi.org/10.3390/atmos15010097
Chicago/Turabian StyleGiechaskiel, Barouch, Theodoros Grigoratos, Panagiota Dilara, Traianos Karageorgiou, Leonidas Ntziachristos, and Zissis Samaras. 2024. "Light-Duty Vehicle Brake Emission Factors" Atmosphere 15, no. 1: 97. https://doi.org/10.3390/atmos15010097