

Retrieval of Aerosol Optical Depth and FMF over East Asia from Directional Intensity and Polarization Measurements of PARASOL
Abstract
:1. Introduction
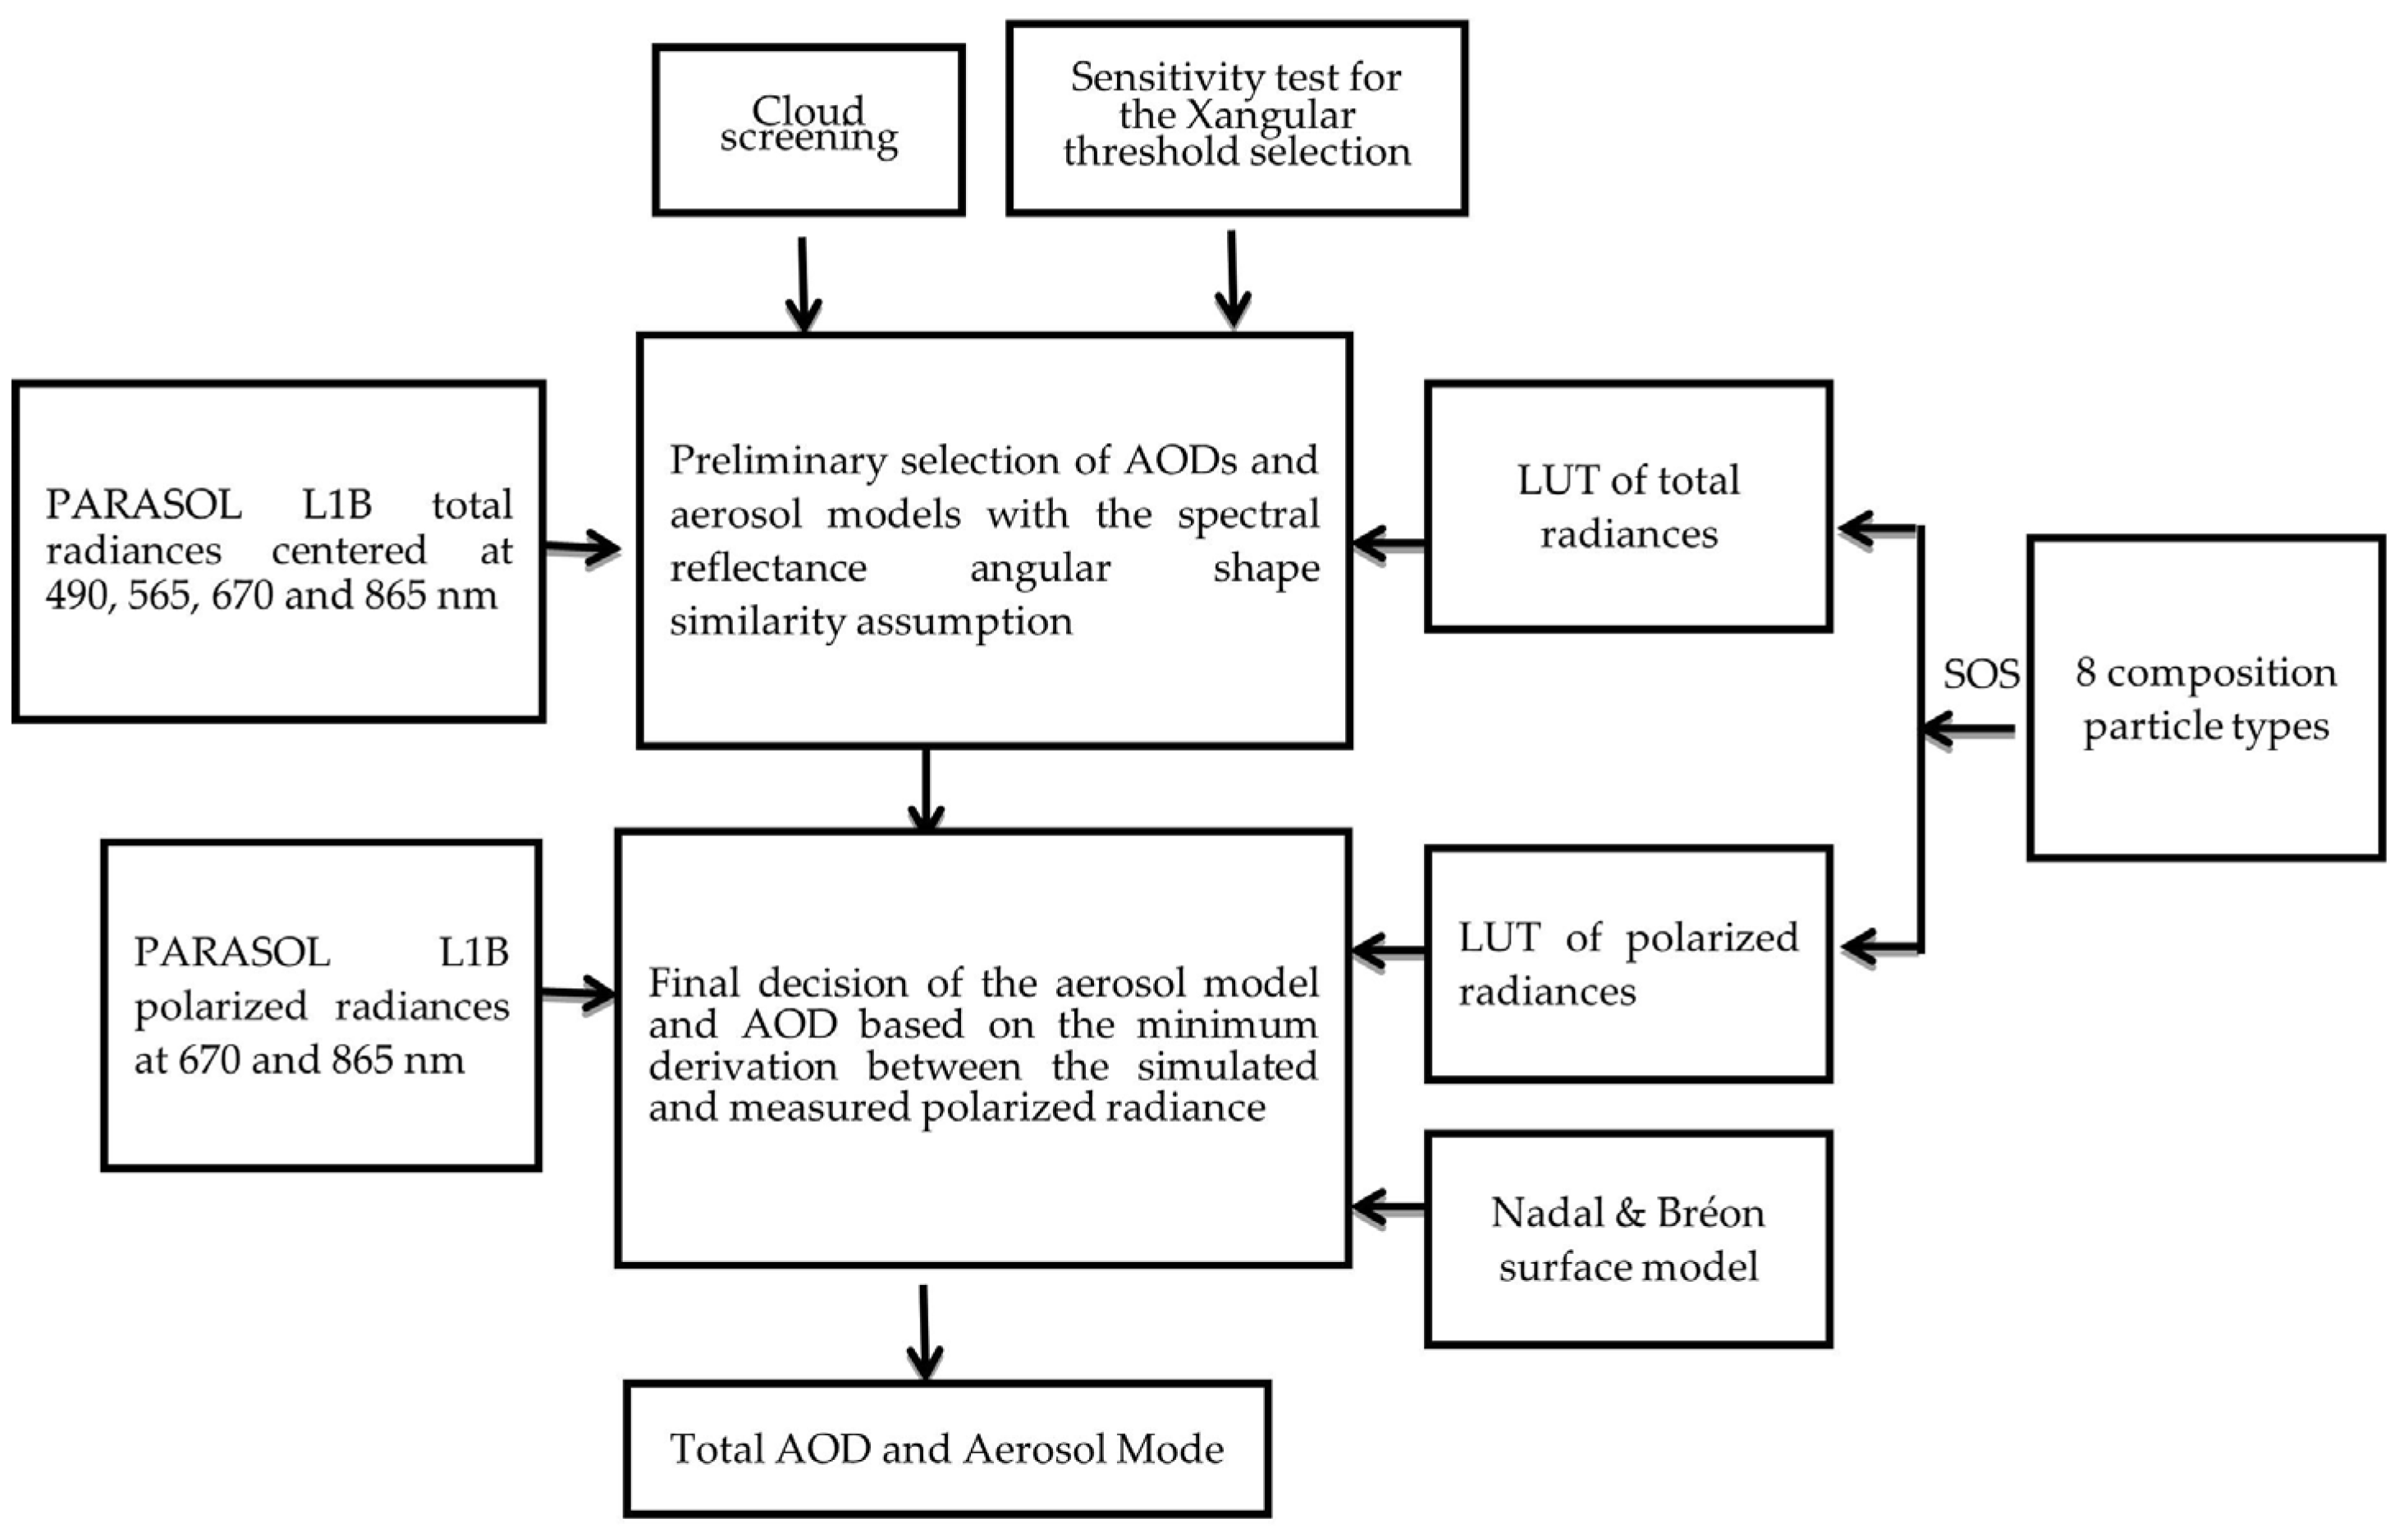
2. Methodology
2.1. Retrieval Algorithm
2.2. Aerosol Models and the Construction of LUT
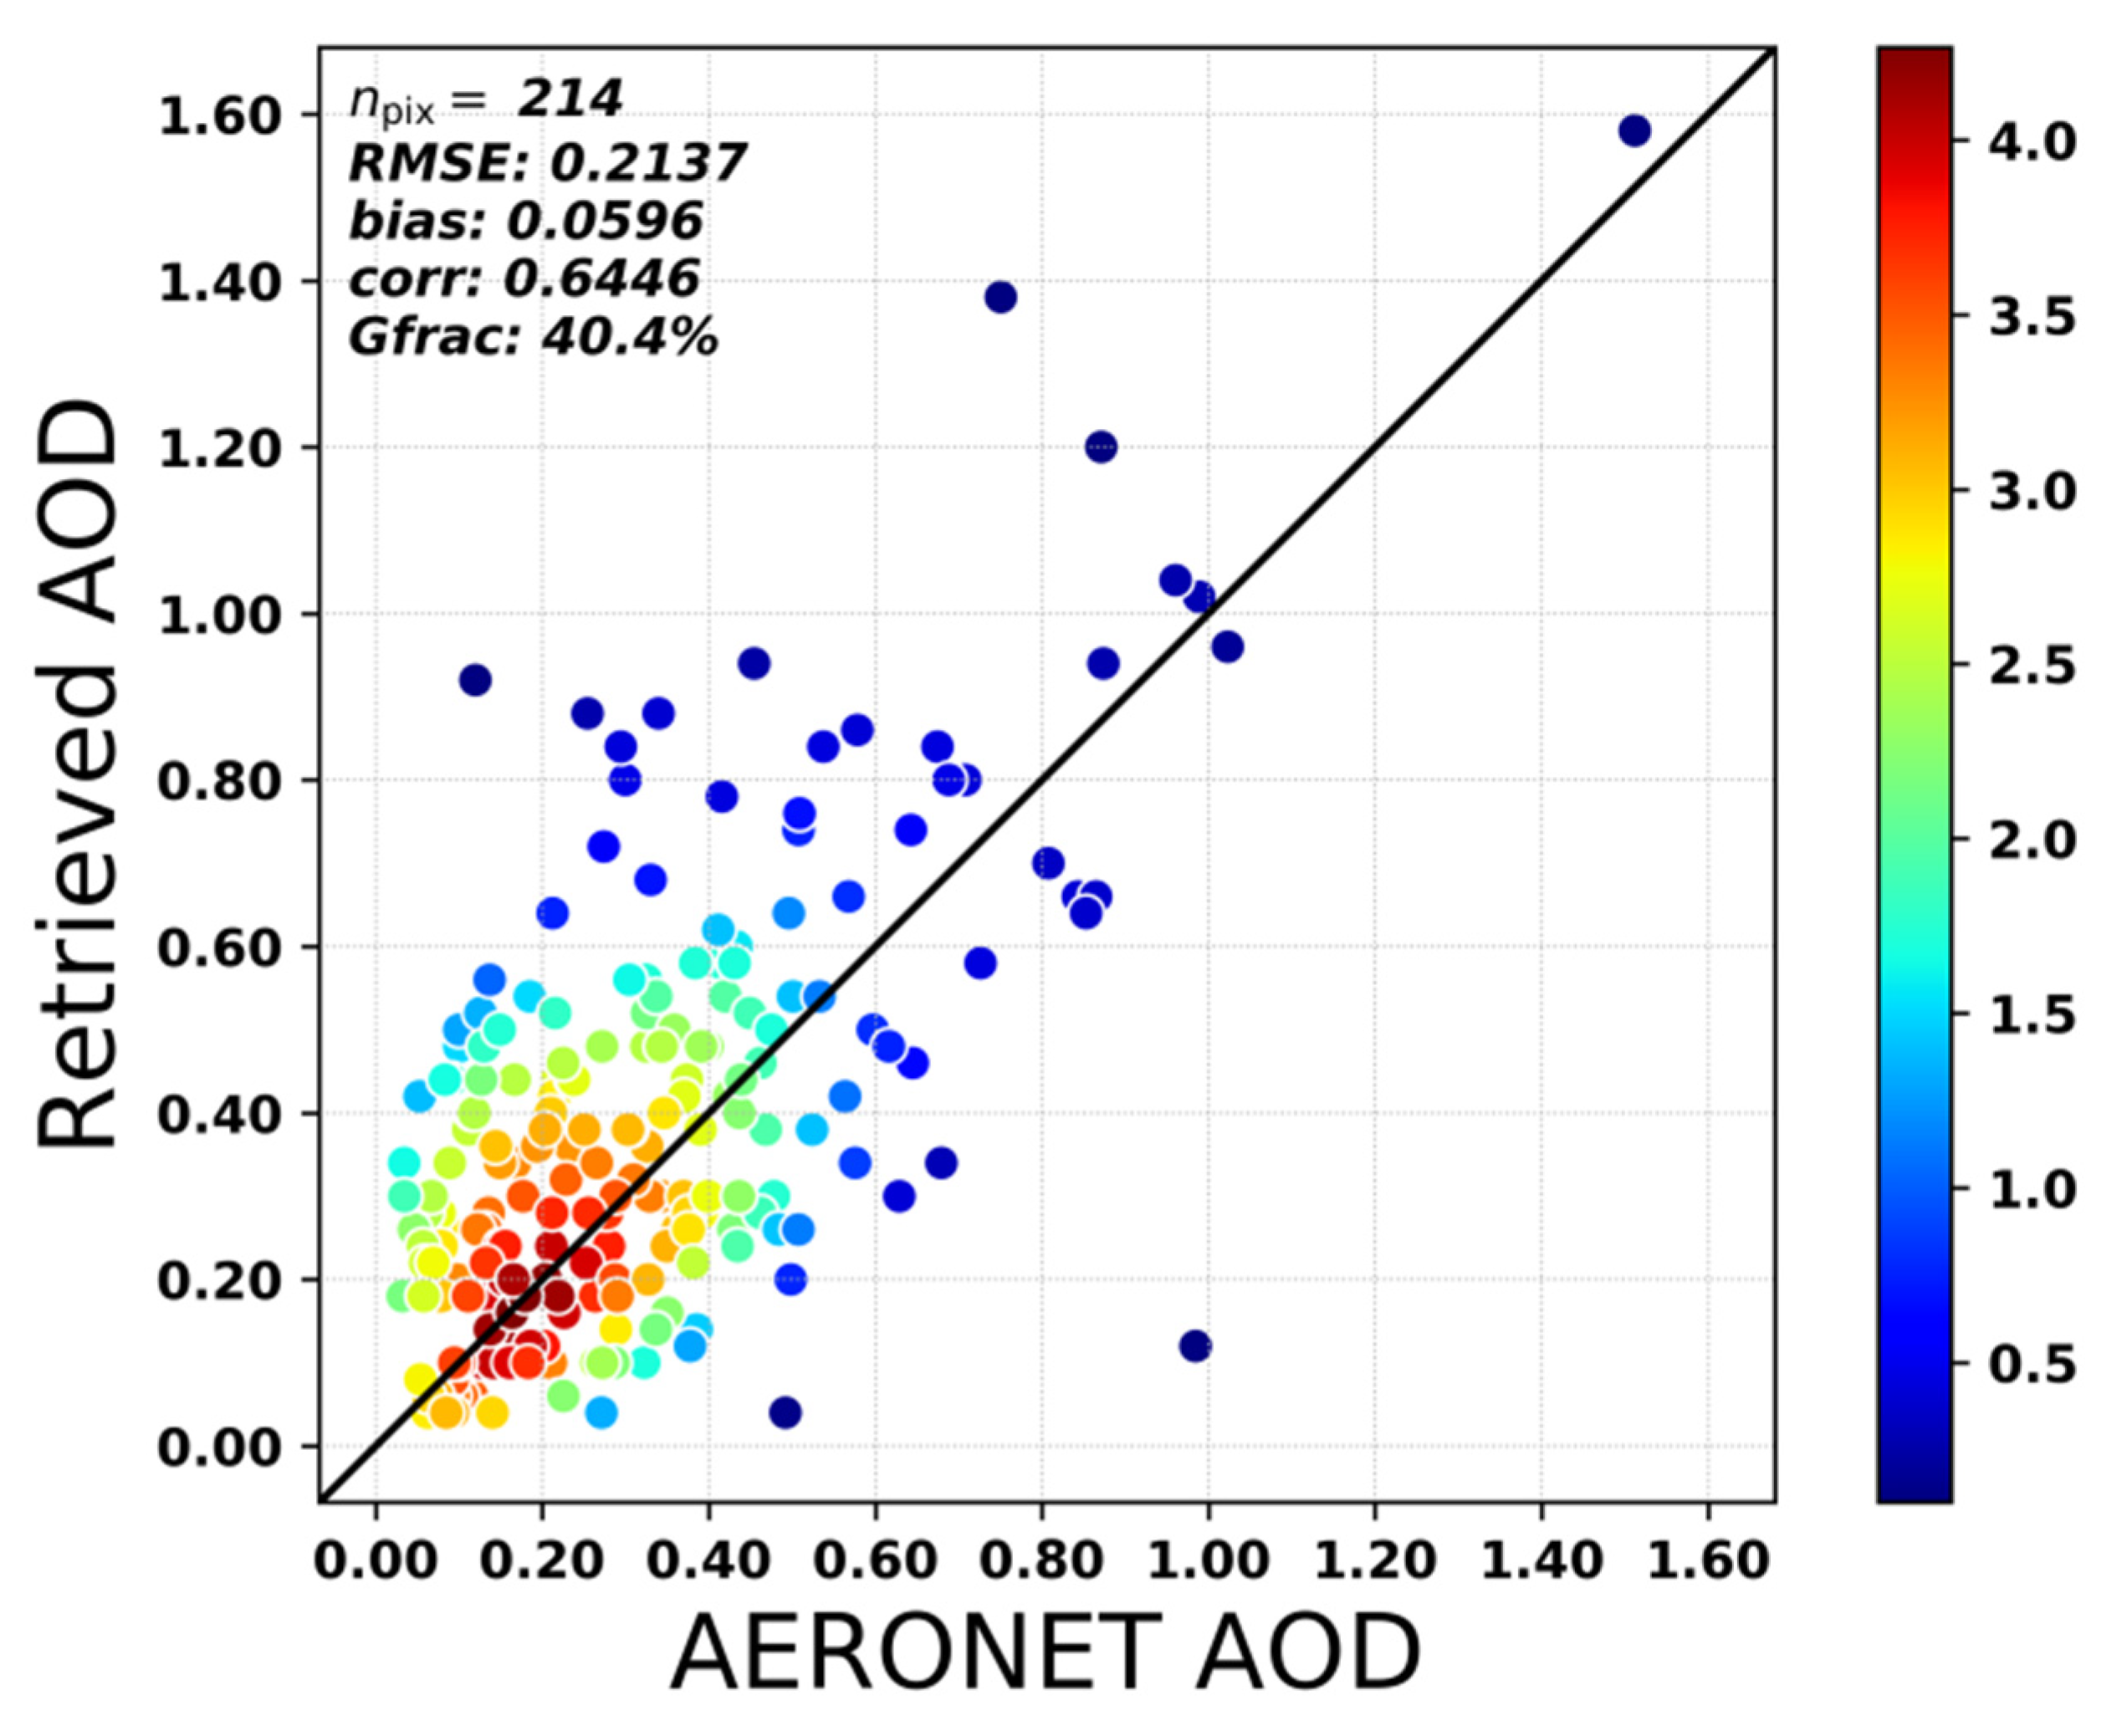
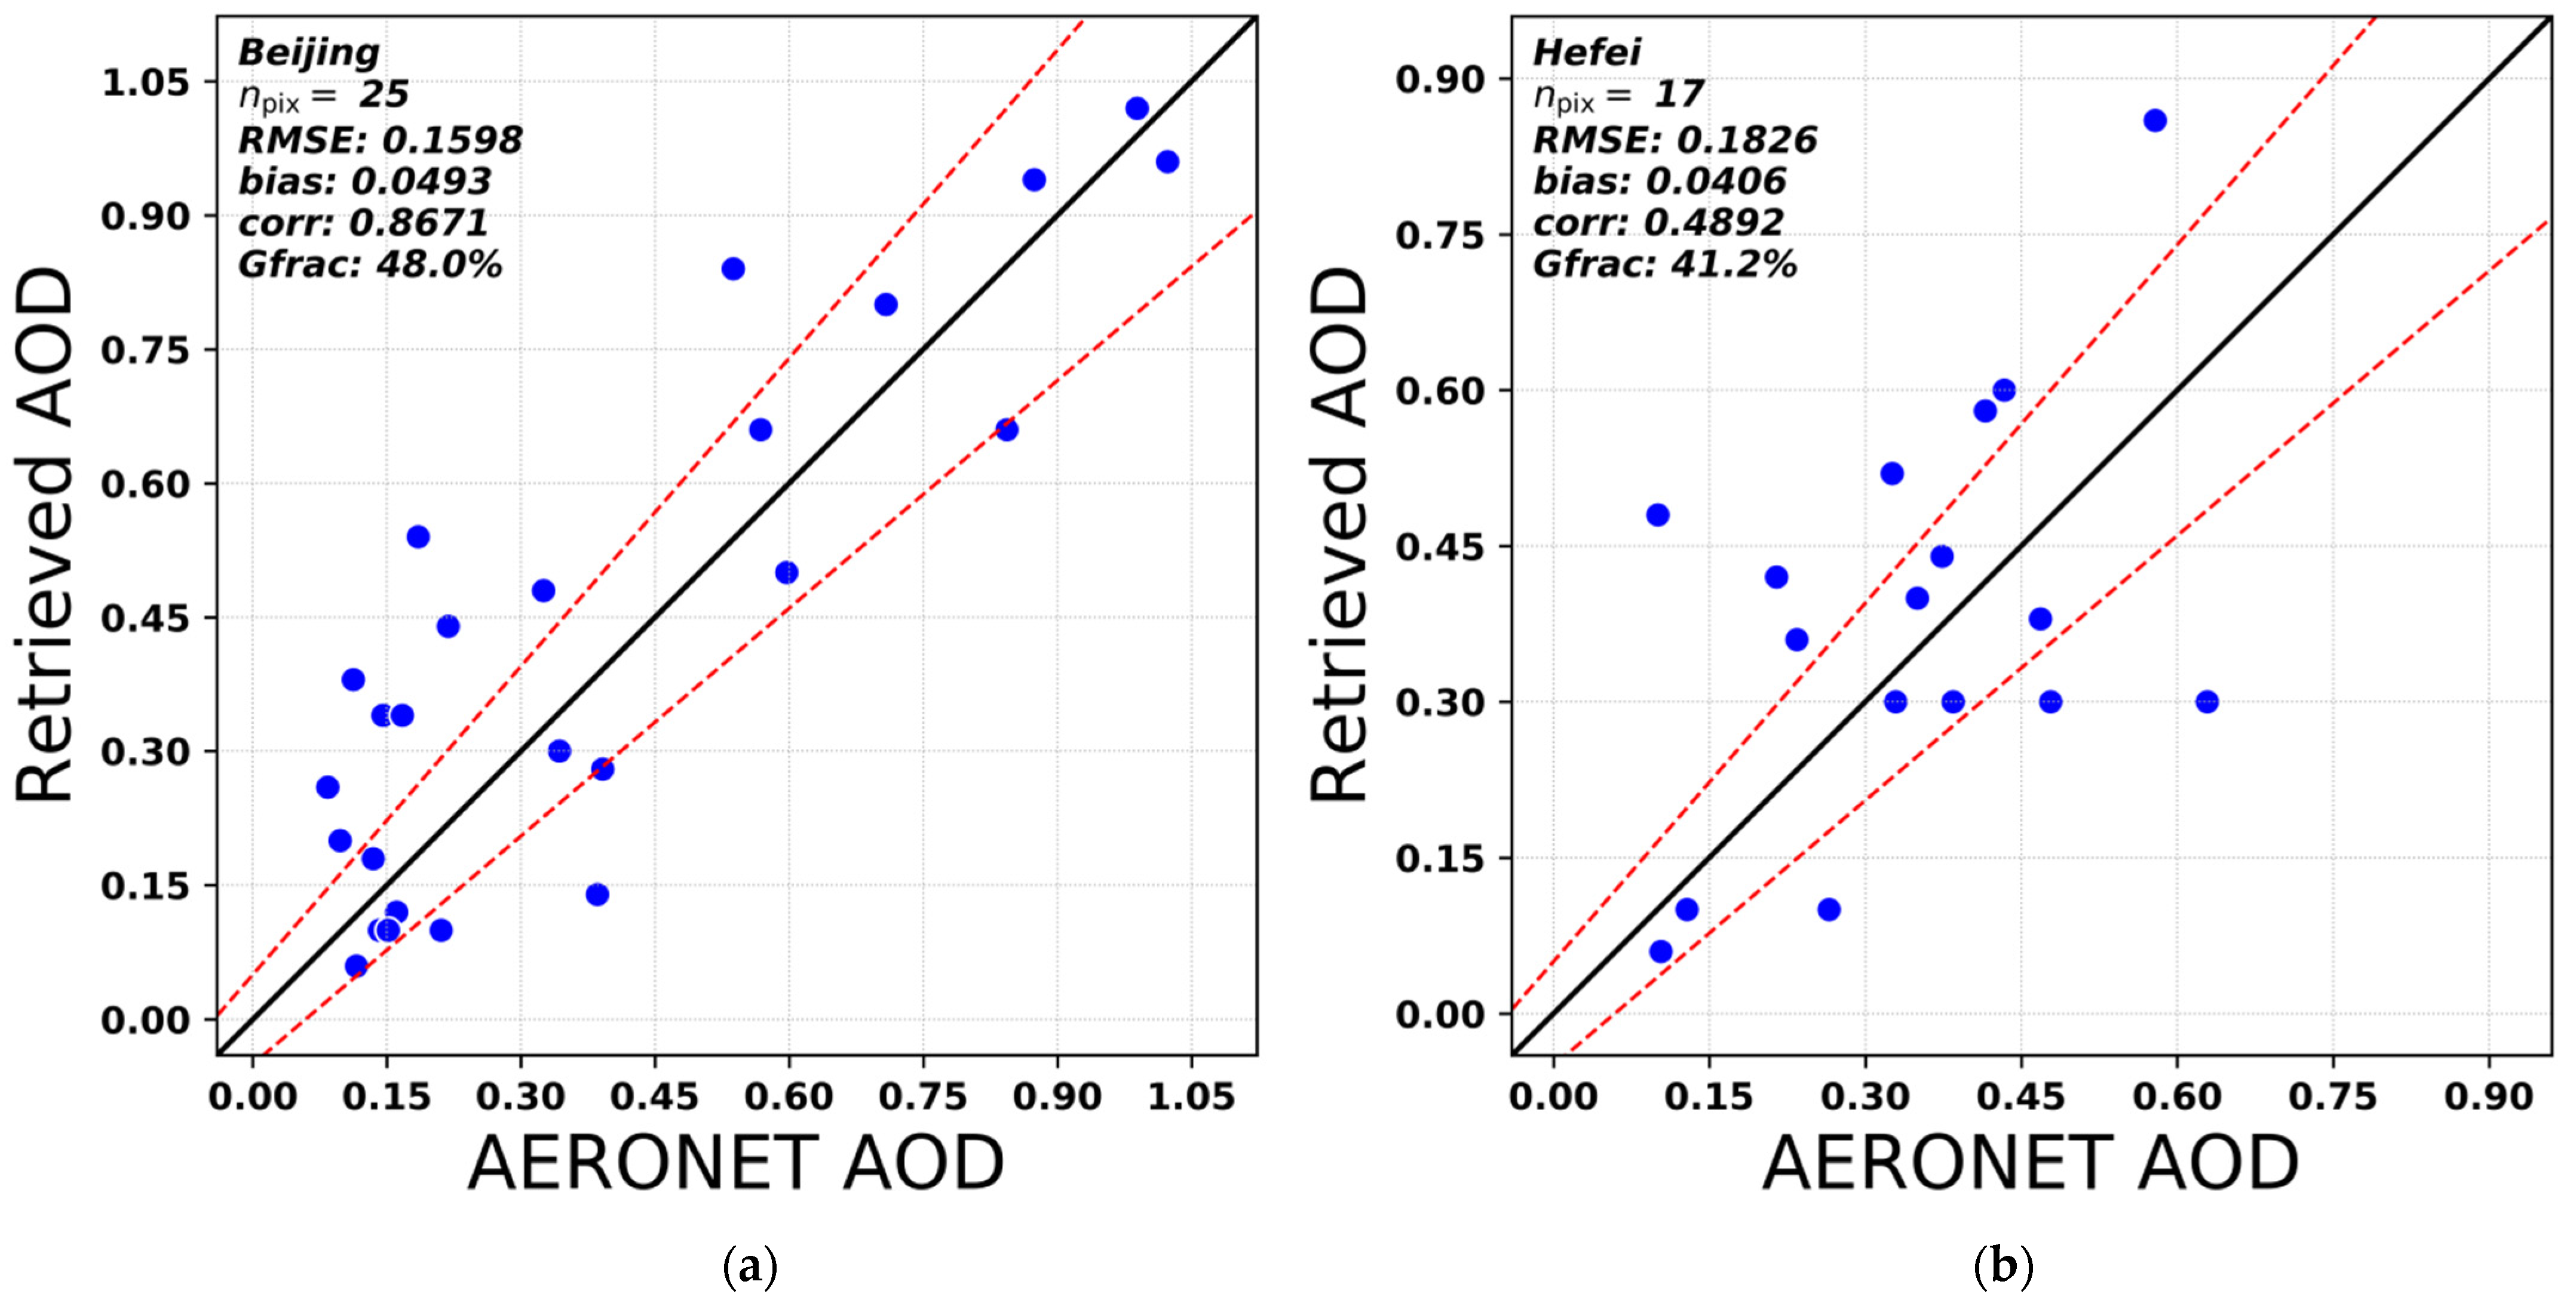
3. Validation and Case Studies
3.1. Validation against AERONET
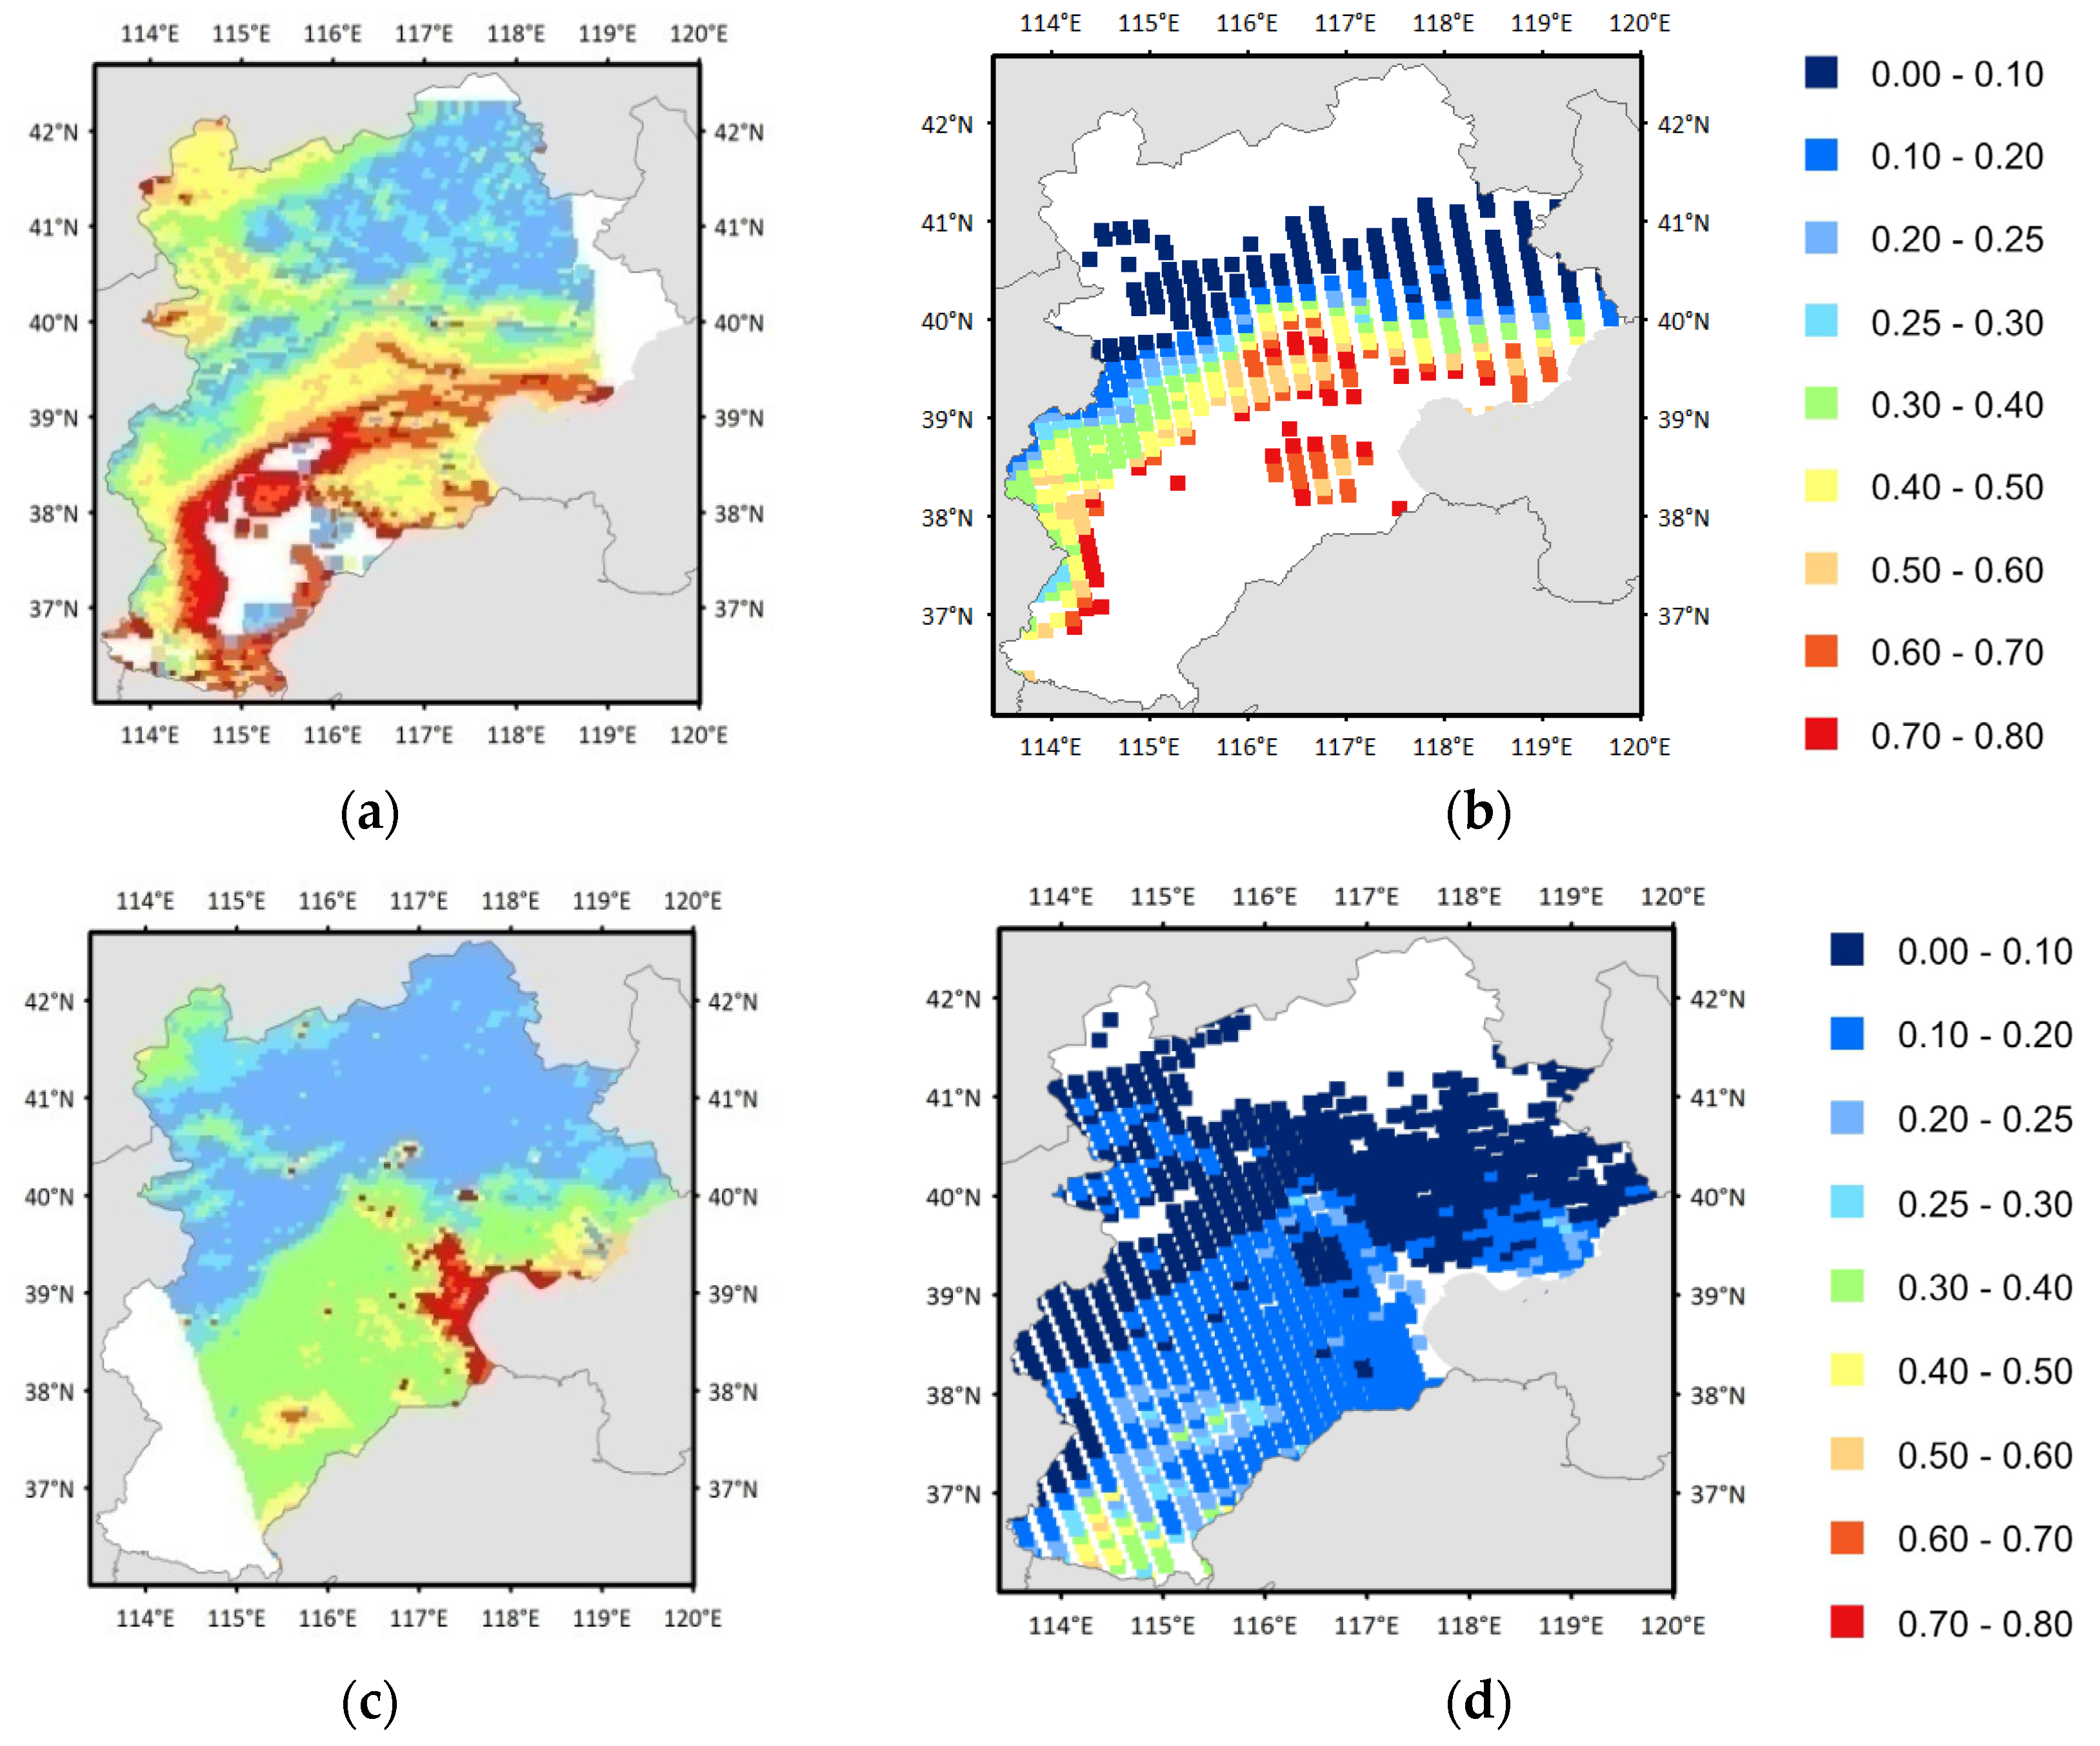
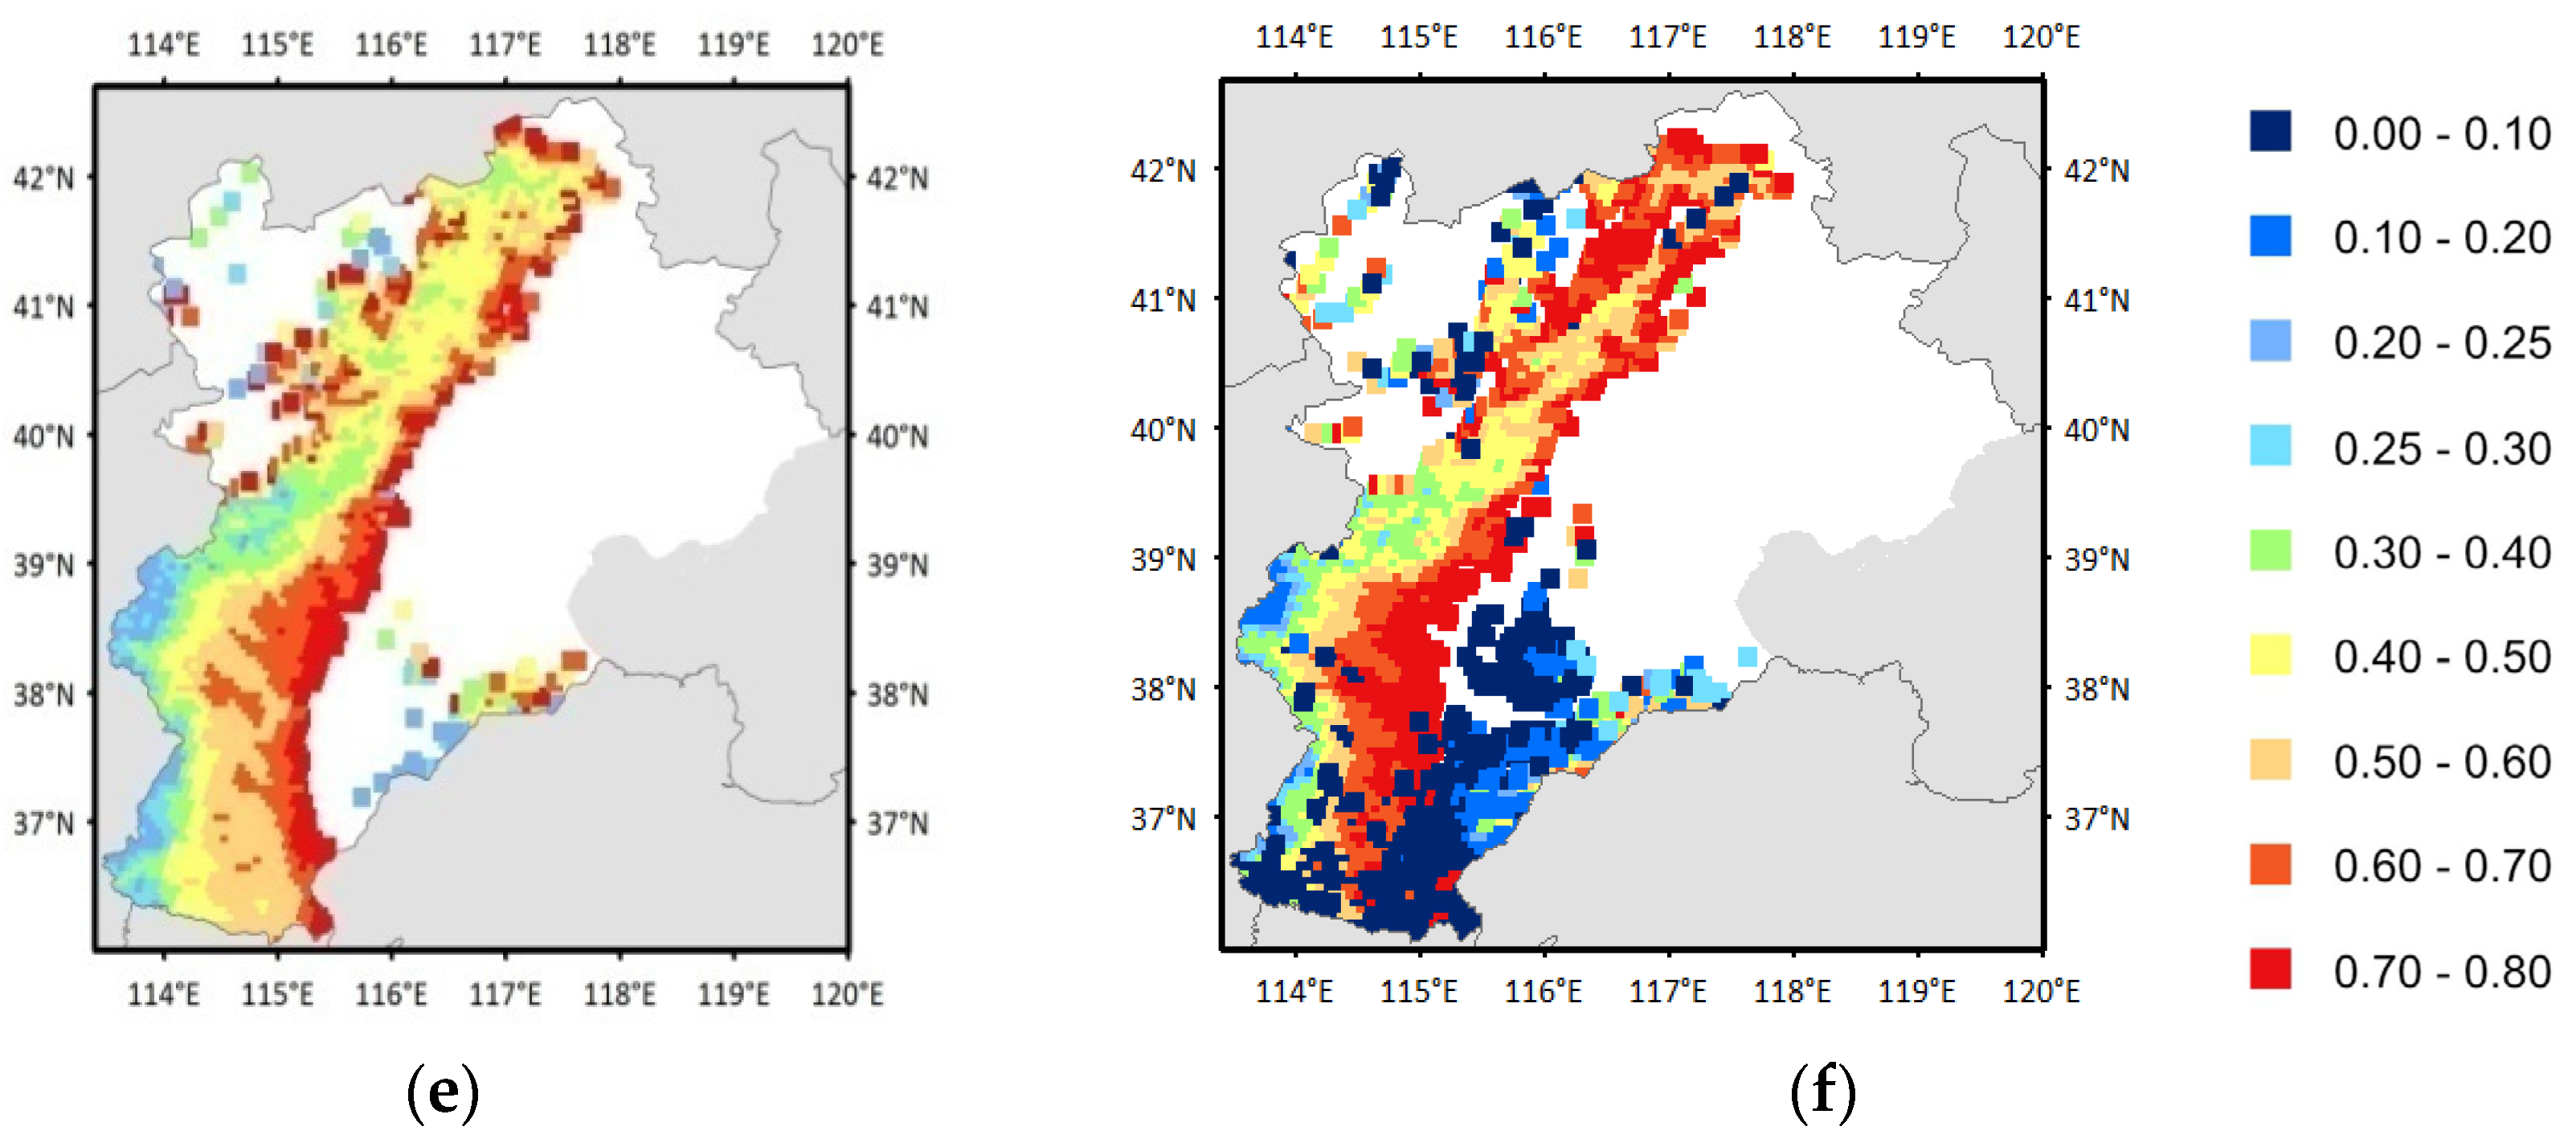
3.2. Case Studies Conducted over East China
4. Conclusions
Author Contributions
Funding
Data Availability Statement
Acknowledgments
Conflicts of Interest
References
- Sano, I.; Mukai, S. Investigation of air pollution and regional climate change due to anthropogenic aerosols. In Remote Sensing Technologies and Applications in Urban Environments; SPIE: Bellingham, WA, USA, 2016; Volume 100080Z. [Google Scholar]
- Kaufman, Y.J.; Boucher, O.; Tanré, D.; Chin, M.; Remer, L.A.; Takemura, T. Aerosol anthropogenic component estimated from satellite data. Geophys. Res. Lett. 2005, 32, 317–330. [Google Scholar] [CrossRef]
- Degrendele, C.; Okonski, K.; Melymuk, L.; Landlová, L.; Kukučka, P.; Čupr, P.; Klánová, J. Size specific distribution of the atmospheric particulate PCDD/Fs, dl-PCBs and PAHs on a seasonal scale: Implications for cancer risks from inhalation. Atmos. Environ. 2014, 98, 410–416. [Google Scholar] [CrossRef]
- Mishchenko, M.; Cairns, B.; Kopp, G.; Schueler, C.F.; Fafaul, B.; Hansen, J.; Hooker, J.; Itchkawich, T.; Maring, H.; Travis, L.D. Accurate monitoring of terrestrial aerosols and total solar irradiance: Introducing the Glory Mission. Bull. Am. Meteorol. Soc. 2007, 88, 677–691. [Google Scholar] [CrossRef]
- Kokhanovsky, A.A. The modern aerosol retrieval algorithms based on the simultaneous measurements of the intensity and polarization of reflected solar light: A review. Front. Environ. Sci. 2015, 3, 4. [Google Scholar] [CrossRef]
- Fougnie, B.; Bracco, G.; Lafrance, B.; Ruffel, C.; Hagolle, O.; Tinel, C. PARASOL in-flight calibration and performance. Appl. Opt. 2007, 46, 5435–5451. [Google Scholar] [CrossRef] [PubMed]
- Wang, S.; Gong, W.; Fang, L.; Wang, W.; Zhang, P.; Lu, N.; Tang, S.; Zhang, X.; Hu, X.; Sun, X. Aerosol Retrieval over Land from the Directional Polarimetric Camera Aboard on GF-5. Atmosphere 2022, 13, 1884. [Google Scholar] [CrossRef]
- Li, L.; Che, H.; Zhang, X.; Chen, C.; Chen, X.; Gui, K.; Liang, Y.; Wang, F.; Zhang, L.; Zhang, X.; et al. A satellite-measured view of aerosol component content and optical property in a haze-polluted case over North China Plain. Atmos. Res. 2022, 266, 105958. [Google Scholar] [CrossRef]
- Jin, S.; Ma, Y.; Chen, C.; Dubovik, O.; Hong, J.; Liu, B.; Gong, W. Performance evaluation for retrieving aerosol optical depth from the Directional Polarimetric Camera (DPC) based on the GRASP algorithm. Atmos. Meas. Tech. 2022, 15, 4323–4337. [Google Scholar] [CrossRef]
- Deuzé, J.L.; Bréon, F.M.; Devaux, C.; Goloub, P.; Herman, M.; Lafrance, B.; Maignan, F.; Marchand, A.; Nadal, F.; Perry, G.; et al. Remote sensing of aerosols over land surfaces from POLDER-ADEOS-1 polarized measurements. J. Geophys. Res. Atmos. 2001, 106, 4913–4926. [Google Scholar] [CrossRef]
- Dubovik, O.; Herman, M.; Holdak, A.; Lapyonok, T.; Tanre, D.; Deuze, J.L.; Ducos, F.; Sinyuk, A.; Lopatin, A. Statistically optimized inversion algorithm for enhanced retrieval of aerosol properties from spectral multi-angle polarimetric satellite observations. Atmos. Meas. Tech. 2011, 4, 975–1018. [Google Scholar] [CrossRef]
- Dubovik, O.; Fuertes, D.; Lytvynov, P.; Lopatin, A.; Lapyonok, T.; Doubovik, I.; Chen, C.; Torres, B.; Matar, C.; Federspiel, C.; et al. A Comprehensive Description of Multi-Term LSM for Applying Multiple a Priori Constraints in Problems of Atmospheric Remote Sensing: GRASP Algorithm, Concept, and Applications. Front. Remote Sens. 2021, 2, 23. [Google Scholar] [CrossRef]
- Hasekamp, O.P.; Litvinov, P.; Butz, A. Aerosol properties over the ocean from PARASOL multiangle photopolarimetric measurements. J. Geophys. Res. Atmos. 2011, 116, D14204. [Google Scholar] [CrossRef]
- Fu, G.; Hasekamp, O. Retrieval of aerosol microphysical and optical properties over land using a multimode approach. Atmos. Meas. Tech. 2018, 11, 6627–6650. [Google Scholar] [CrossRef]
- Fang, L.; Hasekamp, O.; Fu, G.; Gong, W.; Wang, S.; Wang, W.; Han, Q.; Tang, S. Retrieval of Aerosol Optical Properties over Land Using an Optimized Retrieval Algorithm Based on the Directional Polarimetric Camera. Remote Sens. 2022, 14, 4571. [Google Scholar] [CrossRef]
- Lu, S.; Landgraf, J.; Fu, G.L.; van Diedenhoven, B.; Wu, L.; Rusli, S.P.; Hasekamp, O.P. Simultaneous Retrieval of Trace Gases, Aerosols, and Cirrus Using RemoTAP—The Global Orbit Ensemble Study for the CO2M Mission. Front. Remote Sens. 2022, 3, 914378. [Google Scholar] [CrossRef]
- Xu, F.; Van Harten, G.; Diner, D.J.; Kalashnikova, O.V.; Seidel, F.C.; Bruegge, C.J.; Dubovik, O. Coupled retrieval of aerosol properties and land surface reflection using the Airborne Multiangle SpectroPolarimetric Imager. J. Geophys. Res. Atmos. 2017, 122, 7004–7026. [Google Scholar] [CrossRef]
- Gao, M.; Franz, B.A.; Knobelspiesse, K.; Zhai, P.-W.; Martins, V.; Burton, S.; Cairns, B.; Ferrare, R.; Gales, J.; Hasekamp, O.; et al. Efficient multi-angle polarimetric inversion of aerosols and ocean color powered by a deep neural network forward model. Atmos. Meas. Tech. 2021, 14, 4083–4110. [Google Scholar] [CrossRef]
- Wang, S.; Fang, L.; Zhang, X.; Wang, W. Retrieval of Aerosol Properties for Fine/Coarse Mode Aerosol Mixtures over Beijing from PARASOL Measurements. Remote Sens. 2015, 7, 9311–9324. [Google Scholar] [CrossRef]
- Holben, B.N.; Smirnov, A.T.; Eck, T.F.; Slutsker, I.; Abuhassan, N.; Newcomb, W.W.; Schafer, J.S.; Chatenet, B.; Lavenu, F.; Kaufman, Y.J.; et al. An emerging ground-based aerosol climatology: Aerosol optical depth from AERONET. J. Geophys. Res. 2001, 106, 12067–12098. [Google Scholar] [CrossRef]
- O’Neill, N.T.; Eck, T.F.; Smirnov, A.; Holben, B.N.; Thulasiraman, S. Spectral discrimination of coarse and fine mode optical depth. J. Geophys. Res. 2003, 108, 4559. [Google Scholar] [CrossRef]
- Lenoble, J.; Herman, M.; Deuzé, J.L.; Lafrance, B.; Santer, R.; Tanré, D. A successive order of scattering code for solving the vector equation of transfer in the earth’s atmosphere with aerosols. J. Quant. Spect. Rad. Trans. 2007, 107, 479–507. [Google Scholar] [CrossRef]
- Parol, F.; Buriez, J.C.; Vanbauce, C.; Couvert, P.; Sèze, G.; Goloub, P.; Cheinet, S. First results of the POLDER “Earth Radiation Budget and Clouds” operational algorithm. IEEE Trans. Geosci. Remote Sens. 1999, 37, 1597–1612. [Google Scholar] [CrossRef]
- Zeng, S.; Parol, F.; Riedi, J.; Cornet, C.; Thieuleux, F. Examination of POLDER/PARASOL and MODIS/Aqua Cloud Fractions and Properties Representativeness. J. Clim. 2011, 24, 4435–4450. [Google Scholar] [CrossRef]
- Flowerdew, R.J.; Haigh, J.D. An approximation to improve accuracy in the derivation of surface reflectances from multi-look satellite radiometers. Geophys. Res. Lett. 1995, 22, 1693–1696. [Google Scholar] [CrossRef]
- Kahn, R.A.; Gaitley, B.J.; Martonchik, J.V.; Diner, D.J.; Crean, K.A.; Holben, B. Multiangle Imaging Spectroradiometer (MISR) global aerosol optical depth validation based on 2 years of coincident Aerosol Robotic Network (AERONET) observations. J. Geophys. Res. 2005, 110, D10S04. [Google Scholar] [CrossRef]
- Hulst, H.C.; van de Hulst, H.C. Light Scattering by Small Particles; Courier Corporation: North Chelmsford, MA, USA, 1981. [Google Scholar]
- Dubovik, O.; Sinyuk, A.; Lapyonok, T.; Holben, B.N.; Mishchenko, M.; Yang, P.; Eck, T.F.; Volten, H.; Munoz, O.; Veihelmann, B.; et al. Application of spheroid models to account for aerosol particle nonsphericity in remote sensing of desert dust. J. Geophys. Res. Atmos. 2006, 111, D11. [Google Scholar] [CrossRef]
- Nadal, F.; Bréon, F.M. Parameterization of surface polarized reflectance derived from POLDER spaceborne measurements. IEEE Trans. Geosci. Remote 1999, 37, 1709–1718. [Google Scholar] [CrossRef]
- Smirnov, A.; Holben, B.N.; Eck, T.F.; Dubovik, O.; Slutsker, I. Cloud-Screening and Quality Control Algorithms for the AERONET Database. Remote Sens. Environ. 2000, 73, 337–349. [Google Scholar] [CrossRef]
- Dubovik, O.; King, M.D. A flexible inversion algorithm for retrieval of aerosol optical properties from Sun and sky radiance measurements. J. Geophys. Res. Atmos. 2000, 105, 20673–20696. [Google Scholar] [CrossRef]
- Chen, C.; Dubovik, O.; Fuertes, D.; Litvinov, P.; Lapyonok, T.; Lopatin, A.; Ducos, F.; Derimian, Y.; Herman, M.; Federspiel, C.; et al. Validation of GRASP algorithm product from POLDER/PARASOL data and assessment of multi-angular polarimetry potential for aerosol monitoring. Earth Syst. Sci. Data 2020, 12, 3573–3620. [Google Scholar] [CrossRef]


| Aerosol Type | Real Refractive Index | Imaginary Refractive Index | Single Scattering Albedo | |||
|---|---|---|---|---|---|---|
| 1: spherical | 0.03 | 0.501 | 1.45 | 0.00 | 0.06 | 1.0 |
| 2: spherical | 0.06 | 0.531 | 1.45 | 0.00 | 0.12 | 1.0 |
| 3: spherical | 0.12 | 0.560 | 1.45 | 0.00 | 0.26 | 1.0 |
| 6: spherical | 1.0 | 0.642 | 1.45 | 0.00 | 2.80 | 1.0 |
| 8: spherical | 0.06 | 0.531 | 1.45 | 0.0147 | 0.12 | B:0.911 G:0.900 R: 0.855 N: 0.853 |
| 14: spherical | 0.06 | 0.531 | 1.45 | 0.0325 | 0.12 | B:0.821 G:0.800 R: 0.773 N: 0.720 |
| 19: dust | 0.5 | 0.405 | B:1.50 G:1.51 R:1.51 N:1.51 | B:0.0041 G:0.0021 R:0.00065 N:0.00047 | 0.21 | B:0.919 G:0.977 R: 0.994 N: 0.997 |
| 21: dust | 1.0 | 0.693 | 1.51 | B:0.0041 G:0.0021 R:0.00065 N:0.00047 | 3.32 | B:0.810 G:0.902 R: 0.971 N: 0.983 |
| Model Number | Components | Mixture Fractional Optical Depth (Green Band) |
|---|---|---|
| 1–5: bimodal | 1 and 6 | Range: 1.0 (1) and 0.0 (6) to 0.2 (1) and 0.8 (6) |
| 6–10: bimodal | 2 and 6 | Range: 1.0 (2) and 0.0 (6) to 0.2 (2) and 0.8 (6) |
| 11–15: bimodal | 3 and 6 | Range: 1.0 (3) and 0.0 (6) to 0.2 (3) and 0.8 (6) |
| 16–20: bimodal | 8 and 6 | Range: 1.0 (8) and 0.0 (6) to 0.2 (8) and 0.8 (6) |
| 21–25: bimodal | 14 and 6 | Range: 1.0 (14) and 0.0 (6) to 0.2 (14) and 0.8 (6) |
| 26–28: trimodal | 2, 6, and 19 | Range: 0.72 (2), 0.08 (6), and 0.2 (19) to 0.16 (2), 0.64 (6), and 0.2 (19) |
| 29–31: trimodal | 2, 6, and 19 | Range: 0.54 (2), 0.06 (6), and 0.4 (19) to 0.12 (2), 0.48 (6), and 0.4 (19) |
| 32–34: trimodal | 2, 6, and 19 | Range: 0.36 (2), 0.04 (6), and 0.6 (19) to 0.08 (2), 0.32 (6), and 0.6 (19) |
| 35–37: trimodal | 2, 6, and 19 | Range: 0.18 (2), 0.02 (6), and 0.8 (19) to 0.04 (2), 0.16 (6), and 0.8 (19) |
| 38–40: trimodal | 2, 19, and 21 | Range: 0.4 (2), 0.48 (19), and 0.12 (21) to 0.4 (2), 0.12 (19), and 0.48 (21) |
| 41–43: trimodal | 2, 19, and 21 | Range: 0.2 (2), 0.64 (19), and 0.16 (21) to 0.2 (2), 0.16 (19), and 0.64 (21) |
| 44–46: bimodal | 19 and 21 | Range: 0.8 (19) and 0.2 (21) to 0.2 (19), 9, and 0.8 (21) |
| Site | Average AOD | AE | Correlation | RMSE | Slope | Intercept | N * | Latitude (N) | Longitude (E) | |
|---|---|---|---|---|---|---|---|---|---|---|
| 1 | Beijing | 0.59 | 1.182 | 0.87 | 0.160 | 0.86 | 0.11 | 25 | 39.977 | 116.381 |
| 2 | Hefei | 0.48 | 1.137 | 0.49 | 0.182 | 0.95 | 0.12 | 17 | 31.905 | 117.162 |
| 3 | Jingtai | 0.40 | 0.414 | 0.55 | 0.131 | 0.50 | 0.13 | 17 | 37.333 | 104.1 |
| 4 | SACOL | 0.29 | 0.798 | 0.55 | 0.131 | 0.50 | 0.13 | 33 | 35.946 | 104.137 |
| 5 | Taihu | 0.61 | 1.214 | 0.69 | 0.327 | 0.96 | 0.10 | 32 | 31.421 | 120.215 |
| 6 | Xianghe | 0.45 | 1.217 | 0.84 | 0.218 | 0.87 | 0.10 | 47 | 39.75 | 116.953 |
| 7 | Xinglong | 0.18 | 1.200 | 0.58 | 0.206 | 0.74 | 0.15 | 43 | 40.417 | 117.58 |
Disclaimer/Publisher’s Note: The statements, opinions and data contained in all publications are solely those of the individual author(s) and contributor(s) and not of MDPI and/or the editor(s). MDPI and/or the editor(s) disclaim responsibility for any injury to people or property resulting from any ideas, methods, instructions or products referred to in the content. |
© 2023 by the authors. Licensee MDPI, Basel, Switzerland. This article is an open access article distributed under the terms and conditions of the Creative Commons Attribution (CC BY) license (https://creativecommons.org/licenses/by/4.0/).
Share and Cite
Wang, S.; Fang, L.; Gong, W.; Wang, W.; Tang, S. Retrieval of Aerosol Optical Depth and FMF over East Asia from Directional Intensity and Polarization Measurements of PARASOL. Atmosphere 2024, 15, 6. https://doi.org/10.3390/atmos15010006
Wang S, Fang L, Gong W, Wang W, Tang S. Retrieval of Aerosol Optical Depth and FMF over East Asia from Directional Intensity and Polarization Measurements of PARASOL. Atmosphere. 2024; 15(1):6. https://doi.org/10.3390/atmos15010006
Chicago/Turabian StyleWang, Shupeng, Li Fang, Weishu Gong, Weihe Wang, and Shihao Tang. 2024. "Retrieval of Aerosol Optical Depth and FMF over East Asia from Directional Intensity and Polarization Measurements of PARASOL" Atmosphere 15, no. 1: 6. https://doi.org/10.3390/atmos15010006