Article

Characterization of the Energy Balance of Wheat Grown under Irrigation in the Hot, Arid Environment of Sudan

by
Almutaz Abdelkarim Abdelfattah Mohammed
1,2,3,*,
Mitsuru Tsubo
4,
Yasunori Kurosaki
4 and
Yasuomi Ibaraki
5
1
United Graduate School of Agricultural Science, Tottori University, Tottori 680-8553, Japan
2
Agricultural Research Corporation, P.O. Box 126, Wad Medani 22212, Sudan
3
Hydraulics Research Center, P.O. Box 318, Wad Medani 22212, Sudan
4
Arid Land Research Center, Tottori University, Tottori 680-0001, Japan
5
Faculty of Agriculture, Yamaguchi University, Yamaguchi 753-8515, Japan
*
Author to whom correspondence should be addressed.
Atmosphere 2024, 15(1), 18; https://doi.org/10.3390/atmos15010018
Submission received: 17 November 2023 / Revised: 13 December 2023 / Accepted: 20 December 2023 / Published: 23 December 2023
(This article belongs to the Section Biometeorology)

Abstract

:
An analysis of the crop microclimate is essential for assessing the climate’s appropriateness for cultivation. Here, the Bowen ratio (BR) was used to characterize the energy balance in an irrigated wheat field in a hot, arid environment in Sudan. The hourly BR was calculated using micrometeorological data, including net radiation (Rn) and soil heat flux (G), observed in the 2021–2022 and 2022–2023 growing seasons (December–March) and used to compute hourly daytime latent heat (LE) and sensible heat (H) fluxes during the days before and after irrigation. In both seasons, the observed significant evaporative cooling effect of irrigation led to a daily maximum temperature difference of 2.5–5.7 °C between the wheat field and a nearby meteorological station in a non-vegetated desert area. The energy balance calculation results showed that LE was dominant over H and G. Because BR tended to be negative, H was negative; thus, LE was larger than Rn because of sensible heat advection from the surrounding area. Further, a decrease in G after irrigation indicated an alteration in the soil’s thermal properties. These results provide insights into the micrometeorological response of irrigated wheat to a hot, arid environment and useful information for understanding soil–plant–atmosphere interactions in hot, dry environments.

1. Introduction

Climate change is becoming an increasingly pressing issue, and its impact on agriculture has been found in various regions to affect land suitability for cultivation and crop productivity [1]. The challenge posed by climate change is particularly severe in hot, dry environments, which are prone to water scarcity and heat waves that can harm crops. In fact, high-temperature stress has a far-reaching effect on crop production through a negative effect on vital growth stages [2] that manifests in the reduced productivity of major (staple) crops [3,4]. In particular, the productivity of wheat (Triticum aestivum L.), which is adapted to cool environments, is severely limited by heat stress [5,6,7,8]. In hot, dry environments where temperatures are rising because of climate change, it has become increasingly important to grasp how evaporative cooling might affect wheat grown under irrigation. This effect can act as a shield against heat stress, thereby mitigating adverse impacts on crop reproductive processes [9,10]. Moreover, this cooling effect can lead to enhanced water use efficiency [11] by creating a microclimate with a reduced evaporative loss of moisture from the soil and by fostering atmospheric conditions more conducive to evapotranspiration.
Irrigation significantly affects the energy balance at the crop canopy surface such that the air temperature decreases above the canopy [10,12,13,14,15,16]. By providing crops with more water, irrigation increases evapotranspiration, the process by which water is transferred from the land to the atmosphere via transpiration and evaporation, and, thus, the latent heat flux (LE) also increases, which absorbs energy from the atmosphere and cools the crop microclimate [10,12,16]. Irrigation can also affect the canopy surface albedo, which is the amount of solar radiation reflected back into the atmosphere [16]. A well-watered crop field tends to have a larger leaf area index, which, in turn, increases the absorption of solar radiation by the crop; this increased absorption results in elevated transpiration and decreases the available energy for warming the air [17]. Irrigation can also influence transfers of heat from the surface to the atmosphere through conduction and convection, that is, the sensible heat flux (H). Previous studies have shown that irrigation reduces H, which lowers the air temperature [10,16,18].
Several studies have demonstrated that irrigation can significantly affect the local climate by modifying water and energy budgets. In fact, irrigation can cool the area surrounding an irrigated field [19,20,21] because increased soil moisture enhances the thermal conductivity and heat capacity of the soil [22]. Tang et al. (2022) [23] studied the effect of sprinkler irrigation on winter wheat and showed that LE was higher during the daytime and lower at night under irrigation compared with under non-irrigated conditions. Consistent seasonal changes observed in evapotranspiration and heat fluxes have been attributed to the expansion of irrigated cropland and, thus, the cooling effect of irrigation [24,25]. Moreover, Siebert et al. [26], who conducted a study in Europe, reported that irrigation can reduce heat stress. In addition, when they modeled the crop yield without considering this effect, the effect of heat stress on yield was amplified. However, the incorporation of a localized cooling effect in climate–crop modeling remains a major challenge, particularly when upscaling from the leaf to plant to canopy in the landscape. The evaporative cooling effect of irrigation depends on several factors, including the crop type, the background climate, and the irrigation method used. The different water requirements and transpiration rates of different crops can affect the cooling effect [16]. Moreover, the effectiveness of irrigation in inducing cooling may be influenced by background climate conditions, such as the availability of water, and the action of other cooling mechanisms, such as ground surface shading (crop density).
The analysis of the microclimate is essential for assessing the appropriateness of the atmospheric environment for crops [27] because it facilitates a granular examination of energy partitioning between sensible heat (transferred through the air) and latent heat (resulting from evapotranspiration) over crop fields. These parameters (LE and H) are often quantified using the Bowen ratio (BR) [28], which is a foundational metric in micrometeorological analysis. This approach offers a robust framework for comparing cultivars, particularly in high-temperature environments [29]. Moreover, such an examination can reveal how vegetation profoundly influences the local microclimate by actively modulating energy exchange.
Sudan produces wheat under irrigation in a hot, dry environment that has been classified into International Maize and Wheat Improvement Center (CIMMYT)’s Wheat Breeding Mega-Environment 5 [30], and the northern part of the country, which is situated in a hot desert climate zone, is particularly arid. Therefore, the main objective of this study was to characterize the energy balance of wheat grown under irrigation in the hot, arid environment of northern Sudan. The specific objectives were to (i) compare the air temperature between a wheat field and the surrounding arid expanse, (ii) quantify the components of the energy balance, and (iii) clarify the effect of irrigation on the energy balance. This study is one of the first to investigate the modification of a wheat microclimate via irrigation at the field level in a hot, arid environment.

2. Materials and Methods

2.1. Field Experiments

The study was conducted during the dry season (November–April) at the Dongola Research Station of the Agricultural Research Corporation (19.1370° N, 30.4595° E) in a major wheat-producing area of northern Sudan (Figure 1), where wheat cultivation depended on irrigation due to the absence of rainfall. Field experiments were carried out during two growing seasons: 2021–2022 and 2022–2023. In 2021–2022, the field was 270 m long in the north–south direction and 180 m wide, and in 2022–2023, it was 290 m long and 200 m wide. Before planting, land preparation was conducted by harrowing and leveling. For the experiments, the wheat cultivar Imam was used. Imam is a commercial cultivar introduced by CIMMYT (Attila) that has become popular in dry environments like Sudan, which is known for its semi-prostrate growth habit and late maturation [31]. In the study field, the crop rows were spaced 0.2 m apart in the north–south direction, and the seeding rate was 120 kg ha−1. The date of sowing was 25 November 2021–2022 and 2 December 2022–2023. Immediately after the sowing, the field was flood-irrigated at a rate of 40–50 mm per irrigation, and it was subsequently irrigated every 9 to 26 days for a total of 9 or 10 times each season. The soil in the field is substantially sandy clay loam with a pH of 8.0; its texture is sandy clay loam at a depth of 0–30 cm and silty clay loam at 30–60 cm, and the organic matter deficiency is significant (<5%); remarkably, the nitrogen and phosphorus contents are low [32]. Thus, a Diammonium phosphate fertilizer, 25 kg N ha−1 and 28 kg P ha−1, was evenly applied to the field prior to the sowing, and an additional 56 kg N ha−1 of urea split into two parts was applied during the second and fourth irrigations. The same agronomic management was carried out in both seasons as per the recommendations of the Agricultural Research Corporation of Sudan.

2.2. Data Collection and Processing

2.2.1. Micrometeorological Data

A micrometeorological station was installed in the center of the field with more than 130 m of fetch in the northward direction to measure air temperature (T), relative humidity, net radiation (Rn), soil heat, soil moisture, and wind speed (WS) and direction. The temperature and humidity were measured at a height of 2 m and at the canopy level with HMP155 probes (Vaisala Oyj, Vantaa, Finland) in forced-ventilation shelters. Rn was measured at a height of 2 m with a net radiometer (NR-LITE2, Kipp & Zonen B.V., Delft, The Netherlands). The soil heat flux (G) was measured at a depth of 5 cm with a self-calibrating soil heat flux plate (HFP01SC-L, Hukseflux, Delft, The Netherlands). The depth of the plate was checked periodically after irrigation to ensure that the soil cover above the plate had not been eroded during the flooding. The soil moisture profile was measured at depths of 0.05, 0.1, 0.2, 0.3, 0.4, and 0.5 m with a SoilVUE10 sensor (Campbell Scientific Inc., Logan, UT, USA). The soil heat flux and soil moisture sensors were installed 0.7 m away from the station. Wind speed and direction were measured with Wind Sentry anemometers and vanes (3002-47A, R.M. Young Co., Traverse, MI, USA), which were installed at a height of 2 m and at the canopy level on the windward side of the station. The heights of the sensors for temperature, humidity, and wind speed and direction installed at the canopy level were periodically adjusted to the canopy surface. The data were collected with a high temporal resolution: readings were taken every second, then averaged and stored at 10 min intervals by a datalogger (CR1000X, Campbell Scientific Inc., Logan, UT, USA). The micrometeorological measurements were begun on 6 February 2022 and on 17 January 2023 during the first and second growing seasons, respectively, and they ended on 31 March in both seasons.

2.2.2. Calculations of Latent and Sensible Heat Fluxes

The Bowen ratio (BR), the ratio of H to LE, was used to calculate both fluxes (in W m−2) over the field as follows:
L E = R n G / 1 + B R
H = B R R n G / 1 + B R
where Rn and G are also expressed in W m−2. BR, which is defined as the ratio of the temperature and water vapor pressure gradients above an evaporative surface, was calculated as follows:
B R = H / L E = γ Δ T / Δ e
where γ (kPa °C−1) is the psychrometric constant and ∆T (°C) and ∆e (kPa) is the vertical differences in the air temperature and atmospheric water vapor pressure, respectively, above the canopy. LE, H, and BR were calculated with the 10 min interval data and then averaged over the main daytime hours of 8:00 to 16:00 local time (from hours 8 to 15) on one day before and one day after the irrigation. The vapor pressure (e) was calculated from the relative humidity and air temperature [33].

2.2.3. Meteorological Data

The 2 m temperature data from the micrometeorological station were compared with daily maximum temperature data for the surrounding non-vegetated environment recorded at the Dongola meteorological station (19.167° N, 30.483° E) and obtained from the Sudan Meteorological Authority. The Dongola meteorological station is located about 4 km away from the experimental field.

2.2.4. NDVI

The Normalized Difference Vegetation Index (NDVI) was used to capture vegetation dynamics (green canopy cover) during the growing season. The NDVI is computed as follows:
N D V I = N I R R e d / N I R + R e d
where NIR and Red are the reflectance values in the near-infrared and red spectral bands, respectively. The Google Earth Engine was utilized to process European Space Agency Sentinel-2 satellite imagery with a spatial resolution of 10 m × 10 m (https://sentinels.copernicus.eu/web/sentinel/home, accessed on 26 July 2023). Grid data averaged over areas of 200 m × 90 m (2021–2022) and 210 m × 95 m (2022–2023) in the central part of the experimental field were used as representative NDVI values.

2.3. Statistical Analysis

Crop growth was analyzed in terms of the NDVI during the first half (1st to 15th day) and the second half (16th day to the end) of each study month. Then, the NDVI from December to April was compared between the two growing seasons using an unpaired t-test. The daytime irrigation cooling effect during the observation period was evaluated by comparing daily maximum temperatures between the micrometeorological station and the nearby meteorological station using a paired t-test. The significance level for the t-tests was set at 0.05. The effect of irrigation on each component (Rn, LE, H, and G) of the energy balance was assessed via linear regression analysis; that is, the value of each component on the days after irrigation (y) was regressed against that of the days before irrigation (x). In this study, the regression line forced through the origin (with no intercept) was applied to estimate the slope ( β ), as follows [34]:
β = i = 1 n x i y i / i = 1 n x i 2
where n is the number of data points. When β was higher than unity (i.e., β > 1), the flux was determined to have increased after irrigation, whereas β < 1 meant that it had decreased. The coefficient of determination for the no-intercept regression (R2) was calculated using the residual sum of squares and the corrected total sum of squares as follows [34]:
R 2 = 1 i = 1 n y i y i ^ 2 / i = 1 n y i y ¯ 2
where ŷ comprises the estimated values from the no-intercept regression equation (=βx), and y ¯ is the mean of the observed values. All statistical analyses were performed with R language version 4.3.1, Vienna, Austria [35].

3. Results

3.1. Crop Growth

Crop growth was estimated from the seasonal change in the NDVI (Figure 2). In the initial stage (December) of the 2021–2022 season, the NDVI was low (around 0.05) in the first half of the month and increased immediately after sowing up to 0.13 at the end of the second half. As the wheat field approached full canopy development in January, which is the late vegetative growth phase, its vegetative cover became more vigorous; the NDVI ranged from 0.27 to 0.36 in the first half of the month and increased sharply to 0.45 in the second half. In February, which is the early reproductive growth phase, the wheat field reached the heading and flowering stages, and the NDVI was stagnant, ranging between 0.27 and 0.30 in the first half of the month and between 0.25 and 0.30 in the second half. In March, which is the beginning of the maturity stage, the NDVI decreased from 0.30 in the first half of the month to 0.11 in the second half, as the critical grain-filling stage began. In April, the mean NDVI values during the first half (0.09) and the second half of the month (0.08) reflected a trend toward senescence. This discernible decline observed across the wheat field resulted from a reduced green canopy and marked the end of the growing season.
Similarly, in the 2022–2023 season, the mean NDVI values in December (0.04 in the first half and 0.12 in the second half of the month) (Figure 2) were low because the wheat crop was not yet sown or still in the early vegetative phase. The NDVI started to increase in January; the mean values were 0.29 in the first half and 0.36 in the second half of the month when the crop reached full canopy cover and the end of vegetative growth. The NDVI did not differ in December and January between the two seasons (p > 0.05). In February, the NDVI started to gently decrease from the peak, and then it sharply decreased from 0.31 in the first half of March to 0.18 in the second half as the crop reached the maturity stage. In April, a further decrease in the NDVI was observed; the mean values were 0.12 in the first half of the month and 0.09 in the second half. In both the first and second half of February and the first half of March, the NDVI was significantly higher in 2022–2023 than in 2021–2022 (p ≤ 0.05). A difference between the seasons was also observed in the first half of April (p ≤ 0.05).

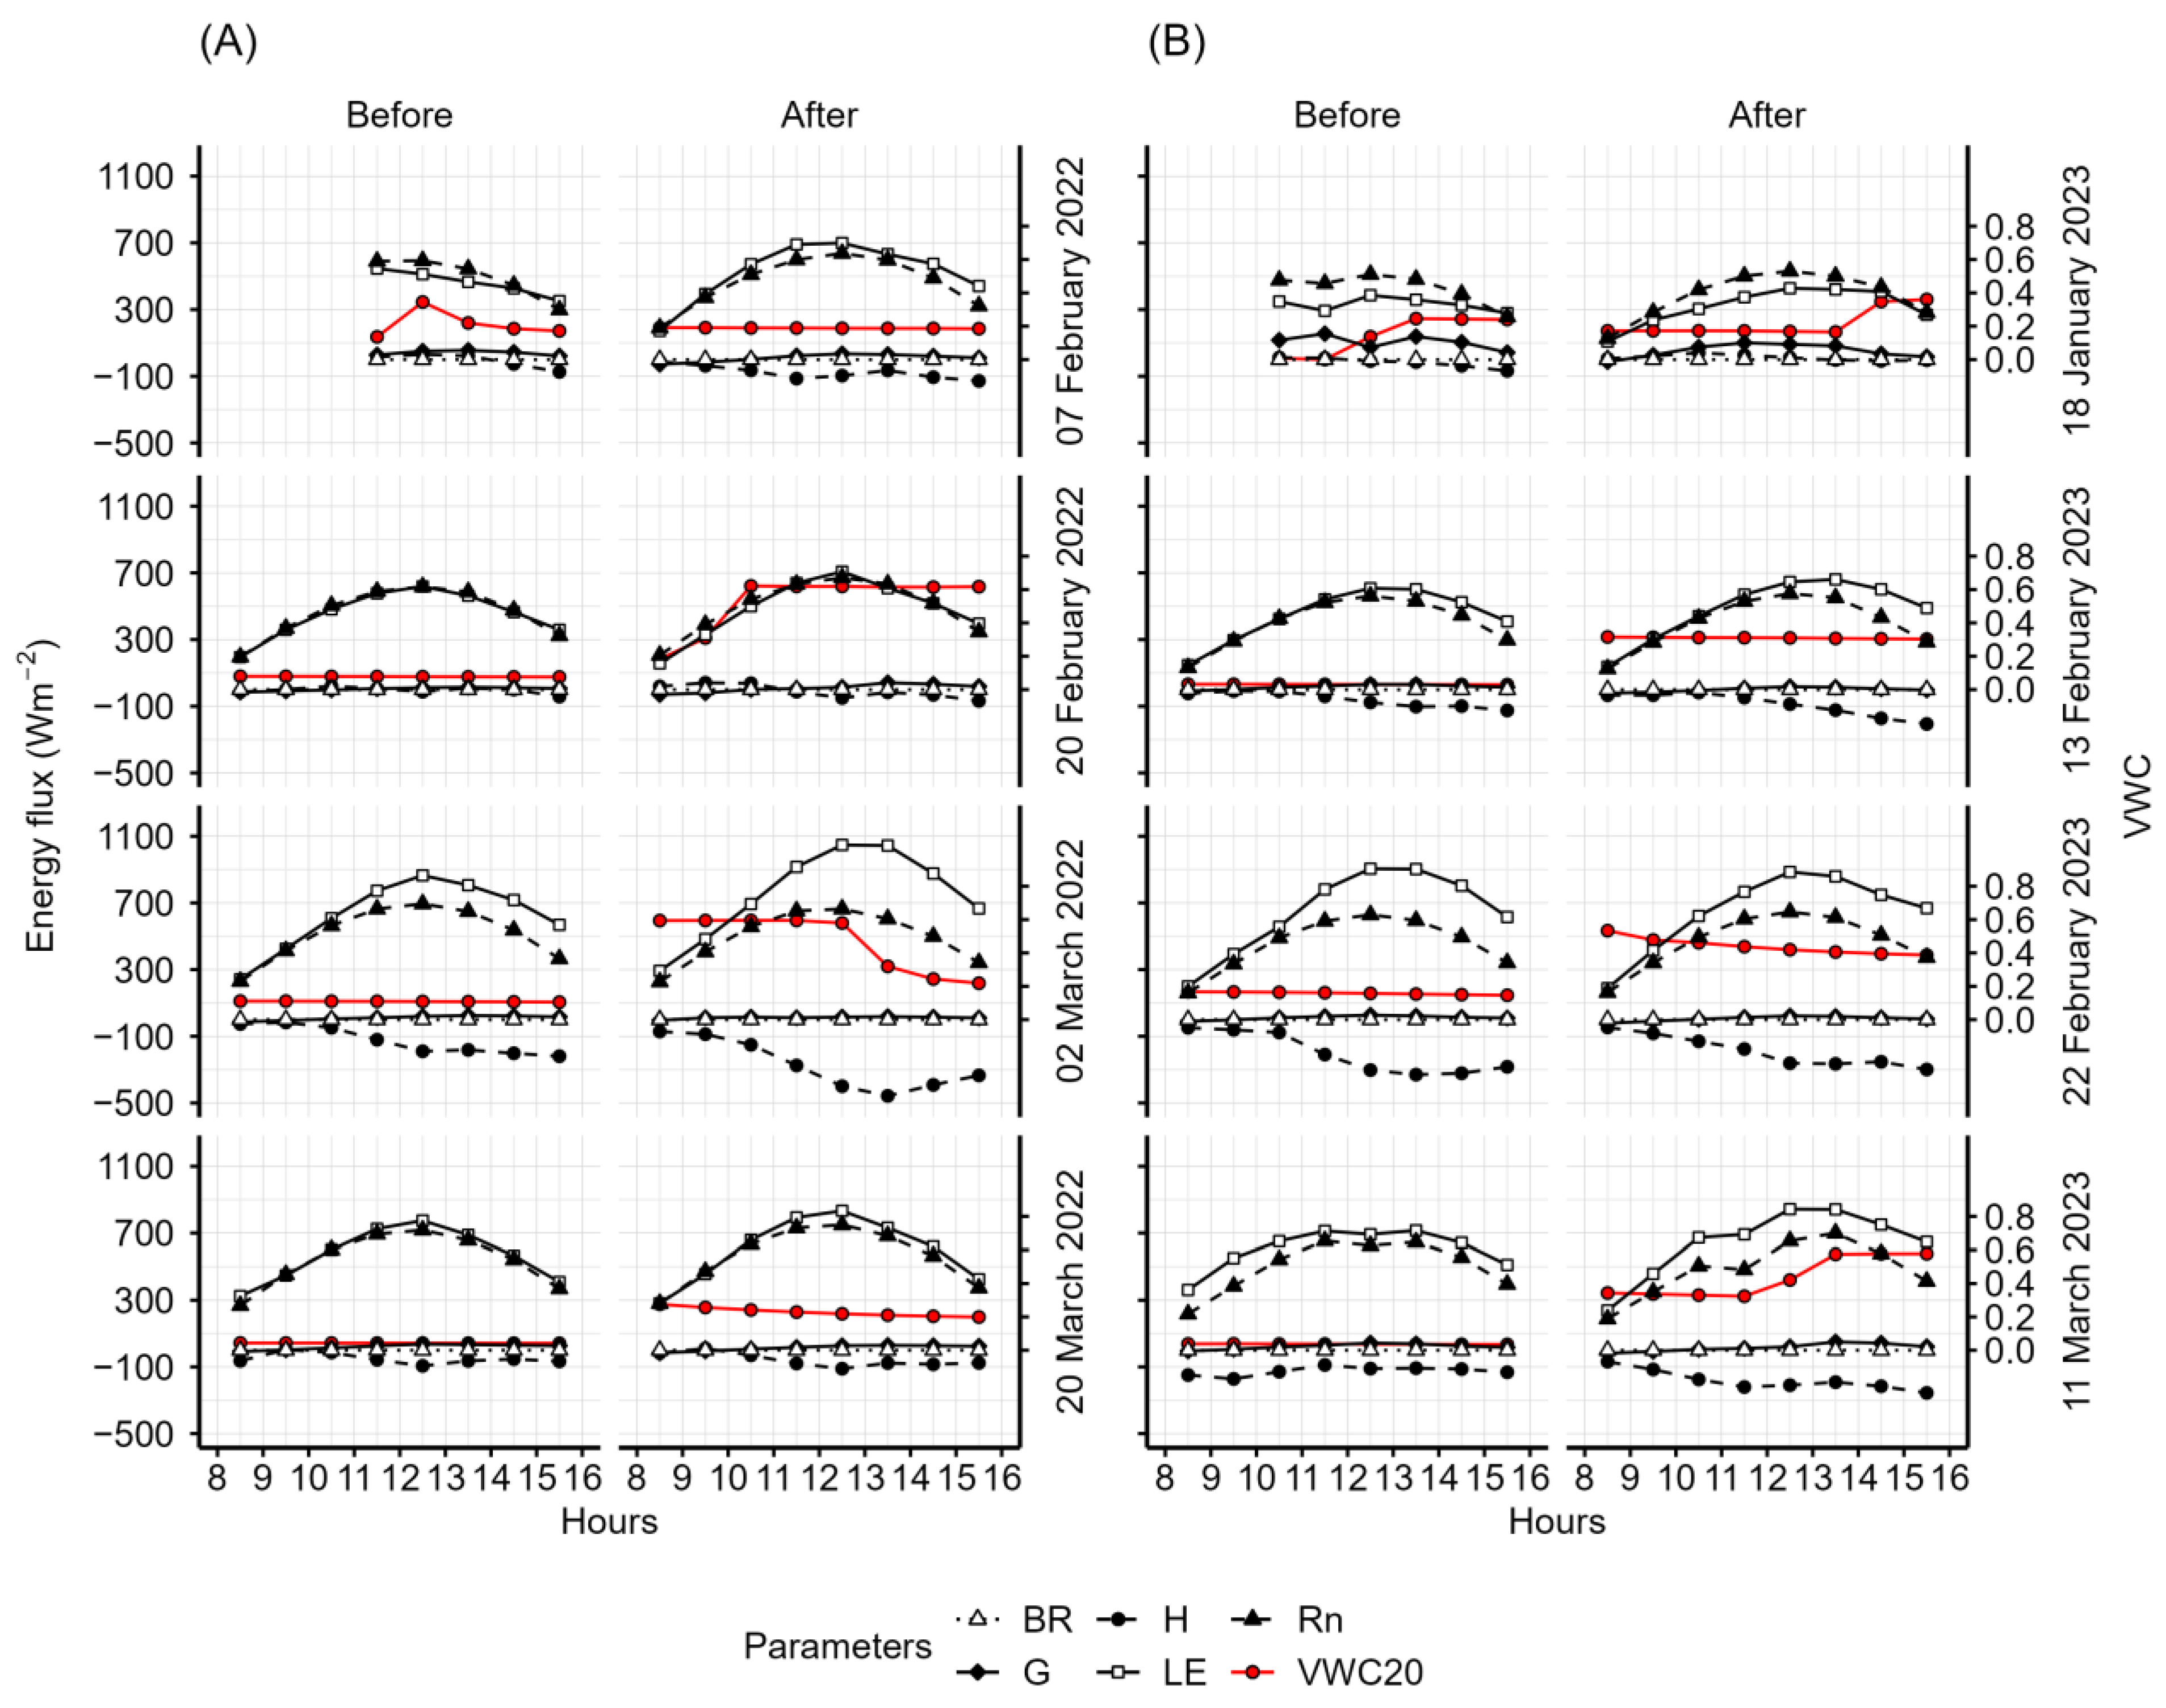
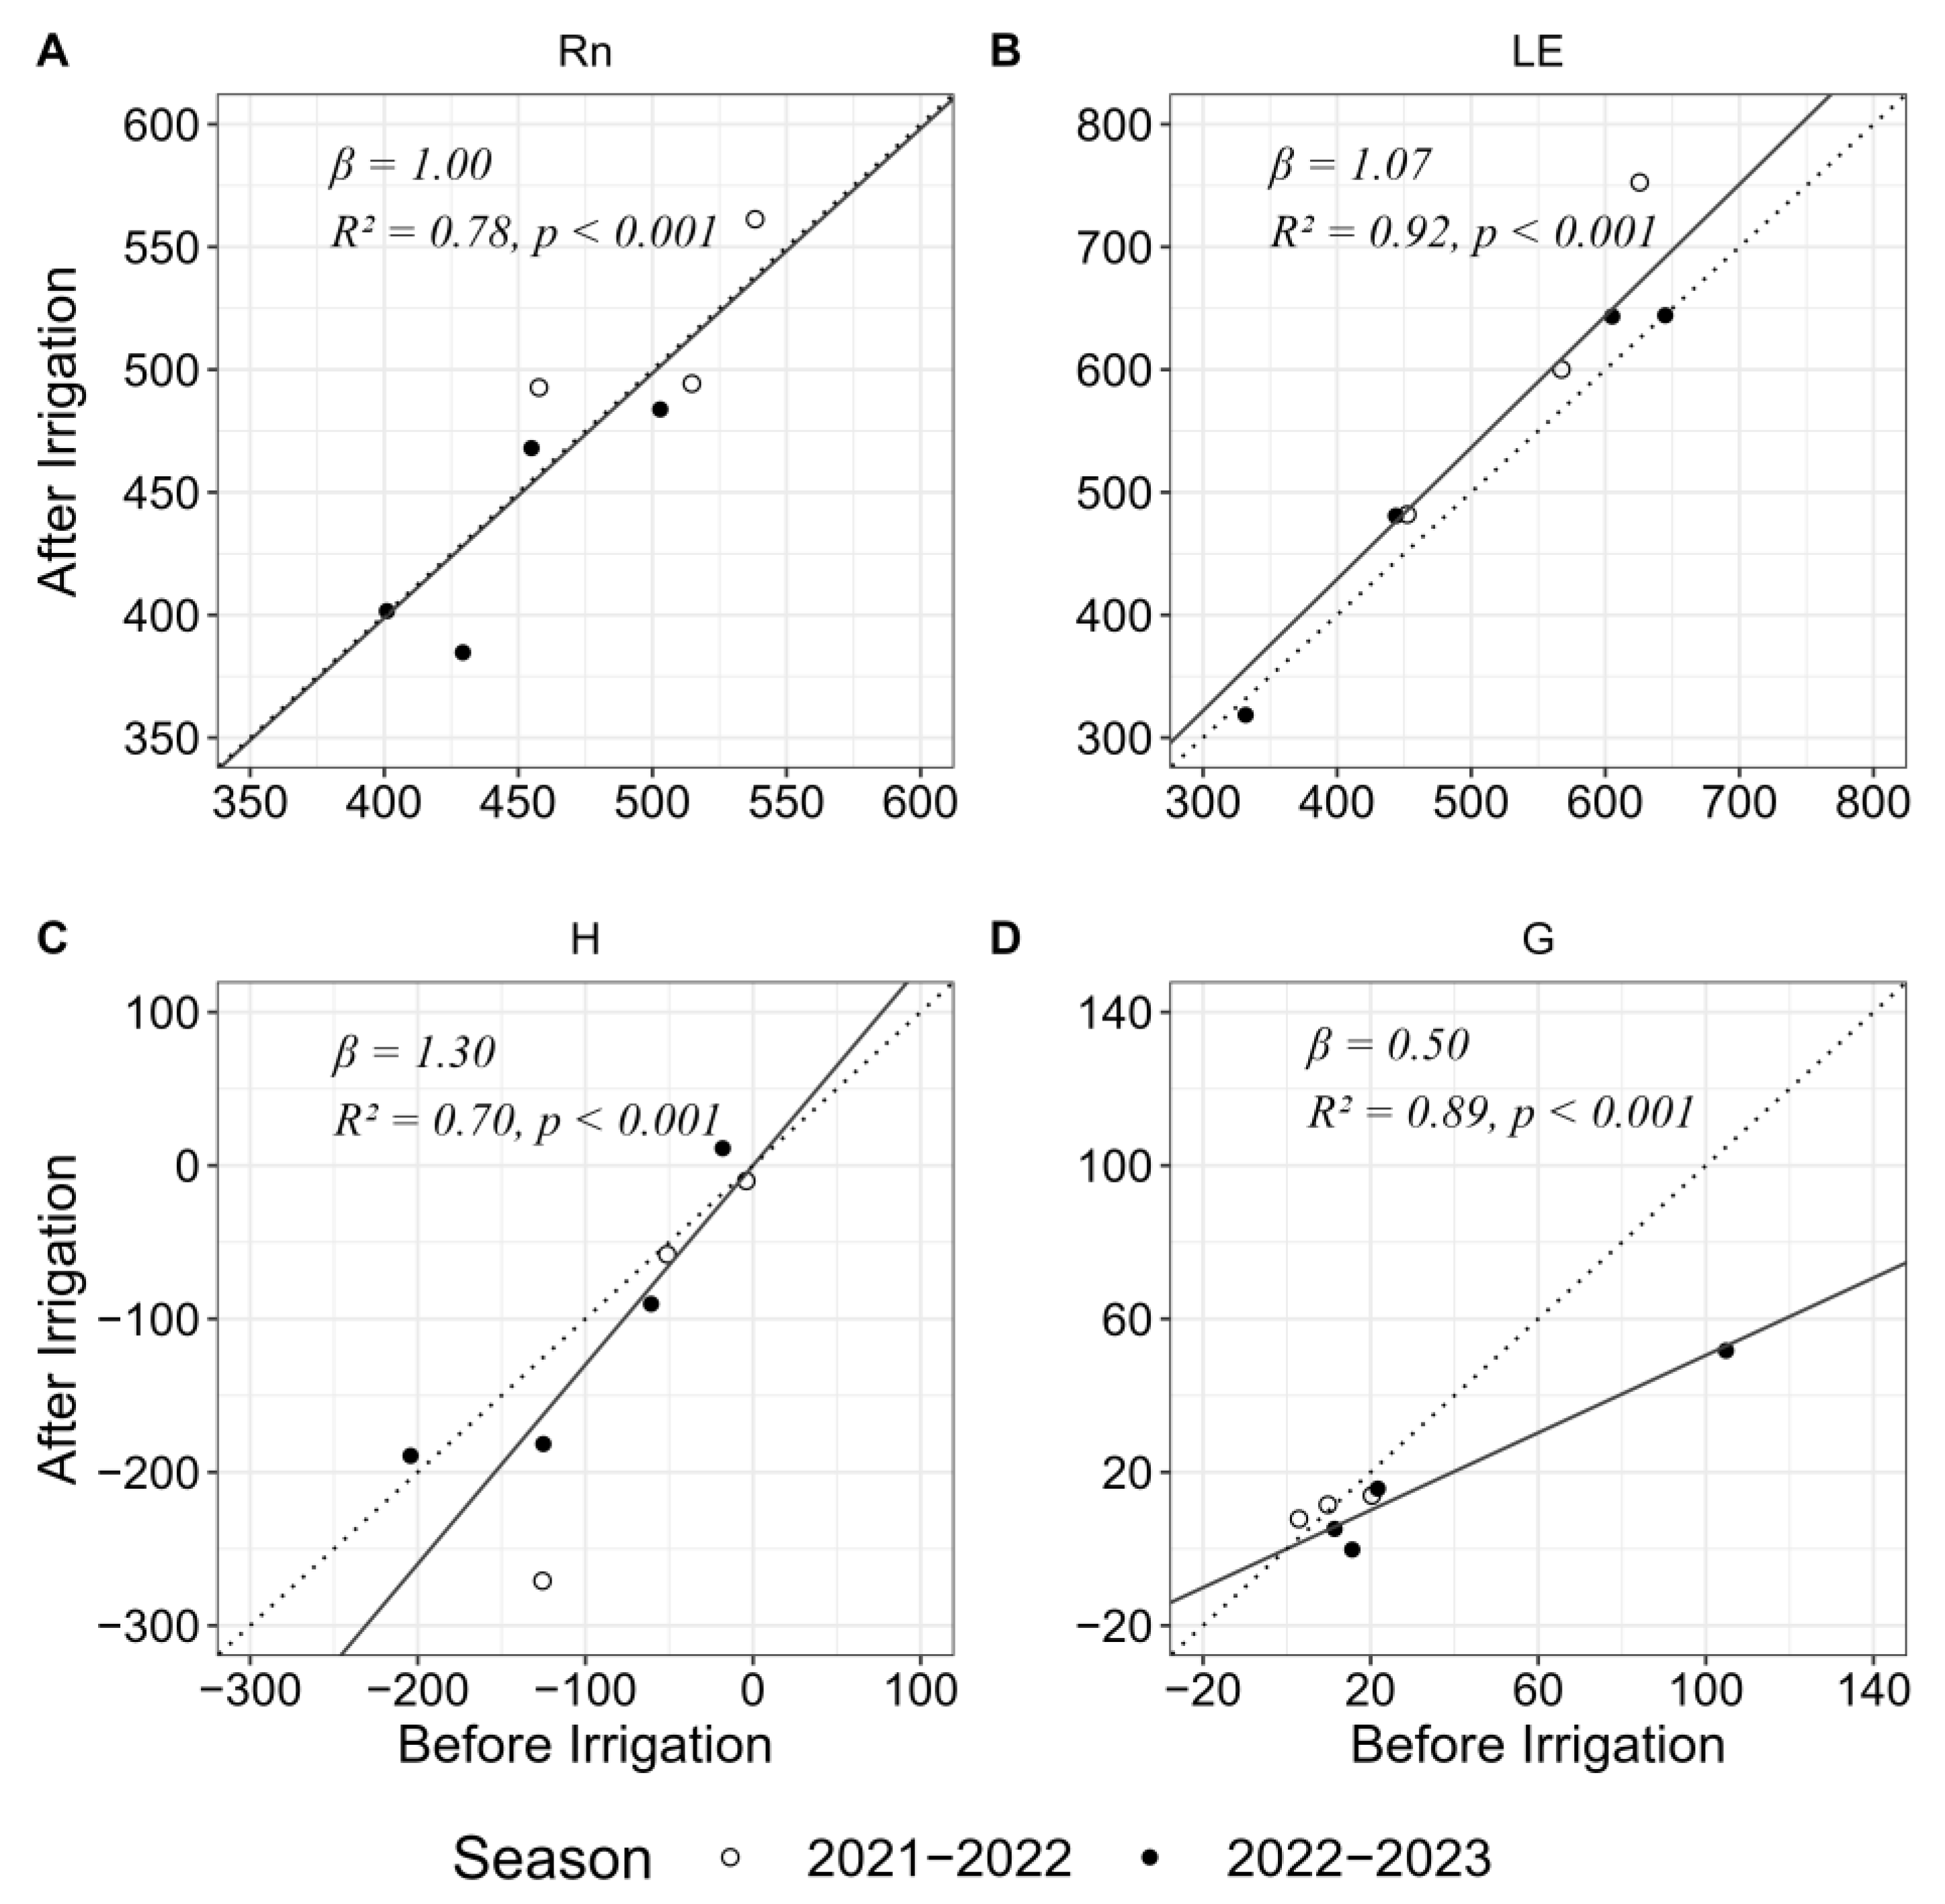
3.2. Evaporative Cooling Effect

The wheat field exhibited a noteworthy cooling trend during each growing season. In the 2021–2022 season, daily maximum temperatures observed at a height of 2 m were lower at the micrometeorological station than at the nearby Dongola meteorological station (Table 1, Figure 3); this difference indicated the modification of the microclimate in the wheat field. In the first half of February, the mean temperature showed a significant cooling effect of 2.5 °C on average (p ≤ 0.05). In both the first and second half of March, the wheat field experienced further cooling (p ≤ 0.05); during these periods, the mean temperature in the field was 5.3 °C and 2.5 °C, respectively, which was lower than in the surrounding area.
In the 2022–2023 season, temperatures were also lower in the wheat field than in the surrounding area (Table 1, Figure 3). The wheat field showed a significant cooling effect of 5.7 °C and 3.5 °C in the first half of February and in March, respectively (p ≤ 0.05). However, no significant cooling effect was observed in either the second half of January or in February or March (p > 0.05).

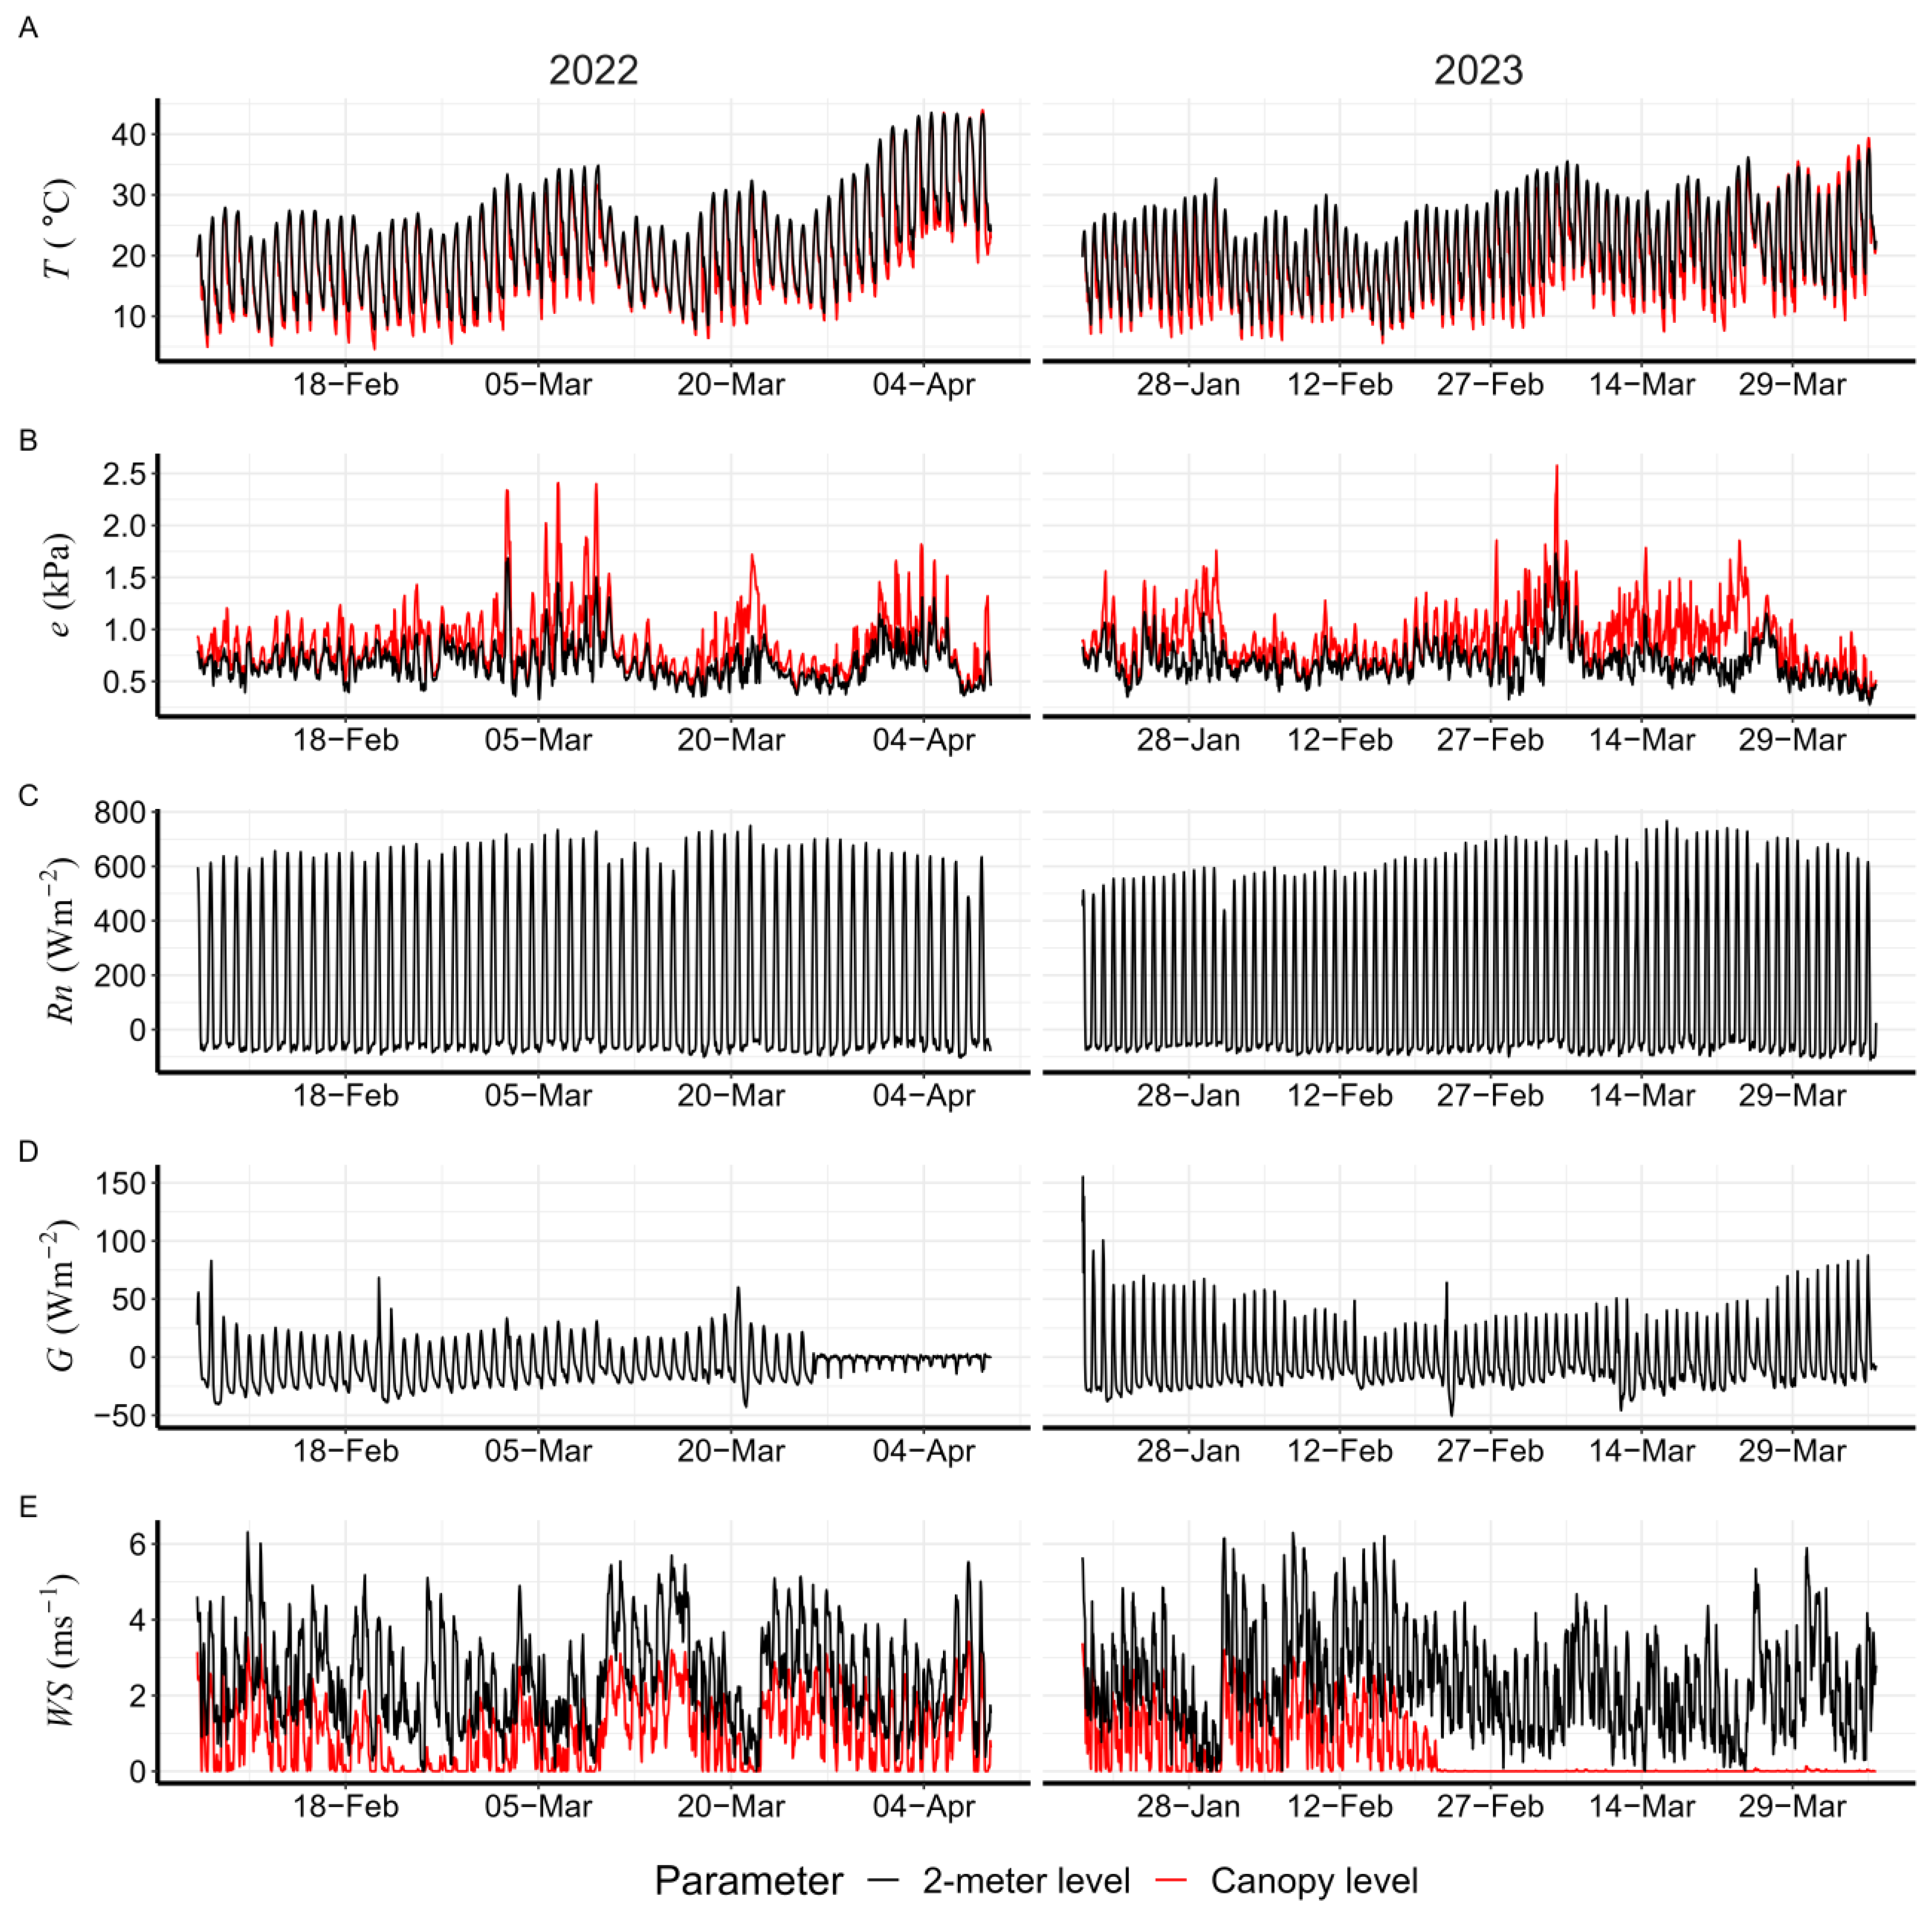
3.3. Seasonal Changes in Micrometeorological Parameters

Figure 4 shows the seasonal changes in the 10 min air temperature (T), water vapor pressure (e), net radiation (Rn), soil heat flux (G), and wind speed (WS). T at the canopy level was generally lower than at a height of 2 m during the daytime (hours 8–15) throughout the measurement periods. In both seasons, a large (4 °C) difference between the two heights was observed in March; the maximum 2 m temperature during March reached 39.4 °C in the 2021–2022 season and 36.6 °C in the 2022–2023 season. In contrast, vapor pressure (e) was higher at the canopy level than at a height of 2 m. WS at a height of 2 m was high during the daytime, averaging 3.4 m s−1 in both seasons, and the maximum WS was observed in February. The wind direction was generally northerly (in all cases between northeast and northwest). In both seasons, Rn increased sharply in the morning, peaked around midday (to a maximum of 749 W m−2 in 2021–2022 and 767 W m−2 in 2022–2023), and then decreased in the afternoon. G was negative in the early morning and late afternoon, and its peak was observed around midday (maximum of 83 W m−2 in 2021–2022 and 155 W m−2 in 2022–2023).

3.4. Energy Balance

The Bowen ratio (BR) was mostly negative throughout the growing season (92.2% and 93.1% of the time in 2021–2022 and 2022–2023, respectively); it was lower in the early morning and in the late afternoon than around midday, and it tended to decrease after irrigation (Figure 5). The soil moisture content was constant during the days before and after irrigation, but it was higher after irrigation than before irrigation. In both seasons, LE was higher than Rn during most daytime hours, particularly when the crop canopy was fully developed in late February to early March (Figure 5). The difference between LE and Rn was larger on the days after irrigation than on the days before irrigation. Because of the negative BR, H was also negative and large; thus, energy was transferred from the atmosphere to the canopy, particularly in the afternoon. In contrast, H tended to be low early and late in the season (late January, early February, and late March). With regard to the partition of energy for evapotranspiration, in the 2021–2022 season, the radiation-driven (= (Rn − G)/LE) and air-driven (= −H/LE) parts of LE decreased from 0.95 to 0.85 and increased from −0.05 to −0.14, respectively, after irrigation (averaged over hours 10–13 on the four days). In the 2022–2023 season, (Rn − G)/LE decreased slightly from 0.88 to 0.86, but −H/LE increased considerably from −0.08 to −0.33.
Figure 6 shows the relationships of the energy balance components averaged over hours 8–15 between the days before and after the dates of irrigation. Strong positive relationships were observed for Rn (R2 = 0.78), LE (R2 = 0.92), H (R2 = 0.70), and G (R2 = 0.89) between the days before and after irrigation. Rn showed no change after irrigation; the regression line had a slope (β) of one and lay on the 1:1 line. LE increased after irrigation; the regression line had a slope greater than one and was plotted above the 1:1 line. H also increased after irrigation because the regression line had a slope greater than one. G decreased after irrigation because the slope of the regression line was much less than one.

4. Discussion

Seasonal changes in the NDVI reflect the dynamic nature of crop growth and development. As shown in this study, particularly in February and the first half of March (Figure 2), the variations in the NDVI indicate a strong relationship between crop growth stages and environmental factors such as heat stress, drought stress, and biotic stress [36,37,38,39,40]. Our study found differences in the NDVI between two growing seasons that might be attributable to variations in the growth environment. In both seasons, however, the typical change in the NDVI consistently depicted a healthy canopy because the field was fully irrigated. This finding aligns with those of previous studies that highlight the positive effect of irrigation on crop health and productivity [10,20,41]. Variations in the energy balance components during the growing season (Figure 5) could be attributed to a seasonal change in the canopy size (i.e., NDVI) because an increased leaf area has been reported to alter energy fluxes above a canopy [17].
A localized cooling effect generated by well-watered cropland was observed in the study area (Dongola, Sudan), with variations in the magnitudes of cooling across different growth stages (Table 1, Figure 3). The most pronounced cooling effect observed was a difference of over 5 °C from the late vegetative to the early reproductive stages; as a result, the wheat was grown under relatively cooler conditions than the surrounding environment. Many previous studies reported a similar cooling effect [19,20,21,24], but our study is one of the first to report micrometeorological observations that demonstrate irrigation cooling in a hot desert region where sensible heat advection occurs. The shield against heat stress provided by a cooling microclimate is critical for preserving crop reproductive processes [42]. In addition, microclimate modifications are associated with enhanced water use efficiency because they reduce the evaporative loss of moisture from the soil and foster atmospheric conditions that are more conducive to evapotranspiration [43]. These findings underline the vital role of irrigation in mitigating the adverse impact of heat stress and improving overall crop health in arid regions. In deserts, this microclimate cooling is known as the oasis effect, which is attributed to a combination of factors, including increased evapotranspiration, shading from dense vegetation, and the presence of water bodies [44,45,46,47,48,49,50,51,52].
The comparison between the energy balance components, particularly the latent heat flux (LE) and sensible heat flux (H), between the days before and after irrigation (Figure 5 and Figure 6) provides valuable insights into crop performance. The hot, dry conditions before irrigation caused a significant portion of the energy to be allocated to evapotranspiration (i.e., LE), and this energy allocation was efficient for transpiration and, therefore, crop growth. However, the decrease in the negative Bowen ratio (BR) after irrigation indicated the increased allocation of H to evapotranspiration. This energy reallocation emphasizes the importance of irrigation in maintaining optimal crop conditions in hot arid environments. In addition, the relative stability of BR throughout the growing season shown in this study indicates an absence of soil moisture stress [53]. It also indicates that LE exceeds net radiation (Rn) because of sensible heat advection from the surrounding environment [11,54]. The increase in Rn after irrigation on 20 February 2022, 20 March 2022, and 22 February 2023 (Figure 5) might be attributable to changes in albedo or increases in the water vapor caused by the increased soil moisture [55].
Another critical facet of this study involves the soil heat flux (G) and its relationship with the soil environment. Our study demonstrated that G was lower during the main growth period (from the late vegetative to the early reproductive stages) and higher during the initial (early vegetative) and maturity (late reproductive) stages (Figure 5). A similar result was reported in a hot environment in India in the humid subtropical climate zone [56]. Also, the distinct change in G observed following each irrigation event (Figure 6) is primarily attributable to alterations in the soil moisture content and, therefore, the thermal properties of the soil [57]. This dynamic interaction reflects the role of soil as a mediating factor in the energy balance of a flood-irrigated wheat field. Interestingly, the response of wheat to high soil temperature is different between cultivars [58], indicating that the thermal environment of the soil is important for cultivar improvement in hot arid regions.

5. Conclusions

The energy balance of wheat grown under irrigation in the hot, arid environment of Sudan was investigated during two growing seasons. An evaporative cooling effect was observed as a significant difference in air temperature between the field and the surrounding desert area. This difference increased after the crop reached full canopy cover because LE was the dominant component of the energy balance over the other components, which were H and G. This dominance of LE stabilized the BR during the daytime; thus, growing conditions were favorable and abiotic stress due to a soil moisture deficit did not occur. Furthermore, the negative of the BR due to sensible heat advection during the growing period in the study area meant that H was negative and, hence, LE was larger than Rn. Our study thus provides insight into the use of micrometeorological analysis to quantify the response of irrigated wheat to a hot, arid environment. As global temperatures continue to rise as a result of climate change, the irrigation cooling effect will become more crucial in wheat-producing areas in hot, dry environments. The findings of this study will, therefore, be useful for understanding soil–plant–atmosphere interactions in such environments.

Author Contributions

Conceptualization, A.A.A.M. and M.T.; methodology, A.A.A.M. and M.T.; data analysis, A.A.A.M.; writing—original draft preparation, A.A.A.M.; writing—review and editing, A.A.A.M., M.T., Y.K. and Y.I. All authors have read and agreed to the published version of the manuscript.

Funding

This research was funded by the Science and Technology Research Partnership for Sustainable Development, Japan Science and Technology Agency/Japan International Cooperation Agency (JPM-JSA1805).

Institutional Review Board Statement

Not applicable.

Informed Consent Statement

Not applicable.

Data Availability Statement

The data presented in this study are available on request from the corresponding author. The data are not publicly available due to the ongoing research.

Conflicts of Interest

The authors declare no conflict of interest. Almutaz Abdelkarim Abdelfattah Mohammed is an employee of the Agricultural Research Corporation. The company had no roles in the design of the study; in the collection, analysis, or interpretation of data; in the writing of the manuscript, or in the decision to publish the articles. The paper reflects the views of the scientists and not the company.

References

  1. Foley, J.A.; DeFries, R.; Asner, G.P.; Barford, C.; Bonan, G.; Carpenter, S.R.; Chapin, F.S.; Coe, M.T.; Daily, G.C.; Gibbs, H.K.; et al. Global Consequences of Land Use. Science 2005, 309, 570–574. [Google Scholar] [CrossRef]
  2. Ferris, R.; Ellis, R.H.; Wheeler, T.R.; Hadley, P. Effect of High Temperature Stress at Anthesis on Grain Yield and Biomass of Field-Grown Crops of Wheat. Ann. Bot. 1998, 82, 631–639. [Google Scholar] [CrossRef]
  3. Hussain, H.A.; Men, S.; Hussain, S.; Chen, Y.; Ali, S.; Zhang, S.; Zhang, K.; Li, Y.; Xu, Q.; Liao, C.; et al. Interactive Effects of Drought and Heat Stresses on Morpho-Physiological Attributes, Yield, Nutrient Uptake and Oxidative Status in Maize Hybrids. Sci. Rep. 2019, 9, 3890. [Google Scholar] [CrossRef]
  4. Ray, D.K.; Gerber, J.S.; MacDonald, G.K.; West, P.C. Climate Variation Explains a Third of Global Crop Yield Variability. Nat. Commun. 2015, 6, 5989. [Google Scholar] [CrossRef]
  5. Asseng, S.; Ewert, F.; Martre, P.; Rötter, R.P.; Lobell, D.B.; Cammarano, D.; Kimball, B.A.; Ottman, M.J.; Wall, G.W.; White, J.W.; et al. Rising Temperatures Reduce Global Wheat Production. Nat. Clim. Chang. 2015, 5, 143–147. [Google Scholar] [CrossRef]
  6. Asseng, S.; Cammarano, D.; Basso, B.; Chung, U.; Alderman, P.D.; Sonder, K.; Reynolds, M.P.; Lobell, D.B. Hot Spots of Wheat Yield Decline with Rising Temperatures. Glob. Chang. Biol. 2017, 23, 2464–2472. [Google Scholar] [CrossRef]
  7. Wheeler, T.; von Braun, J. Climate Change Impacts on Global Food Security. Science 2013, 341, 508–513. [Google Scholar] [CrossRef]
  8. Musa, A.I.I.; Tsubo, M.; Ali-Babiker, I.E.A.; Iizumi, T.; Kurosaki, Y.; Ibaraki, Y.; El-Hag, F.M.A.; Tahir, I.S.A.; Tsujimoto, H. Relationship of Irrigated Wheat Yield with Temperature in Hot Environments of Sudan. Theor. Appl. Climatol. 2021, 145, 1113–1125. [Google Scholar] [CrossRef]
  9. Ghafarian, F.; Wieland, R.; Nendel, C. Estimating the Evaporative Cooling Effect of Irrigation within and above Soybean Canopy. Water 2022, 14, 319. [Google Scholar] [CrossRef]
  10. Thiery, W.; Davin, E.L.; Lawrence, D.M.; Hirsch, A.L.; Hauser, M.; Seneviratne, S.I. Present-Day Irrigation Mitigates Heat Extremes. J. Geophys. Res. Atmos. 2017, 122, 1403–1422. [Google Scholar] [CrossRef]
  11. Luchiari, A., Jr.; Riha, S.J.; Gomide, R.L. Energy Balance in Irrigated Wheat in the Cerrados Region of Central Brazil. Sci. Agric. 1997, 54, 78–88. [Google Scholar] [CrossRef]
  12. Li, Y.; Guan, K.; Peng, B.; Franz, T.E.; Wardlow, B.; Pan, M. Quantifying Irrigation Cooling Benefits to Maize Yield in the US Midwest. Glob. Chang. Biol. 2020, 26, 3065–3078. [Google Scholar] [CrossRef] [PubMed]
  13. Sacks, W.J.; Cook, B.I.; Buenning, N.; Levis, S.; Helkowski, J.H. Effects of Global Irrigation on the Near-Surface Climate. Clim. Dyn. 2009, 33, 159–175. [Google Scholar] [CrossRef]
  14. Bonfils, C.; Lobell, D. Empirical Evidence for a Recent Slowdown in Irrigation-Induced Cooling. Proc. Natl. Acad. Sci. USA 2007, 104, 13582–13587. [Google Scholar] [CrossRef]
  15. Zhu, P.; Burney, J. Untangling Irrigation Effects on Maize Water and Heat Stress Alleviation Using Satellite Data. Hydrol. Earth Syst. Sci. 2022, 26, 827–840. [Google Scholar] [CrossRef]
  16. Liu, G.; Wang, W. Irrigation-Induced Crop Growth Enhances Irrigation Cooling Effect Over the North China Plain by Increasing Transpiration. Water Resour. Res. 2023, 59, e2022WR034142. [Google Scholar] [CrossRef]
  17. Hammerle, A.; Haslwanter, A.; Tappeiner, U.; Cernusca, A.; Wohlfahrt, G. Leaf Area Controls on Energy Partitioning of a Temperate Mountain Grassland. Biogeosciences 2008, 5, 421–431. [Google Scholar] [CrossRef]
  18. Liu, X.; Xu, J.; Yang, S.; Lv, Y. Surface Energy Partitioning and Evaporative Fraction in a Water-Saving Irrigated Rice Field. Atmosphere 2019, 10, 51. [Google Scholar] [CrossRef]
  19. Kang, S.; Eltahir, E.A.B. Impact of Irrigation on Regional Climate Over Eastern China. Geophys. Res. Lett. 2019, 46, 5499–5505. [Google Scholar] [CrossRef]
  20. Kueppers, L.M.; Snyder, M.A.; Sloan, L.C. Irrigation Cooling Effect: Regional Climate Forcing by Land-Use Change. Geophys. Res. Lett. 2007, 34, L03703. [Google Scholar] [CrossRef]
  21. Ozdogan, M.; Rodell, M.; Beaudoing, H.K.; Toll, D.L. Simulating the Effects of Irrigation over the United States in a Land Surface Model Based on Satellite-Derived Agricultural Data. J. Hydrometeorol. 2010, 11, 171–184. [Google Scholar] [CrossRef]
  22. Bonan, G. Ecological Climatology: Concepts and Applications, 3rd ed.; Cambridge University Press: Cambridge, UK, 2015; ISBN 978-1-107-61905-0. [Google Scholar]
  23. Tang, X.; Liu, H.; Yang, L.; Li, L.; Chang, J. Energy Balance, Microclimate, and Crop Evapotranspiration of Winter Wheat (Triticum aestivum L.) under Sprinkler Irrigation. Agriculture 2022, 12, 953. [Google Scholar] [CrossRef]
  24. Jiang, L.; Ma, E.; Deng, X. Impacts of Irrigation on the Heat Fluxes and Near-Surface Temperature in an Inland Irrigation Area of Northern China. Energies 2014, 7, 1300–1317. [Google Scholar] [CrossRef]
  25. Vote, C.; Hall, A.; Charlton, P. Carbon Dioxide, Water and Energy Fluxes of Irrigated Broad-Acre Crops in an Australian Semi-Arid Climate Zone. Environ. Earth Sci. 2015, 73, 449–465. [Google Scholar] [CrossRef]
  26. Siebert, S.; Webber, H.; Zhao, G.; Ewert, F. Heat Stress Is Overestimated in Climate Impact Studies for Irrigated Agriculture. Environ. Res. Lett. 2017, 12, 054023. [Google Scholar] [CrossRef]
  27. Gardner, A.S.; Maclean, I.M.D.; Gaston, K.J.; Bütikofer, L. Forecasting Future Crop Suitability with Microclimate Data. Agric. Syst. 2021, 190, 103084. [Google Scholar] [CrossRef]
  28. Bowen, I.S. The Ratio of Heat Losses by Conduction and by Evaporation from Any Water Surface. Phys. Rev. 1926, 27, 779–787. [Google Scholar] [CrossRef]
  29. Mohammed, A.A.A.; Tsubo, M.; Ma, S.; Kurosaki, Y.; Ibaraki, Y.; Tahir, I.S.A.; Gorafi, Y.S.A.; Idris, A.A.M.; Tsujimoto, H. Micrometeorological Comparison of Canopy Temperature between Two Wheat Cultivars Grown under Irrigation in a Hot Environment in Sudan. Agronomy 2023, 13, 3032. [Google Scholar] [CrossRef]
  30. Rajaram, S.; Van Ginkel, M.; Fischer, R. CIMMYT’s Wheat Breeding Mega-Environments (ME). In Proceedings of the 8th International Wheat Genetic Symposium, Beijing, China, 19–24 July 1993. [Google Scholar]
  31. Tahir, I.S.A.; Mustafa, H.; Elbashier, E. Agronomic Performance, Stability and Rust Resistance of Bread Wheat Genotypes under Optimum and Late Sowing Environments in Sudan: A Proposal for the Release of Four Bread Wheat Varieties. In Proceedings of the National Variety Release Committee, Khartoum, Sudan, 2 April 2018. [Google Scholar]
  32. Elbashir, A.A.E.; Gorafi, Y.S.A.; Tahir, I.S.A.; Elhashimi, A.M.A.; Abdalla, M.G.A.; Tsujimoto, H. Genetic Variation in Heat Tolerance-Related Traits in a Population of Wheat Multiple Synthetic Derivatives. Breed. Sci. 2017, 67, 483–492. [Google Scholar] [CrossRef]
  33. Allen, R.G.; Pereira, L.S.; Raes, D.; Smith, M. Crop Evapotranspiration-Guidelines for Computing Crop Water Requirements; FAO Irrigation and Drainage Paper 56; FAO: Rome, Italy, 1998. [Google Scholar]
  34. Kozak, A.; Kozak, R.A. Notes on Regression through the Origin. For. Chron. 1995, 71, 326–330. [Google Scholar] [CrossRef]
  35. R Core Team. R: A Language and Environment for Statistical Computing; R Core Team: Vienna, Austria, 2023. [Google Scholar]
  36. Raun, W.R.; Solie, J.B.; Johnson, G.V.; Stone, M.L.; Lukina, E.V.; Thomason, W.E.; Schepers, J.S. In-Season Prediction of Potential Grain Yield in Winter Wheat Using Canopy Reflectance. Agron. J. 2001, 93, 131–138. [Google Scholar] [CrossRef]
  37. Babar, M.A.; Reynolds, M.P.; van Ginkel, M.; Klatt, A.R.; Raun, W.R.; Stone, M.L. Spectral Reflectance Indices as a Potential Indirect Selection Criteria for Wheat Yield under Irrigation. Crop. Sci. 2006, 46, 578–588. [Google Scholar] [CrossRef]
  38. Hazratkulova, S.; Sharma, R.C.; Alikulov, S.; Islomov, S.; Yuldashev, T.; Ziyaev, Z.; Khalikulov, Z.; Ziyadullaev, Z.; Turok, J. Analysis of Genotypic Variation for Normalized Difference Vegetation Index and Its Relationship with Grain Yield in Winter Wheat under Terminal Heat Stress. Plant Breed. 2012, 131, 716–721. [Google Scholar] [CrossRef]
  39. Cabrera-Bosquet, L.; Molero, G.; Stellacci, A.M.; Bort, J.; Nogués, S.; Araus, J.L. NDVI as a Potential Tool for Predicting Biomass, Plant Nitrogen Content and Growth in Wheat Genotypes Subjected to Different Water and Nitrogen Conditions. Cereal Res. Commun. 2011, 39, 147–159. [Google Scholar] [CrossRef]
  40. Marti, J.; Bort, J.; Slafer, G.A.; Araus, J.L. Can Wheat Yield Be Assessed by Early Measurements of Normalized Difference Vegetation Index? Ann. Appl. Biol. 2007, 150, 253–257. [Google Scholar] [CrossRef]
  41. Zaveri, E.; Lobell, D.B. The Role of Irrigation in Changing Wheat Yields and Heat Sensitivity in India. Nat. Commun. 2019, 10, 4144. [Google Scholar] [CrossRef]
  42. Liu, H.-J.; Kang, Y. Regulating Field Microclimate Using Sprinkler Misting under Hot-Dry Windy Conditions. Biosyst. Eng. 2006, 95, 349–358. [Google Scholar] [CrossRef]
  43. Cavero, J.; Medina, E.T.; Puig, M.; Martínez-Cob, A. Sprinkler Irrigation Changes Maize Canopy Microclimate and Crop Water Status, Transpiration, and Temperature. Agron. J. 2009, 101, 854–864. [Google Scholar] [CrossRef]
  44. Flerchinger, G.N.; Pierson, F.B. Modeling Plant Canopy Effects on Variability of Soil Temperature and Water. Agric. For. Meteorol. 1991, 56, 227–246. [Google Scholar] [CrossRef]
  45. Taha, H.; Akbari, H.; Rosenfeld, A. Heat Island and Oasis Effects of Vegetative Canopies: Micro-Meteorological Field-Measurements. Theor. Appl. Clim. 1991, 44, 123–138. [Google Scholar] [CrossRef]
  46. Kai, K.; Matsuda, M.; Sato, R. Oasis Effect Observed at Zhangye Oasis in the Hexi Corridor, China. J. Meteorol. Soc. Japan. Ser. II 1997, 75, 1171–1178. [Google Scholar] [CrossRef]
  47. Kotzen, B. An Investigation of Shade under Six Different Tree Species of the Negev Desert towards Their Potential Use for Enhancing Micro-Climatic Conditions in Landscape Architectural Development. J. Arid Environ. 2003, 55, 231–274. [Google Scholar] [CrossRef]
  48. Robitu, M.; Musy, M.; Inard, C.; Groleau, D. Modeling the Influence of Vegetation and Water Pond on Urban Microclimate. Sol. Energy 2006, 80, 435–447. [Google Scholar] [CrossRef]
  49. Hagishima, A.; Narita, K.; Tanimoto, J. Field Experiment on Transpiration from Isolated Urban Plants. Hydrol. Process. 2007, 21, 1217–1222. [Google Scholar] [CrossRef]
  50. Potchter, O.; Goldman, D.; Kadish, D.; Iluz, D. The Oasis Effect in an Extremely Hot and Arid Climate: The Case of Southern Israel. J. Arid Environ. 2008, 72, 1721–1733. [Google Scholar] [CrossRef]
  51. Manteghi, G.; Limit, H.; Remaz, D. Water Bodies an Urban Microclimate: A Review. Mod. Appl. Sci. 2015, 9, p1. [Google Scholar] [CrossRef]
  52. Xiong, Y.; Zhao, S.; Yin, J.; Li, C.; Qiu, G. Effects of Evapotranspiration on Regional Land Surface Temperature in an Arid Oasis Based on Thermal Remote Sensing. IEEE Geosci. Remote Sens. Lett. 2016, 13, 1885–1889. [Google Scholar] [CrossRef]
  53. Yuan, G.; Zhang, L.; Liang, J.; Cao, X.; Liu, H.; Yang, Z. Understanding the Partitioning of the Available Energy over the Semi-Arid Areas of the Loess Plateau, China. Atmosphere 2017, 8, 87. [Google Scholar] [CrossRef]
  54. Tolk, J.A.; Evett, S.R.; Howell, T.A. Advection Influences on Evapotranspiration of Alfalfa in a Semiarid Climate. Agron. J. 2006, 98, 1646–1654. [Google Scholar] [CrossRef]
  55. Eltahir, E.A.B. A Soil Moisture–Rainfall Feedback Mechanism: 1. Theory and Observations. Water Resour. Res. 1998, 34, 765–776. [Google Scholar] [CrossRef]
  56. Mukherjee, J.; Bal, S.K.; Singh, G.; Bhattacharya, B.K.; Singh, H.; Kaur, P. Surface Energy Fluxes in Wheat (Triticum aestivum L.) under Irrigated Ecosystem. J. Agrometeorol. 2012, 14, 16–20. [Google Scholar] [CrossRef]
  57. Guan, X.; Huang, J.; Guo, N.; Bi, J.; Wang, G. Variability of Soil Moisture and Its Relationship with Surface Albedo and Soil Thermal Parameters over the Loess Plateau. Adv. Atmos. Sci. 2009, 26, 692–700. [Google Scholar] [CrossRef]
  58. Tahir, I.S.A.; Nakata, N.; Yamaguchi, T. Responses of Three Wheat Genotypes to High Soil Temperature during Grain Filling. Plant Prod. Sci. 2005, 8, 192–198. [Google Scholar] [CrossRef]
Figure 1. The location of the experimental field of wheat grown under irrigation in Dongola, Sudan, shown on Sentinel-2 satellite-based Normalized Difference Vegetation Index (NDVI) maps acquired on 1 March in 2022 and 2023.
Atmosphere 15 00018 g001
Figure 2. Seasonal changes in Sentinel-2 satellite-based NDVI values of the irrigated wheat field in Dongola, Sudan, in the 2021–2022 and 2022–2023 growing seasons.
Atmosphere 15 00018 g002
Figure 3. Seasonal changes in daily maximum temperature between the micrometeorological station (2 m height) in the irrigated wheat field and the nearby Dongola meteorological station in the (A) 2021–2022 and (B) 2022–2023 seasons.
Atmosphere 15 00018 g003
Figure 4. Seasonal changes in (A) air temperature (T), (B) water vapor pressure (e), (C) net radiation (Rn), (D) soil heat flux (G), and (E) wind speed (WS) in the irrigated wheat field in Dongola, Sudan, in the 2021–2022 and 2022–2023 seasons. The temperature, vapor pressure, and wind speed were measured at both a height of 2 m and at the canopy level.
Atmosphere 15 00018 g004
Figure 5. Daytime (hours 8 to 15) changes in the Bowen ratio (BR), energy balance components (net radiation (Rn), latent heat flux (LE), sensible heat flux (H), and soil heat flux (G)), and soil moisture content averaged over depths of 0.1 m to 0.2 m (VWC20) on the days before and after irrigation in the wheat field in Dongola, Sudan, in the (A) 2021–2022 and (B) 2022–2023 growing seasons. The irrigation dates are shown to the right of the panels.
Atmosphere 15 00018 g005
Figure 6. Relationships between the energy balance components averaged over hours 8–15 on the days before and after irrigation in the wheat field in Dongola, Sudan: (A) net radiation (Rn), (B) latent heat (LE), (C) sensible heat (H) and (D) soil heat (G). The linear regression analyses used the combined data of the 2021–2022 and 2022–2023 seasons, but the irrigation on 7 February 2022 was excluded because no data were available for hours 8–10 before irrigation.
Atmosphere 15 00018 g006
Table 1. Summary of daily maximum, minimum, and mean temperatures at the micrometeorological station (2 m level) of the irrigated wheat field and its nearby meteorological station in Dongola, Sudan. SD denotes standard deviation.
SeasonMonthPeriod of MonthMicrometeorological
Station in the Wheat Field (°C)
Dongola Meteorological
Station (°C)
Temperature Difference (°C)
MaxMinMeanSDMaxMinMeanSDMaxMinMean
2021–2022FebruarySecond28.521.725.41.931.824.427.91.93.32.72.5
MarchFirst34.822.529.84.436.830.535.11.72.08.05.3
MarchSecond39.223.730.04.036.528.632.52.3−2.74.92.5
2022–2023JanuarySecond32.724.027.82.228.321.125.12.5−4.4−2.9−2.7
FebruaryFirst30.020.924.92.732.129.630.60.72.18.75.7
FebruarySecond30.722.127.32.530.623.428.02.5−0.11.30.7
MarchFirst35.627.531.92.436.934.435.40.71.36.93.5
MarchSecond36.228.631.82.335.428.232.32.5−0.80.40.5
Disclaimer/Publisher’s Note: The statements, opinions and data contained in all publications are solely those of the individual author(s) and contributor(s) and not of MDPI and/or the editor(s). MDPI and/or the editor(s) disclaim responsibility for any injury to people or property resulting from any ideas, methods, instructions or products referred to in the content.

