Article

Proton-Transfer-Reaction Mass Spectrometry for Rapid Dynamic Measurement of Ethylene Oxide Volatilization from Medical Masks

National Research Center of Intelligent Equipment for Agriculture, Beijing Academy of Agriculture and Forestry Sciences, Beijing 100097, China
*
Author to whom correspondence should be addressed.
These authors contributed equally to this work.
Atmosphere 2024, 15(1), 114; https://doi.org/10.3390/atmos15010114
Submission received: 1 December 2023 / Revised: 13 January 2024 / Accepted: 16 January 2024 / Published: 18 January 2024
(This article belongs to the Section Air Quality and Human Health)

Abstract

:
Sterile medical masks are essential in preventing infectious diseases. However, the ethylene oxide contained within these masks is a class I carcinogen. The standard method for measuring ethylene oxide is gas chromatography-mass spectrometry, which is not fit with the dynamic process of human inhalation. Thus, the amount of ethylene oxide volatilized from masks and inhaled by users is unknown. In this work, ethylene oxide was detected by using proton-transfer-reaction mass spectrometry, which can measure volatile quantities in milliseconds. We found that ethylene oxide was volatilized from masks during use. Within the first minute, the ethylene oxide concentration decreased by 84.65%, and then the rate of reduction gradually slowed. After 5 min, all ethylene oxide was effectively volatilized, and the average mass of ethylene oxide inhaled was 299.02 μg. We investigated three methods to reduce the concentration of ethylene oxide in masks before use: natural airing, shaking the mask, and blowing the mask with a hair dryer. The hair dryer method produced the best results: the ethylene oxide concentration decreased by 88.3% after only 10 s. The natural airing method was the least effective: the ethylene oxide concentration decreased by 60.7% even after 3 h.

1. Introduction

The outbreak of coronavirus disease 2019 (COVID-19) in December 2019 had a significant impact on the global economy, culture, and society [1]. According to the World Health Organization, more than 500 million individuals worldwide have been infected with COVID-19, more than 6 million have died from COVID-19, and the number of new infections continues to grow at over 2 million per day. Many measures have been taken by countries around the world in an effort to control the number of infected individuals. This includes the wearing of masks as a low-cost preventive measure, which has proven effective in reducing the transmission rate of COVID-19 [2].
Ethylene oxide, one of the volatile organic compounds (VOCs) left in masks, has received particular attention as a carcinogen. Ethylene oxide acts as an active epoxy compound that inhibits the activity of microorganisms, blocks the reproduction and metabolism of microorganisms, and prevents their survival, resulting in the death of spores and bacteria. Because of these properties, it is widely used as a bactericide for disinfecting and sterilizing medical devices [3]. Since the 1990s, almost all medical devices in the United States have been sterilized with ethylene oxide steam [4]. However, ethylene oxide is a genotoxic compound. Inhaling a large amount of ethylene oxide over a short period can result in nausea, vomiting, dyspnea, coma, and other symptoms. If inhaled repeatedly, ethylene oxide damages motor nerves and the brain, which results in memory loss [5]. There is a substantial body of evidence supporting the theory that inhaled ethylene oxide contributes to the incidence of cancers in humans, specifically lymphatic hematopoietic cancers and female breast cancers [6,7]. Ethylene oxide has been identified by the International Agency for Research on Cancer as carcinogenic and mutagenic to humans, and has been classified as a class I carcinogen [8,9].
Currently, solid phase microextraction [10], gas chromatography [11], and gas chromatography–mass spectrometry (GC-MS) [12] are the most common methods for determining residual ethylene oxide levels in masks. And the GB 19083-2010 standard describes an analysis method for ethylene oxide via GC-FID with a packed column, which has a specific limit of 10 μg/g for face mask use [13], but the residual ethylene oxide in the mask is not completely volatilized and inhaled. Consequently, the detection result does not represent the amount inhaled by the mask wearer. Gas chromatography (GC) is complex and time-consuming, and dynamic determination of the concentration of ethylene oxide inhaled by the mask wearer is not possible. Therefore, it is necessary to develop a simple and rapid detection method for monitoring the residual amount of ethylene oxide in masks in a dynamic manner.
In recent years, proton-transfer-reaction mass spectrometry (PTR-MS) has gained popularity as a method for detecting trace VOCs. This method can detect concentrations of trace gases in milliseconds [14,15]. The analysis uses soft ionization, with initial reaction ions produced by an ion source then used to convert VOCs into single ions. The generated ions are then sent to a mass spectrometer at the end of the flow tube to determine their mass spectra and concentrations [16,17]. PTR-MS has a high resolution, low detection limit, and fast response time. Consequently, it is capable of monitoring VOCs in real time. PTR-MS is commonly applied to dynamic monitoring of VOCs released during human respiration. As an example, continuous monitoring of VOCs in the nasal cavity has been used to assess the effects of physiological parameters, ethnicity, and gender on chewing gum flavor perception and flavor release [18]. In another study, online monitoring of VOCs exhaled by subjects during sleep showed that changes in VOCs are related to the stage of sleep. The role of intestinal flora in the human body can also be investigated by using the changes in VOC concentrations in exhaled air [19]. PTR-MS is also widely used in the fields of indoor air quality dynamic monitoring [20], atmospheric air quality measurement [21,22], plant volatile matter detection [23,24], food volatile component change [25,26], medical disease discrimination [27,28], investigation of soil volatiles [29,30], etc.
In this study, we performed quantitative online measurements of residual ethylene oxide in masks by using PTR-MS. The first step in the study was to detect the amount of ethylene oxide in four brands of sterilized disposable medical masks, calculate the amount of ethylene oxide inhaled by the mask wearer during use, and evaluate the health risks associated with ethylene oxide inhalation from wearing masks. Secondly, with consideration of practicality for daily life, three methods for reducing the concentration of ethylene oxide in masks were examined. These methods were natural airing, shaking the mask, and blowing air on the mask by using a hair dryer. The results of this study will help mask manufacturers and regulators better understand the effects of residual ethylene oxide in masks on human health.

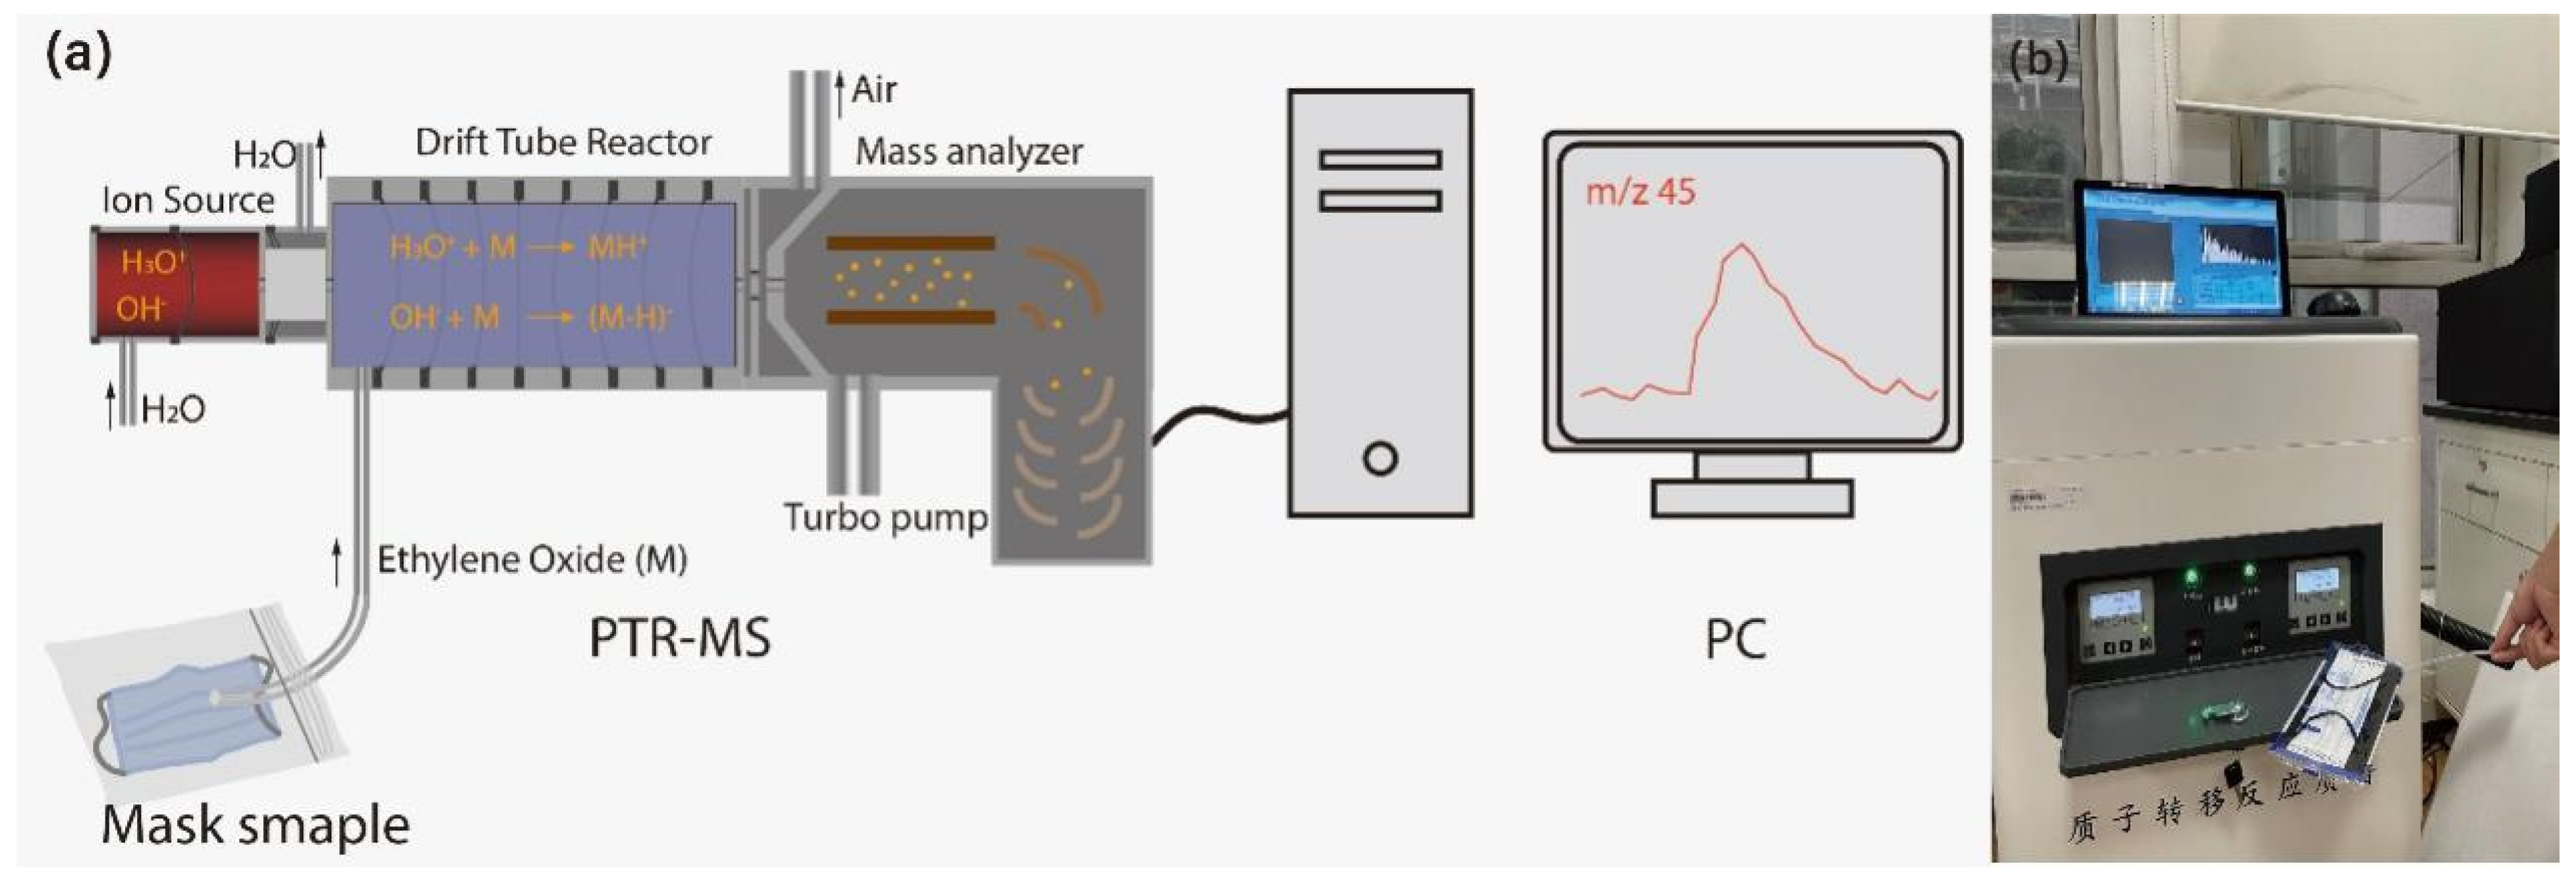
2. Materials and Methods

2.1. Materials

The experimental group included five brands of disposable medical masks, four of which were sterilized with ethylene oxide. The ethylene oxide-sterilized masks from the different brands are referred to as groups A, B, C, and D. The masks in group D are designed specifically for children. The masks that were not sterilized with ethylene oxide are referred to as group E. The masks were individually packaged. Table 1 provides details for the sources of the masks. The masks were purchased from e-commerce platforms.
This study examined healthy volunteers to assess changes in oxirane concentrations and oxirane during the wearing process. These volunteers in the age range of 8–32 years had no major organ diseases, no cognitive or communication impairments, and no respiratory problems. The demographic data of healthy subjects are shown in Table 2. The 6 subjects consisted of 4 men and 2 women, with a mean age of 18.8 years (minimum age 8 years, maximum age 32 years), and all subjects had no history of smoking. All subjects began wearing the device at 3 p.m. on the same day. No ethylene oxide has been detected in exhaled gases from healthy subjects in the literature, so VOC in human exhaled gases had no effect on this study.
To evaluate changes in the ethylene oxide concentration and the amount of ethylene oxide inhaled during wearing, the mask samples were treated as follows. First, before using the mask, we took three samples from each group, totaling fifteen masks, to detect the residual ethylene oxide concentration. Next, three volunteers (male, twenty-eight years old; male, thirty-two years old; female, twenty-five years old) were randomly selected to take one mask sample from group A each. After wearing for one minute, the three samples were stored in separate reclosable bags (14 cm × 20 cm), and the bags were flattened before sealing to exhaust the air in the bags. Three volunteers then each wore a group A mask for two minutes and then removed it and kept it in a reclosable bag (14 cm × 20 cm). Next, three volunteers each wore one more group A mask for 3, 4 and 5 min, then removed it and kept it in a reclosable bag (14 cm × 20 cm). These fifteen masks after wearing were used as the experimental sample of group A. According to this method, the masks in groups B, C, D and E were treated identically, in which three child volunteers (male, eight years old; female, ten years old; and male, ten years old) were selected to wear the masks in group D. Because group D was a special mask for children. All volunteers were informed of the above experimental protocol and experimental content.
To determine whether different treatment methods before wearing affected the concentration of ethylene oxide in the mask, the masks were treated as follows. For the natural airing method, three samples from each of the groups A–D were unpacked and left at room temperature (25 °C) for 1, 2, or 3 h. The masks were then placed in separate reclosable bags (14 cm × 20 cm), and the bags were flattened before sealing to exhaust the air in the bags. These samples were used to study the change in the ethylene oxide concentration in the masks over time with natural airing. For the shaking method, three volunteers were randomly selected to shake their masks. In a room-temperature environment (25 °C), three adult volunteers (male, twenty-eight years old; male, thirty-two years old; female, twenty-five years old) each took one mask from group A and saved it after shaking it 10 times at a frequency of once per second, followed by another mask from group A which was saved after it was shaken 20 times, and finally, another mask from group A which was saved after it was shaken 30 times. These masks served as experimental samples for group A masks. The same treatment was applied to the masks in groups B, C, D, and E. For group D, three children (male, eight years old; female, ten years old; male, ten years old) participated in the treatment process. After shaking, the above masks were placed in self-sealing bags and flattened before sealing. For the hair drying method, three samples from each group of masks were taken and blown with a hair dryer at a speed of 5 m/s for 10 s under the cold air condition. We then took three samples of each group of masks and blew them for 20 s under the same conditions, followed by three samples for each group of masks, blowing them for 30 s under the same conditions. As soon as the masks had been blown, they were placed in separate reclosable bags (14 cm × 20 cm), which were flattened to remove any residual air in the bags before they were sealed. In this study, we sealed each collected mask sample in a reclosable bag and left it for 30 min before sending it to PTR-MS for testing.

2.2. Methods

We used a mass spectrometer (YWHJ-MP-510, Hefei Institutes of Physical Science, Chinese Academy of Science, Hefei, China) with PTR-MS technology to detect VOCs in this experiment (Figure 1). The mass spectrometer was equipped with a quadrupole mass spectrometer, and the ion source was hydrated hydrogen ions (H3O+). In PTR-MS, water vapor was discharged through a hollow cathode to produce reactant ions H3O+, which were then injected into the drift tube. Following pumping into the drift tube, the VOCs in the masks underwent a reaction with H3O+. The substance molecule X in the gas can undergo a proton-transfer reaction with H3O+ when its proton affinity exceeds that of H2O (Equation (1)). The XH+ generated by the reaction was introduced into the vacuum chamber and detected by using a quadrupole mass spectrometer, which can determine the composition of substances with a concentration below the detection limit of ppbv. Based on the established kinetic equation of ionic molecular reactions, the absolute concentration of X was determined.
X + H 3 O X H + H 2 O
During the experiment, the data acquisition mode was set to the multi-ion mode, the range of characteristic ion mass charge ratio for the detection of the mask was set to 21~140, the scanning time was set to 500 ms, and the air intake flow rate was 6 mL/min. When the sample inlet of the mass spectrometer was inserted into the reclosable bag containing the mask sample prepared previously, we continuously extracted the gas from the bag for five minutes and measured the full spectrum of the gas extracted from the bag.

2.3. Volume of Ethylene Oxide Inhaled

We calculated the mass of ethylene oxide (EM) inhaled by the wearer for different brands of masks as follows:
E M = S × V P
where EM (g) represents the amount of ethylene oxide exhaled by the human body during wearing of a mask, S (ppbv/min) represents the decrease in concentration of ethylene oxide in time t (min), V (L) represents the amount of gas exhaled by the human body when breathing calmly for time t (min), and P represents the ratio of the decrease in concentration of ethylene oxide in the mask during time t (min) to its initial concentration.
The average healthy adult breathes twelve times in one minute at rest, inhaling and exhaling approximately 500 mL of gas each time [31]. Therefore, the volume of gas inhaled in one minute is approximately 6 L. In this experiment, we used a time resolution of one minute for detecting the change in ethylene oxide concentration in the mask when wearing. Therefore, Equation (2) can be rewritten as
E M = S t × 6 t P t
where St (ppbv/min) is the change in ethylene oxide concentration in the mask at time t (min), 6t (L) is the volume of gas inhaled at time t (min), and Pt is the ratio of the change in ethylene oxide concentration in the mask at time t (min) to the initial value. The equation calculates the maximum amount of ethylene oxide that can be inhaled without considering the diffusion of ethylene oxide from the mask, or the reduction in ethylene oxide concentration during exhalation when wearing.

3. Results and Discussion

3.1. Identification of Ethylene Oxide

The VOCs in the five kinds of masks were measured by PTR-MS. The results showed that, excluding group E, the mass spectra of gases in the group A-D masks were almost the same. This indicates that the gas components in the sterilization mask are basically the same. In the full spectrum of the mask, impurity ions mainly include NO+, O2+, and H3O+(H2O), and their mass charge ratios (m/z) are 30, 32, and 37, respectively. According to previous studies, the mass charge ratio (m/z) at 73, 81, 99, and 117 comes from hydrocarbons in gas. The ion signal strength at the mass charge ratio (m/z) of 45 comes from C2H5O+ generated by ethylene oxide and H3O+ [32].
In addition, in the results of a non-targeted analysis of unknown volatile chemicals in medical masks, ethanol was found to have the highest detection rate of 70% of the volatiles except for alkanes and was also found to be present in higher concentrations in masks [33]. In a guide to compounds for proton-transfer-reaction mass spectrometry (PTR-MS), it is mentioned that acetaldehyde, ethylene oxide, and propane may be present at m/z 45 [34]; however, acetaldehyde and propane were not detected in the above-mentioned tests for mask volatiles, so the signal strength at m/z 45 is made up of ethanol and ethylene oxide signals. Three substances (formic acid, ethanol, dimethyl ether methyl hydrazine) that might be present at m/z 47 were not detected in mask volatiles except ethanol. We sampled the headspace gas produced by 10 mL absolute ethanol and mixed it with 40 mL air, then sent it to the PTR-MS instrument for detection. The result showed that the signal intensity ratio of m/z 45 to m/z 47 was 0.13. Therefore, in order to eliminate the oxirane interference caused by the ethanol signal at m/z 45, we used the signal difference between m/z 45 and 13% m/z 47 as the concentration of ethylene oxide.

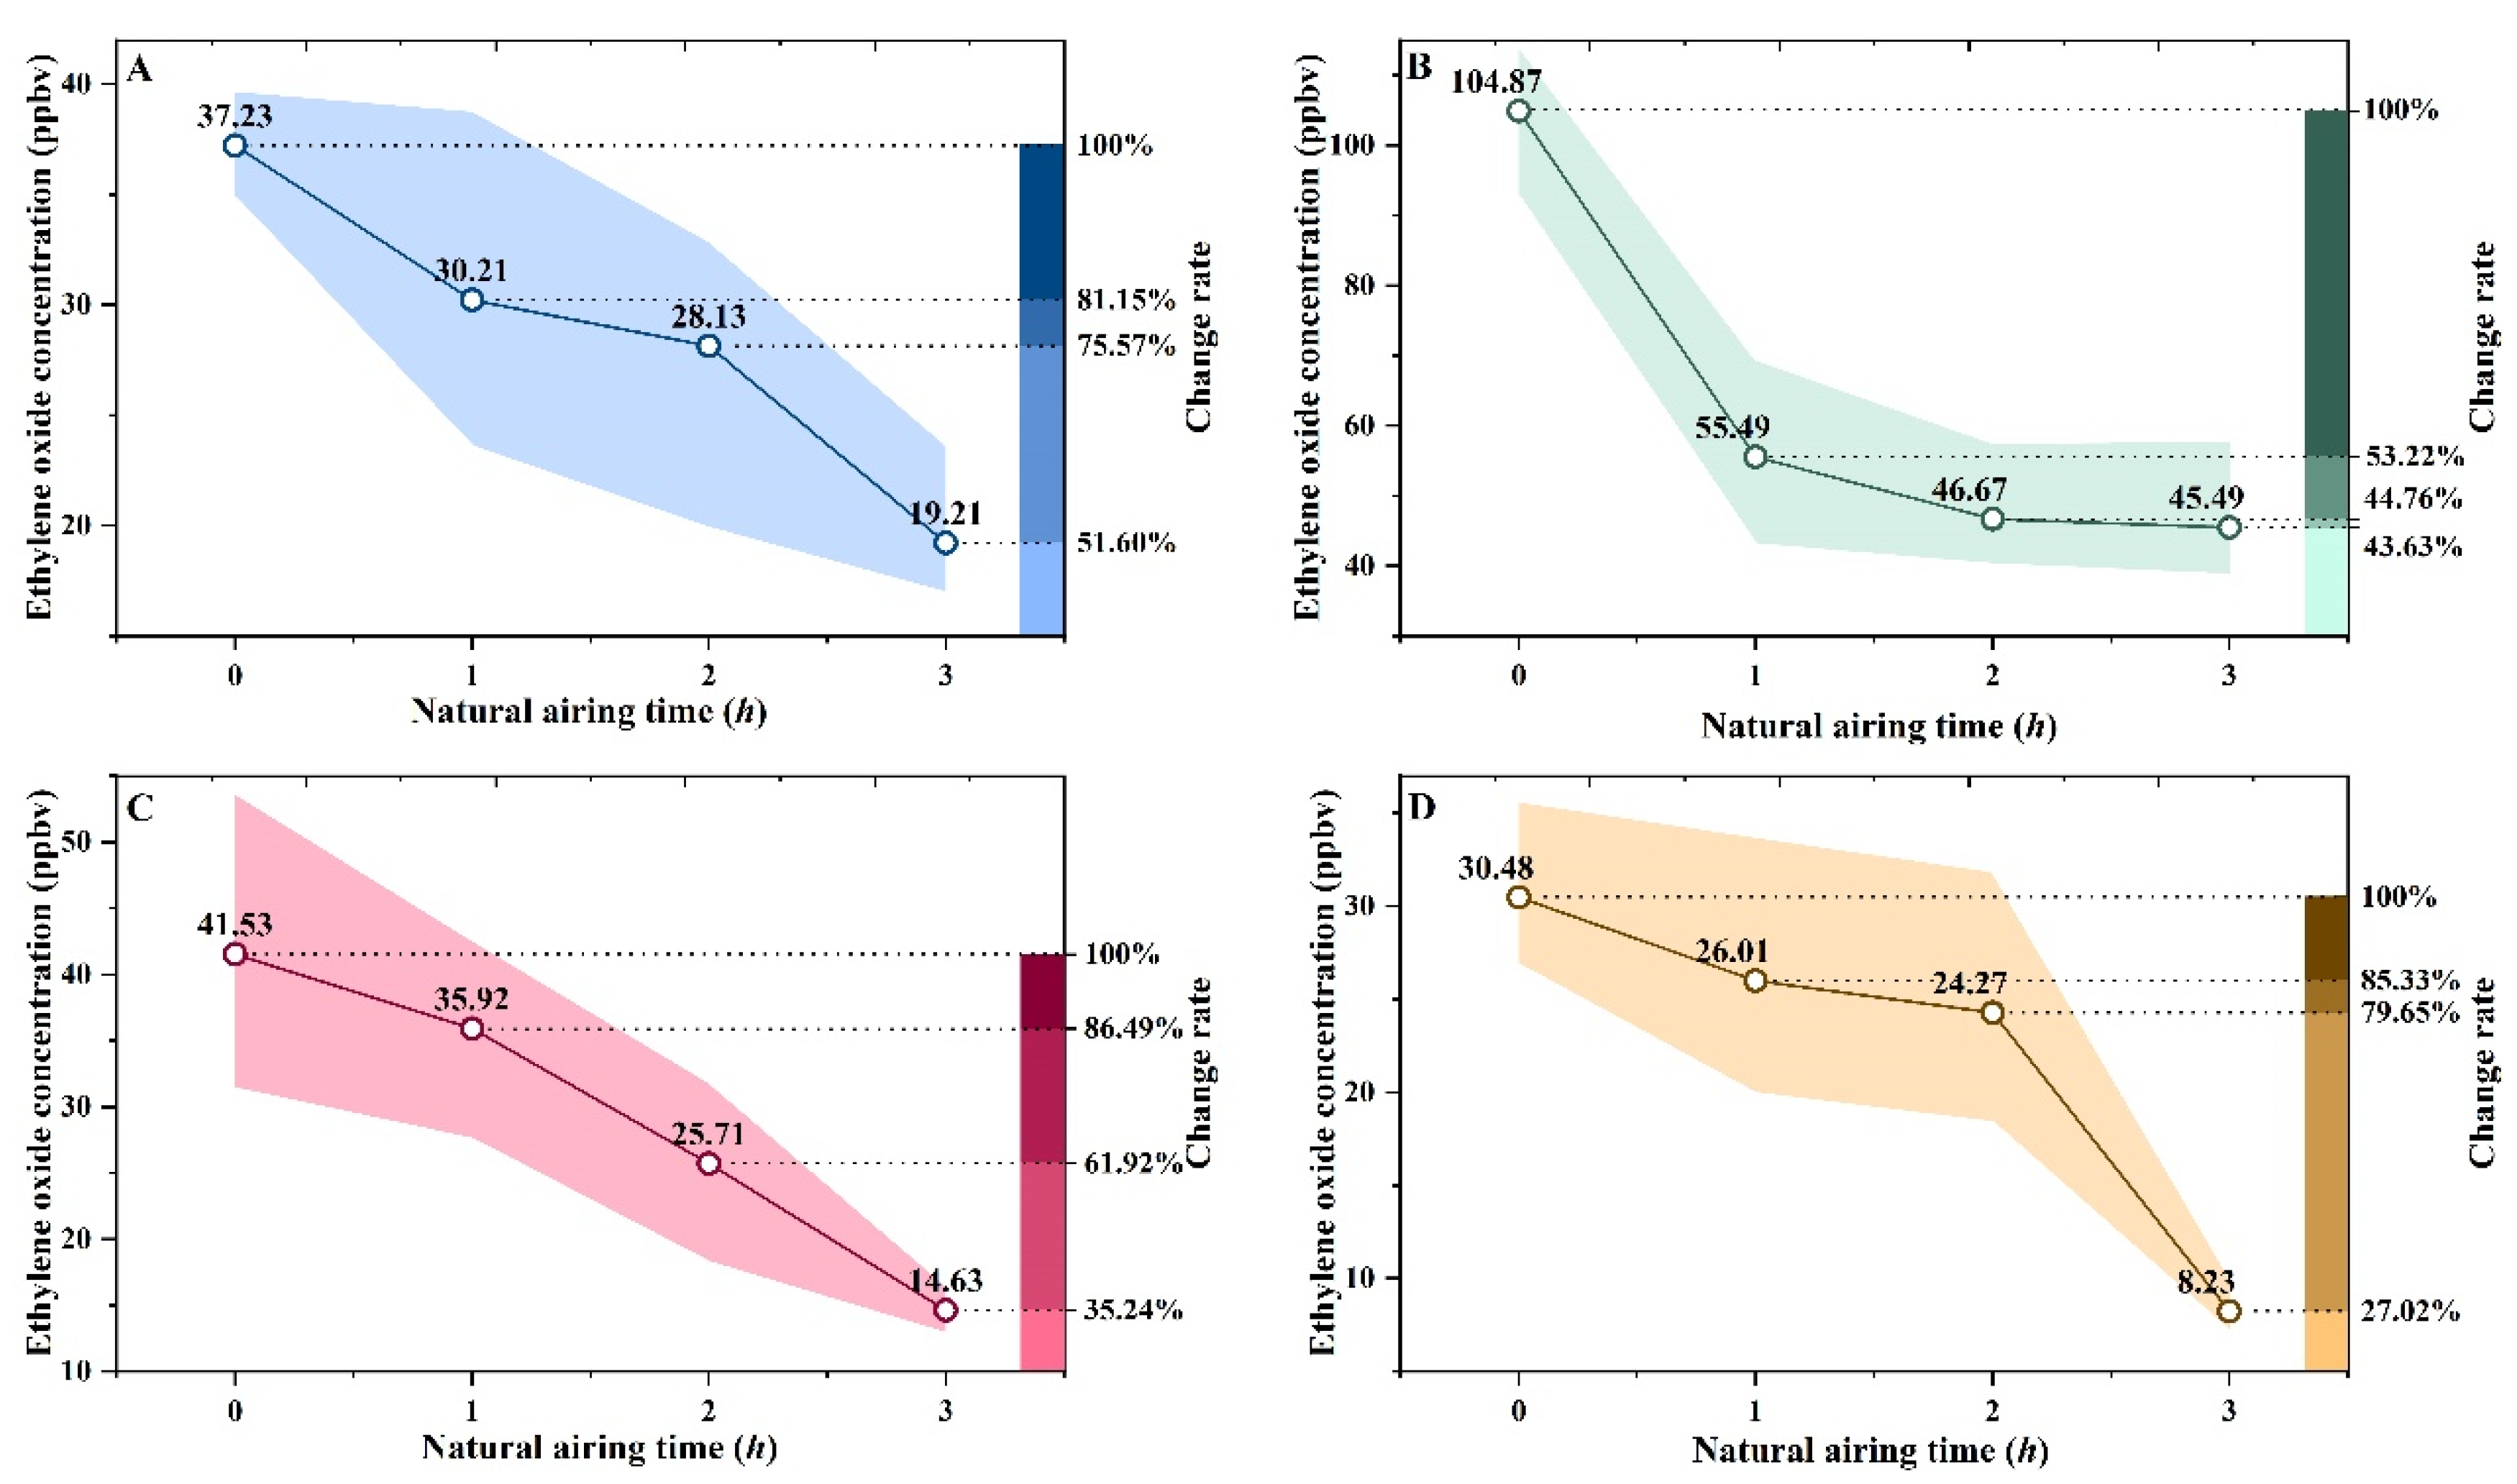
3.2. Changes in the Ethylene Oxide Concentration in the Mask during Use

The initial concentration of ethylene oxide in the four brands of sterilized masks varied greatly, with the group B masks having the highest ethylene oxide concentration at 104 ppbv (Table 3). The group D masks (for children) had the lowest ethylene oxide concentration at 30.5 ppbv. The group E non-sterilized masks showed a signal at m/z 45 for a compound with a concentration of 5.28 ppbv. And in a study to identify unknown volatiles in masks using headspace GC-Orbitrap-MS, it was found that the content of ethylene oxide in masks ranged from 250 to 5200 ppbv [33]. This indicates that only a small portion of the residual ethylene oxide content in the mask evaporates into the air and is inhaled by humans. The PTR-MS results reflect the actual volatilization of ethylene oxide in the mask, which is more representative of ethylene oxide inhalation status during mask use.
After wearing the four different types of sterilized masks, the residual concentration of ethylene oxide greatly decreased (Figure 2). After one minute, all tested masks had ethylene oxide concentrations of 20% of the initial concentration or lower. The residual concentration of ethylene oxide decreased the fastest in the group A masks. Within one minute, the residual concentration of ethylene oxide in the group A masks had decreased to 3.34 ppbv, which was only 9.0% of the initial concentration. After 5 min, the residual concentration of ethylene oxide in the group A masks had decreased to 2.51 ppbv, which was 6.8% of the initial concentration. The group B masks had the highest residual concentration of ethylene oxide after one minute (20.3 ppbv or 21.4% of the initial concentration). After 5 min, the residual concentration in these masks was 8.41 ppbv, which was 8.9% of the initial concentration. Except for the group B masks, all masks had residual concentrations of ethylene oxide lower than 4 ppbv after 5 min of use. After 6 min of wearing, the concentration of ethylene oxide in all masks had decreased below the detection limit of the instrument and could not be detected. The ethanol concentration in the group E masks reduced to approximately 0.1 ppbv after one minute of wearing, which was comparable to the level in ambient air. Therefore, the ethanol remaining in the masks was volatilized completely.
According to the above results, the majority of the ethylene oxide in the mask is inhaled by the human body within the first minute of wearing. In order to better understand the impact of ethylene oxide on human health, it is important to examine the quality of ethylene oxide inhaled when wearing the mask.

3.3. Mass of Ethylene Oxide Inhaled by Humans

The concentration of ethylene oxide decreased the most in the first minute of use, with decreases to 9%, 21.4%, 18.6%, and 12.4% of the initial concentration for the group A, B, C, and D masks, respectively (Figure 2). Consequently, most inhalation of ethylene oxide by the wearer occurred within the first minute. We used this information to estimate the amount of ethylene oxide inhaled.
Assuming that ethylene oxide levels in the mask decreased evenly over one minute, the ethylene oxide reduction rates in the group A, B, C, and D masks were 33.86 ppbv/min, 74.5 ppbv/min, 23.61 ppbv/min, and 34.08 ppbv/min, respectively (Table 4). Therefore, according to Equation (2), the mass of ethylene oxide inhaled by a person wearing a group A, B, C, or D mask was 0.40, 1.02, 0.27, or 0.40 μg, respectively. The cumulative use of a disposable medical mask should not exceed 8 h, while the cumulative use by occupationally exposed personnel should not exceed 4 h [35]. Therefore, non-occupationally exposed personnel will wear one mask per working day and occupationally exposed personnel will wear two masks per working day. This gives average masses of inhaled ethylene oxide during a working day of 0.52 μg for non-occupationally exposed personnel and 1.05 μg for occupationally exposed personnel.
In the medical field, masks are disposable devices. According to China’s occupational exposure limit for hazardous factors at work (GBZ2.1-2019), the average concentration of ethylene oxide in an 8 h working day (weighted by time) may not exceed 2 mg/m3 (approximately 1.1 ppmv). The American Conference of Governmental Industrial Hygienists (ACGIH) and the Occupational Safety and Health Administration (OSHA) stipulate that the maximum exposure concentration of ethylene oxide for employees is 1 ppmv over an 8 h period. The National Institute for Occupational Safety and Health (NIOSH) stipulates that the safe concentration of ethylene oxide for human exposure should be less than 0.1 ppmv.
To calculate the amount of inhalation in humans when exposed to an environment containing ethylene oxide, we introduce the following equation:
E M s = C × 6 t
where EMs (g) represents the safe amount of ethylene oxide inhalation, C (ppbv) is the upper limit of the safe concentration of ethylene oxide in the environment, 6t (L) is the amount of gas breathed by the body in t (min) (here, the same criteria as in Equation (3) are used, which is 6 L as the amount of gas breathed by the human body in 1 min).
Combined with Equation (4), combined with the actual situation after wearing for 6 min, the residual amount of ethylene oxide in the mask is basically zero. It can be established through calculation that the safe value of ethylene oxide inhalation within 6 min of wearing the mask should not exceed 72 μg (GBZ2.1-2019), 64.79 μg (ACGIH, Washington, DC, USA, OSHA, Washington, DC, USA), and 6.48 μg (NIOSH, Washington, DC, USA) (Table 5).
During this experiment, the maximum concentration of ethylene oxide detected in the mask samples was 104.27 ppbv, which was far below the maximum concentrations permitted by safety standards. In addition, the average masses of ethylene oxide inhaled by non-occupationally exposed personnel (0.52 μg) and occupationally exposed personnel (1.05 μg) in a working day are well below the safety standards. Therefore, all masks tested in this experiment contain residual levels of ethylene oxide that are within safe levels.

3.4. Methods for Reducing the Ethylene Oxide Concentration in Masks

3.4.1. Natural Airing

The change in the ethylene oxide concentration in the four brands of sterilized masks with natural airing was measured, and the ratio between the residual ethylene oxide concentration and the initial residual ethylene oxide concentration was calculated (Figure 3). The residual concentration of ethylene oxide varied with the brand of mask. For masks with a high initial concentration of ethylene oxide, the concentration decreased greatly within the first hour because of natural volatilization. For example, the residual concentration of ethylene oxide in group B masks decreased by 48.5 ppbv within the first hour, which was a decrease of 50.8%. As the time increased, the residual ethylene oxide concentration gradually decreased. After 3 h of exposure to air, the residual concentration of ethylene oxide in the group B, C, and D masks was below 50% of the initial concentration. In the group A masks, the residual concentration of ethylene oxide after 3 h was 51.6%. In the group D masks, the residual ethylene oxide concentration was 8.23 ppbv (27% of the initial concentration). The concentration of ethanol in the non-sterile masks (group E) also changed over time. Within 3 h, the concentration of ethanol in the group E masks decreased from 5.28 ppbv to 2.28 ppbv, with a decrease of 56.8%. Compared with the decrease in ethylene oxide concentration in the sterilized masks, the concentration of ethanol decreased slowly because of its low initial concentration.

3.4.2. Shaking the Mask

The residual concentration of ethylene oxide in the four brands of sterilized masks decreased by nearly 80% after they were shaken 10 times (Figure 4). In the group B masks, the residual concentration of ethylene oxide was 21 ppbv, whereas in masks from the three other brands, the residual concentration was almost only 4 ppbv. Increasing the number of times shaken to 20 or 30 did not produce a large change in the ethylene oxide concentration. This indicated that the ethylene oxide concentration was reduced to the lowest possible level that could be attained by shaking 10 times. For the group E masks, shaking 10 times reduced the concentration of ethanol to a level comparable with ambient air, which indicated that all the ethanol in the mask had diffused into the air.

3.4.3. Blowing Air on the Mask

Compared with shaking, blowing air on the masks with a hair dryer for 10 s provided a greater reduction in the residual concentration of ethylene oxide (Figure 5). The residual concentrations of ethylene oxide in the masks after using a hair dryer for 10 s were similar to those obtained after increasing the hair drying time to 20 s and 30 s. These results indicate that 10 s is the optimum time for reducing the residual concentration of ethylene oxide in the masks with a hair dryer. For the group E masks, the signal at m/z 45 was not detected after using the hair dryer for 10 s, which indicated that all of the ethanol was removed from the masks.
Among the methods, blowing air on the masks with a hair dryer had the greatest effect on reducing ethylene oxide in the masks (Figure 6). With this method, it only took 10 s for the residual concentration of ethylene oxide in the masks to reach 11.7% of the initial concentration. Shaking the masks was slightly less effective. After shaking the masks 10 times, 13.8% of the initial concentration of ethylene oxide remained. Natural airing was the least effective method, and even after 3 h, 39.35% of the initial concentration of ethylene oxide remained in the masks. According to our results, blowing air on masks with a hair dryer before wearing can rapidly reduce the concentration of ethylene oxide. This will reduce the amount of ethylene oxide inhaled, which will help reduce the potential for development of any health effects caused by prolonged use of sterilized masks.

4. Conclusions

In this study, we have developed a method for rapid detection of ethylene oxide concentration in masks by using PTR-MS. The amount of ethylene oxide inhaled by humans during the wearing process was estimated and the health risk was assessed. The residual concentration of ethylene oxide in masks ranged from 30.5 ppbv to 104 ppbv. After wearing the mask for one minute, the residual ethylene oxide concentration decreased to 9–21.4% of the initial concentration. After wearing the mask for 5 min, little residual ethylene oxide was present in the mask. Most of the residual ethylene oxide in the mask was inhaled by the wearer within the first minute of wearing. The mass of ethylene oxide inhaled during mask wearing was estimated to be between 0.27 and 1.02 μg, with an average of 0.52 μg. Compared with safety standards for ethylene oxide residues, the concentrations of residual ethylene oxide in all masks tested in this study remained within the safe range. Moreover, we found that blowing air on the masks with a hair dryer in daily life can be more effective than natural airing or shaking the masks to help reduce ethylene oxide before people wear them.
Compared with the traditional method for detecting the residual ethylene oxide from masks, PTR-MS allows for the dynamic detection of ethylene oxide concentrations from masks, and the results are more realistically reflective of ethylene oxide inhalation during mask use. Our results reflect the concentrations encountered in actual exposure situations and will improve awareness of the need for control and management of ethylene oxide residues in the production of sterilized masks. And we should also be alert to the potential health problems caused by wearing masks.

Author Contributions

Conceptualization, R.W., Y.Z., L.J., X.Z., Z.G. and D.D.; methodology, R.W., Y.Z. and D.D.; validation, L.J., R.W. and Y.Z.; formal analysis, L.J., X.Z. and Z.G.; investigation, R.W. and Y.Z.; resources, Z.G. and D.D.; data curation, R.W.; writing—original draft preparation, R.W.; writing—review and editing, Y.Z., L.J., X.Z., Z.G. and D.D.; visualization, Y.Z.; supervision, D.D.; project administration, D.D.; funding acquisition, D.D. All authors have read and agreed to the published version of the manuscript.

Funding

This work was supported by the National Natural Science Foundation of China (31972148, 32101609), Innovation Capacity Building Project of Beijing Academy of Agriculture and Forestry Sciences (KJCX20240702), and Beijing Innovation Consortium of Agriculture Research System (BAIC08-2024-FQ04).

Institutional Review Board Statement

Not applicable.

Informed Consent Statement

Not applicable.

Data Availability Statement

Data available on request due to restrictions privacy. The data presented in this study are available on request from the corresponding author. The data are not publicly available due to the study belongs to a confidential project.

Conflicts of Interest

The authors declare that the research was conducted in the absence of any commercial or financial relationships that could be construed as a potential conflict of interest.

References

  1. Gautam, S.; Hens, L.J.E. COVID-19: Impact by and on the environment, health and economy. Dev. Sustain. 2020, 22, 4953–4954. [Google Scholar]
  2. Liao, M.; Liu, H.; Wang, X.; Hu, X.; Huang, Y.; Liu, X.; Brenan, K.; Mecha, J.; Nirmalan, M.; Lu, J.R. A technical review of face mask wearing in preventing respiratory COVID-19 transmission. Curr. Opin. Colloid Interface Sci. 2021, 52, 101417. [Google Scholar]
  3. Mendes, G.C.; Brandao, T.R.; Silva, C.L. Ethylene oxide sterilization of medical devices: A review. Am. J. Infect. Control. 2007, 35, 574–581. [Google Scholar] [CrossRef] [PubMed]
  4. Mendes, G.; Brandão, T.R.; Silva, C.L. Ethylene oxide (EO) sterilization of healthcare products. In Sterilisation of Biomaterials and Medical Devices; Elsevier: Amsterdam, The Netherlands, 2012; pp. 71–96. [Google Scholar]
  5. Gollapudi, B.B.; Su, S.; Li, A.A.; Johnson, G.E.; Reiss, R.; Albertini, R.J.J.E.; Mutagenesis, M. Genotoxicity as a toxicologically relevant endpoint to inform risk assessment: A case study with ethylene oxide. Environ. Mol. Mutagen. 2020, 61, 852–871. [Google Scholar] [CrossRef]
  6. Jinot, J.; Fritz, J.M.; Vulimiri, S.V.; Keshava, N. Carcinogenicity of ethylene oxide: Key findings and scientific issues. Toxicol. Mech. Methods 2018, 28, 386–396. [Google Scholar] [PubMed]
  7. Kirman, C.R.; Li, A.A.; Sheehan, P.J.; Bus, J.S.; Lewis, R.C.; Hays, S.M. Ethylene oxide review: Characterization of total exposure via endogenous and exogenous pathways and their implications to risk assessment and risk management. J. Toxicol. Environ. Health Part B 2021, 24, 1–29. [Google Scholar] [CrossRef] [PubMed]
  8. IARC. 1,3-Butadiene, Ethylene Oxide and Vinyl Halides (Vinyl Fluoride, Vinyl Chloride and Vinyl Bromide); IARC: Lyon, France, 2008; Volume 97, p. 3.
  9. World Health Organization. IARC Monographs on the Identification of Carcinogenic Hazards to Humans; IARC: Lyon, France, 2020; Volume 97, pp. 1–125.
  10. Tsai, S.-W.; Tsai, S.-T.; Wang, V.-S.; Lai, J.-S. Laboratory and field validations of a solid-phase microextraction device for the determination of ethylene oxide. J. Chromatogr. A 2004, 1026, 25–30. [Google Scholar] [CrossRef]
  11. Ge, Y.; Jun, F.; Taohong, H. Determination of ethylene oxide and 2-chloroethanol in medical masks and protective clothing by headspace-gas chromatography. Environ. Chem. 2020, 39, 1448–1450. [Google Scholar]
  12. Salter, W.B.; Kinney, K.; Wallace, W.H.; Lumley, A.E.; Heimbuch, B.K.; Wander, J.D. Analysis of residual chemicals on filtering facepiece respirators after decontamination. J. Occup. Environ. Hyg. 2010, 7, 437–445. [Google Scholar] [CrossRef]
  13. Lee, D.; Cojocariu, C. A Fast, Cost-Effective HS-GC-FID Method for the Analysis of Ethylene Oxide in Surgical-Style face Masks; Thermo Fisher Scientific: Runcorn, UK, 2020. [Google Scholar]
  14. Hansel, A.; Jordan, A.; Holzinger, R.; Prazeller, P.; Vogel, W.; Lindinger, W. Proton transfer reaction mass spectrometry: On-line trace gas analysis at the ppb level. Int. J. Mass Spectrom. Ion Process. 1995, 149, 609–619. [Google Scholar]
  15. Lindinger, W.; Jordan, A. Proton-transfer-reaction mass spectrometry (PTR–MS): On-line monitoring of volatile organic compounds at pptv levels. Chem. Soc. Rev. 1998, 27, 347–375. [Google Scholar] [CrossRef]
  16. Ellis, A.M.; Mayhew, C.A. Proton Transfer Reaction Mass Spectrometry: Principles and Applications; John Wiley & Sons: Hoboken, NJ, USA, 2013. [Google Scholar]
  17. Hartungen, E.; Jürschik, S.; Jordan, A.; Edtbauer, A.; Feil, S.; Hanel, G.; Seehauser, H.; Haidacher, S.; Schottkowsky, R.; Märk, L.; et al. Proton transfer reaction-mass spectrometry: Fundamentals, recent advances and applications. Eur. Phys. J. Appl. Phys. 2013, 61, 24303. [Google Scholar] [CrossRef]
  18. Pedrotti, M.; Spaccasassi, A.; Biasioli, F.; Fogliano, V. Ethnicity, gender and physiological parameters: Their effect on in vivo flavour release and perception during chewing gum consumption. Food Res. Int. 2019, 116, 57–70. [Google Scholar] [CrossRef]
  19. Amann, A.; Poupart, G.; Telser, S.; Ledochowski, M.; Schmid, A.; Mechtcheriakov, S. Applications of breath gas analysis in medicine. Int. J. Mass Spectrom. 2004, 239, 227–233. [Google Scholar]
  20. Han, K.H.; Zhang, J.S.; Wargocki, P.; Knudsen, H.N.; Guo, B. Determination of material emission signatures by PTR-MS and their correlations with odor assessments by human subjects. Indoor Air 2010, 20, 341–354. [Google Scholar] [PubMed]
  21. Beale, R.; Liss, P.S.; Dixon, J.L.; Nightingale, P.D. Quantification of oxygenated volatile organic compounds in seawater by membrane inlet-proton transfer reaction/mass spectrometry. Anal. Chim. Acta 2011, 706, 128–134. [Google Scholar]
  22. De Gouw, J.; Warneke, C. Measurements of volatile organic compounds in the earth’s atmosphere using proton-transfer-reaction mass spectrometry. Mass Spectrom. Rev. 2007, 26, 223–257. [Google Scholar] [CrossRef]
  23. Karl, T.; Harren, F.; Warneke, C.; De Gouw, J.; Grayless, C.; Fall, R. Senescing grass crops as regional sources of reactive volatile organic compounds. J. Geophys. Res. Atmos. 2005, 110. [Google Scholar] [CrossRef]
  24. Mozaffar, A.; Schoon, N.; Bachy, A.; Digrado, A.; Heinesch, B.; Aubinet, M.; Fauconnier, M.L.; Delaplace, P.; du Jardin, P.; Amelynck, C. Biogenic volatile organic compound emissions from senescent maize leaves and a comparison with other leaf developmental stages. Atmos. Environ. 2018, 176, 71–81. [Google Scholar]
  25. Bianchi, T.; Weesepoel, Y.; Koot, A.; Iglesias, I.; Eduardo, I.; Gratacós-Cubarsí, M.; Guerrero, L.; Hortós, M.; van Ruth, S. Investigation of the aroma of commercial peach (Prunus persica L. Batsch) types by Proton Transfer Reaction–Mass Spectrometry (PTR-MS) and sensory analysis. Food Res. Int. 2017, 99, 133–146. [Google Scholar]
  26. Majchrzak, T.; Wojnowski, W.; Wasik, A. Revealing dynamic changes of the volatile profile of food samples using PTR–MS. Food Chem. 2021, 364, 130404. [Google Scholar] [PubMed]
  27. Del Río, R.F.; O’Hara, M.E.; Pemberton, P.; Whitehouse, T.; Mayhew, C.A. Elimination characteristics of post-operative isoflurane levels in alveolar exhaled breath via PTR-MS analysis. J. Breath Res. 2016, 10, 046006. [Google Scholar] [CrossRef] [PubMed]
  28. Moser, B.; Bodrogi, F.; Eibl, G.; Lechner, M.; Rieder, J.; Lirk, P. Mass spectrometric profile of exhaled breath—Field study by PTR-MS. Respir. Physiol. Neurobiol. 2005, 145, 295–300. [Google Scholar] [CrossRef] [PubMed]
  29. Liu, D.; Nyord, T.; Rong, L.; Feilberg, A. Real-time quantification of emissions of volatile organic compounds from land spreading of pig slurry measured by PTR-MS and wind tunnels. Sci. Total Environ. 2018, 639, 1079–1087. [Google Scholar] [CrossRef]
  30. Ramirez, K.S.; Lauber, C.L.; Fierer, N. Microbial consumption and production of volatile organic compounds at the soil-litter interface. Biogeochemistry 2010, 99, 97–107. [Google Scholar] [CrossRef]
  31. Hallett, S.; Toro, F.; Ashurst, J.V. Physiology, Tidal Volume. 2018. Available online: http://europepmc.org/abstract/MED/29494108 (accessed on 12 January 2024).
  32. Wang, Y.; Shen, C.; Li, J.; Wang, H.; Wang, H.; Jiang, H.; Chu, Y. Thermal desorption extraction proton transfer reaction mass spectrometer (TDE-PTR-MS) for rapid determination of residual solvent and sterilant in disposable medical devices. J. Pharm. Biomed. Anal. 2011, 55, 1213–1217. [Google Scholar]
  33. Liu, Y.; Wang, Z.; Wang, W.; Xing, J.; Zhang, Q.; Ma, Q.; Lv, Q. Non-targeted analysis of unknown volatile chemicals in medical masks. Environ. Int. 2022, 161, 107122. [Google Scholar]
  34. Yáñez-Serrano, A.M.; Filella, I.; Llusià, J.; Gargallo-Garriga, A.; Granda, V.; Bourtsoukidis, E.; Williams, J.; Seco, R.; Cappellin, L.; Werner, C.; et al. GLOVOCS—Master compound assignment guide for proton transfer reaction mass spectrometry users. Atmos. Environ. 2021, 244, 117929. [Google Scholar] [CrossRef]
  35. Lepelletier, D.; Grandbastien, B.; Romano-Bertrand, S.; Aho, S.; Chidiac, C.; Géhanno, J.F.; Chauvin, F. What face mask for what use in the context of the COVID-19 pandemic? The French guidelines. J. Hosp. Infect. 2020, 105, 414–418. [Google Scholar] [CrossRef]
Figure 1. (a) Principle of dynamic detection of ethylene oxide concentration in masks using PTR-MS; (b) actual measurement process.
Atmosphere 15 00114 g001
Figure 2. Change in residual concentration of ethylene oxide in masks of groups (AD) with wearing time.
Atmosphere 15 00114 g002
Figure 3. Changes in the ethylene oxide concentration of masks under natural airing of groups (AD).
Atmosphere 15 00114 g003
Figure 4. The residual ethylene oxide in the masks of groups (AD) after shaking 30 times.
Atmosphere 15 00114 g004
Figure 5. The residual ethylene oxide in the masks in groups (AD) after blowing for 30 s.
Atmosphere 15 00114 g005
Figure 6. The comparison of three methods for reducing the concentration of ethylene oxide from masks.
Atmosphere 15 00114 g006
Table 1. Source of mask samples.
NumberGroupBrand and Source of Masks
1AAISHIYIJIA, Zhejiang, China
2BYOUHEKANG, Guangzhou, China
3CMILKON, Xiantao, China
4DZHENDE, Shaoxing, China
5EYALANSHI, Wuhan, China
Table 2. Subjects’ demographic properties.
No.GenderAge/YearHeight/cmWeight/kgSmoking or Not
1Female2516550No
2Female1014231No
3Male2817673No
4Male3217576No
5Male813226No
6Male1013733No
Table 3. Residual concentration of ethylene oxide in masks of 4 groups before use.
GroupABCD
Concentration of ethylene oxide (ppbv)37.2104.841.530.5
Table 4. The decrease in ethylene oxide concentration and the amount of ethylene oxide inhaled by four types of sterilization masks in the first minute.
GroupABCD
Ratio of ethylene oxide decrease
(ppbv/min)
33.8674.523.6134.08
Inhalation of ethylene oxide
(μg)
0.401.020.270.40
Table 5. According to the safety concentration standards for ethylene oxide, the upper limit of the mass of ethylene oxide inhaled by ordinary people within 6 min.
Safety StandardsGBZ2.1-2019(China)ACGIH, OSHANIOSH
Upper limit of ethylene oxide inhalation (μg)7264.796.48
Disclaimer/Publisher’s Note: The statements, opinions and data contained in all publications are solely those of the individual author(s) and contributor(s) and not of MDPI and/or the editor(s). MDPI and/or the editor(s) disclaim responsibility for any injury to people or property resulting from any ideas, methods, instructions or products referred to in the content.

