Article

Particulate Matter in the American Southwest: Detection and Analysis of Dust Storms Using Surface Measurements and Ground-Based LIDAR

by
Joscelyne Guzman-Gonzalez
1,
Rosa M. Fitzgerald
2,*,
Nakul N. Karle
3,
Ricardo K. Sakai
3 and
William R. Stockwell
2
1
Environmental Science and Engineering, The University of Texas at El Paso, El Paso, TX 79968, USA
2
Department of Physics, The University of Texas at El Paso, El Paso, TX 79968, USA
3
College of Arts and Sciences, Howard University, Washington, DC 20059, USA
*
Author to whom correspondence should be addressed.
Atmosphere 2024, 15(1), 110; https://doi.org/10.3390/atmos15010110
Submission received: 14 December 2023 / Revised: 8 January 2024 / Accepted: 12 January 2024 / Published: 16 January 2024
(This article belongs to the Section Air Quality)

Abstract

:
This research study focuses on the coupling between particulate matter and the planetary boundary layer. Particulate matter affects human health and it is a complex mixture of suspended substances. Various sources of particulate matter include volcanic eruptions, soil lofted by strong winds, wildfires, and particles formed from chemical reactions of gas-phase emissions. Strong winds are one source of dust pollution when they loft soil particles. Particulate matter and the planetary boundary layer are closely linked. The planetary boundary layer plays a critical role in meteorology and particulate matter concentrations due to its involvement in energy, latent heat, and mass transfer with the free troposphere. Currently, there has been no research on the impact of dust events on the planetary boundary layer in our region, El Paso, Texas, which is located on one of the biggest sources of dust in the Western Hemisphere, the Chihuahuan Desert. In this study, we used PM10 concentrations to detect dust events during the 2016–2022 period in the El Paso region. During the study period, we observed 74 dust events. The dust events were categorized as synoptic or convective cases. Synoptic cases are associated with cold fronts, while convective cases are associated with local convective systems such as thunderstorms. We observed that synoptic cases occurred most frequently during springtime, while convective cases were more frequent during summer monsoon months. Synoptic cases tend to occur earlier in the afternoon with lower temperatures, while convective cases tend to occur in the late evening with higher temperatures. We also found that the planetary boundary layer height collapsed after the maximum hourly PM10 concentration and then the boundary layer returned to its original height.

1. Introduction

Soil dust has received increasing attention in recent decades as it scatters and absorbs radiation and affects air quality and human health [1]. Covering about one third of the Earth’s land surface, dust aerosols are lifted from arid, semiarid, and desert regions [1]. Dust particles are suspended in small parts of the atmosphere, but they contribute significantly to the Earth’s radiation budget because they are responsible for both the reflection and absorption of short-wave and long-wave radiation [2]. When a dust event occurs, there is a big influx of dust. Dust events are sporadic meteorological phenomena that carry dust and sand from hotspots and deposit them in remote areas due to high wind speeds [2]. A dust event is defined as an event that has PM10 above 150 μg/m³ and wind gusts above 10 m/s (or about 22 mph) [3,4,5].
The United States Environmental Protection Agency (US EPA) characterizes particulate matter (PM) by its aerodynamic diameter. The smallest particles are known as PM2.5 with aerodynamic diameters less than 2.5 m. There are two categories of PM2.5 particles, primary PM and secondary PM. Both categories include particulate matter with an aerodynamic diameter of 2.5 μm or less. Primary PM2.5 is directly emitted into the atmosphere, while secondary PM2.5 is the result of photochemical processes that convert gas-phase emissions to particles [6]. The US EPA characterizes larger particles as PM10 and these may result from smoke (e.g., wildfires), direct emissions from construction, or other industrial processes and processes such as windblown dust [7].
Windblown dust results from the interactions of surface winds with surface soils [8]. The sand particles have a relatively unimodal grain size distribution. The flux of surface dust depends on the characteristics of the soil grains, the friction velocity of the surface winds (often described as u*), land use, soil type, surface temperature, soil moisture content, and vegetation cover [8,9]. One unique factor of the soil of the El Paso region, located in the Chihuahuan Desert, is that it results from accumulated alluvial deposits [9,10,11]. Another factor is that PM10 has higher sedimentation velocities than PM2.5 [8]. Therefore, windblown dust events are likely to affect PM concentrations more on a local level, while sources such as wildfire may affect PM concentrations over larger spatial scales where atmospheric transport is significant. A study provided an analysis of the synoptic climatology of blowing dust events in El Paso, Texas, and suggested the use of remote sensing data, ground-based observations, and more advanced techniques for future detailed analysis of regional dust events [12]. Several studies have also been conducted to understand the effects of dust events of different magnitudes on the atmosphere. In our study, we go beyond these suggestions and study the PBL during dust events.
Dust storms can be detected utilizing a variety of techniques and methods. Some of these techniques and methods that have been utilized before are satellite observations, wind profiling radar, and ground-based multimeter wave radar [2]. Some studies have utilized satellites and aerosol spectrometers with a primary focus on air quality and radiative forcing [2,13,14,15].
The PBL is the lower part of the Earth’s atmosphere. Changes in the PBL play a significant role in the dispersion of pollutants [16,17,18]. The boundary layer depth varies from zero up to a few kilometers (3.5 to 4 km above ground level). The boundary layer depends on its location, such as the ocean or other land use category, and the time of day [16]. The characteristics of the boundary layer have strong effects on meteorology and air quality. The boundary layer is the region of the atmosphere between the microscopic-scale surface layer and the free troposphere. Low-level clouds may form near the top of the boundary layer, and it may include a convective mixed layer where aerosols and pollutants from the surface mix and react to form secondary pollutants [16].
Studies have been conducted that explore the impact of dust events on the planetary boundary layer for other regions [1,2,19,20]. One study found that the surface temperature dropped, accompanied by a rise in relative humidity and strong surface winds. It also showed that PM10 and PM2.5 concentrations increased by 118.5% and 44.5%, respectively [2]. The study also found that the nocturnal boundary layer collapsed during the dust storm episode. Another study found that, due to the impact of dust aerosols, the near-surface air temperature decreased by 0.01 °C and 0.06 °C in the daytime and increased by 0.13 °C and 0.14 °C at night [1].
The intricate interplay between dust aerosols and the PBL structure remains still under exploration; more research is needed to understand the impact of dust storms on the planetary boundary layer (PBL), prompting research initiatives across various geographical locations, including India, China, and Australia [1,2,19,20]. Despite the extensive research dedicated to understanding the influence of dust aerosols on various atmospheric processes, there exists a notable gap in comprehending the specific implications of these aerosols on the structure and dynamics of the PBL. To address this critical research gap, there is a pressing need for dedicated investigations that focus explicitly on unraveling the impacts of dust aerosols on PBL structures. This study focuses on the city of El Paso, Texas. We are reporting and analyzing dust events that took place during the years 2016 to 2022 using the Texas Commission on Environmental Quality (TCEQ) and ceilometer data. This study aims to give an up-to-date analysis of meteorological conditions and parameters during dust events using a surface network and a ceilometer. This study is the first one to include information about the planetary boundary layer changes during these types of events, showing a sharp PBL height fall.

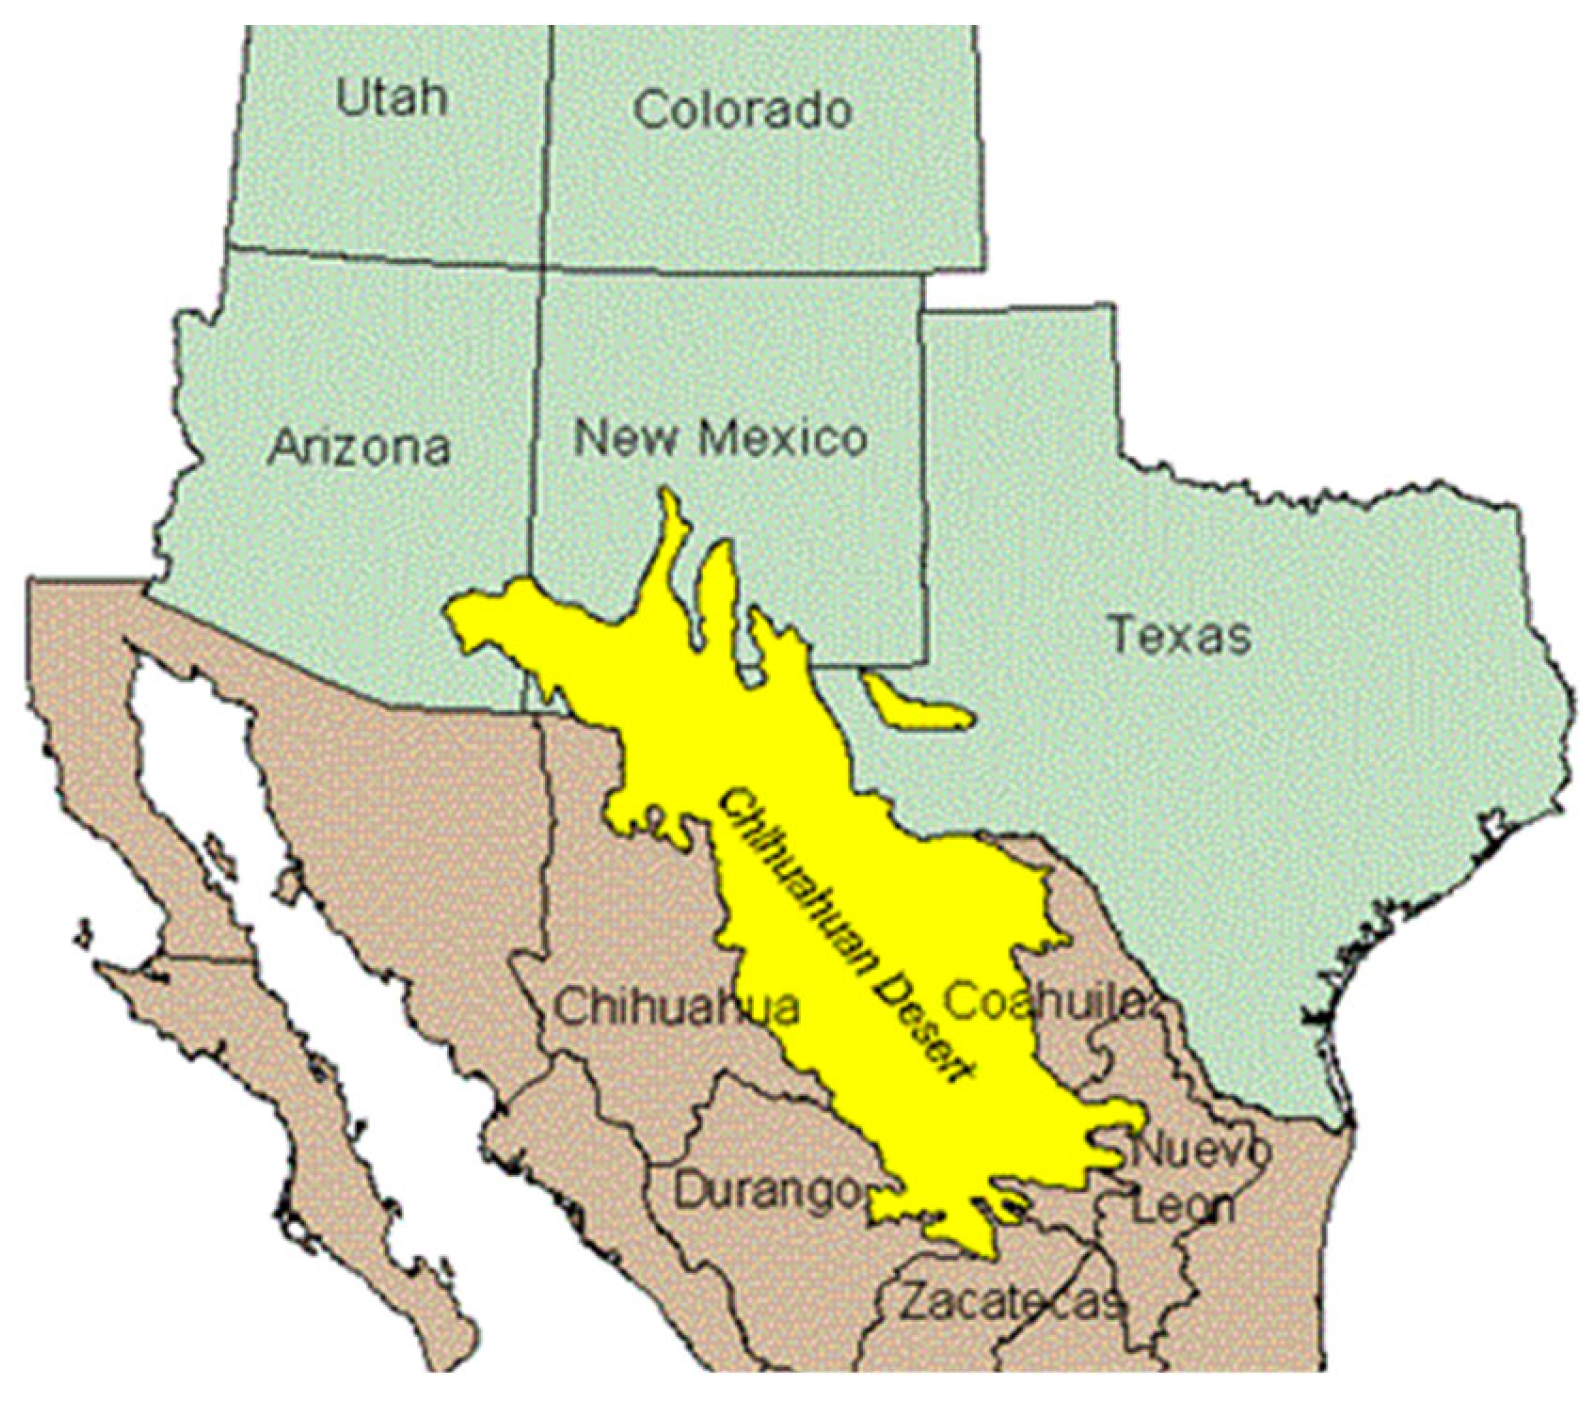
2. Overview of the Region

The El Paso region is located in the Chihuahuan Desert. Separated by the Rio Grande, we have the cities El Paso, Texas, in the United States and Ciudad Juarez, Chihuahua, in Mexico, and some neighboring rural cities in the New Mexico region. Together, Juarez and El Paso are the largest U.S.–Mexican border cities. Ciudad Juarez is one of Northern Mexico’s main industrial cities [21]. El Paso is one of the largest cities in Texas, placing at number 5 with a population of around 835,593 inhabitants [17]. The city is located in the western part of the state of Texas south of the New Mexico state line and surrounded by the Chihuahuan Desert (Figure 1). In the Western Hemisphere, the Chihuahuan Desert is one of the biggest sources of dust [22]. The Chihuahuan Dessert lands, lakes, and dry beds are the main sources of dust that is blown into the city of El Paso [3].
El Paso’s climate is characterized by hot and dry summers with dry winters; because of this dry climate, El Paso shows a high frequency of dust events. During the months of June and January, the average daily maximum temperatures are 96 °F and 66 °F, respectively. The highest temperature recorded was 114 °F in June 1994, while the lowest temperature was 17.6° in January 1962 [12]. Precipitation is 24 cm annually, with an average of 53.8 rainy days per year and 36.4 days with thunderstorms per year. During the year, El Paso has about 306 sunny days, earning the name “Sun City” [12]. According to data from El Paso International Airport, dust events take place on average 15 times a year, with an average duration of 2 h. Dust events tend to take place between the months of December and May [3].

3. Methodology

3.1. Continuous Ambient Monitoring Stations (CAMS) and Selection of Cases

We comprehensively examined the Quality Assured/Quality Controlled (QA/QC) ambient air archived monitoring data from the TCEQ database (https://www.tceq.texas.gov/airquality/monops/data-reports (accessed on 30 December 2023)) for the years 2016–2022. The data used were collected from three different Continuous Ambient Air Monitoring Stations (CAMS) located across the city (Figure 2). A dust event was assumed to have occurred if the daily maximum PM10 concentration increased by at least 100 µg/m³ from one day to another. Utilizing the data from three collection sites, UTEP (31°46′6″ N, −106°30′5″ W; 1158 m ASL), Chamizal (31°45′56″ N, −106°27′19″ W; 1122 m ASL), and Socorro (31°40′3″ N, −106°17′17″ W; 1117 m ASL), we came across 683 possible dust events. The CAMS from UTEP, Chamizal, and Socorro recorded 137, 334, and 212 events, respectively. Since PM10 concentrations are under consideration, it is safe to assume that some of the high PM10 concentrations were due to air pollution or local events and not a dust event. Therefore, it is probable that not all 683 cases were dust events; the selected events were those in which high PM10 concentrations occurred at all three CAMS stations simultaneously, since dust events are a regional effect. This was used towards reducing the number of dust storms to 74, in addition to other considerations.

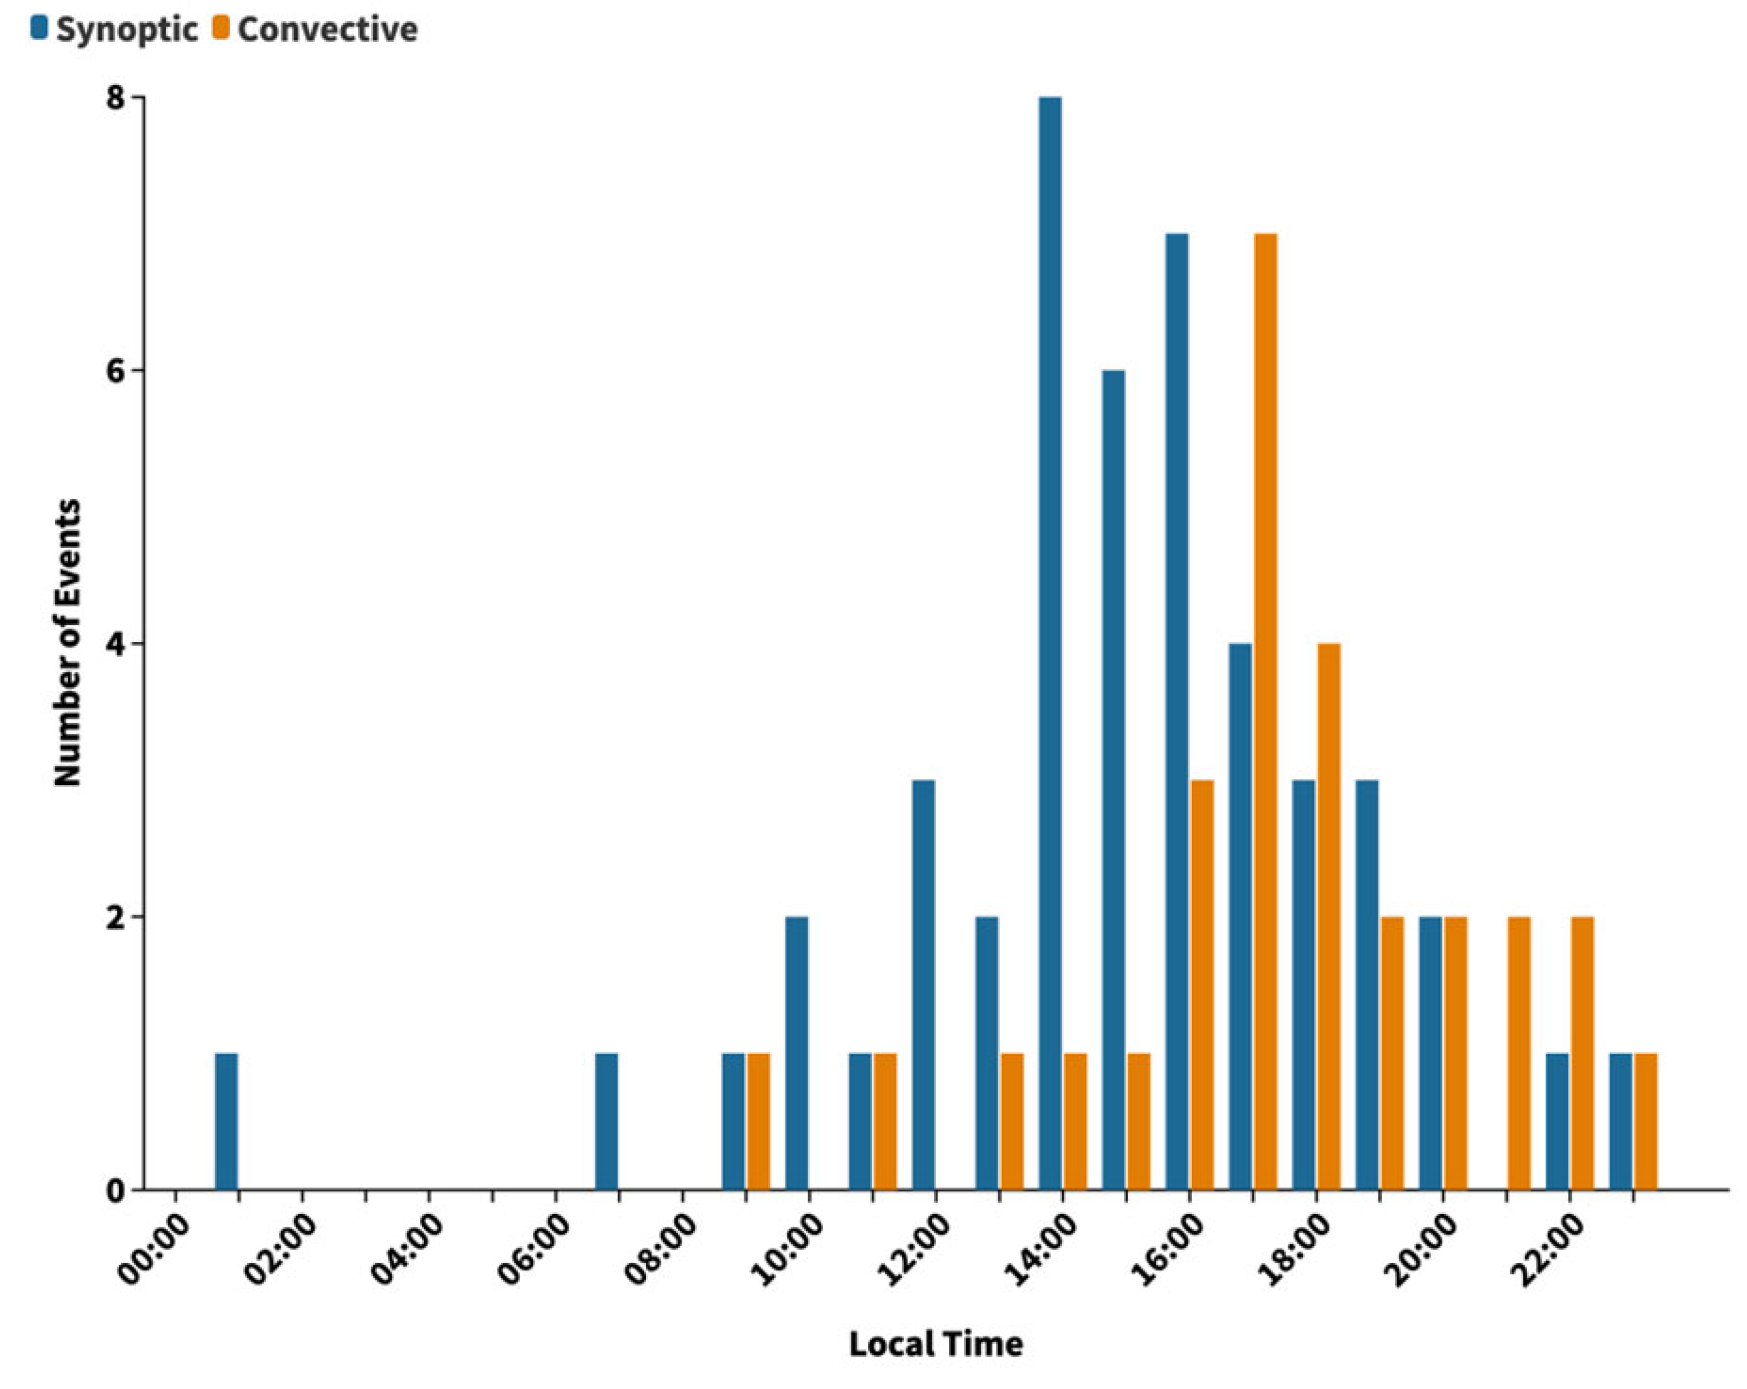
3.2. Classification of Dust Events

In a study previously conducted in El Paso, TX, the types of dust events were classified into two categories: synoptic-scale and convectively, local-scale, driven events [12]. Synoptic events are the most common in the region. These events tend to occur during the late winter and spring months. These events are a result of Pacific upper-level troughs and their associated surface cold fronts traversing the region with strong winds [12]. Convective events tend to happen more during the summer monsoon season. These events can originate from thunderstorms, dry microbursts, or wet microbursts [12]. To classify an event as synoptic or convective, we utilized the surface analysis map from the NOAA Weather Prediction Center webpage (https://www.wpc.ncep.noaa.gov, on 1 October 2022). If the map showed a cold front the day of the event, we classified the event as synoptic and, if the cold front was absent, then it was classified as convective.

3.3. Ceilometer

A network of all-weather Vaisala Ceilometer Lidars (CL51 and CL31) aerosol backscatter profiles was used to analyze the influence of PBL on pollution events in the El Paso region [17,18]. The wavelength utilized by the lidar is 910 nm and CL31 model can work up to a height of 7.5 km and CL51 with a range of 15 km with a vertical resolution of ~10 m [2]. CL51 is located at the University of Texas at El Paso campus and CL31 is located at the Socorro site. The acquired data for this study had spatial and temporal resolutions of 10 m and 16 s, respectively. The measured aerosol backscattered profiles were loaded into Vaisala’s proprietary boundary layer software BL-View version 2.2, which used the gradient approach to determine the aerosol mixing heights, which is a proxy of the PBL heights. The ceilometer was used to obtain the planetary boundary heights and to detect dust storms using the aerosol backscatter profiles.

4. Results and Discussion
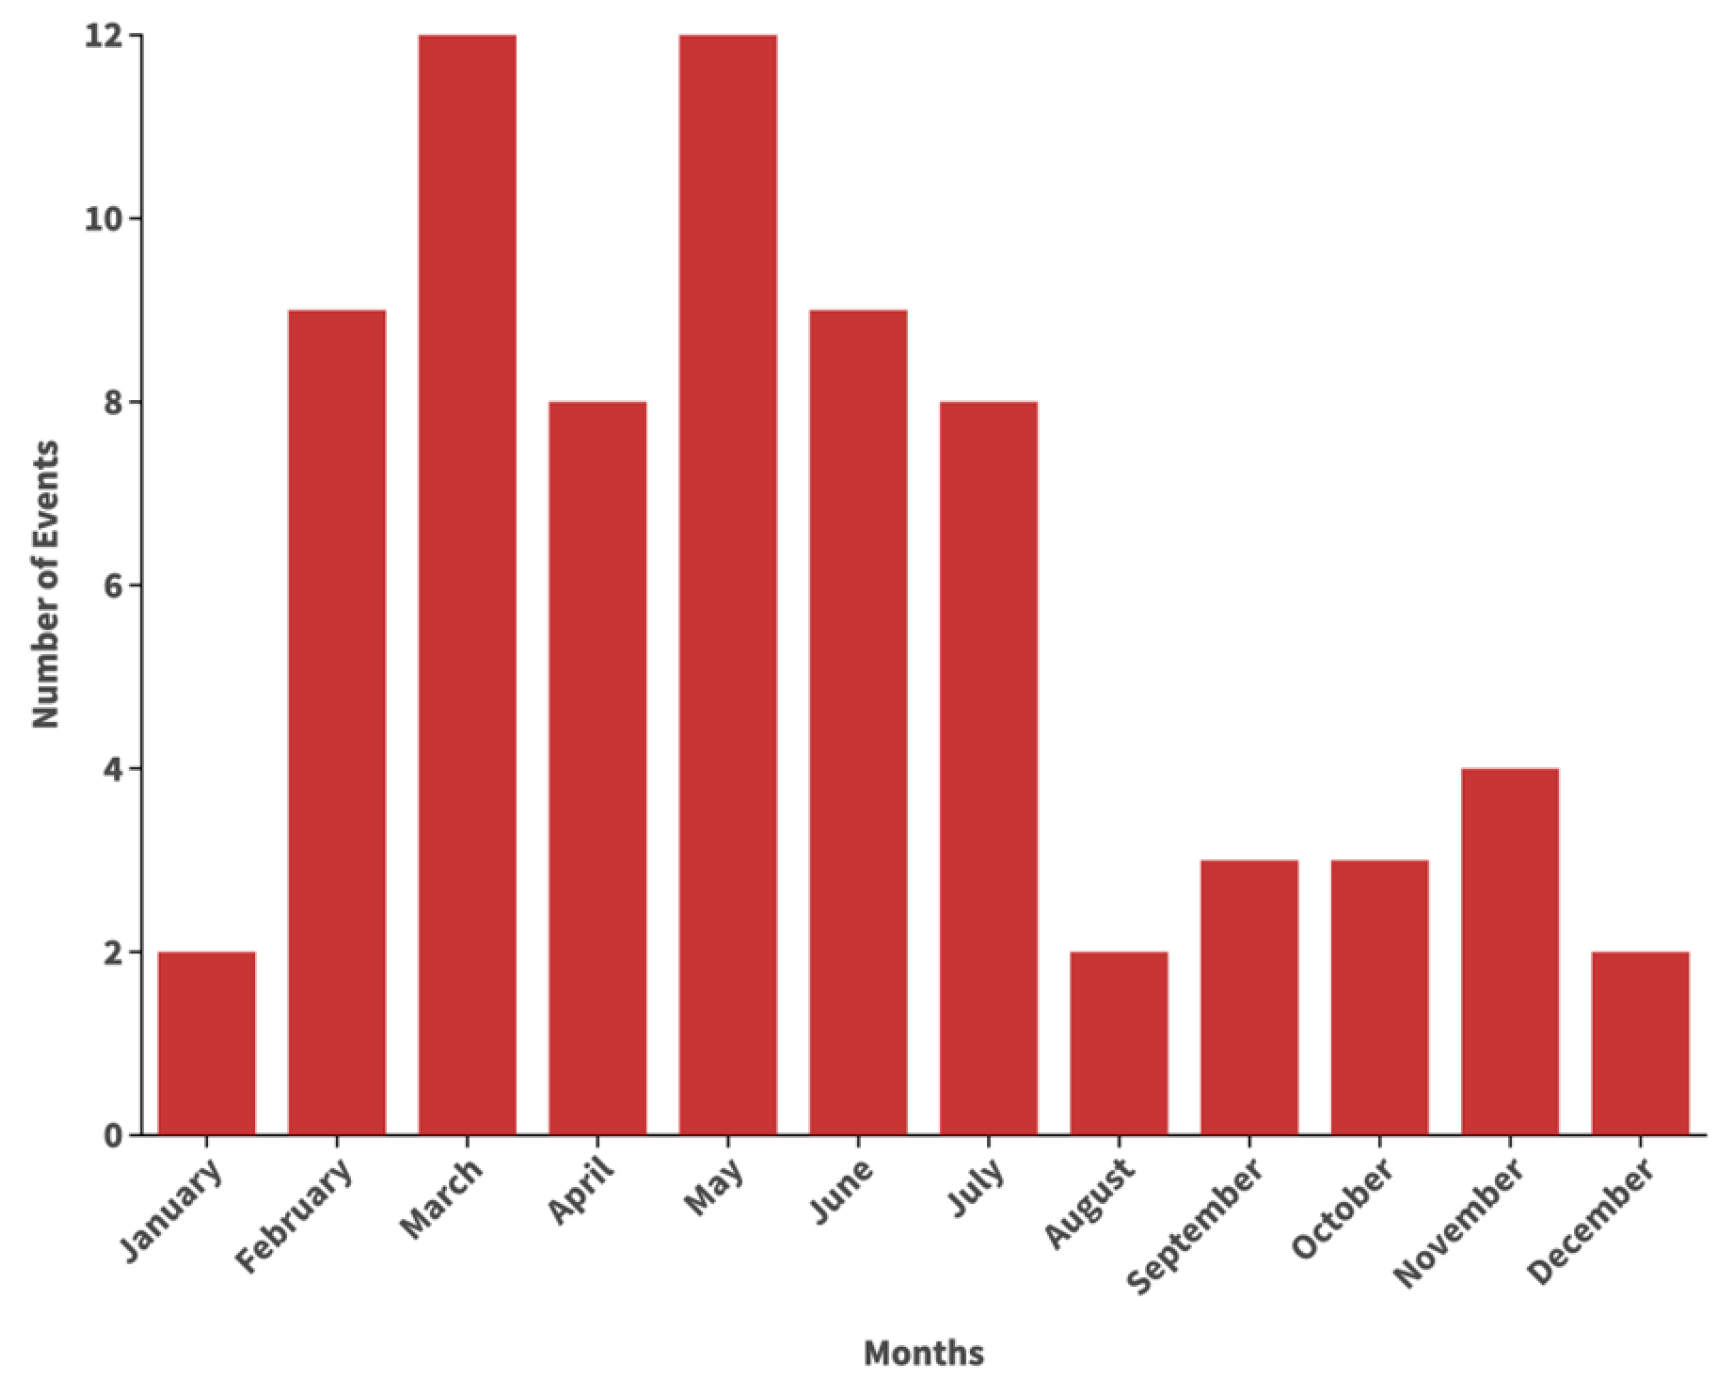
4.1. Analysis

We constructed a Windrose diagram for each CAMS before reducing the number of events to 74 (Figure 3). In those diagrams, it can be observed that, for Socorro and UTEP, most of the events have a western direction. Chamizal events are shown to come primarily from a southern direction. When we constructed a Windrose diagram for each CAMS after reducing the number of events to 74 (Figure 4), most events from Chamizal showed a western direction, which corresponded to the surrounding Chihuahuan Desert region.
The reduction in cases was also due to the elimination of high pollution cases. The CAMS data located in Chamizal is the one that supports this study the most. If we look at the location of each CAMS in Figure 2, it can be observed that Chamizal sits directly on the border line of El Paso, TX, and Ciudad Juarez, Chihuahua, Mexico. This CAM site is located on the border of the USA and Mexico, next to the International Bridge of Las Americas, also known as Puente Libre. This bridge is one of the main ports of entry to the United States with a high influx of cars and trucks every day. If all cases are considered, most of the PM10 concentration comes from the south, in this case, from the border (Figure 3). This can also be observed from the wind speed of those cases coming from the south. From Figure 3, we can observe that the wind speeds for those south cases are between 0 and 5 mph, which reflects the slow traffic in that zone due to the bridge crossing. When filtered for dust storms, the main direction is from the west (Figure 4), which is the main direction of dust events in El Paso.

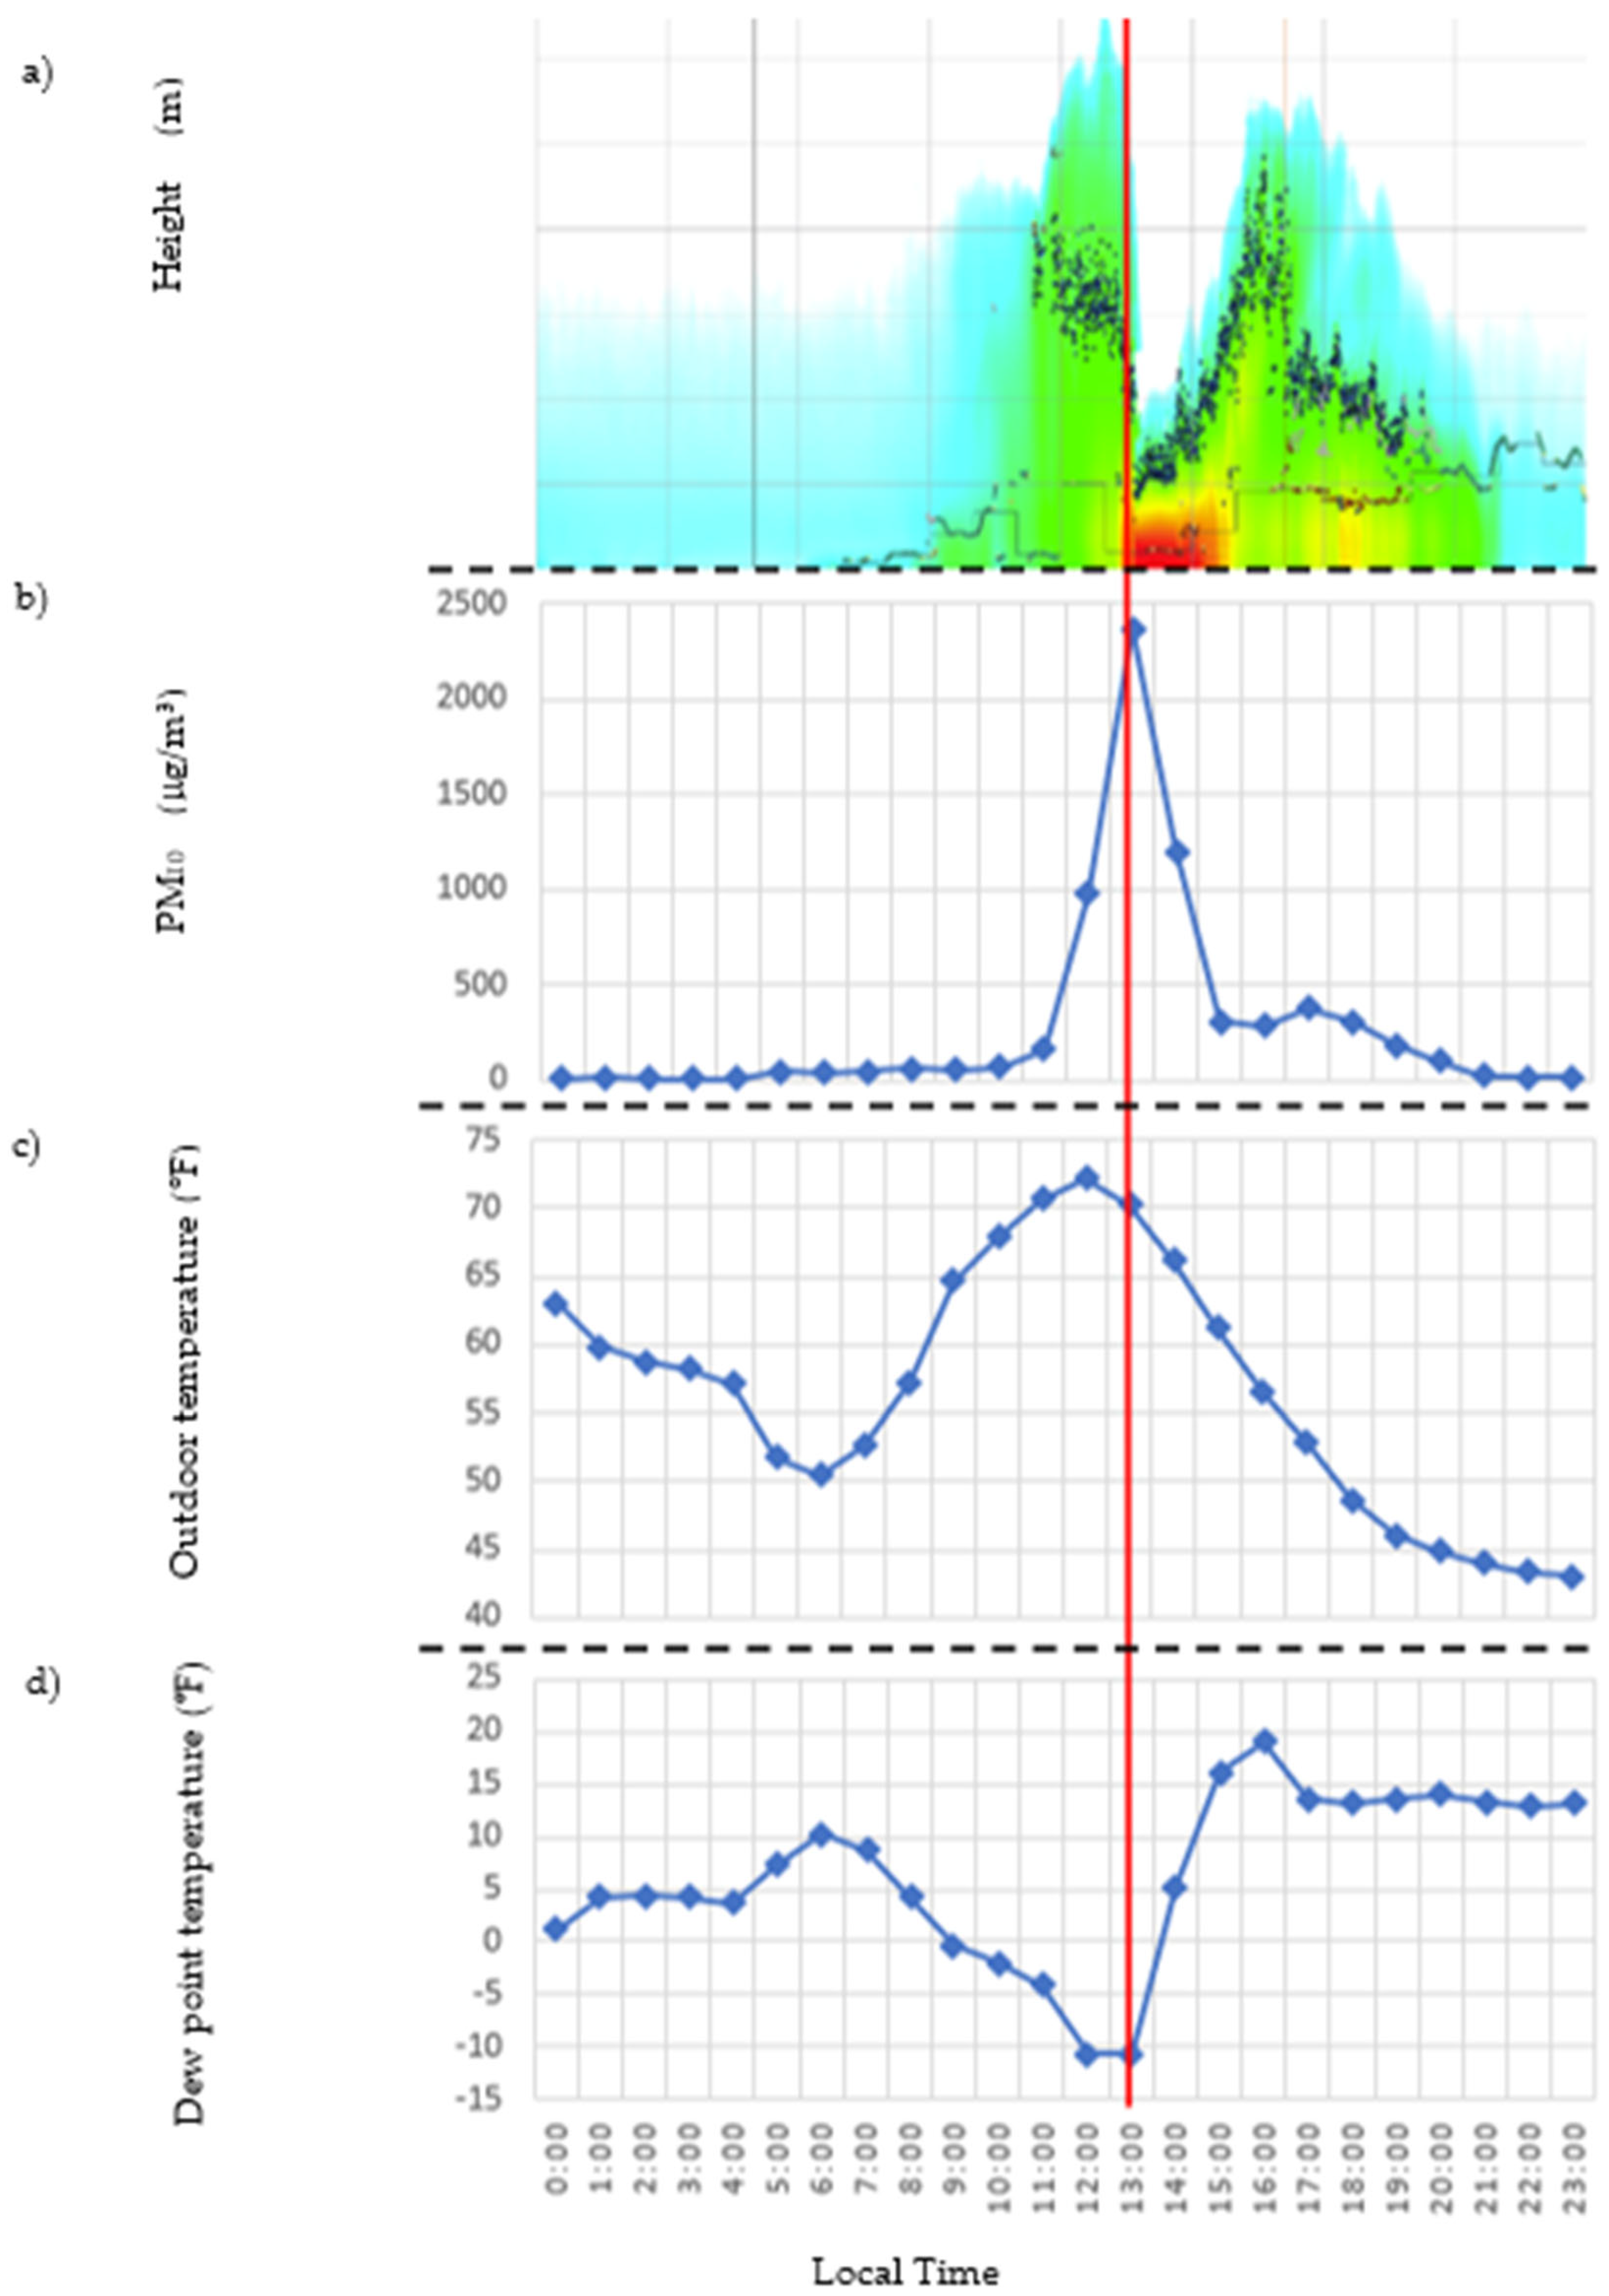
4.2. Meteorological Parameters of Dust Events

The monthly frequency of those 74 cases is shown in Figure 5. Most of the events took place during the months of February to July. March and May showed the greatest number of cases, while August and December showed the least number of cases. In the study previously conducted in El Paso, TX, the authors found that, between the years 1932 and 2006, dust events peaked during the month of April, then the occurrences decreased [12]. The previous study found only one peak in the number of dust cases that took place during the month of April. In contrast, our study found two peaks that took place, one in March and another one in May (Figure 5).
These two peaks are more obvious in Figure 6, which shows two distributions. Depending on the type of dust event, the behavior and conditions change. We obtained 46 synoptic cases and 28 convective cases. Considering the new classification, we looked at the monthly frequency for each case (Figure 6). It can be observed that, once we divide the cases into categories, we have two different distributions. Synoptic cases are shown to happen more between the months of January and May. The month with more synoptic cases is March, while the month with fewer cases is between June and September. Starting in October, the frequency of cases starts to increase. Convective events were more frequent during the months of May, June, and July. January was the only month that did not show a convective case. Convective cases occur whenever there is a dry or wet deposition, and they are more common during the summer monsoon season. In El Paso, monsoon season is during the months of June and September and the driest months are January to March [12]. The occurrence of convective cases during the hot/moist summer and the cold/dry during January explains the lack of convective cases during that month.
The time of the day in which the event took place is shown in Figure 7. The first thing that can be observed is that there are no cases happening between 2:00 and 6:00 local time. Most synoptic cases took place around 14:00, while convective cases took place around 17:00 (Figure 7). Synoptic cases appeared more between the 14:00 and 16:00 h, showing a decrease in the frequency as it gets later in the day. Convective cases can be seen to happen more during the times 16:00 to 18:00. Most of these cases took place at 17:00. The peak time for synoptic cases was 14:00, while the peak time for convective cases was later in the day at 17:00.
Figure 8 shows the frequency of PM10 concentrations for each case. For both cases, we observed a variety of PM10 concentrations ranging from 130 μg/m³ to 2380 μg/m³.
We expected, based on previous studies, that dust storms would be associated with dry conditions with higher winds [10]. Dry conditions lead to mineral dust and other soil particles that may be lofted by wind flows. Both dry conditions and higher winds may be associated with higher temperatures [10,23]. In mountainous regions, adiabatic compression and expansion can lead to high wind speeds for air that is warmed through the adiabatic compression. Lower humidity will be associated with drier soil conditions. Air with lower absolute humidity levels will have a lower overall heat capacity and, given a dry surface layer, together these conditions will lead to greater convection, which will loft mineral dust and other soil particles into the mixed atmospheric layer. For all of these reasons, we expected that dust storms would be associated with lower humidity and greater temperatures. Our data showed that most synoptic cases had temperatures between 66 °F and 85 °F, while the majority of convective cases had 75 °F to 95 °F temperatures (Figure 9). Synoptic cases are those with a cold front. In these cases, a cold air mass is displacing warm air, causing lower temperatures compared to the convective cases. In terms of % relative humidity, synoptic cases showed a tendency to have lower relative humidity cases; however, it is the only category that reached relative humidity greater than 45°. The convective category did not show any case with low relative humidity in the 0° to 5° range. Convective cases had more cases in the 30° to 35° range. For convective causes, we observed the presence of thunderstorms, which explains the higher relative humidity values compared to the other cases (Figure 10).
Synoptic cases had greater wind speeds at the time of the maximum PM10 concentration compared to the others (Figure 11). The wind speed range occurring most was that of 15 mph to 20 mph, while the one with the least occurrences was the 0 mph to 5 mph cases. For the convective cases, wind speed is lower, contributing to a lower aerosol loading in the atmosphere than in the synoptic cases (Figure 8).
We also looked at the speeds reached relative to the presence of cold fronts. The threshold to separate high speeds from low wind speeds was 20 mph. This threshold value was selected since a dust event is defined as having PM10 higher than 150 μg/m³ and wind gusts higher than 22 mph [3]. From Table 1 we can observe that, when there is a cold front, we can have almost the same number of cases with both low speed and high speeds. On the other hand, when there is no cold front present, most of the cases showed lower speeds and only two showed high speeds.

4.3. Planetary Boundary Layer and Dust Events

Out of the 74 cases, we had ceilometer data for 40 days. In some of those 40 cases, we saw a drop in the PBL. The amount of the drop varied from each case. We selected two representative events. Representing the synoptic case, we have the event that took place on 16 March 2021. The other representative event took place on 21 February 2022, and this event is the convective case. These events were selected because they were the ones with the highest PM10 concentration and we had ceilometer data available.

4.3.1. 16 March 2021

On 16 March 2021, the region experienced a dust event that had a maximum PM10 concentration of 2364.9 μg/m³. For this day, we were able to obtain satellite images using the NASA Worldview (https://worldview.earthdata.nasa.gov, accessed on 1 August 2023). The satellite image shows the day before, the day of the event, and the day after (Figure 12). This event is categorized as a synoptic event because it had a cold front coming from the west (Figure 13).
This event took place at 13:00 local time (Figure 14b). This day had low PM10 concentrations below 250 μg/m³. Around 11:00, the PM10 concentrations started increasing until reaching a maximum of 2364.9 μg/m³ at 13:00. Then, the PM10 concentration started decreasing once again until it returned to the original levels around 21:00. The ceilometer profile (Figure 14a) shows that, at the time of the maximum PM10 concentration (13:00), the PBL collapsed and then it returned to its original height. The time of the collapse coincides with the time of the maximum PM10 concentrations. We conclude that this drop in the PBL height is due to the cold front that is present (Figure 13). A cold front is when a mass of cold air moves and displaces warm air present [24]. Figure 14c,d show that, at 13:00, the outdoor temperature started decreasing, showing the presence of a cold air mass. This drop in temperature at 13:00 is not a typical day in El Paso, TX, since, on a regular day in March, temperatures drop until the evening hours. Figure 14d shows that the dew point temperature increases due to the change in air masses from warm and dry to cold and moist. The dew point increases are associated with the passing of the cold front which transports aerosols to the PBL and causes the collapse.

4.3.2. 21 February 2022

The second event that we are going to observe took place on 21 February 2022. This event was categorized as convective due to the absence of a cold front (Figure 15). This event had a maximum PM10 concentration of 1274.3 μg/m³ at 14:00 local time. For this day, we had low PM10 concentrations of 20.7 μg/m³ that started to increase around noon until reaching the peak at 14:00. The PM10 concentration then started to decrease to low concentrations at 20:00. The ceilometer profile for this case also shows a PBL collapse around the time of the maximum PM10 concentration, which then started to go back to the original height after the event had passed (Figure 16). The drop in PBL height while there is an absence of a cold front can be explained because dust has a cooling effect, which inhibits the PBL height because it reduces solar radiation [25].

5. Conclusions

This first comprehensive study analyzed the intricate relationship between particulate matter and the PBL heights in the unique environmental context of El Paso, Texas, surrounded by the Chihuahuan Desert. Through detailed analysis of PM10 concentrations and corresponding heights during the period from 2016 to 2022, the research identified and categorized 74 dust events as synoptic or convective occurrences. Notably, synoptic events were recorded predominantly in the spring months, aligning with the passage of cold fronts, while convective cases were observed during the summer monsoon months, linked to local convective systems, i.e., thunderstorms [12,18]. The temporal analysis further revealed that synoptic events were typically recorded in the early afternoon, characterized by lower temperatures, whereas convective cases were more prevalent in the late evening, coinciding with high temperatures. The prevailing westward direction of winds underscored the synoptic nature of most events.
In this study, we also observed and analyzed the variations in the PBL height coinciding with the peak PM10 concentrations. The sudden drop in the PBL height was attributed to distinct factors, where synoptic cases witnessed PBL height reduction due to the passage of cold fronts. Convective events observed a decline in PBL height due to diminished solar radiation caused as a result of high PM10 concentrations in the air. Two representative dust events on 16 March 2021 and 21 February 2022 illustrated these effects, demonstrating a synchronous decline in PBL height with peak PM10 levels. The findings not only enhance our understanding of the dynamics between PM and PBL but also emphasize the significance of local meteorological conditions in shaping the behavior of dust events. As the first comprehensive study of its kind in this region, this research lays a crucial foundation for future investigations into the environmental impacts and health impacts associated with dust events in El Paso, Texas.

Author Contributions

Conceptualization J.G.-G. and R.M.F.; methodology J.G.-G., R.M.F., N.N.K., R.K.S. and W.R.S.; validation J.G.-G., R.M.F., N.N.K., R.K.S. and W.R.S.; formal Analysis J.G.-G., R.M.F., N.N.K., R.K.S. and W.R.S.; investigation J.G.-G.; resources J.G.-G. and N.N.K.; original draft preparation J.G.-G.; writing, review and editing J.G.-G., R.M.F., N.N.K., R.K.S. and W.R.S.; supervision R.M.F., R.K.S. and W.R.S.; project administration, R.M.F.; funding acquisition, R.M.F. All authors have read and agreed to the published version of the manuscript.

Funding

This research was supported by TCEQ and by the NOAA Center for Atmospheric Science—Meteorology (NCASM II), which is funded by the U.S. Department of Commerce, National Oceanic and Atmospheric Administration, Educational Partnership Program under Agreement No. NA22SEC4810015.

Institutional Review Board Statement

Not applicable.

Informed Consent Statement

Not applicable.

Data Availability Statement

The authors acknowledge the Texas Commission on Environmental Quality (TCEQ) for providing archived air quality data to use. The data that support the findings of this study are openly available in AQI and Data Reports at https://www.tceq.texas.gov/airquality/monops/data-reports, accessed on 15 June 2023.

Conflicts of Interest

The authors declare no conflict of interest.

References

  1. Chen, L.; Zhang, M.; Zhu, J.; Skorokhod, A. Model analysis of soil dust impacts on the boundary layer meteorology and air quality over East Asia in April 2015. Atmos. Res. 2017, 187, 42–56. [Google Scholar] [CrossRef]
  2. Saha, S.; Sharma, S.; Chhabra, A. Impact of a dust storm on the atmospheric boundary layer: A case study from Western India. Nat. Hazards 2022, 113, 143–155. [Google Scholar] [CrossRef]
  3. Herrera-Molina, E.; Ochoa, A.; Gill, T.; Mejia, G.; Herrera, C. Conceptualization of a predictive model for analysis of the health outcomes of dust events in a society with köppen climate classification BW. In Data-Centric Business and Applications; Springer: Berlin/Heidelberg, Germany, 2019; Volume 2, pp. 205–234. [Google Scholar]
  4. Lee, J.A.; Gill, T.E.; Mulligan, K.R.; Dominguez Acosta, M.; Perez, A.E. Land use/land cover and point sources of the 15 December 2003 dust storm in southwestern North America. Geomorphology 2009, 105, 18–27. [Google Scholar] [CrossRef]
  5. Rivera-Lynch (former Rivera Rivera), N.; Gill, T.; Gebhart, K.; Hand, J.; Bleiweiss, M.; Fitzgerald, R.M. Wind modeling of Chihuahuan desert dust outbreaks. Atmos. Environ. 2009, 43, 347–354. [Google Scholar] [CrossRef]
  6. Steward, D.R.; Saunders, E.; Perea, R.; Fitzgerald, R.M.; Campbell, D.E.; Stockwell, W.R. Projected changes in particulate matter concentrations in the South Coast air basin due to basin–wide reductions in nitrogen oxides, volatile organic compounds, and ammonia emissions. J. Air Waste Manag. Assoc. 2019, 69, 192–208. [Google Scholar] [CrossRef] [PubMed]
  7. Lara, P.; Fitzgerald, R.M.; Karle, N.N.; Talamantes, J.; Miranda, M.; Baumgardner, D.; Stockwell, W.R. Winter and wildfire season optical characterization of black and brown carbon in the El Paso-Ciudad Juárez airshed. Atmosphere 2022, 13, 1201. [Google Scholar] [CrossRef]
  8. Lu, D.; Fitzgerald, R.M.; Stockwell, W.R.; Reddy, R.S.; White, L. Numerical simulation for a wind dust event in the US/Mexico border region. Air Qual. Atmos. Health 2013, 6, 317–333. [Google Scholar] [CrossRef]
  9. Kim, D.; Chin, M.; Remer, L.A.; Diehl, T.; Bian, H.; Yu, H.; Brown, M.E.; Stockwell, W.R. The role of surface wind and vegetation cover in multi-decadal variations of dust emission in the Sahara and Sahel. Atmos. Environ. 2017, 148, 282–296. [Google Scholar] [CrossRef]
  10. Medina, R.; Stockwell, W.R.; Fitzgerald, R.M. Optical Characterization of Mineral Dust and Soot Particles in the El Paso-Juarez Airshed. Aerosol Sci. Eng. 2018, 2, 11–19. [Google Scholar] [CrossRef]
  11. Polanco, J.; Ramos, M.; Fitzgerald, R.M.; Stockwell, W.R. An improved method for optical characterization of mineral dust and soot particles at the El Paso-Juárez airshed. Atmosphere 2020, 11, 866. [Google Scholar] [CrossRef]
  12. Novlan, D.; Hardiman, M.; Gill, T. A synoptic climatology of blowing dust events in El Paso, Texas from 1932-2005. In Proceedings of the 87th AMS Annual Meeting, San Antonio, TX, USA, 13–18 January 2007. [Google Scholar]
  13. Yadav, R.; Sahu, L.K.; Beig, G. Ambient particulate matter and carbon monoxide at an urban site of India: Influence of anthropogenic emissions and dust storms. Environ. Pollut. 2017, 225, 291–303. [Google Scholar] [CrossRef] [PubMed]
  14. Chhabra, A.; Turakhia, T.; Chauhan, P. Impacts of a mesoscale dust storm on aerosols characteristics, optical and radiative properties over a semiarid region, Western India. J. Indian Soc. Remote Sens. 2021, 49, 2133–2141. [Google Scholar] [CrossRef]
  15. Sharma, D.; Singh, D.; Kaskaoutis, D.G. Impact of two intense dust storms on aerosol characteristics and radiative forcing over Patiala, Northwestern India. Adv. Meteorol. 2012, 2012, 956814. [Google Scholar] [CrossRef]
  16. Hu, X.M. Boundary Layer and Air Pollution. Air Pollut. Met. 2015, 10, 978–1016. [Google Scholar] [CrossRef]
  17. Karle, N.N.; Mahmud, S.; Sakai, R.K.; Fitzgerald, R.M.; Morris, V.R.; Stockwell, W.R. Investigation of the Successive Ozone Episodes in the El Paso–Juarez Region in the Summer of 2017. Atmosphere 2020, 11, 532. [Google Scholar] [CrossRef]
  18. Karle, N.N.; Fitzgerald, R.M.; Sakai, R.K.; Sullivan, D.W.; Stockwell, W.R. Multi-scale atmospheric emissions, circulation and meteorological drivers of ozone episodes in El Paso-Juárez airshed. Atmosphere 2021, 12, 1575. [Google Scholar] [CrossRef]
  19. Alizadeh, C.O.; Zawar-Reza, P.; Sturman, A. Feedback between windblown dust and planetary boundary-layer characteristics: Sensitivity to boundary and surface layer parameterizations. Atmos. Environ. 2012, 61, 294–304. [Google Scholar] [CrossRef]
  20. Kumari, S.; Lakhani, A.; Kumari, K.M. Transport of aerosols and trace gases during dust and cropresidue burning events in Indo-Gangetic Plain: Infuence on surface ozone levels over down wind region. Atmos. Environ 2020, 241, 117829. [Google Scholar] [CrossRef]
  21. Maldonado, A.; Camacho-Alamilla, R.; Torres, S.; García-Alcaraz, J.; Limon, J. Determination of burnout syndrome among middle and senior managers in manufacturing industry in Ciudad Juarez. Procedia Manuf. 2015, 3, 6459–6466. [Google Scholar] [CrossRef]
  22. Prospero, J.M.; Ginoux, P.; Torres, O.; Nicholson, S.E.; Gill, T.E. Environmental characterization of global sources of atmospheric soil dust identified with the nimbus 7 total ozone mapping spectrometer (toms) absorbing aerosol product. Rev. Geophys. 2002, 40, 2-1–2-31. [Google Scholar] [CrossRef]
  23. Karle, N.N.; Sakai, R.K.; Fitzgerald, R.M.; Ichoku, C.; Mercado, F.; Stockwell, W.R. Systematic analysis of virga and its impact on surface particulate matter observations. Atmos. Meas. Tech. 2023, 16, 1073–1085. [Google Scholar] [CrossRef]
  24. Whiteman, C. Mountain Meteorology: Fundamentals and Application; Oxford University Press: New York, NY, USA, 2000; pp. 77–79. ISBN 978-0-19-803044-7. [Google Scholar]
  25. Zhang, X. Dust–planetary boundary layer interactions amplified by entrainment and advections. Atmos. Res. 2022, 278, 106359. [Google Scholar] [CrossRef]
Figure 1. Regional map showing location of El Paso surrounded by the Chihuahuan Desert [20].
Atmosphere 15 00110 g001
Figure 2. Map of El Paso, Texas. Three CAMS sites used in this study are denoted with a star.
Atmosphere 15 00110 g002
Figure 3. Windroses of all high PM10 concentration cases found in each CAMS.
Atmosphere 15 00110 g003
Figure 4. Windroses of the selected 74 dust event cases in each CAMS.
Atmosphere 15 00110 g004
Figure 5. Monthly distribution of dust events.
Atmosphere 15 00110 g005
Figure 6. Monthly distribution according to the type of event.
Atmosphere 15 00110 g006
Figure 7. The time of the maximum PM10 for each event (local time).
Atmosphere 15 00110 g007
Figure 8. The frequency of PM10 concentrations.
Atmosphere 15 00110 g008
Figure 9. The temperature at the time of highest PM10 concentration.
Atmosphere 15 00110 g009
Figure 10. The relative humidity during the time of maximum PM10 concentration.
Atmosphere 15 00110 g010
Figure 11. Wind speed at the time of maximum PM10 concentration.
Atmosphere 15 00110 g011
Figure 12. Satellite image of dust event in El Paso, TX (https://worldview.earthdata.nasa.gov/, accesed on 1 August 2023.
Atmosphere 15 00110 g012
Figure 13. Surface analysis map of the event on 16 March 2021 (www.wpc.ncep.noaa.gov/archives, accessed on 15 June 2022).
Atmosphere 15 00110 g013
Figure 14. (a) Aerosol backscatter profile of 16 March 2021. The profile shows the PBL height with respect to local time. (b) PM10 concentration with respect to local time. (c) Outdoor temperature with respect to local time. (d) Dew point temperature with respect to local time.
Atmosphere 15 00110 g014
Figure 15. Surface analysis map of event on 21 February 2022 (www.wpc.ncep.noaa.gov/archives, accessed on 15 June 2022).
Atmosphere 15 00110 g015
Figure 16. (a) Aerosol backscatter profile of 21 February 2022. The profile shows the PBL height with respect to local time. (b) PM10 concentration with respect to local time. (c) Outdoor temperature with respect to local time. (d) Solar radiation with respect to local time.
Atmosphere 15 00110 g016
Table 1. Cases with cold fronts tend to have both low and high wind speeds, while those without a cold front tend to favor lower speeds.
TotalHigh SpeedsLow Speeds
Cold Front462422
No Cold Front28226
Disclaimer/Publisher’s Note: The statements, opinions and data contained in all publications are solely those of the individual author(s) and contributor(s) and not of MDPI and/or the editor(s). MDPI and/or the editor(s) disclaim responsibility for any injury to people or property resulting from any ideas, methods, instructions or products referred to in the content.

