Review

Methods for Urban Air Pollution Measurement and Forecasting: Challenges, Opportunities, and Solutions

by
Elena Mitreska Jovanovska
1,
Victoria Batz
2,
Petre Lameski
1,*,
Eftim Zdravevski
1,
Michael A. Herzog
2 and
Vladimir Trajkovik
1
1
Faculty of Computer Science and Engineering, Ss Cyril and Methodius University in Skopje, 1000 Skopje, North Macedonia
2
Magdeburg Faculty of Computer Science, Magdeburg-Stendal University of Applied Sciences, 39011 Magdeburg, Germany
*
Author to whom correspondence should be addressed.
Atmosphere 2023, 14(9), 1441; https://doi.org/10.3390/atmos14091441
Submission received: 27 July 2023 / Revised: 23 August 2023 / Accepted: 8 September 2023 / Published: 15 September 2023
(This article belongs to the Section Air Quality)

Abstract

:
In today’s urban environments, accurately measuring and forecasting air pollution is crucial for combating the effects of pollution. Machine learning (ML) is now a go-to method for making detailed predictions about air pollution levels in cities. In this study, we dive into how air pollution in urban settings is measured and predicted. Using the PRISMA methodology, we chose relevant studies from well-known databases such as PubMed, Springer, IEEE, MDPI, and Elsevier. We then looked closely at these papers to see how they use ML algorithms, models, and statistical approaches to measure and predict common urban air pollutants. After a detailed review, we narrowed our selection to 30 papers that fit our research goals best. We share our findings through a thorough comparison of these papers, shedding light on the most frequently predicted air pollutants, the ML models chosen for these predictions, and which ones work best for determining city air quality. We also take a look at Skopje, North Macedonia’s capital, as an example of a city still working on its air pollution measuring and prediction systems. In conclusion, there are solid methods out there for air pollution measurement and prediction. Technological hurdles are no longer a major obstacle, meaning decision-makers have ready-to-use solutions to help tackle the issue of air pollution.

1. Introduction

Air pollution is related to more than seven million premature deaths worldwide, and researchers from many scientific fields are trying to discover the impact of air pollutants on human beings and the environment [1]. According to the latest World Health Organization (WHO) guidelines on air pollution, even small amounts (less than the official minimal recommendation) can affect human health. Air pollution causes various diseases such as cancer, respiratory and heart diseases, neuro-degenerative, and other concerning conditions in all age groups [1]. Usually, the reason for more considerable air pollution is urbanization, including transport, energy, households, industry, and agriculture, which heavily rely on burning fossil fuels and other cancer-causing materials [2]. According to a Euronews article [3], in the Republic of North Macedonia, around 1000 people die yearly because of air pollution, out of a population of less than two million.
When we think of air pollution, we often discuss the particulate matter (PM) levels in the air. Particulate matter is worsening the quality of life in urban areas. It is responsible for many severe diseases, since they can enter the lungs and bloodstream, leading to acute and chronic health problems [4]. This is why raising public awareness about particulate matter pollution is essential. Additionally, many scientific papers deal with particulate matter prediction. Highly accurate models for pollution prediction would allow decision-makers and authorities to take preventive measures and allow for timely reactions. Many publications focus on certain acute or chronic diseases caused by air pollution.
Liu et al. [5] discuss the proven negative influence of air pollution on human health and try to detect patterns in order to predict the air quality in advance, also predicting the health effects on human beings. Further reviews on the topic, such as [6], focus on the application of deep learning methods in particular.
Furthermore, this review aims to compare worldwide accomplishments on this topic with research in the capital city of North Macedonia, Skopje, which ranks as one of the most polluted cities in Europe, mainly in terms of particulate matter (PM10 and PM2.5). In the Republic of North Macedonia, several cities have severe problems with air pollution, especially in the winter period. In Skopje, it is mainly a consequence of temperature inversion, since larger cities in North Macedonia are placed in valleys surrounded by mountains and usually have low wind circulation [7]. Different sources are blamed for the pollution, such as: large energy consumers that use forbidden fuels; heavy industry; citizens who mostly use wood, wooden derivatives, and waste for heating; driving old vehicles with defective filters; etc [8].
The paper is organized as follows: Section 2 elaborates on relevant literature reviews that correlate with our research. In Section 3, the methodology is explained for narrowing down our literature review dataset. The results are presented in Section 4 from analyzing the selected publications. In Section 6, we give an overview of the current research and development for the Skopje city area as an example of a highly polluted city. The results are discussed in Section 5, while Section 7 concludes the paper.

2. Related Work

Since air pollution poses a big problem in developing countries and affects a lot of people, the interest in air pollution management, measurement, and prediction and in spreading awareness is very high. There are several scientific literature reviews that tackle the problem of air pollution forecasting algorithms and offer conclusions to mitigate the problem from different perspectives.
Many other reviews, such as [9], focus primarily on the health impact of air pollution under specific circumstances. These reviews target the consequences of air pollution, which are important for raising public awareness; however, they lack a technological perspective. Out of 2482 articles screened, 116 studies were included, reporting 355 separate pollutant–COVID-19 estimates. The results showed that approximately half of the evaluations found positive and significant associations between air pollution and COVID-19 incidence and mortality, while the association with non-fatal severity was lower. Longer exposure to pollutants appeared to have a stronger positive association with COVID-19 incidence. PM2.5, PM10, O3, NO2, and CO were the pollutants most strongly associated with COVID-19 incidence, and PM2.5 and NO2 were associated with COVID-19 deaths. However, all studies were observational and had a high risk of confounding and outcome measurement biases. Another publication also refers to the impact of COVID-19 on pollution [10]. In that study, researchers introduced a new framework to analyze the concentrations of nitrogen dioxide (NO2) and ozone (O3) across 62 Taiwanese cities. They compared four meteorological-normalization techniques to determine the impact of meteorology and emissions on air quality, especially during the COVID-19 period without a lockdown. The study found that, throughout 2020, even without lockdowns, meteorological-normalized NO2 and O3 levels in Taiwan decreased by 14.9 % and 5.8 % , respectively, offering new perspectives on sustainable air quality management.
Kang et al. [11] discuss the application of big data and machine learning approaches for air quality prediction. Their work highlights the growing availability of vast amounts of data, such as meteorological information, air quality monitoring data, and satellite imagery, which can be leveraged for accurate and timely air quality forecasts. The authors emphasize the need for advanced computational techniques to handle and process such big data efficiently. The article explores various machine learning methods, including regression models, support vector machines, random forests, and neural networks, which have been utilized for air quality prediction. These models leverage the available data to learn complex relationships and patterns, enabling them to make accurate predictions of pollutant concentrations. The advantages of using machine learning approaches are discussed, such as their ability to handle non-linear relationships, incorporate diverse data sources, and adapt to changing environmental conditions. They also highlight the challenges associated with air quality prediction, such as data quality issues, the need for feature selection and reduction of big data, and the interpretability of complex models. The article concludes by emphasizing the potential of big data and machine learning for improving air quality prediction systems. It suggests that these approaches can aid in developing more effective air pollution control strategies, facilitating early warning systems, and informing policy decisions.
The literature review by Zaini et al. [6] focuses on the application of deep learning neural networks for time series air quality forecasting. The authors conducted a comprehensive analysis of existing studies to evaluate the performance and effectiveness of deep learning models in predicting air quality parameters. The review identified various deep learning architectures used in air quality forecasting, including convolutional neural networks (CNNs), recurrent neural networks (RNNs), long short-term memory (LSTM) networks, and their variants. These models are specifically designed to capture temporal dependencies and patterns in time series data. The findings suggest that deep learning neural networks have demonstrated promising performance in air quality forecasting tasks. They exhibit the ability to capture complex nonlinear relationships between air quality parameters and various influencing factors, such as meteorological conditions and pollutant emissions. The authors also discuss the key factors influencing the performance of deep learning models, such as input data representation, network architecture design, hyperparameter tuning, and model training strategies. The work emphasizes the importance of appropriate data preprocessing and feature engineering techniques to enhance prediction accuracy. Overall, the review concludes that deep learning neural networks show considerable potential for time series air quality forecasting. However, further research is needed to address certain challenges, including the interpretability of deep learning models, data scarcity in some regions, and the need for benchmark datasets and standardized evaluation metrics.
This review by Méndez et al. [12] provides an overview of air quality forecasting approaches since 2011. The authors conducted a search in major scientific databases and selected 155 relevant publications for analysis. The geographic analysis revealed a correlation between the most polluted countries and the most studied countries. The study found that the Air Quality Index (AQI) was commonly used in approximately half of the papers, and PM2.5 was the most predicted pollutant, due to its hazardous nature. Pollutant features and weather variables were widely used in the analyzed papers. In terms of ML techniques, deep learning (DL) algorithms were more popular than regression algorithms. LSTM and MLP were the most used DL algorithms, while SVR and RF were the most used regression algorithms. Other algorithms such as CNN, RNN, GRU, auto-encoders, DT, ARIMA, KNN, and Boosting were also employed, but less frequently. The paper also mentions recent trends in air quality forecasting. Deep transformer networks, originally developed for natural language processing, have been extended to time series analysis, including air quality forecasting. Graph neural networks, which leverage dynamic interactions between neighboring entities, have gained popularity. Temporal convolutional networks (TCNs) have been applied to predict PM2.5 concentrations. Complex event processing (CEP) has been used for analyzing and predicting air quality. To summarize, this paper provides an overview of the air quality forecasting approaches and highlights emerging trends and techniques in the field.
Our review offers a comprehensive examination of the current tools and methodologies employed in air pollution monitoring and forecasting. More than just a broad overview, we aim to emphasize the standout measurement and forecasting models designed specifically for addressing outdoor air pollution in urban contexts. Significantly, we have identified and sought to address a notable research gap evident in other review publications: a distinct lack of detailed information concerning the types of sensors used, the specific pollutants these sensors detect, and the datasets harnessed for analysis. By addressing these gaps, our review uniquely collates data about sensors, methods, and their real-world applications, providing readers with a consolidated understanding of the concerted efforts to mitigate air pollution challenges through technological interventions. Furthermore, our spotlight on Skopje, a city that ranks among the most polluted urban areas in Europe and globally, underscores the ongoing initiatives and highlights the transformative role of modern technology in mitigating its prolonged air pollution issues.
To fill the research gap evident in current reviews, we have framed specific research questions that are addressed through our literature review insights. The questions we posed are:
  • What are the most prevalent methods for air pollution forecasting (i.e., prediction) published in the last eight years?
  • What are the strengths and limitations of the ML approaches for air pollution forecasting?
  • What are the most prevalent input data modalities for air pollution forecasting?
  • What are the most dominant sensor types for urban air pollution forecasting?
  • What are the current research and technological gaps in air pollution research related to the city of Skopje, North Macedonia?

3. Methods

In this section, we define the search and selection strategy for the review and the research questions that we try to answer using the analysis of these publications.

3.1. Air Pollution Monitoring and Prediction

The most common pollutants measured are PM (Particulate Matter) 1, 2.5, and 10 because they are officially proclaimed as carcinogenic and can penetrate deep into the lungs and other organs, causing diseases. Other important air pollutants are NO2 (nitrogen dioxide), SO2 (sulfur dioxide), CO (carbon monoxide), O3 (ozone), and noise [2]. Air pollution can be measured outdoors, indoors in urban or rural areas, as well as in industrial areas where there is a necessity to measure the air quality. Depending on the purpose of monitoring, different types of sensors are used for the respective air pollutants. The parameters are measured through sensors mounted on professional machines such as the Air Pointer [13], or on custom-made boxes containing the sensors, which are more affordable. However, their precision values should be calibrated to the professional measuring stations. The size of the network of low-cost sensors makes a difference in determining outdoor air pollution in cities. Data are sent through WiFi, 4G, or LoraWan networks to a cloud database for further analysis.
Many studies have focused on the adverse effect that pollution has on health and have continuously proven this phenomenon [14,15]. Nevertheless, the actual exposure of people is very difficult to estimate using outdoor sensors for each pollutant. There is still ongoing research on this, and various models are proposed.

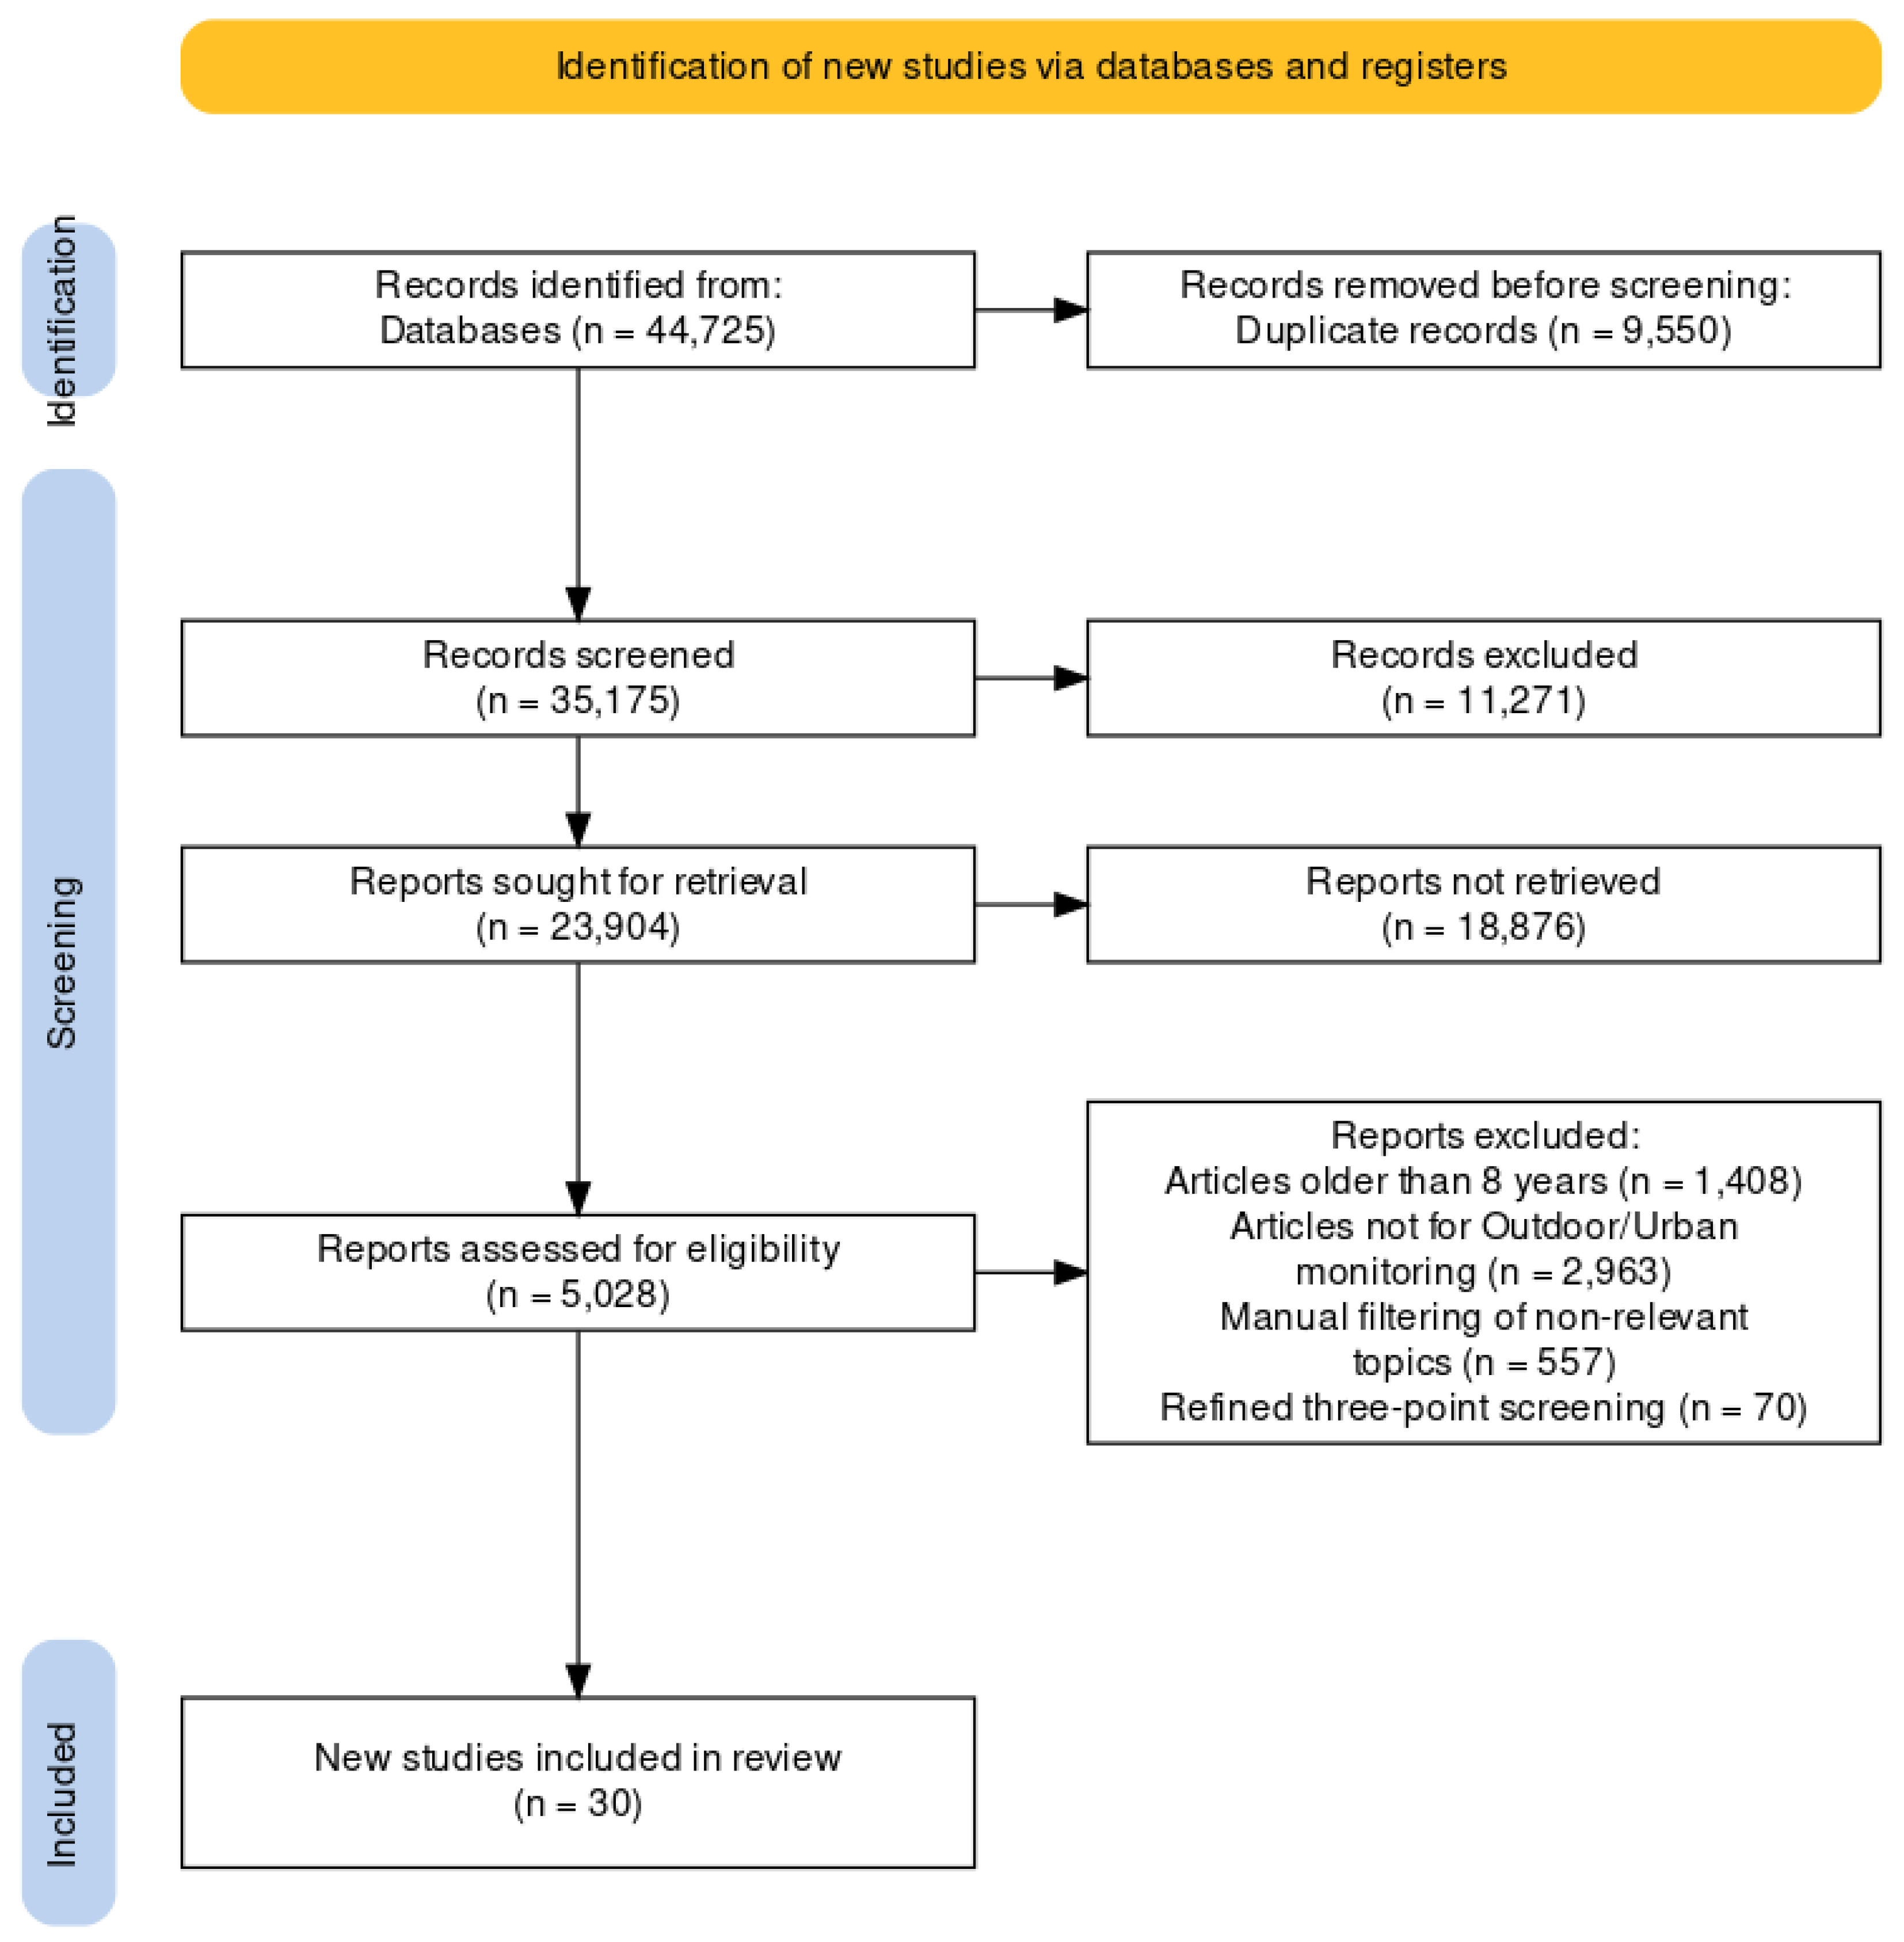
3.2. Search and Selection Strategy

We used a natural language processing (NLP) framework [16] that automatically performs scientific article searches and filtering from different databases such as PubMed, Springer, IEEE, MDPI, and Elsevier, following the PRISMA methodology [17]. From the set of articles on this topic (a total of 5028), further manual filtering was performed on the year of publication and language, taking into consideration only articles from the last eight years written in the English language, from which we ended up with 3620 articles. Next, we included only articles that contained outdoor and/or urban sensors, and we ended up with 657 articles. Moreover, we excluded articles where no direct machine learning approach was detected, to finish with nearly 100 articles that needed to be closely examined. From these 100 articles, three separate reviewers performed parallel selection based on their relevance, such as whether they were published in journals, the existence of prediction models, and the datasets and sensors used. This refined three-point screening additionally excluded 70 articles. Finally, 30 articles were selected to be further analyzed in depth. In addition to these articles, other scientific publications about the pollution problem in Skopje from measurement and predictive perspectives were separately analyzed. The flow of the PRISMA methodology is depicted in Figure 1.

4. Results

4.1. Data Extraction from Selected Papers

In this section, we present the results of the review. The analysis of the selected publications is presented in Table 1.

4.2. In-Depth Analysis of the Selected Papers

We conducted a keyword evaluation and depicted the word frequencies from the paper abstracts using a word cloud. The resulting visualization can be seen in Figure 2.
Based on the keyword analysis, it is evident that terms like “pollution,” “quality,” “exposure,” “model,” “data,” and “prediction” appear most frequently. This aligns well with our search parameters. In the following text, we give a more detailed analysis of each of the selected publications. Authors in [18] created a network of sensors mounted on public buses on the most frequented streets in Lausanne, Switzerland. The sensors were gathering various parameters for air quality, including the ultrafine particle values through LDSA (lung deposited surface area) stamped with geo-spatial data for 14 months. They propose a state-of-the-art approach composed of three different modeling methods in order to generate a more precise air quality prediction. This research was completed in 2015, and they used a log-linear regression model, KNN (k-nearest neighbor) model, network-based log linear regression model, and a probabilistic graphical model. The results from the evaluation set performed by RMSE, R2, and FAC2 showed that KNN gave poor outcomes with these data, and the second network-based log linear regression method gave better outcomes, showing the positive impact of proposing a virtual network to the model. However, the third method, or the probabilistic graphical model (PGM), gave the best performance, because it caught all the dependencies between segments and between the LDSA values of each segment.
The authors in [21] developed an end-to-end modeling framework for air pollution prediction of PM2.5, PM10, and nitrogen dioxide (NO2), which they claim outperforms other regression models. They collected the data from a central pollution board for Delhi, India. All major pollutants and meteorological data were gathered from the stations, along with the time and data series. They used the Google Cloud architecture and the following prediction models: random forest, LSTM (long short-term memory network), LSTM-A (attention-based long short-term memory network), BiLSTM (bidirectional long short-term memory network), and BiLSTM-A (attention-based bidirectional LSTM network). For performance evaluation of the regression methods, they calculated the root mean square error (RMSE) and R squared ( R 2 ). Best performance was from BiLSTM-A for all pollutants except PM2.5, where random forest had the better performance. However, when data are updated every week in real time, there is a need for an adaptive model, more precisely for BiLSTM-A, which gives even better results.
In [19], an IoT-based air pollution monitoring and prediction system was developed, utilized for monitoring air pollutants, air quality analysis, and forecasting. For the prediction, they used the RNN (recurrent neural network) ML algorithm, more specifically, LSTM (long short-term memory). Another recent research study [20] also uses the IoT infrastructure and BigData algorithms for smart city analysis and prediction of pollution. They also use RNNs (recurrent neural networks) to predict air pollution in Chennai, through gathered gases NO2 and SO2.
The authors in [22] determine the AQI (Air Quality Index) using machine learning techniques. The meteorological and pollution parameters are collected using the Arduino Uno platform, and afterwards, past data are used to train the model with linear regression, random forest regression, and decision tree methods. Their results show that the scenario random forest, as a meta-estimator that combines many decision trees, gave the best results.
The research in [23] focused on some specific areas in San Isidro, Lima, Peru. They used Alphasense outdoor sensors to obtain data for six days in April 2017, measuring CO2, VOCs (alcohols, aldehydes, aliphatic hydrocarbons, amines, aromatic hydrocarbons, CH4, LP G, ketones and organic acids), CO, SO2, O3, and NO2. Together with the standard meteorological parameters, a time series analysis was performed that measured the time slot from 8:00 a.m. to 12:30 p.m. For air quality prediction, they used artificial neural networks (ANNs). The gathered parameters from low-cost sensors were divided into 3 sets, from which 70 percent of the data were used for training, 20 percent for validation, and 10 percent for testing. For prediction accuracy of the forecasting method, mean absolute percentage error (MAPE) was used, and to quantify the performance, the root mean square error (RMSE) was used. The results showed that ANN can give high accuracy prediction results in short-term emission forecasting.
Another approach to determining air pollution is through image analysis and recognition, such as in [24,25,26,34]. Particulate matter less than or equal to 2.5 is proven to be very dangerous for human health, so the study presented in [24] tries to determine PM2.5 levels, capturing 1460 outdoor pictures with resolutions higher than 584 × 389 in different parts of Beijing, China. It is still a challenge to accurately predict pollution levels solely through images; however, there are continuous advancements on this topic. The authors in this research chose to use deep learning methods for prediction from images. More specifically, the PM2.5 predictions were performed by a combination of three convolutional neural networks (CNNs) such as VGG-16, Inception-V3, and ResNet5. For evaluation of the regression problem, root mean square error (RMSE) and R squared were used. The results showed that the combination of these three CNN methods gave more precise results when trying to predict air pollution of PM2.5 though images than any of them did individually. The authors in [25] are deepening the same prediction by incorporating images from Beijing and Shanghai City, adding two weather features (humidity and wind speed), and including support vector regression (SVR) techniques to the existing CNN methods. The final estimated PM2.5 index uses the created SVR model, and the results showed even better performance than in their earlier research. The research in [26] is also trying to predict PM2.5 and PM10 levels by taking outdoor images in central Hong Kong. However, they chose to use spatial-temporal features of sequential images (3024 outdoor images during the day and at night) taken from smartphones from the same location on a building and labeled with the corresponding values of PM2.5 and PM10 from the corresponding calibrated small portable air-quality sensors. They first use a combination of deep learning models like Residual Network (ResNet) and long short-term memory (LSTM) to predict the PM values from the nighttime images. Furthermore, a novel Met–ResNet–LSTM model is developed based on the newly developed ResNet–LSTM model, taking into account six meteorological features, in addition to images taken from smartphones as inputs, which gives even better estimation performance when compared to the ResNet–LSTM model.
The sensors used long-range (LoRa) wireless communication technology to achieve better coverage and low power consumption in [47]. They collected four parameters (temperature, humidity, dust, and carbon dioxide) in the time period from 1 June 2018 to 22 July 2018. Based on the collected air quality parameters for the past two months, a machine learning model has been trained using the Python programming language and the ARIMA model (auto-regressive integrated moving average). In the proposed system, a grid search is used to determine the value of p, d, and q. For checking, the mean squared error (MSE) was used.
In the Fenwei Plain urban agglomeration (11 cities), Xi’an has been the center of economic development in northwest China. The authors in [45] are trying to evaluate the current situation, predicting air quality through five haze hazard assessment models created with the improvement of the IPSO (Improving Particle Swarm Optimization) and LightGBM (Light Gradient Boosting Machine) algorithms. They collected data for two winter months in 2021. The matter–element extension (MEE) model was used for evaluation, with the entropy weight method. The indicator weights were determined by improving the principal component analysis (PCA) method, which indicates that the proposed PCA–MEE–ISPO–LightGBM model result gives us a more precise picture of the air pollution through haze determination.
Another research study [44] used a hybrid model for more precise prediction of PM2.5 in different areas, since this air quality parameter often fluctuates, which makes it harder to objectively catch it with high accuracy. The model combines XGBoost, four GARCH models, and the MLP model. Data were gathered from 1 January 2016 to 31 December 2020, with a total of 1392 sample data. The concentrations of air pollutants, such as PM2.5, PM10, NO2, SO2, O3, and CO, were gathered on an hourly basis, along with 26 weather parameters as well as human-caused factors in 10 cities in Shaanxi Province, China. Their results showed that the forecasting model had good performance, especially in long-term predictions. Moreover, they stated that better results can be derived if volatility is used as a PM2.5 forecasting benchmark.
We found several scientific papers that cover the topic of predictions about health consequences from air pollution for the general healthy population, older people, and children. In one such study [33] of 117 older adults from one of the most polluted cities in Northern China, Tianjin, they used outdoor and indoor PM2.5 measurements, since these particles are considered to have adverse effects on respiratory and cardiovascular health. After they gathered data for 18 crucial variables to predict the real exposure values of PM2.5, an artificial neural network (ANN) simulation with four different modeling techniques was performed. More precisely, the Monte Carlo simulation, time-integrated activity, ANN model, and combined use of principal component analysis (PCA) and ANN were used. The best result was achieved with the combined PCA and ANN model, which produced results of RMSE lower than 15 and R 2 of 0.99.
Another study [36] was conducted in Shanghai, China, where indoor and outdoor PM2.5 concentration was measured using 1146 Laser Egg home monitors, the state air quality monitoring network, some public applications, and traffic smart cards to determine air pollution in places like cars, subways, and buses. They used cell phones for signaling data and used a spatio-temporal weighted model to determine and improve the estimation of PM2.5 exposure in different parts of the city.
Reference [46] proposed a hybrid model to forecast multi-step-ahead PM2.5 concentrations in ambient air across India, considering different climatic zones. The model architecture utilizes an encoder–decoder-based sequence-to-sequence framework, incorporating convolutional long short-term memory (conv-LSTM), bidirectional LSTM, and 3D convolution neural network techniques. The model’s performance was evaluated across 26 Indian cities representing 13 major climatic zones. Additionally, the model’s ability to make consecutive hourly predictions was analyzed using the last 24 h of input data. The model’s output was compared with the signal-to-noise ratio to investigate variations in its performance. The findings revealed a clear correlation between the signal-to-noise ratio and model output, indicating that increased noise negatively impacts model performance. Overall, the proposed model exhibited stability, demonstrating minimal performance variations across different time horizons. It also holds the potential for long-term forecasting by incorporating additional predictor variable series.
The paper [31] introduces a hybrid deep learning-based architecture that combines convolutional neural networks (CNNs) and long short-term memory (LSTM) networks to model particulate matter (PM2.5) levels in a specific location. The architecture utilizes data collected from IoT air quality sensors and aims to improve the accuracy of PM2.5 concentration forecasting. The proposed model follows an encoder–decoder structure and focuses on modeling the spatio-temporal characteristics of air pollutant data from nine different locations. To capture both inter-dependency (spatial auto-correlation) and intra-dependency (heterogeneity) in the data, a combination of 3D CNN and 1D CNN is employed for encoding the features. The CNN-based encoder effectively captures relevant spatio-temporal patterns, enhancing the predictive accuracy. The proposed model is evaluated using the real-world IoT City Pulse Pollution dataset. Comparative analysis is conducted with convLSTM, another popular model used for spatio-temporal forecasting. The evaluation metrics employed include root mean square error (RMSE), mean absolute error (MAE), and R-squared ( R 2 ). The results indicate that the proposed hybrid CNN–LSTM architecture outperforms convLSTM in terms of accuracy, demonstrating its effectiveness in PM2.5 concentration forecasting.
The findings of study [43] have demonstrated the harmful effects of air pollution, specifically fine particulate matter (PM2.5), on human health. To overcome this limitation, the authors propose the development of prediction models that can estimate local PM2.5, NO2, and ozone concentrations in areas without monitoring stations. These models utilize satellite, meteorological, and land-use data as inputs. To facilitate the creation and training of these spatio-temporal prediction models, the authors have developed a flexible R package. This package enables environmental health researchers to design and train models capable of predicting multiple pollutants, with a focus on PM2.5. The use of H2O, an open-source big data R platform, ensures high performance and scalability when employed with cloud or cluster computing systems. By providing researchers with this package, the authors aim to enhance the accessibility and applicability of spatio-temporal prediction models for air pollutants. This enables a more comprehensive understanding of pollution levels and their health implications, particularly in areas without direct monitoring data.
The study [42] examines the use of near-road monitoring to estimate exposure to traffic-related air pollutants and its implications for studying adverse health effects. The Dorm Room Inhalation to Vehicle Emission (DRIVE) study conducted measurements near a heavily trafficked highway artery at various distances ranging from 0.01 to 2.3 km (two indoor and four outdoor). The spatio-temporal regression analysis was used, and the potential biases and errors associated with using roadside monitors as a primary exposure surrogate were assessed. The results of the DRIVE study revealed that pollutant levels from the highway source had a limited impact on the measured sites. Primary pollutants such as NO, CO, and Black Carbon (BC) decreased to near-background levels within 20–30 m from the highway. A better understanding of exposure measurement errors is crucial for the design and interpretation of observational studies linking traffic pollution and adverse health effects.
The study [28] investigates the impact of measurement error in spatio-temporal models used to predict exposure to outdoor air pollution and its effect on health estimation. The analysis focuses on long- and short-term pollutant exposure and mortality using a theoretical sample of 1000 geographical sites in greater London. Simulations are conducted to generate “true” site-specific daily means and 5-year mean concentrations of NO2 and PM10, incorporating temporal variation and spatial covariance based on actual measurements from urban background monitors in London from 2009 to 2013. The researchers examine scenarios where they specify the Pearson correlation and variance ratio between the modeled and true data, assuming these parameters are consistent spatially and temporally. The findings indicate that health effect estimates for both long- and short-term exposure tend to be biased towards the null hypothesis. The standard errors of health effect estimates are unaffected by changes in the correlation coefficient but appear to be attenuated for variance ratios greater than 1 and inflated for variance ratios less than 1.
The authors in [30] aim to evaluate different approaches for estimating individual exposure to ambient fine particulate matter (PM2.5) for use in epidemiological studies. The analysis utilizes personal, home indoor, and home outdoor air monitoring data, as well as spatio-temporal model predictions, from participants in the Multi-Ethnic Study of Atherosclerosis and Air Pollution (MESA Air). Comparisons were made between measurement-based personal PM2.5 exposure and various estimates of outdoor, indoor, and personal exposures. Outdoor model predictions outperformed estimates based on the nearest-monitor approach, showing higher correlation (R = 0.63 versus R = 0.43). Incorporating indoor infiltration of ambient-derived PM2.5 provided more accurate estimates of personal exposures compared to outdoor concentration predictions. This approach showed improved correlation (R = 0.81) and better scaling of estimated exposure (mean difference of 0.4 µg/m3 higher than measurements) compared to outdoor predictions (mean difference of 5.4 µg/m3 higher than measurements). This suggests that accounting for home infiltration is valuable in exposure estimation. Spatio-temporal models offer substantial improvements in exposure estimation compared to the nearest-monitor approach. The findings emphasize the importance of incorporating home infiltration data and provide insights into the estimation of individual exposure to PM2.5 for epidemiological studies.
In another case [32], the authors focused on community air quality monitoring using 30 PurpleAir II sensors deployed in partnership with community members near a major interstate freeway. The performance of outdoor sensors was assessed by analyzing temporal and spatial variability of PM2.5 between sensors using correlation coefficients and coefficients of divergence. The ability of the sensors to detect traffic pollution was also examined by comparing PM2.5 concentrations with traffic levels. For indoor sensors, indoor/outdoor (I/O) ratios were calculated during resident-reported activities and compared. A linear mixed-effects regression model was developed to understand the impacts of ambient air quality, micro-climatic factors, and indoor human activities on indoor PM2.5. Overall, the study found that indoor sensors performed more reliably than outdoor sensors, with an average data completeness of 73% for indoor sensors compared to 54% for outdoor sensors. All outdoor sensors exhibited high temporal correlation and spatial homogeneity. These findings support the use of low-cost sensors in community air quality monitoring initiatives, with the need for addressing data completeness for outdoor sensors.
In [37], the authors aimed to develop and compare four assessment methods for estimating individual exposure to outdoor air pollutants in pregnancy cohorts where personal exposure data were not available. The methods included citywide average, nearest monitor, inverse distance weighting, and ordinary Kriging. Hourly data from Mexico City’s outdoor air monitoring network for six pollutants were used to construct daily exposure metrics for 1000 simulated individual locations across five geographic zones. The results showed that the mean concentrations and standard deviations of the pollutants were similar among the different assessment methods. Correlations between the methods were generally high. However, the ranges of estimated concentrations were wider for the nearest monitor, inverse distance weighting, and ordinary Kriging methods compared to the citywide average method. The root mean square errors for ordinary Kriging were consistently equal to or lower than those for inverse distance weighting. Ordinary Kriging also predicted concentrations measured at the monitors better than the other methods. The study concluded that ordinary Kriging is preferred due to its ability to provide predicted standard errors, which can be incorporated into statistical models.
The authors in [39] introduced a novel methodological approach to improve dose estimations of multiple air pollutants in large-scale health studies. Traditionally, air pollution epidemiology has relied on fixed outdoor air quality monitoring networks and static populations. However, with advancements in sensor technologies and computational techniques, this study presents a more refined method. They conducted an intensive field campaign in urban and peri-urban areas of Beijing, where personal exposures to gaseous pollutants and particulate matter were measured using 60 personal air quality monitors (PAMs). Concurrently, outdoor air pollution measurements were collected from monitoring stations near the participants’ residential addresses. Using the data collected from the PAMs, the researchers developed an advanced computational model that automatically classified individuals’ time, activity, and location patterns at high spatial and temporal resolutions. By applying this methodological approach to two established cohorts, they found notable differences between doses estimated from outdoor air quality measurements and personal measurements using PAMs.
The impact of outdoor air pollution on the respiratory health of a population in Zaria, a city in northern Nigeria known for its high pollution levels, was conducted in [40]. The research utilizes various techniques, including portable pollutant monitors, respiratory health records, the WHO AirQ+ software, and the American Thoracic Society (ATS) questionnaire. The study collected data on daytime weighted outdoor pollution levels, respiratory illness cases, assumed baseline incidence, and exposure to respiratory symptoms among selected participants. The results show an average respiratory illness incidence rate of 607 per 100,000 cases. The findings suggest that approximately 2648 cases could have been prevented if the theoretical threshold limit for particulate matter with a diameter of less than 2.5/10 µm (PM2.5/PM10) recommended by the WHO had been followed. The findings highlight the need for measures to reduce pollution levels and adhere to recommended air quality standards to improve respiratory health in the region.
Paper [27] focuses on the use of different modeling approaches, including traditional linear regression and machine learning algorithms, for estimating long-term concentrations of ultrafine particles (UFP). Land-use regression (LUR) models are commonly used for this purpose but are criticized for their lack of flexibility and ability to handle highly correlated predictors. The researchers used two training datasets: mobile measurements (8200 segments, 25 s monitoring per segment) and short-term stationary measurements (368 sites, 3 × 30 min per site). They evaluated the precision and bias of various modeling approaches by comparing the estimates with an independent external dataset (42 sites, average of three 24 h measurements). The study found that higher R-squared values in the training data did not necessarily translate into higher R-squared values in the test data, emphasizing the importance of external validation. Machine learning algorithms trained on mobile measurements explained only 38–47% of the variability in external UFP concentrations, while multi-variable methods like step-wise regression and elastic net performed better, explaining 56–62% of the variability. Some machine learning algorithms, such as bagging and random forest, trained on short-term measurements performed slightly better than traditional regression techniques.
In [38], they focused on land-use regression modeling of outdoor nitrogen dioxide (NO2) and fine particulate matter (PM2.5) concentrations in three low-income areas in the Western Cape province of South Africa. Land-use regression is a method used to estimate air pollutant concentrations based on the characteristics of the surrounding land use. The researchers collected air pollution data from monitoring stations located in the study areas. They also gathered information on various land-use variables, such as road networks, industrial areas, and vegetation coverage. Using statistical techniques, they developed regression models that related the measured pollutant concentrations to the land-use variables. The results of the study showed that land-use regression models were able to successfully estimate outdoor NO2 and PM2.5 concentrations in the low-income areas. The models identified key land use factors that influenced pollutant levels, such as proximity to major roads and industrial areas. The work presented in [41] deals with prediction of air pollution in Tehran, the capital of Iran, with a particular emphasis on PM10 and PM2.5 pollutants. The research aims to develop prediction models using machine learning methods to determine air pollution levels based on various factors such as day of the week, month of the year, topography, meteorology, and pollutant rates of nearby areas. The machine learning methods employed in the study include regression support vector machine, geographically weighted regression, artificial neural network, and auto-regressive nonlinear neural network with an external input. The researchers proposed a prediction model that improved the accuracy of these methods, resulting in a significant reduction in prediction errors by 57%, 47%, 47%, and 94%, respectively. The most reliable algorithm was found to be the auto-regressive nonlinear neural network with an external input, achieving a one-day prediction error of 1.79 µg/m3. The research provides valuable insights into predicting air pollution levels in Tehran, offering an improved prediction model and identifying the key parameters that contribute to air pollution in the city. Reference [35] explores the application of artificial intelligence methods for forecasting the Air Quality Index (AQI) and evaluates their performance using data collected by the Environmental Protection Agency (EPA) and Central Weather Bureau (CWB) of Taiwan over 11 years. Three regions in Taiwan were considered. The results indicate that stacking ensemble and AdaBoost algorithms offer the best performance for target predictions based on three different datasets. The stacking ensemble method achieves the best root mean square error (RMSE) results, while AdaBoost provides the best mean absolute error (MAE) results. SVM yields the worst results among all methods explored, and its performance is only meaningful for 1 h predictions. The study concludes that AdaBoost and stacking ensemble outperform other popular methods like SVM, random forest, and artificial neural networks (ANNs) in AQI forecasting. They are considered new and superior alternatives for AQI prediction. The study also finds that the prediction performance varies across different regions in Taiwan. Fengshan, in southern Taiwan, shows the best results for AQI prediction, with less performance decay as the time step increases compared to the Zhongli (northern) and Changhua (central) regions. The study suggests future work should focus on improving performance using stacking ensemble, AdaBoost, and random forest algorithms with hyperparameter optimization, particularly for predictions with larger time steps (such as 8 h and 24 h AQI forecasts).
Ref. [29] focuses on investigating air pollution data from 23 Indian cities over a six-year period. The dataset underwent cleaning and preprocessing steps, including handling missing values, outliers, and normalization. Correlation-based feature selection is applied to identify the pollutants that significantly affect the AQI. Exploratory data analysis techniques are used to uncover hidden patterns in the dataset, revealing a significant reduction in pollution levels in 2020. To address the data imbalance issue, SMOTE analysis is employed. The dataset is split into train–test subsets, and machine learning (ML)-based AQI prediction is performed with and without SMOTE resampling. The results are compared using standard metrics, such as accuracy, precision, recall, and F1-score. The XGBoost model achieves the highest accuracy, while the SVM model exhibits the lowest accuracy. Further evaluation is conducted using classical statistical error metrics, including MAE, RMSE, RMSLE, and R 2 , to compare the performance of the ML models. The XGBoost model performs the best overall, achieving optimal values in both training and testing phases. The RF model shows relatively good performance in the training phase when used with SMOTE. In the testing phase, the GNB model performs the best in terms of R 2 for target predictions.

4.3. Interpretation of the Results

From the data extraction table and the in-depth analysis of selected papers, we discovered that most of the authors gathered most of the air pollutants and meteorological data (as shown in Figure 3); however, the most predicted air pollutant is definitely PM2.5, followed by CO, NO2, and SO2. PM10 is also very commonly predicted. Sometimes, the Air Quality Index (AQI) is predicted, which is an estimation of the most common pollutants.
To gather air quality data, low-cost, commercial, and professional sensors or a combination of them are used. Low-cost sensors are usually fixed and mounted from the public network. Commercial sensors are mounted on fixed places or on moving objects (e.g., buses) or worn by people. In other cases, data are taken from open-state data monitoring stations where the type of sensor is not specified. Meteorological data accompany air pollution sensor data in order to deliver more precise predictions from the models. Different types of sampling pumps, filters, and gas samplers gather the needed air pollutants. Teflon filters and Alphasense sensors were mentioned several times in the studies (as shown in Figure 4).
Cameras are used for image recognition models, in order to determine the dust in the air created from particulate matter. They are usually mounted on buildings such that the images can provide a broader view of the area. Image recognition models are usually combined with sensor data prediction models in order to obtain a more precise prediction of the air pollutants, specifically, PM2.5.
Moreover, the air pollution forecasting models show different approaches depending on the air pollutant(s) that need to be predicted, the location, and the combination of methods that seemed to be the best choice. The researchers tried to obtain better results by combining many different approaches. The prediction methods were mainly described in detail, whereas in some cases they were only generally discussed. For image recognition purposes, usually CNN or ResNet as an extension approach was used. From Figure 5, we can conclude that deep learning and various statistical and regression methods were mostly used independently or combined. Linear and log-linear regression, decision trees, and LSTM combinations were used in different studies; ANN, RNN, and CNN were used as part of neural networks; the PCA statistical approach was used as part of unsupervised ML; and in other studies, SVM with kNN as a supervised ML approach was used. Table 2 shows a summary of the selected publications based on the type of ML or statistical approach used.

5. Discussion

Regarding air pollution predictions, many research papers show promising results. Since the introduction of deep learning architectures, both image-based and sensor-based approaches have used ML with great success. More specifically, the state-of-the-art machine learning models for air pollution prediction may vary depending on the specific pollutant, region, and data availability. However, up to 2022, a few commonly used models have demonstrated high performance and are considered state-of-the-art in the field of air pollution prediction, such as:
  • Long short-term memory (LSTM) networks: LSTM networks are a type of recurrent neural network (RNN) that are well-suited for time series forecasting tasks. LSTM models have been successfully applied to predict air pollutant concentrations by capturing long-term dependencies and patterns in temporal data.
  • Convolutional neural networks (CNNs): Commonly used for image analysis, they have also shown promising results in air pollution prediction, particularly in spatial forecasting tasks. By treating air pollution data as spatio-temporal images, CNNs can capture spatial correlations and learn spatial features to make accurate predictions.
  • Random forests: Random forests are an ensemble learning method that combines multiple decision trees to make predictions. Random forest models have been utilized for air pollution prediction, leveraging their ability to handle complex interactions between variables and capture nonlinear relationships.
  • Gradient boosting machines (GBMs): GBMs are another ensemble learning method that sequentially trains weak learners to improve prediction accuracy. Models like XGBoost and LightGBM, which are variants of GBM, have been employed for air pollution prediction tasks, showing excellent performance in terms of accuracy and interpretability.
  • Gaussian process regression (GPR): GPR is a probabilistic model that can capture uncertainty in predictions. It has been used in air pollution prediction to estimate pollutant concentrations and provide probabilistic forecasts, which are valuable for decision-making and risk assessment.
It is important to note that the field of air pollution prediction is continuously evolving, and new models and techniques are emerging.

Research Questions

The research questions that we wanted to answer by performing this review are as follows:
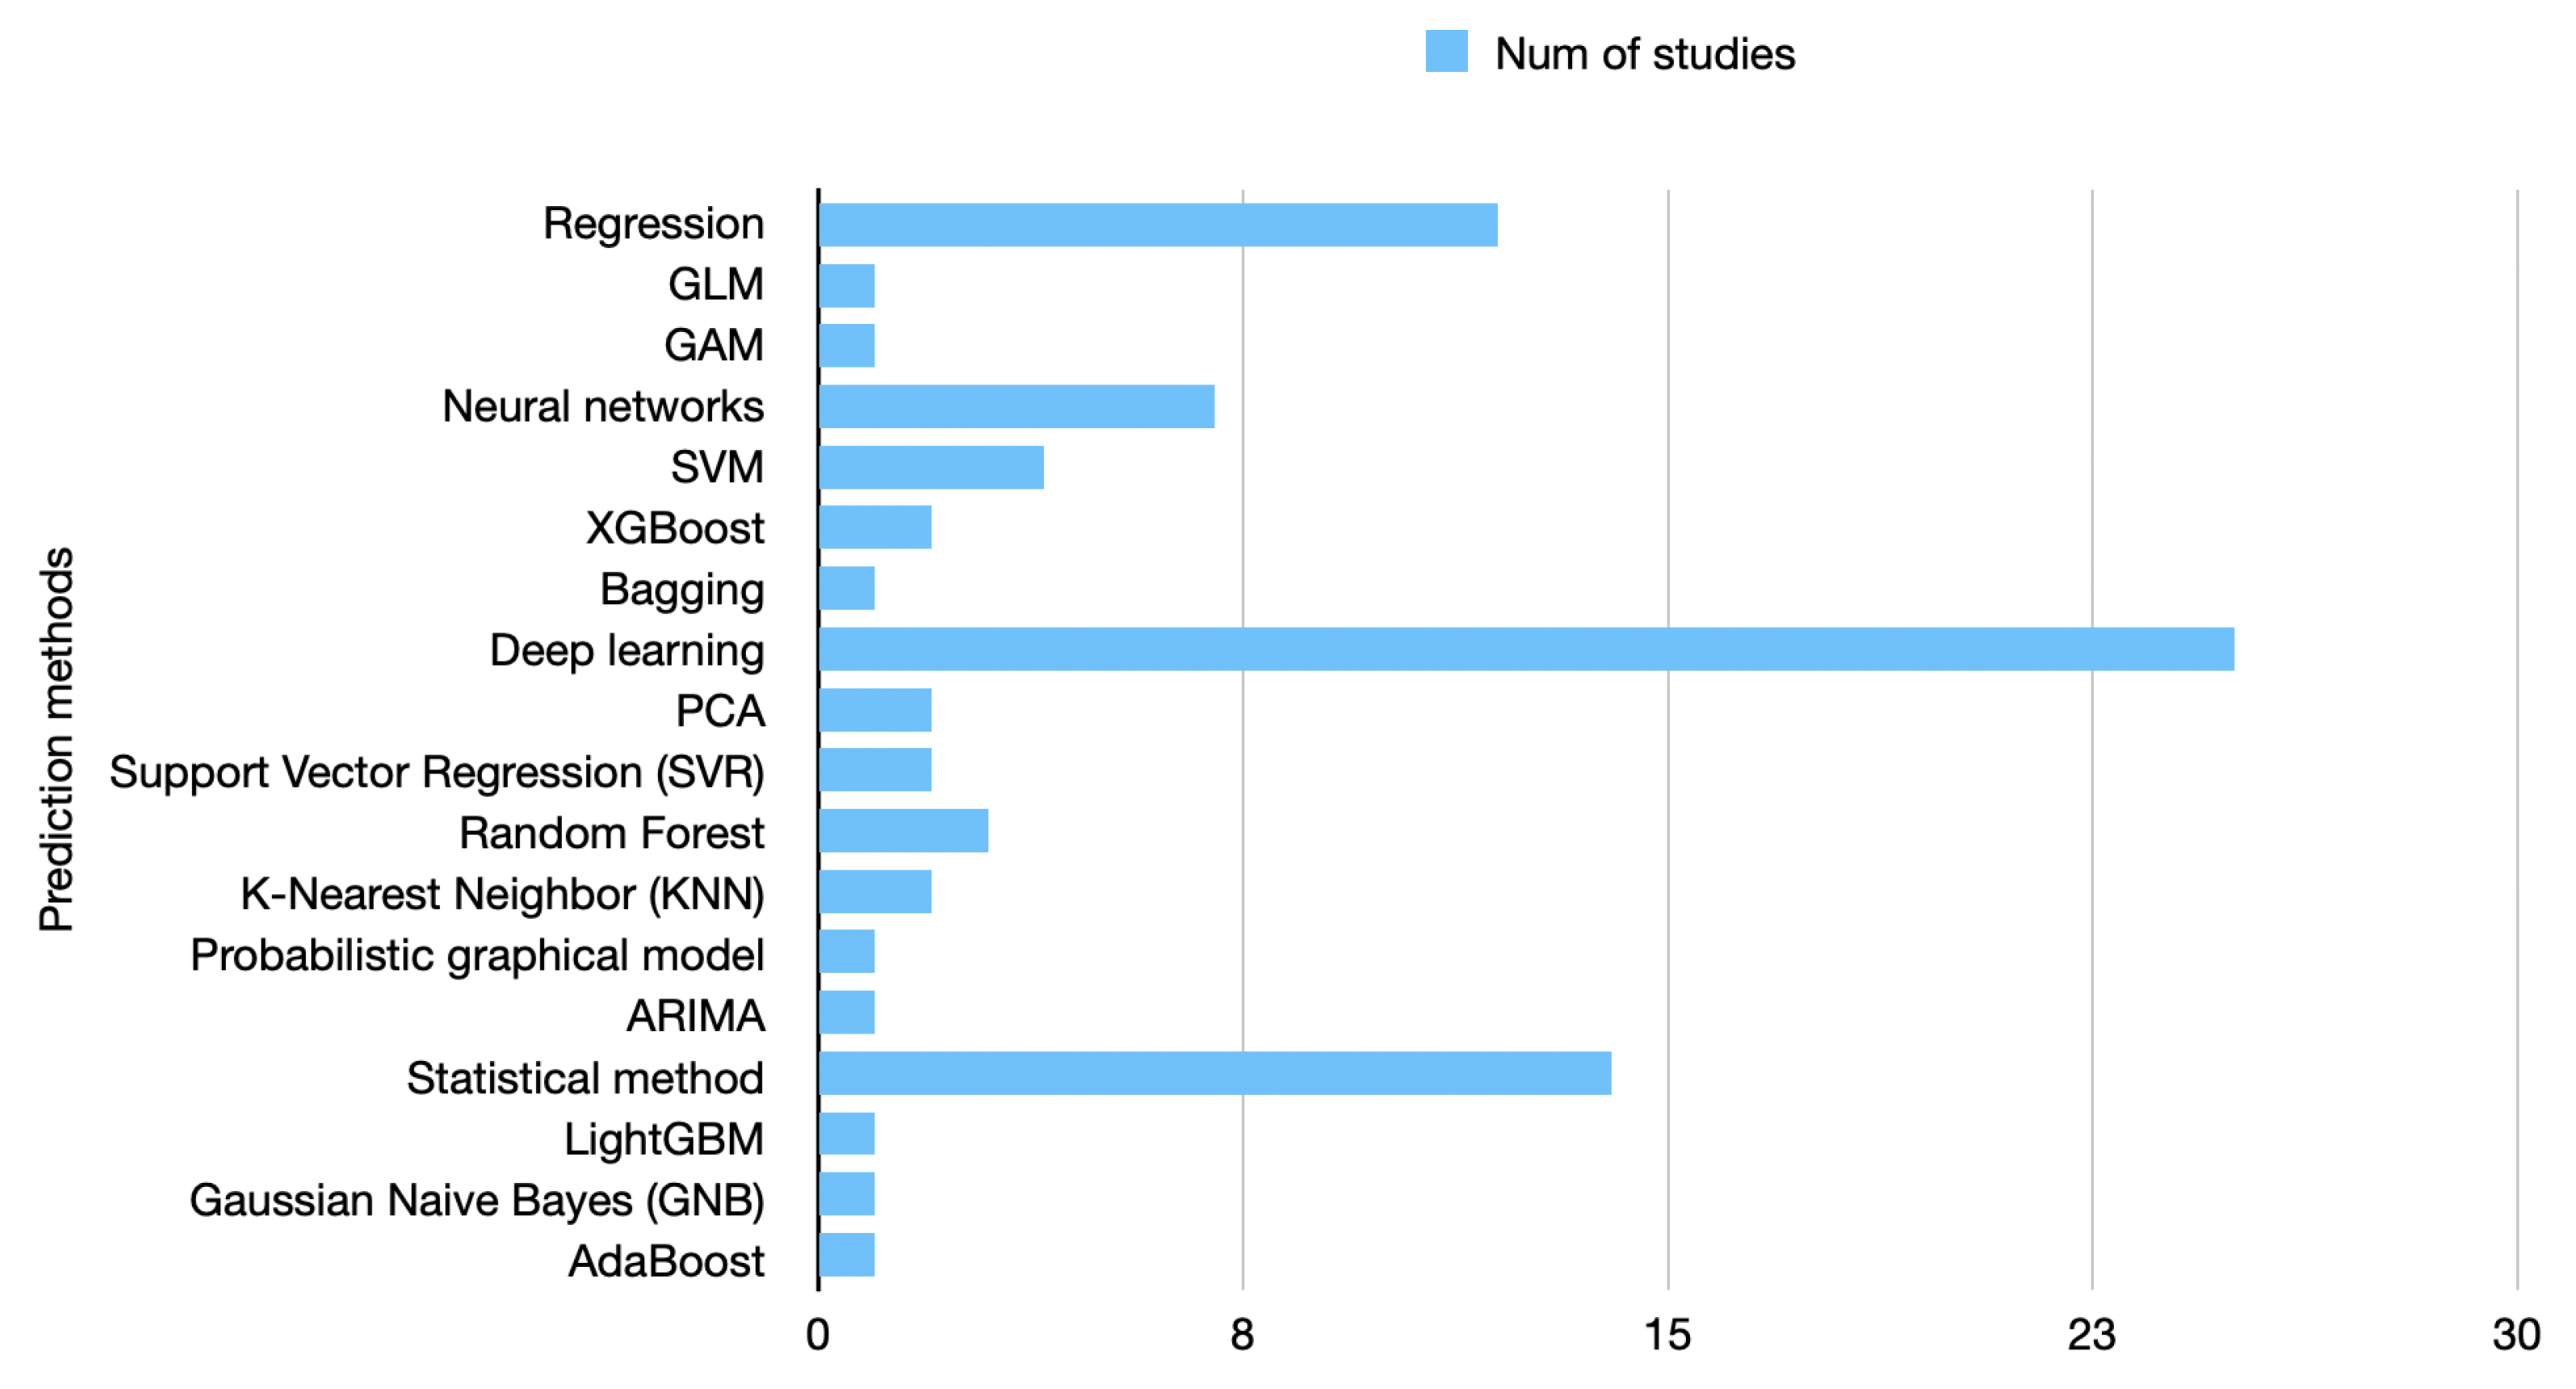
  • What are prevalent methods for air pollution forecasting (i.e., prediction) published in the last eight years? The field of air pollution forecasting continues to evolve, and researchers are exploring new techniques and approaches to improve air pollution predictions’ accuracy, reliability, and usability. Some prevalent air pollution forecasting methods published in the last eight years are machine learning (ML) approaches, since they have gained significant attention for air pollution forecasting. These include models such as random forests, support vector machines (SVM), artificial neural networks (ANNs), and gradient boosting machines (GBM). Next are the deep learning models, especially convolutional neural networks (CNNs) and recurrent neural networks (RNNs). CNN models have been used to analyze satellite imagery and spatial data for estimating pollutant levels. In contrast, RNN models, including long short-term memory (LSTM), have been employed for time series forecasting of pollutant concentrations. The third category would be hybrid models, where researchers combine multiple modeling techniques to leverage their respective strengths. Hybrid models often combine the advantages of both physics-based understanding and data-driven learning. Ensemble models integrate predictions from multiple individual models to generate a final forecast. Spatio-temporal models aim to capture air pollution dynamics over space and time. They often incorporate spatial interpolation techniques, spatial regression models, or spatio-temporal machine learning approaches to capture pollutants’ spatial variations and temporal patterns. Data assimilation methods combine observations from monitoring stations, satellite data, and numerical models to optimize predictions. Hybrid data fusion techniques integrate multiple data sources, such as ground-based measurements, satellite data, and numerical model outputs, to generate comprehensive air pollution forecasts. Probabilistic forecasting methods estimate the uncertainty associated with air pollution predictions, providing probabilistic distributions instead of point estimates. These methods employ techniques such as Bayesian modeling, Gaussian processes (GP), or ensemble modeling to quantify the uncertainty in the predictions.
  • What are the strengths and limitations of the ML approaches for air pollution forecasting? Machine learning (ML) approaches have shown promise in air pollution forecasting, but they also have their strengths and limitations. Their strengths would be that they are data-driven, flexible, scalable, have real-time updates, and are easily adaptable. However, they also face some limitations, such as whether the data are available and of good quality and whether the technique is understandable or very complex and hard to grasp. It is essential that the models can draw generalizations well enough to quantify uncertain situations because, in air pollution forecasting, uncertainty estimation is crucial for decision-making. Last but not least, they are limited in their ability to capture complex relationships as well as unexpected events.
  • What are the most prevalent input data modalities for air pollution forecasting? The choice of input data depends on the specific modeling approach and available data sources, so the most prevalent input data modalities used in air pollution forecasting would be meteorological data, emission data, air quality monitoring data, satellite imagery, geographic information system (GIS) data, historical air pollution data, socioeconomic data, and output data from different models. It is important to note that data availability and quality can vary across locations, and different modeling approaches may require different input datasets.
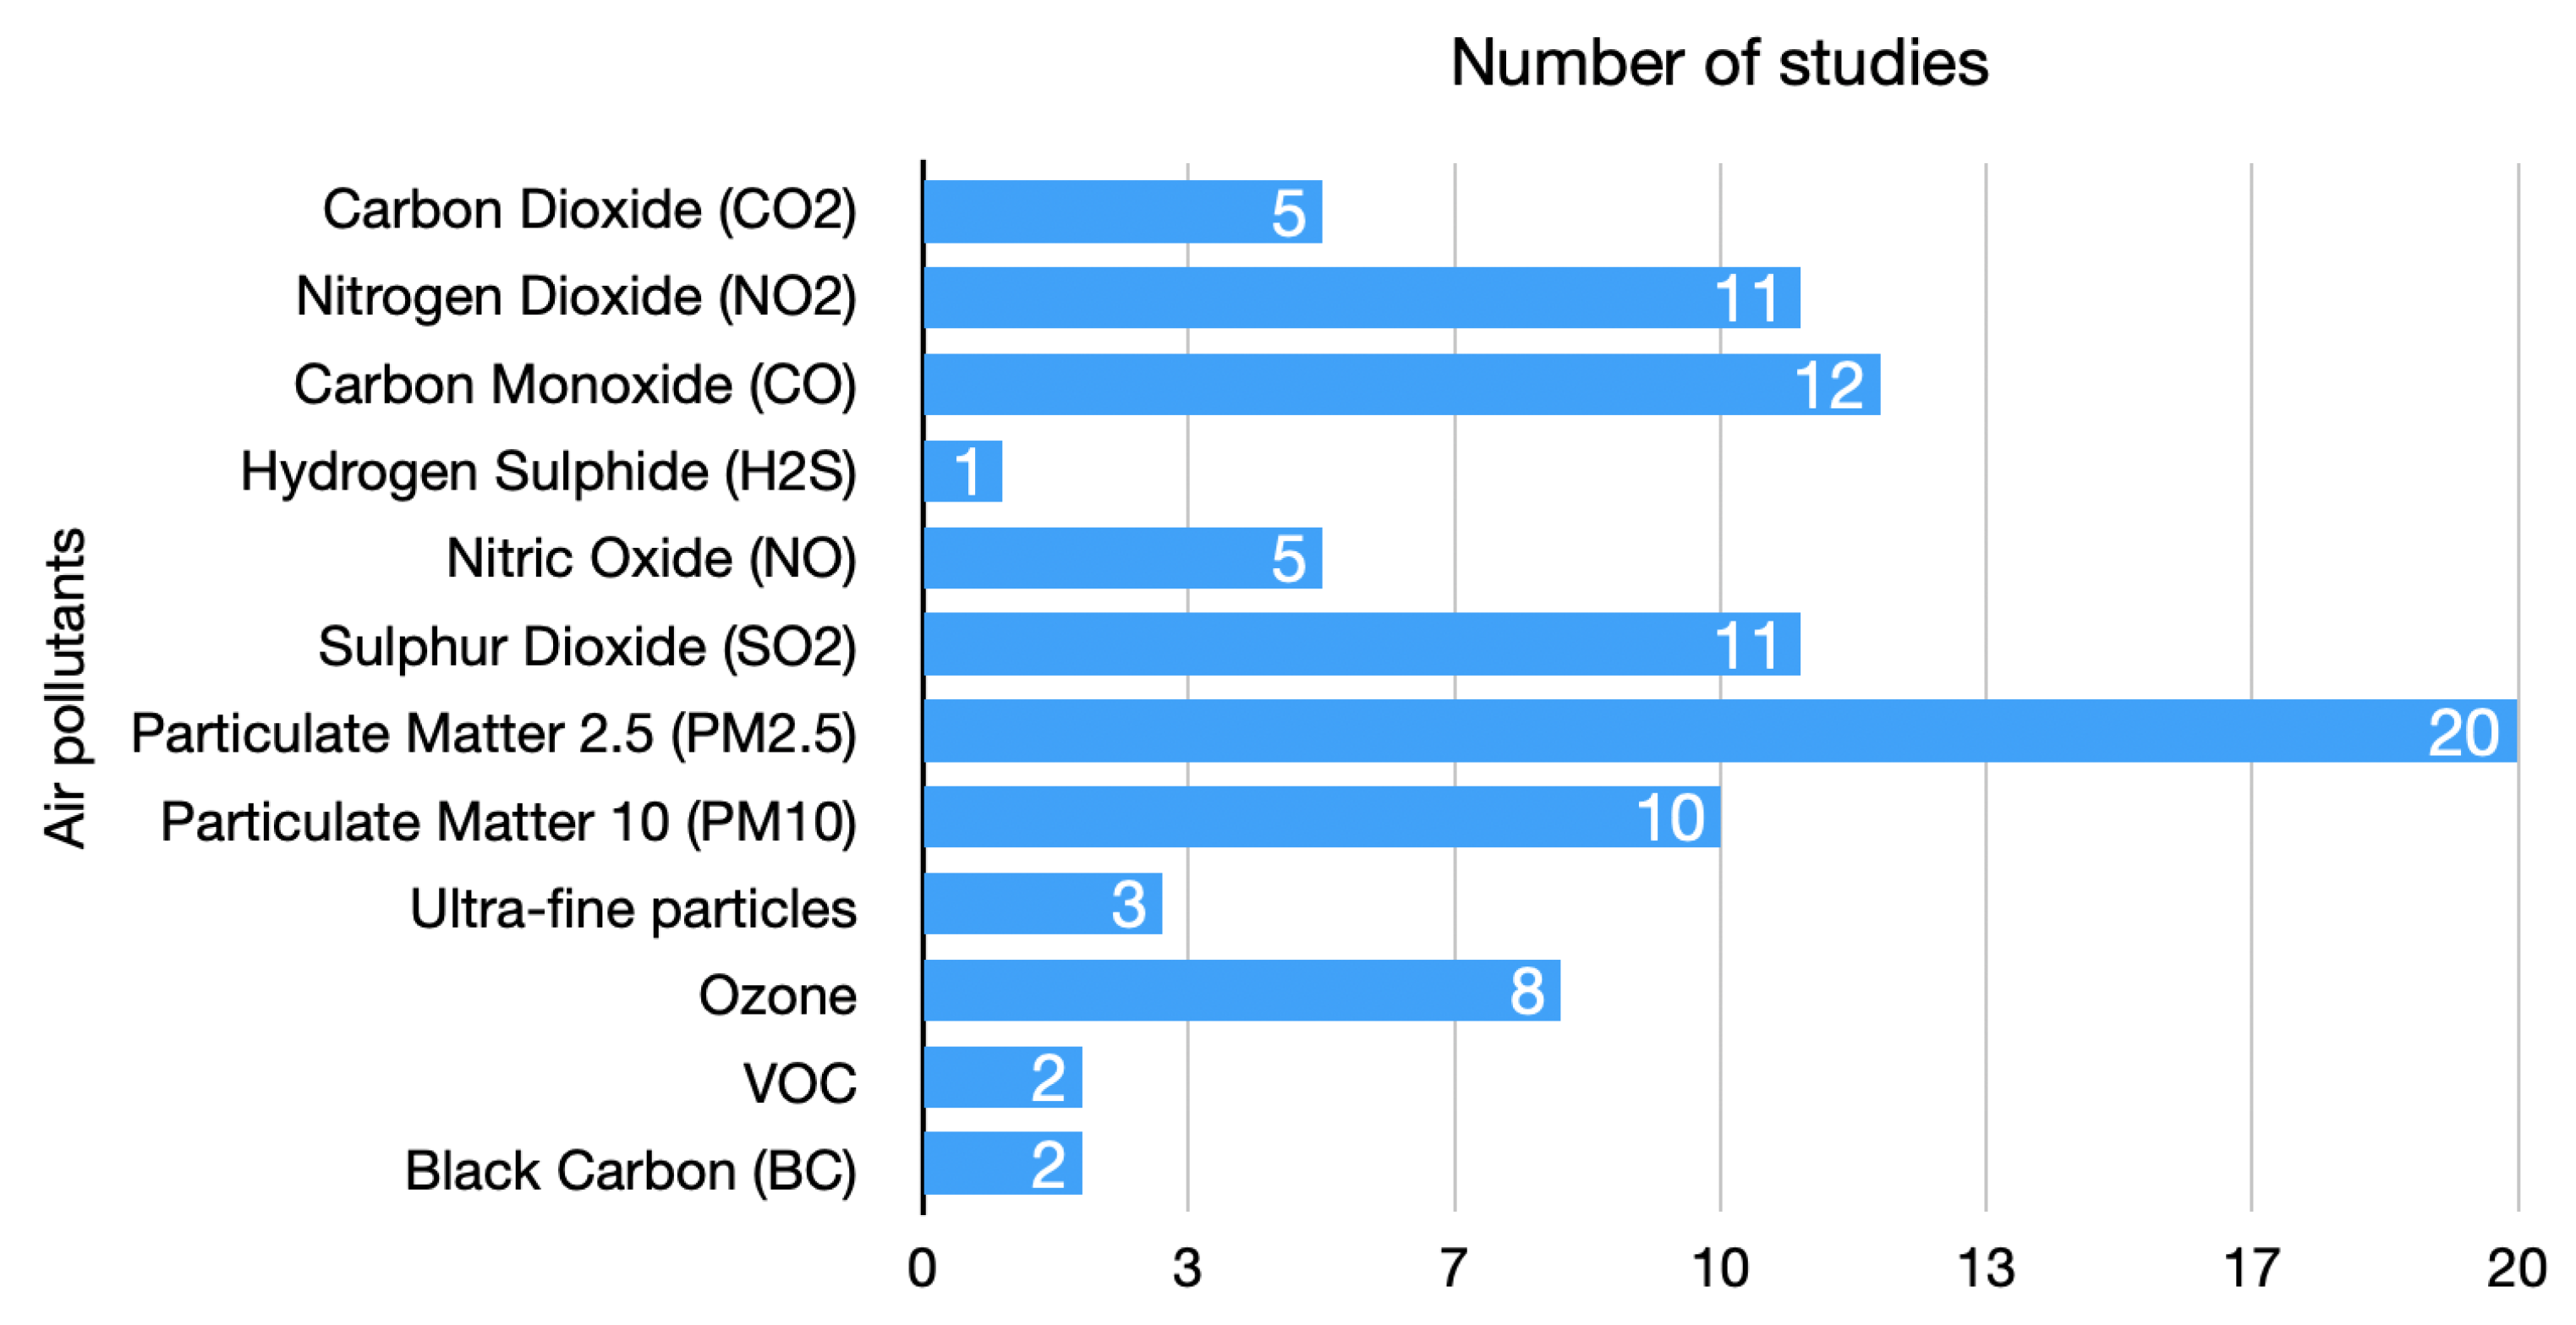
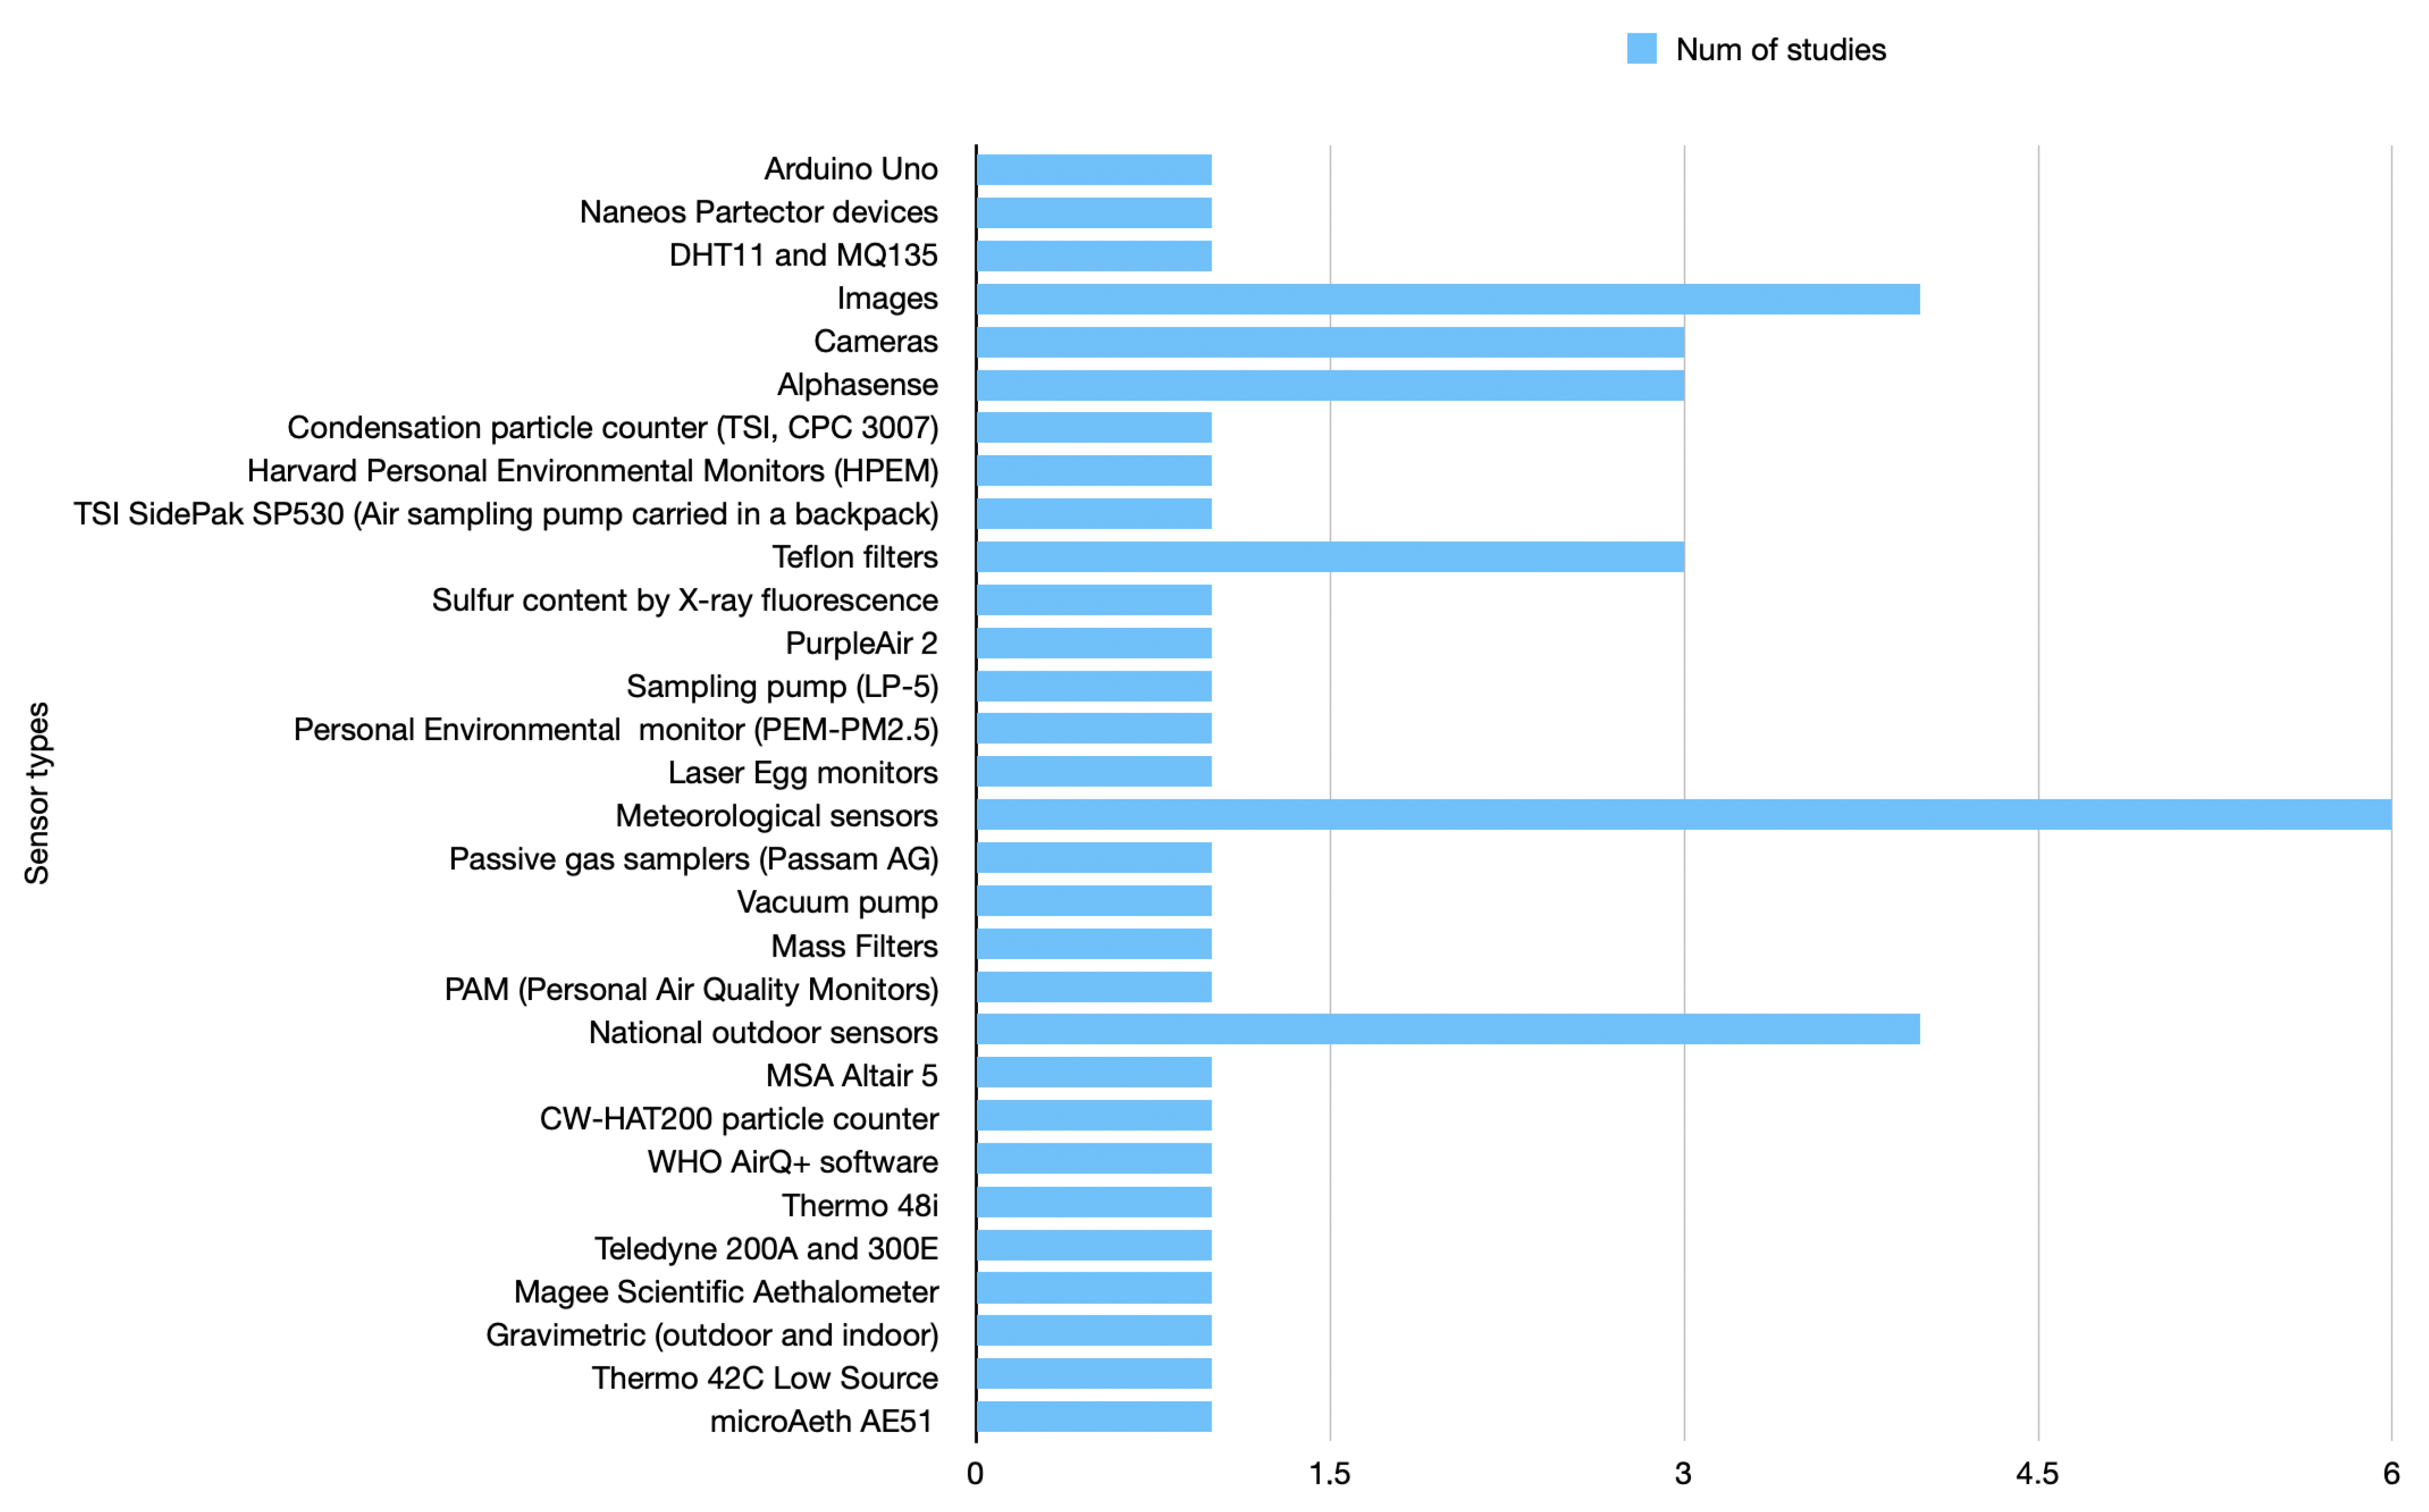
  • Which are the most dominant sensor types for urban air pollution forecasting? Urban air pollution forecasting relies on various sensor types to monitor and measure pollutant concentrations in real time. The choice of sensors depends on more factors, such as the pollutant of interest, accuracy requirements, cost considerations, and the specific objectives of the forecasting system. Many studies are moving towards combining various inputs to achieve better results, especially in PM forecasting models. However, the most frequently used sensor types would still be particulate matter (PM) sensors, then gas sensors, weather stations, multi-gas monitors (for measuring multiple pollutants simultaneously), LiDAR (light detection and ranging), remote sensing instruments, and low-cost sensors, which in recent years have gained popularity for urban air pollution monitoring. Low-cost sensors are affordable and portable, allowing for dense monitoring networks in urban areas. While they may have lower accuracy compared to reference-grade instruments, their widespread deployment can provide valuable spatial coverage and enable localized air pollution measurements.
  • What are the current research and technological gaps in air pollution research related to the city of Skopje, North Macedonia? The research and development landscape is similar to the other countries around the world with similar air pollution rates. Because it is ranked as one of the most polluted cities in the world, citizens are very interested in measuring, predicting, and preventing air pollution. After examining the available publications, we concluded that there is ongoing development in both research and application tackling air pollution monitoring and prediction. Several completed studies and projects have been improved to increase awareness and measure pollution more precisely. The air pollution measurement and prediction methods are similar to the state-of-art methods. Further examination is needed to analyze the potential usage of low-cost sensors for pollution forecasting. An ongoing project, CleanBREATHE (http://www.cleanbreathe.eu, accessed on 1 August 2023), aims to increase awareness regarding air pollution and improve pollution measurement and prediction capabilities by researching and developing new algorithms and proposing an adequate, sustainable business model for air pollution-related applications.

6. Case Study: Insights from Air Pollution Research in the City of Skopje

Since the city of Skopje is ranked among the most polluted cities in the world in terms of PM pollution, especially in the winter months [48], several applications measure and predict air pollution to raise public awareness towards this problem. AirCare [49] is a mobile application that takes publicly available data and crowdsourced data networks, allowing people to monitor and predict pollution from their mobile phones. Pulse.eco [50] is a crowdsourced platform together with a web page that gives instructions to people on how to build their own cheap air quality monitors and deploy them in the crowdsourcing infrastructure that they provide. They also visualize the pollution as measured by the sensor network. PM Alarm [51] is an application that combines publicly available data with atmospheric models to predict PM pollution. The methods they use are described in [52,53]. In addition to these applications, there is ongoing research into improving the predictive models for more accurate pollution prediction, focusing on PM pollution.
The authors of [54] and [4] suggest the application of recurrent neural network (RNN) models with long short-term memory (LSTM) units to predict future PM10 levels at different time intervals using historical air quality data from various locations in Skopje and meteorological conditions. Their experimental results indicate that this method consistently outperforms traditional auto-regressive integrated moving average (ARIMA) models.
On the other hand, a different study [55] explores air pollution in Skopje using multi-modal data and proposes four architectures that employ camera images to estimate air pollution. The accuracy of these models is improved by incorporating weather data and using generative adversarial networks (GANs) and data augmentation techniques to address class imbalance issues. The proposed method achieves an impressive accuracy of up to 0.88, comparable to conventional and sequence models that use air pollution data, despite the inherent difficulty of recognizing air pollution from camera images, which is not directly related to historic air pollution data. Authors in [56] explore attention-based models for PM2.5 prediction. These models proved to outperform two state-of-the-art models, which is a great achievement. The difference from the previous version is that the prediction is based on different attention factors for the previous timestamps. As the model is trained to the attention factors, it learns the optimal amount of previous timestamps that affect the present prediction, making it possible to learn the patterns and dependencies in order to improve the future prediction models. All the evaluated and compared models using the MSE approach are the stacked LSTM, bidirectional stacked LSTM attention model, stacked attention model, bidirectional attention model, and bidirectional stacked attention model. The last four models are the novel ones. From all of them, the last model bidirectional stacked attention model had the best evaluation results, outperforming all the rest. The models can be further optimized by lowering the MSE, using a better quality dataset from the sensors, and adding more pollutants for prediction.
This study [57] proposes and evaluates a complete air monitoring system using four encoder–decoder architectures with attention for forecasting particulate matter levels (PM2.5) and discusses the relevance of the results obtained in a case study for the city of Skopje. The research also addresses the challenges of missing data and proposes two adversarial networks for data augmentation, which were found to improve performance. They propose deep neural architectures with general applicability for other pollutants and time series data in other domains.
Authors in [58] analyze the performance of deep learning algorithms on short-term prediction. Authors in [59,60] propose an IoT architecture for data acquisition and air pollution prediction. All of the works conclude that the pollution in the city of Skopje, due to the seasonality and the specific weather influence, can be predicted with high accuracy.

Future Research

Our study looked into different sensors, the data they produce, and how ML or statistical methods are used for predictions. One area we think could be expanded on in future studies is understanding the accuracy and reliability of these sensors. As AI and ML continue to grow, it is a good time to think about how better sensors and improved communication methods can boost this progress.
Accurate air pollution measures can be expensive and often need government backing. However, there are now affordable sensors that people can use in their own homes. If we connect the data from these sensors and make them public, this could help raise awareness about pollution levels. There have been concerns about the reliability of data from these sensors [61], but with further research and collaboration, we can work towards addressing these issues.
Additionally, there is room for improvement in how we present and share data. Our study, along with others, could benefit from more focus on making air quality data clear and easy for everyone to understand. This way, the public can be better informed and more involved in addressing air quality issues.

7. Conclusions

Various methods can be used to measure and predict pollution in urban areas, including air quality monitoring stations, satellite data, and computer modeling. The accuracy of these methods can vary depending on the specific pollutant being measured and the particular conditions in the urban area. It is generally possible to measure and predict pollution in urban areas with some degree of accuracy. Still, there may be limitations and uncertainties due to factors such as the urban environment’s complexity and pollution dynamics.
Air quality monitoring stations can provide real-time or near-real-time measurements of air pollutants. The accuracy of these measurements can be affected by factors such as the location and maintenance of the monitoring station, the sampling method used, and the accuracy of the measuring equipment. Satellite data can provide a broad overview of pollution levels across a region. However, the resolution of the data may not be sufficient to capture fine-scale variations in pollution levels. Computer modeling can simulate the transport and dispersion of pollutants in the atmosphere. Still, the accuracy of the model results depends on the quality of the input data and the assumptions used in the model.
Overall, the accuracy of measuring and predicting pollution in urban areas is likely to depend on a combination of factors, including the type of pollution being measured, the measurement and prediction methods used, and the specific conditions in the urban area.
Machine learning, based on the reviewed articles, can be successfully used for air pollution prediction in urban areas. For example, machine learning algorithms can be trained on data from air quality monitoring stations and other sources to identify patterns and relationships that can be used to make more accurate pollution forecasts. ML models can also be used to analyze satellite data and other remote sensing data to identify pollution sources and predict how pollution levels may change over time.
There are several potential benefits to using AI for air pollution prediction in urban areas. ML models can process large amounts of data quickly and adapt to changing conditions, enabling more timely and accurate pollution forecasts. ML models can also be used to analyze data from various sources, which can help improve the quality and reliability of the estimates. In addition, ML models can be trained on historical data to improve the accuracy of pollution forecasts, particularly in areas where there is a lack of high-quality monitoring data.
However, it is important to note that models are only as accurate as the data they are trained on, and the quality and relevance of the input data can significantly impact the accuracy of the forecasts. In addition, ML models may be limited by the assumptions and algorithms used to create them, and they may not always capture the complexity and variability of real-world pollution patterns. As a result, it is important to carefully evaluate the accuracy and limitations of ML-based air pollution prediction models and to consider using a combination of different methods to improve the reliability of the forecasts.

Author Contributions

Conceptualization, P.L. and V.T.; methodology, E.Z. and V.T.; validation, M.A.H. and V.T.; formal analysis, E.M.J., V.B. and P.L; investigation, E.M.J., V.B. and E.Z.; writing—original draft preparation, all authors. All authors have read and agreed to the published version of the manuscript.

Funding

The work presented in this paper is partially funded by the Faculty of Computer Science and Engineering, SS. Cyril and Methodius University in Skopje. This study is performed as part of the project Blended REsearch on Air pollution using TecHnical and Educational solutions (CleanBREATHE), funded by DLR Projektträger, Funding number 01DS21018.

Data Availability Statement

Not applicable.

Conflicts of Interest

The authors declare no conflict of interest.

References

  1. WHO. New WHO Global Air Quality Guidelines Aim to Save Millions of Lives from Air Pollution. 2022. Available online: https://www.who.int/news/item/22-09-2021-new-who-global-air-quality-guidelines-aim-to-save-millions-of-lives-from-air-pollution (accessed on 30 September 2022).
  2. WHO. Health Consequences of Air Pollution on Populations. 2019. Available online: https://www.who.int/news/item/15-11-2019-what-are-health-consequences-of-air-pollution-on-populations (accessed on 30 September 2022).
  3. The Murky Issue of Air Pollution in North Macedonia. Available online: https://www.euronews.com/2021/06/01/the-murky-issue-of-air-pollution-in-north-macedonia (accessed on 30 September 2022).
  4. Arsov, M.; Zdravevski, E.; Lameski, P.; Corizzo, R.; Koteli, N.; Gramatikov, S.; Mitreski, K.; Trajkovik, V. Multi-Horizon Air Pollution Forecasting with Deep Neural Networks. Sensors 2021, 21, 1235. [Google Scholar] [CrossRef]
  5. Liu, W.; Xu, Z.; Yang, T. Health effects of air pollution in China. Int. J. Environ. Res. Public Health 2018, 15, 1471. [Google Scholar] [CrossRef]
  6. Zaini, N.; Ean, L.W.; Ahmed, A.N.; Malek, M.A. A systematic literature review of deep learning neural network for time series air quality forecasting. Environ. Sci. Pollut. Res. 2022, 29, 4958–4990. [Google Scholar] [CrossRef]
  7. ABCnews. North Macedonia Takes Emergency Anti-Pollution Steps. 2022. Available online: https://abcnews.go.com/International/wireStory/north-macedonia-takes-emergency-anti-pollution-steps-95809578 (accessed on 10 January 2022).
  8. IQAir. Air Quality Analysis and Statistics for Skopje. 2023. Available online: https://www.iqair.com/north-macedonia/skopje (accessed on 10 January 2022).
  9. Carballo, I.H.; Bakola, M.; Stuckler, D. The impact of air pollution on COVID-19 incidence, severity, and mortality: A systematic review of studies in Europe and North America. Environ. Res. 2022, 215, 114155. [Google Scholar] [CrossRef]
  10. Wong, Y.J.; Yeganeh, A.; Chia, M.Y.; Shiu, H.Y.; Ooi, M.C.G.; Chang, J.H.W.; Shimizu, Y.; Ryosuke, H.; Try, S.; Elbeltagi, A. Quantification of COVID-19 impacts on NO2 and O3: Systematic model selection and hyperparameter optimization on AI-based meteorological-normalization methods. Atmos. Environ. 2023, 301, 119677. [Google Scholar] [CrossRef]
  11. Kang, G.K.; Gao, J.Z.; Chiao, S.; Lu, S.; Xie, G. Air quality prediction: Big data and machine learning approaches. Int. J. Environ. Sci. Dev. 2018, 9, 8–16. [Google Scholar] [CrossRef]
  12. Méndez, M.; Merayo, M.; Núñez, M. Machine learning algorithms to forecast air quality: A survey. Artif. Intell. Rev. 2023, 56, 10031–10066. [Google Scholar] [CrossRef]
  13. Airpointer®. Available online: https://ambilabs.com/instruments/airpointer/ (accessed on 10 December 2022).
  14. Ren, Y.; Yao, X.; Liu, Y.; Liu, S.; Li, X.; Huang, Q.; Liu, F.; Li, N.; Lu, Y.; Yuan, Z.; et al. Outdoor air pollution pregnancy exposures are associated with behavioral problems in China’s preschoolers. Environ. Sci. Pollut. Res. 2019, 26, 2397–2408. [Google Scholar] [CrossRef]
  15. Deng, Q.; Lu, C.; Yu, Y.; Li, Y.; Sundell, J.; Norbäck, D. Early life exposure to traffic-related air pollution and allergic rhinitis in preschool children. Respir. Med. 2016, 121, 67–73. [Google Scholar] [CrossRef]
  16. Zdravevski, E.; Lameski, P.; Trajkovik, V.; Chorbev, I.; Goleva, R.; Pombo, N.; Garcia, N.M. Automation in Systematic, Scoping and Rapid Reviews by an NLP Toolkit: A Case Study in Enhanced Living Environments. In Enhanced Living Environments: Algorithms, Architectures, Platforms, and Systems; Springer International Publishing: Cham, Switzerland, 2019; pp. 1–18. [Google Scholar] [CrossRef]
  17. Page, M.J.; McKenzie, J.E.; Bossuyt, P.M.; Boutron, I.; Hoffmann, T.C.; Mulrow, C.D.; Shamseer, L.; Tetzlaff, J.M.; Akl, E.A.; Brennan, S.E.; et al. The PRISMA 2020 statement: An updated guideline for reporting systematic reviews. Int. J. Surg. 2021, 88, 105906. [Google Scholar] [CrossRef]
  18. Marjovi, A.; Arfire, A.; Martinoli, A. High Resolution Air Pollution Maps in Urban Environments Using Mobile Sensor Networks. In Proceedings of the 2015 International Conference on Distributed Computing in Sensor Systems, Fortaleza, Brazil, 10–12 June 2015; pp. 11–20. [Google Scholar] [CrossRef]
  19. Ayele, T.W.; Mehta, R. Air pollution monitoring and prediction using IoT. In Proceedings of the 2018 Second International Conference on Inventive Communication and Computational Technologies (ICICCT), Coimbatore, India, 20–21 April 2018; pp. 1741–1745. [Google Scholar] [CrossRef]
  20. Sardar Maran, P.; Reddy, B.S.; Saiharshavardhan, C. Air Quality Prediction (IoT) Using Machine Learning. In Advances in Electronics, Communication and Computing; Springer: Berlin/Heidelberg, Germany, 2021; pp. 583–591. [Google Scholar]
  21. Dua, R.D.; Madaan, D.M.; Mukherjee, P.M.; Lall, B.L. Real Time Attention Based Bidirectional Long Short-Term Memory Networks for Air Pollution Forecasting. In Proceedings of the 2019 IEEE Fifth International Conference on Big Data Computing Service and Applications (BigDataService), Newark, CA, USA, 4–9 April 2019; pp. 151–158. [Google Scholar] [CrossRef]
  22. Pasupuleti, V.R.; Uhasri; Kalyan, P.; Srikanth; Reddy, H.K. Air Quality Prediction of Data Log by Machine Learning. In Proceedings of the 2020 6th International Conference on Advanced Computing and Communication Systems (ICACCS), Coimbatore, India, 6–7 March 2020; pp. 1395–1399. [Google Scholar] [CrossRef]
  23. Luna, A.; Talavera, A.; Navarro, H.; Cano, L. Monitoring of Air Quality with Low-Cost Electrochemical Sensors and the Use of Artificial Neural Networks for the Atmospheric Pollutants Concentration Levels Prediction. In Proceedings of the 5th International Conference, Information Management and Big Data, Lima, Peru, 3–5 September 2018; Lossio-Ventura, J.A., Muñante, D., Alatrista-Salas, H., Eds.; Springer International Publishing: Cham, Switzerland, 2019; pp. 137–150. [Google Scholar]
  24. Rijal, N.; Gutta, R.T.; Cao, T.; Lin, J.; Bo, Q.; Zhang, J. Ensemble of deep neural networks for estimating particulate matter from images. In Proceedings of the 2018 IEEE 3rd international conference on image, Vision and Computing (ICIVC), Chongqing, China, 27–29 June 2018; pp. 733–738. [Google Scholar]
  25. Bo, Q.; Yang, W.; Rijal, N.; Xie, Y.; Feng, J.; Zhang, J. Particle pollution estimation from images using convolutional neural network and weather features. In Proceedings of the 2018 25th IEEE International Conference on Image Processing (ICIP), Athens, Greece, 7–10 October 2018; pp. 3433–3437. [Google Scholar]
  26. Song, S.; Lam, J.C.; Han, Y.; Li, V.O. ResNet-LSTM for Real-Time PM 2.5 and PM10 Estimation Using Sequential Smartphone Images. IEEE Access 2020, 8, 220069–220082. [Google Scholar] [CrossRef]
  27. Kerckhoffs, J.; Hoek, G.; Portengen, L.; Brunekreef, B.; Vermeulen, R.C. Performance of prediction algorithms for modeling outdoor air pollution spatial surfaces. Environ. Sci. Technol. 2019, 53, 1413–1421. [Google Scholar] [CrossRef] [PubMed]
  28. Butland, B.K.; Samoli, E.; Atkinson, R.W.; Barratt, B.; Katsouyanni, K. Measurement error in a multi-level analysis of air pollution and health: A simulation study. Environ. Health 2019, 18, 1–10. [Google Scholar] [CrossRef] [PubMed]
  29. Kumar, K.; Pande, B.P. Air pollution prediction with machine learning: A case study of Indian cities. Int. J. Environ. Sci. Technol. 2023, 20, 5333–5348. [Google Scholar] [CrossRef] [PubMed]
  30. Miller, K.A.; Spalt, E.W.; Gassett, A.J.; Curl, C.L.; Larson, T.V.; Avol, E.; Allen, R.W.; Vedal, S.; Szpiro, A.A.; Kaufman, J.D. Estimating ambient-origin PM2. 5 exposure for epidemiology: Observations, prediction, and validation using personal sampling in the Multi-Ethnic Study of Atherosclerosis. J. Expo. Sci. Environ. Epidemiol. 2019, 29, 227–237. [Google Scholar] [CrossRef] [PubMed]
  31. Abirami, S.; Chitra, P.; Madhumitha, R.; Kesavan, S.R. Hybrid spatio-temporal deep learning framework for particulate matter (pm 2.5) concentration forecasting. In Proceedings of the 2020 International Conference on Innovative Trends in Information Technology (ICITIIT), Kottayam, India, 13–14 February 2020; pp. 1–6. [Google Scholar]
  32. Connolly, R.E.; Yu, Q.; Wang, Z.; Chen, Y.H.; Liu, J.Z.; Collier-Oxandale, A.; Papapostolou, V.; Polidori, A.; Zhu, Y. Long-term evaluation of a low-cost air sensor network for monitoring indoor and outdoor air quality at the community scale. Sci. Total Environ. 2022, 807, 150797. [Google Scholar] [CrossRef]
  33. Gao, S.; Zhao, H.; Bai, Z.; Han, B.; Xu, J.; Zhao, R.; Zhang, N.; Chen, L.; Lei, X.; Shi, W.; et al. Combined use of principal component analysis and artificial neural network approach to improve estimates of PM2. 5 personal exposure: A case study on older adults. Sci. Total Environ. 2020, 726, 138533. [Google Scholar] [CrossRef]
  34. Zhang, Q.; Fu, F.; Tian, R. A deep learning and image-based model for air quality estimation. Sci. Total Environ. 2020, 724, 138178. [Google Scholar] [CrossRef]
  35. Liang, Y.C.; Maimury, Y.; Chen, A.H.L.; Juarez, J.R.C. Machine Learning-Based Prediction of Air Quality. Appl. Sci. 2020, 10, 9151. [Google Scholar] [CrossRef]
  36. Ben, Y.; Ma, F.; Wang, H.; Hassan, M.A.; Yevheniia, R.; Fan, W.; Li, Y.; Dong, Z. A spatio-temporally weighted hybrid model to improve estimates of personal PM2. 5 exposure: Incorporating big data from multiple data sources. Environ. Pollut. 2019, 253, 403–411. [Google Scholar] [CrossRef]
  37. Rivera-González, L.O.; Zhang, Z.; Sánchez, B.N.; Zhang, K.; Brown, D.G.; Rojas-Bracho, L.; Osornio-Vargas, A.; Vadillo-Ortega, F.; O’Neill, M.S. An assessment of air pollutant exposure methods in Mexico City, Mexico. J. Air Waste Manag. Assoc. 2015, 65, 581–591. [Google Scholar] [CrossRef] [PubMed]
  38. Saucy, A.; Röösli, M.; Künzli, N.; Tsai, M.Y.; Sieber, C.; Olaniyan, T.; Baatjies, R.; Jeebhay, M.; Davey, M.; Flückiger, B.; et al. Land use regression modelling of outdoor NO2 and PM2.5 concentrations in three low income areas in the western cape province, South Africa. Int. J. Environ. Res. Public Health 2018, 15, 1452. [Google Scholar] [CrossRef] [PubMed]
  39. Chatzidiakou, L.; Krause, A.; Han, Y.; Chen, W.; Yan, L.; Popoola, O.A.; Kellaway, M.; Wu, Y.; Liu, J.; Hu, M.; et al. Using low-cost sensor technologies and advanced computational methods to improve dose estimations in health panel studies: Results of the AIRLESS project. J. Expo. Sci. Environ. Epidemiol. 2020, 30, 981–989. [Google Scholar] [CrossRef] [PubMed]
  40. Aliyu, Y.A.; Botai, J.O. An exposure appraisal of outdoor air pollution on the respiratory well-being of a developing city population. J. Epidemiol. Glob. Health 2018, 8, 91. [Google Scholar] [CrossRef] [PubMed]
  41. Delavar, M.R.; Gholami, A.; Shiran, G.R.; Rashidi, Y.; Nakhaeizadeh, G.R.; Fedra, K.; Hatefi Afshar, S. A Novel Method for Improving Air Pollution Prediction Based on Machine Learning Approaches: A Case Study Applied to the Capital City of Tehran. ISPRS Int. J. Geo-Inf. 2019, 8, 99. [Google Scholar] [CrossRef]
  42. Liang, D.; Golan, R.; Moutinho, J.L.; Chang, H.H.; Greenwald, R.; Sarnat, S.E.; Russell, A.G.; Sarnat, J.A. Errors associated with the use of roadside monitoring in the estimation of acute traffic pollutant-related health effects. Environ. Res. 2018, 165, 210–219. [Google Scholar] [CrossRef] [PubMed]
  43. Sabath, M.B.; Di, Q.; Braun, D.; Schwartz, J.; Dominici, F.; Choirat, C. Airpred: A Flexible R Package Implementing Methods for Predicting Air Pollution. In Proceedings of the 2018 IEEE 5th International Conference on Data Science and Advanced Analytics (DSAA), Turin, Italy, 1–3 October 2018; pp. 577–583. [Google Scholar]
  44. Dai, H.; Huang, G.; Zeng, H.; Zhou, F. PM2.5 volatility prediction by XGBoost-MLP based on GARCH models. J. Clean. Prod. 2022, 356, 131898. [Google Scholar] [CrossRef]
  45. Dai, H.; Huang, G.; Zeng, H.; Yu, R. Haze Risk Assessment Based on Improved PCA-MEE and ISPO-LightGBM Model. Systems 2022, 10, 263. [Google Scholar] [CrossRef]
  46. Goswami, P.; Prakash, M.; Rajan, R.; Prakash, A. A Hybrid Deep Learning Model for Multi-step Ahead Prediction of PM2.5 Concentration Across India. Environ. Model. Assess. 2023, 1–14. [Google Scholar] [CrossRef]
  47. Thu, M.Y.; Htun, W.; Aung, Y.L.; Shwe, P.E.E.; Tun, N.M. Smart Air Quality Monitoring System with LoRaWAN. In Proceedings of the 2018 IEEE International Conference on Internet of Things and Intelligence System (IOTAIS), Bali, Indonesia, 1–3 November 2018; pp. 10–15. [Google Scholar] [CrossRef]
  48. Avis, R. Causes and consequences of air pollution in North Macedonia. Environ. Sci. Pollut. Res. 2022. Available online: https://opendocs.ids.ac.uk/opendocs/handle/20.500.12413/17672 (accessed on 1 August 2023).
  49. AirCare. Available online: https://getaircare.com (accessed on 10 December 2022).
  50. Pulse.eco. Available online: https://pulse.eco (accessed on 10 December 2022).
  51. PM Alarm. Available online: https://aqf.finki.ukim.mk (accessed on 10 December 2022).
  52. Spiridonov, V.; Jakimovski, B.; Spiridonova, I.; Pereira, G. Development of air quality forecasting system in Macedonia, based on WRF-Chem model. Air Qual. Atmos. Health 2019, 12, 825–836. [Google Scholar] [CrossRef]
  53. Anchev, N.; Jakimovski, B.; Spiridonov, V.; Velinov, G. Temperature Dependent Initial Chemical Conditions for WRF-Chem Air Pollution Simulation Model. In Proceedings of the International Conference on ICT Innovations, Skopje, North Macedonia, 24–26 September 2020; Springer: Berlin/Heidelberg, Germany, 2020; pp. 1–14. [Google Scholar]
  54. Arsov, M.; Zdravevski, E.; Lameski, P.; Corizzo, R.; Koteli, N.; Mitreski, K.; Trajkovik, V. Short-term air pollution forecasting based on environmental factors and deep learning models. In Proceedings of the 2020 15th Conference on Computer Science and Information Systems (FedCSIS), Sofia, Bulgaria, 6–9 September 2020; pp. 15–22. [Google Scholar]
  55. Kalajdjieski, J.; Zdravevski, E.; Corizzo, R.; Lameski, P.; Kalajdziski, S.; Pires, I.M.; Garcia, N.M.; Trajkovik, V. Air Pollution Prediction with Multi-Modal Data and Deep Neural Networks. Remote Sens. 2020, 12, 4142. [Google Scholar] [CrossRef]
  56. Kalajdjieski, J.; Mirceva, G.; Kalajdziski, S. Attention Models for PM2.5 Prediction. In Proceedings of the 2020 IEEE/ACM International Conference on Big Data Computing, Applications and Technologies (BDCAT), Leicester, UK, 7–10 December 2020; pp. 1–8. [Google Scholar] [CrossRef]
  57. Kalajdjieski, J.; Trivodaliev, K.; Mirceva, G.; Kalajdziski, S.; Gievska, S. A complete air pollution monitoring and prediction framework. IEEE Access 2023, 11, 88730–88744. [Google Scholar] [CrossRef]
  58. Stojov, V.; Koteli, N.; Lameski, P.; Zdravevski, E. Application of machine learning and time-series analysis for air pollution prediction. In Proceedings of the Conference on Computational Intelligence and Information Technology, Cochin, India, 13–14 July 2018. [Google Scholar]
  59. Kalajdjieski, J.; Korunoski, M.; Stojkoska, B.R.; Trivodaliev, K. Smart City Air Pollution Monitoring and Prediction: A Case Study of Skopje. In Proceedings of the International Conference on ICT Innovations, Skopje, North Macedonia, 24–26 September 2020; Springer: Berlin/Heidelberg, Germany, 2020; pp. 15–27. [Google Scholar]
  60. Korunoski, M.; Stojkoska, B.R.; Trivodaliev, K. Internet of things solution for intelligent air pollution prediction and visualization. In Proceedings of the IEEE EUROCON 2019—18th International Conference on Smart Technologies, Novi Sad, Serbia, 1–4 July 2019; pp. 1–6. [Google Scholar]
  61. Ministry for Environment and Physical Planning: Cheap Sensors for Air pollution are Not Reliable Nor Valid. Available online: https://a1on.mk/macedonia/ministerstvo-za-zhivotna-sredina-evtinite-senzori-za-aerozagaduvanjeto-ne-se-sigurni-nitu-se-validni/ (accessed on 10 December 2022).
Figure 1. Flow diagram from initial search with NLP framework and PRISMA methodology.
Atmosphere 14 01441 g001
Figure 2. Word cloud from selected publication abstracts.
Atmosphere 14 01441 g002
Figure 3. The relationship between pollutants and number of studies.
Atmosphere 14 01441 g003
Figure 4. The relationship between air pollution sensor types and number of studies.
Atmosphere 14 01441 g004
Figure 5. The relationship between prediction models and number of studies.
Atmosphere 14 01441 g005
Table 1. Detailed analysis of the selected publications.
TitleYear of PublicationDatasetSensorsML Approach or Statistical Method
[18]201514 months, 44.5 million geo- and time-stamped real lung deposited surface area (LDSA) measurements, local sampling node, GPRS, database serverStatic sensors on buses, LDSA estimation sensors, which are Naneos Partector devicesLog-linear regression model, KNN model, network-based log linear regression model, and probabilistic graphical model
[19]2018Parameters remotely observed using IoT, information stored on cloud, expand the assessed drift on the browserDHT11 and MQ135 sensorsLSTM (long short-term memory network) and RNNs (recurrent neural networks)
[20]2021NO2 and SO2 time series data, IoT infrastructureSensors for NO2 and SO2Recurrent neural networks (RNNs)
[21]2019Real-time air quality monitoring dataset, Central Pollution Control Board database (703 operating stations) in India, 78 stations in Delhi. Collected data stored on Google Cloud storageSO2, NO2, PM2.5, PM10, CO, and O3 (on an hourly basis), meteorological data and a date/time stampLSTM (long short-term memory network), LSTM-A (attention-based long short-term memory network), BiLSTM (bidirectional long short-term memory network), BiLSTM-A (attention-based bidirectional LSTM network)
[22]2020Combination of pollution data and meteorological data from data logs collected using Arduino Uno platformCO, SO2, O3 sensorsLinear regression (LR), random forest regression, decision tree
[23]2019Data from Alphasense outdoor sensorsElectrochemical sensors measuring: CO2, VOC (alcohols, aldehydes, aliphatic hydrocarbons, amines, aromatic hydrocarbons, CH4, LP G, ketones, and organic acids) CO, SO2, O3, and NO2Artificial neural network (ANN), 3 hidden layers
[24]2018Public PM2.5 image datasetImages, camerasDeep learning, CNN architectures, VGG-16, Inception-V3, ResNet50, 5-layer feed-forward network
[25]2018Shangai image dataset, Beijing image dataset, combined with PM2.5 indicesCameras, imagesComparing PCA, sequential backward feature selection (SBFS), support vector regression (SVR), ResNet-based CNN model classifier (with weather features)
[26]2020Images (from a single object taken from various distances), combined with Alphasense sensor dataAlphasense OPC-N2 sensor, images (focusing on one single building)ResNet18, LSTM, deep learning architecture
[27]2019Short-term stationary ultrafine particles (UFP) data, mobile UFP dataCondensation particle counter (TSI, CPC 3007)Linear regression, LASSO, elastic net, ridge, GLM, Mars, GAM, KRLS, neural networks, SVM, extreme boosting, bagging
[28]201963,865 daily mean NO2 measurements, 48,151 daily mean PM10 measurements from 47 (1 suburban and 46 urban) and 37 (2 suburban and 35 urban) background monitoring sites, respectively, for the period 2009–2013Public sensors, no detailsStatistical simulation
[29]2022Air pollution data from 23 Indian cities over a 6-year periodAnalyzes 12 air pollutants and AQI5 mL models: KNN, Gaussian naive Bayes (GNB), SVM, RF, and XGBoost employed with and without SMOTE resampling technique
[30]201814-day time-scale data, exposure metrics using environmental monitorsMESA Air (PM), Harvard Personal Environmental Monitors (HPEM, Cambridge, MA, USA), TSI SidePak SP530, Shoreview, MN (air sampling pump carried in a backpack), PM2.5 mass concentrations from Teflon filters, sulfur content by X-ray fluorescencePearson correlation coefficient (R), mean relative percent difference (RPD), and root mean square error (RMSE)
[31]20209 measurement stations, 1 h recording intervals from August 2014 to October 2014; the data are part of the CityPulse Pollution Dataset collectionAir pollutant sensors: ozone, PM2.5, SO2, CO, NO2; no details about the sensors givenComparison of convLSTM with a proposed CNN–LSTM architecture
[32]2022Data collected from December 2017 to June 2019, particle sensorPurpleAir 2 sensors, low-cost sensors for particle countingCorrelation coefficient, coefficients of divergence to compare sensor performance
[33]202013 June to 2 July 2011 and 30 November to 12 December 2011 data for personal exposure to PM2.5 particlesSampling pump (LP-5, BUCK, FL, USA), exposure monitor (PEM-PM2.5, BGI, MA, USA) with Teflon filter (R2PJ037, PALL, NY, USA)PCA, ANN compared with ANN only for personal exposure to PM2.5 prediction
[34]2020NWNU-AQI image datasetAQI levels from nearest base stations, a camera, the micro stations (1 km radius), GPS, camera used for imagesSVM compared with deep learning architectures based on VGG, ResNet, newly proposed architecture AQC-Net
[35]202011-year dataset collected by Taiwan’s Environmental Protection Administration (EPA)Measured O3, SO2 , PM10, and PM2.5, CO, CO2, NO2Adaptive boosting (AdaBoost), artificial neural network (ANN), random forest, stacking ensemble, and support vector machine (SVM) for AQI index prediction
[36]2019Data from outdoor, indoor, and in-vehicle measurements (subway, bus, and private cars)No details for available PM2.5 sensors; indoor sensors are commercial Laser Egg monitorsSpatio-temporally weighted PM2.5 exposure model
[37]20152008 hourly data points from Mexico City’s monitoring networkPublic sensors for PM10, PM2.5, O3, CO, NO2, and SO2; no detailsCitywide averaging (CWA), nearest monitor (NM), inverse distance weighting (IDW), ordinary Kriging (OK), and variogram modeling to estimate point exposure; statistics calculated for each exposure method
[38]2018November 2015 to March 2016 (warm season), June to September 2016 (cold season), weekly measurementsNO2 measured with passive gas samplers (Passam AG, Switzerland), integrated PM2.5 mass filters, Teflon filter connected to a vacuum pump (PM2.5)Land use regression (LUR) models to estimate distribution of NO2 and PM2.5 pollution
[39]2020Personal air quality Monitor (PAM), one week, each season, with outdoor pollution measurements, time resolution of 1 minCO, NO2, O3, NO, and PM2.5 measurement with both PAM and outdoor sensorsCorrelation between pollutants and measurements of PAM and outdoor sensors; proposed time-activity model for estimation of exposure
[40]2018Portable pollutant monitor data combined with respiratory health records, WHO AirQ+ software, American Thoracic Society (ATS) questionnaire dataMSA Altair 5 for CO and SO2, CW-HAT200 particulate counter for PM2.5 and PM10Various statistical methods for pollution distribution and influence of pollution on reported symptoms
[41]2019Meteorological data, PM10 and PM2.5 pollutants measured from AQCC from 2006 to 2016, using 24 stations in TehranPublic AQCC and meteorological organizationSVR, GWR, ANN, and NARX with external input
[42]2018Roadside, indoor pollution dataMeasuring CO, NO, NO2, PM2.5, BC, and PM2.5 mass (Thermo 48i, Teledyne 200A, Magee Scientific Aethalometer and Gravimetric), outdoor location, Teledyne 300E, Thermo 42C Low Source, microAeth AE51, and Gravimetric outdoor and indoorsCorrelation between pollutant concentrations and spatio-temporal regression models
[43]2018Various datasetsNot availablePart of H2O (big data R AI cloud platform)
[44]2022Measuring PM2.5, PM10, NO2, SO2, O3, CO on an hourly basis, 26 weather parameters, as well as human-caused factors from 2016 to 2020 in 10 cities in Shaanxi Province, ChinaChina Environmental Protection Agency (EPA) open air quality observation data from ground monitoring stationsA hybrid model for determining PM2.5 concentrations and volatility, XGBoost (extreme gradient boosting), four GARCH (generalized auto-regressive conditional heteroskedasticity) models, and MLP (multi-layer perceptrons)
[45]2022Yearly average concentrations of PM10, PM2.5, SO2 , VOCs, and NO2 ; some data were taken from the Shaanxi and Henan Provincial Statistical Yearbook from 2016 to 2021 for haze hazard forecastingNational Urban Air Quality Real-Time Release Platform data sourcePCA (principal component analysis)–MEE (matter element extension)–ISPO (improving particle swarm optimization)–LightGBM (light gradient boosting machine) air quality forecasting model
[46]202326 Indian cities, data taken from the Central Pollution Control Board (CPCB), data from 1 January 2015 to 31 May 2020Prediction of PM2.5Hybrid deep learning model using encoder–decoder, LSTM, bidirectional LSTM, convolutional LSTM, 3D convolution neural network, PM2.5, multistep ahead prediction, SNR
[47]2018A dataset containing temperature, humidity, dust, and CO2 collected as mean, each day, from 1 June 2018 to 22 July 2018No details about sensors givenAuto-regressive integrated moving average (ARIMA)
Table 2. Comparison of selected publications based on the methods used.
ReferenceSupervised LearningUnsupervised LearningDeep LearningOptimization & HeuristicOther
[18]
[19]
[20]
[21]
[22]
[23]
[24]
[25]
[26]
[27]
[28]
[29]
[30]
[31]
[32]
[33]
[34]
[35]
[36]
[37]
[38]
[39]
[40]
[41]
[42]
[43]
[44]
[45]
[46]
[47]
Disclaimer/Publisher’s Note: The statements, opinions and data contained in all publications are solely those of the individual author(s) and contributor(s) and not of MDPI and/or the editor(s). MDPI and/or the editor(s) disclaim responsibility for any injury to people or property resulting from any ideas, methods, instructions or products referred to in the content.

