Article

Synoptic and Dynamical Characteristics of High-Impact Storms Affecting the Iberian Peninsula during the 2018–2021 Extended Winters

by
Ana C. R. Gonçalves
1,2,
Raquel Nieto
1,* and
Margarida L. R. Liberato
2,3
1
Centro de Investigación Mariña, Environmental Physics Laboratory (EPhysLab), Universidade de Vigo, Campus As Lagoas s/n, 32004 Ourense, Spain
2
Instituto Dom Luiz, Faculdade de Ciências da Universidade de Lisboa, 1749-016 Lisboa, Portugal
3
Escola de Ciências e Tecnologia, Universidade de Trás-os-Montes e Alto Douro (UTAD), Quinta de Prados, 5000-801 Vila Real, Portugal
*
Author to whom correspondence should be addressed.
Atmosphere 2023, 14(9), 1353; https://doi.org/10.3390/atmos14091353
Submission received: 26 July 2023 / Revised: 24 August 2023 / Accepted: 25 August 2023 / Published: 28 August 2023
(This article belongs to the Special Issue Feature Papers in Meteorological Science (2nd Edition))

Abstract

:
In the extended winters from December 2017 to April 2021, numerous high-impact storms affected the Iberian Peninsula (IP) with heavy precipitation and/or strong winds. Here, we provide a comprehensive assessment of these events, synoptic conditions, large-scale dynamics associated with storms, and a climatological analysis to improve public awareness and natural disaster prevention. Variability analysis presents that their maximum intensity ranges from 955 hPa to 985 hPa, a two-to-four-day lifetime, and the highest frequency (eight events) occurred in January. At the instant of maximum intensity, anomalies presented low MSLP values (−21.6 hPa), high values of water vapor (327.6 kg m−1s−1) and wind speed at 250 hPa (29.6 m s−1), high values of θe at 850 hPa (19.1 °C), SST (−1 °C), and QE (−150 W m−2), near Iberia. The values obtained during the storm impact days exceeded the 98th percentile values in a high percentage of days for daily accumulated precipitation (34%), instantaneous wind gusts (46%), wind speed at 10 m (47%), and concurrent events of wind/instantaneous wind gusts and precipitation (26% and 29%, respectively). These results allow us to characterize their meteorological impacts on the IP, namely those caused by heavy precipitation and wind.

1. Introduction

Extratropical cyclones (ECs) are a major cause of damaging winds and heavy precipitation in mid-latitudes. Moreover, the highest-impact weather within them is associated with mesoscale structures such as fronts [1,2]. ECs are a fundamental part of atmospheric circulation in the mid-latitudes due to their ability to transport large amounts of heat and moisture [3,4,5].
More than two-thirds of the climatological precipitation in much of Europe and North America is caused by ECs, and in the main storm track regions, this percentage can reach 90% [6,7], affecting the daily weather conditions in these regions [5,8]. In addition, most large-scale extreme precipitation events in the extratropics are linked to the passage of ECs [8,9,10], and these events, which originate in the North Atlantic and reach Europe, are the main cause of flood events in these regions [11].
Some previously studied high-impact events affecting the Iberian Peninsula (IP) crossed the North Atlantic in the direction of Europe and underwent an explosive development at unusual lower latitudes, reaching the IP with an uncommon intensity [12,13,14,15,16,17]. ECs with explosive development that affect Europe form when baroclinic disturbances over the North Atlantic undergo rapid intensification, which leads to a fall in surface pressure and steep pressure gradients, producing extremely high surface wind speeds over a large footprint region [18,19,20]. Intense cyclones, with very low pressure at the core center, are frequently accompanied by strong winds and heavy precipitation [21,22]. Events that affect the IP often lead to high amounts of precipitation and flooding associated with atmospheric rivers (ARs) [23,24,25,26]. Furthermore, such events have also been observed in France and Western Europe [27].
Studies by Ulbrich et al. [28] and Catto et al. [1] suggest that even if the total number of ECs remains stable, the number of extreme cyclones affecting Western Europe and the eastern North Atlantic in the future may slightly increase in association with an intensified polar jet extended towards Europe. Besides that, the precipitation intensity of the most severe ECs is expected to increase in a warmer climate in the extratropics [8,9,10].
In recent decades, the number and intensity of ECs have increased significantly [29]. These events cause substantial economic damage, including property damage, flash floods, landslides, travel disruptions, and fatalities due to strong winds and extreme precipitation [5,16,18,30]. The frequent occurrence of ECs in quick succession over the same location can also lead to accumulated impacts such as flooding and wind damage [2]. These events often involve simultaneous strong wind and precipitation events along with frontal structures [9,31,32,33], affecting several worldwide regions, such as the IP [34,35,36]. ECs are classified as wind and precipitation storms with widespread impacts and are referred to as compound events (CEs) [37,38,39]. CEs result from the combination of multiple causes and hazards, contributing to societal and environmental risks [40], and their combined occurrence can have significant impacts, even without the individual factors reaching extreme values [41,42]. Many studies have analyzed CEs involving heavy precipitation and extreme wind episodes, e.g., Refs. [13,15,16], in various regions, including the Mediterranean region [31]; Europe, e.g., Refs. [43,44,45,46]; western North America and northern Europe, e.g., Ref. [47]; China, e.g., Ref. [48]; and at a global scale, e.g., Refs. [39,49,50,51,52]. The importance and impact of the ECs in Europe are such that since 1954, the Institute of Meteorology of the Freie Universität Berlin has named all pressure systems in Central Europe [53]. Recent impactful storms demonstrated the need to communicate severe weather clearly and naming storms is proven to help to raise public awareness. Therefore, the need to increase public awareness of extreme ECs and their impacts has meant that since 2017, the names of high-impact storms that may affect Portugal, Spain, and France, which are part of the so-called meteorological Southwest European Group (SW Group), have been assigned by their national meteorological services [54,55,56]. The meteorological services of Belgium [57] and Luxembourg [58] joined the initiative in 2019 and 2021, respectively. The named storms can affect all five SW Group countries, simultaneously or just only one of them. These meteorological services are also in coordination with the Western European Group formed by the United Kingdom, Ireland, and the Netherlands [59,60,61].
Recent works mentioned have proven that the four winters of 2018–2021 have been prone to high-impact storms with different behaviors and development, leading to extensive socioeconomic impacts caused by heavy rainfall, snow, and strong winds in the IP region [17,62,63,64] and other European countries [65,66]. In the IP, the results of Hénin et al. [36] show that 85% of recorded precipitation and wind-extreme events are associated with ECs, and western IP coasts are the areas most exposed to ECs [30]. In addition, the three consecutive ECs named Daniel, Elsa, and Fabien that occurred in the extended winter of 2019–2020 affected the IP, with extreme rainfall that led to flash floods, extensive landslides, and strong winds, which caused numerous socioeconomic impacts, especially in the north and center of Portugal and Spain [17]. Moreover, the study by Ribeiro et al. [67] highlights the heavy damage to the Portuguese forest—in terms of woody material—caused by the winter 2017–2018 events resulting from the strong winds associated with the high-impact storms. EC Filomena was studied by Zschenderlein and Wernli [63], which was responsible for a heavy snowfall event, developed from a precursor low-pressure system over the central North Atlantic, that affected Spain in early January 2021.
In this sense, an important motivation for this study is the high number of high-impact ECs that affected Iberia and caused numerous socioeconomic impacts in the four extended winters (2018–2021), and the fact that there are no studies that systematically analyzed all the events that affected the IP with heavy precipitation and/or strong winds.
The occurrence of a high number of named events (frequency) with societal impact in the IP makes these winters anomalous in terms of climatology. According to the cyclone climatology presented by Sousa et al. [68] (see Figure 7 of Sousa et al. [68]), the IP is affected on average by up to two cyclones per year. Ulbrich et al. [69] (see Figure 1 of Ulbrich et al. [69]) show that according to historical data, Iberia is affected on average by less than five cyclones per winter, and when referring to strong cyclones, it is affected on average by less than one cyclone per winter. Results from Neu et al. [70] (see Figure 1 of Neu et al. [70]), based on fifteen cyclone detection and tracking methods, show that the IP is affected by less than fifteen cyclones per winter lasting twenty-four hours or more. Pinto et al. [71] (see Figures 3 and 4 of Pinto et al. [71]) analyzed the characteristics of cyclones over the North Atlantic and Europe and found that Iberia may be affected by between five to ten cyclone days/winter and by less than one extreme cyclone day/winter. Furthermore, Karremann et al. [72] showed that there is a decal variability of cyclones with extreme winds’ impact on the IP and characterized these events. These and additional studies carried out within the scope of the Stormex and WEx-Atlantic projects demonstrated that there is a need to systematize the extreme events that have occurred in recent winters. So far, only case studies have been published.
Thus, the present study aims to understand, from a synoptic and dynamic point of view, the different conditions of development of the high-impact storms that mainly hit the IP in the four extended winters, 2017–2018 to 2020–2021.
Thus, the goals of this study are:
(i).
To assess the named events that affected the IP with heavy precipitation and/or strong winds and the impacts caused by the studied events;
(ii).
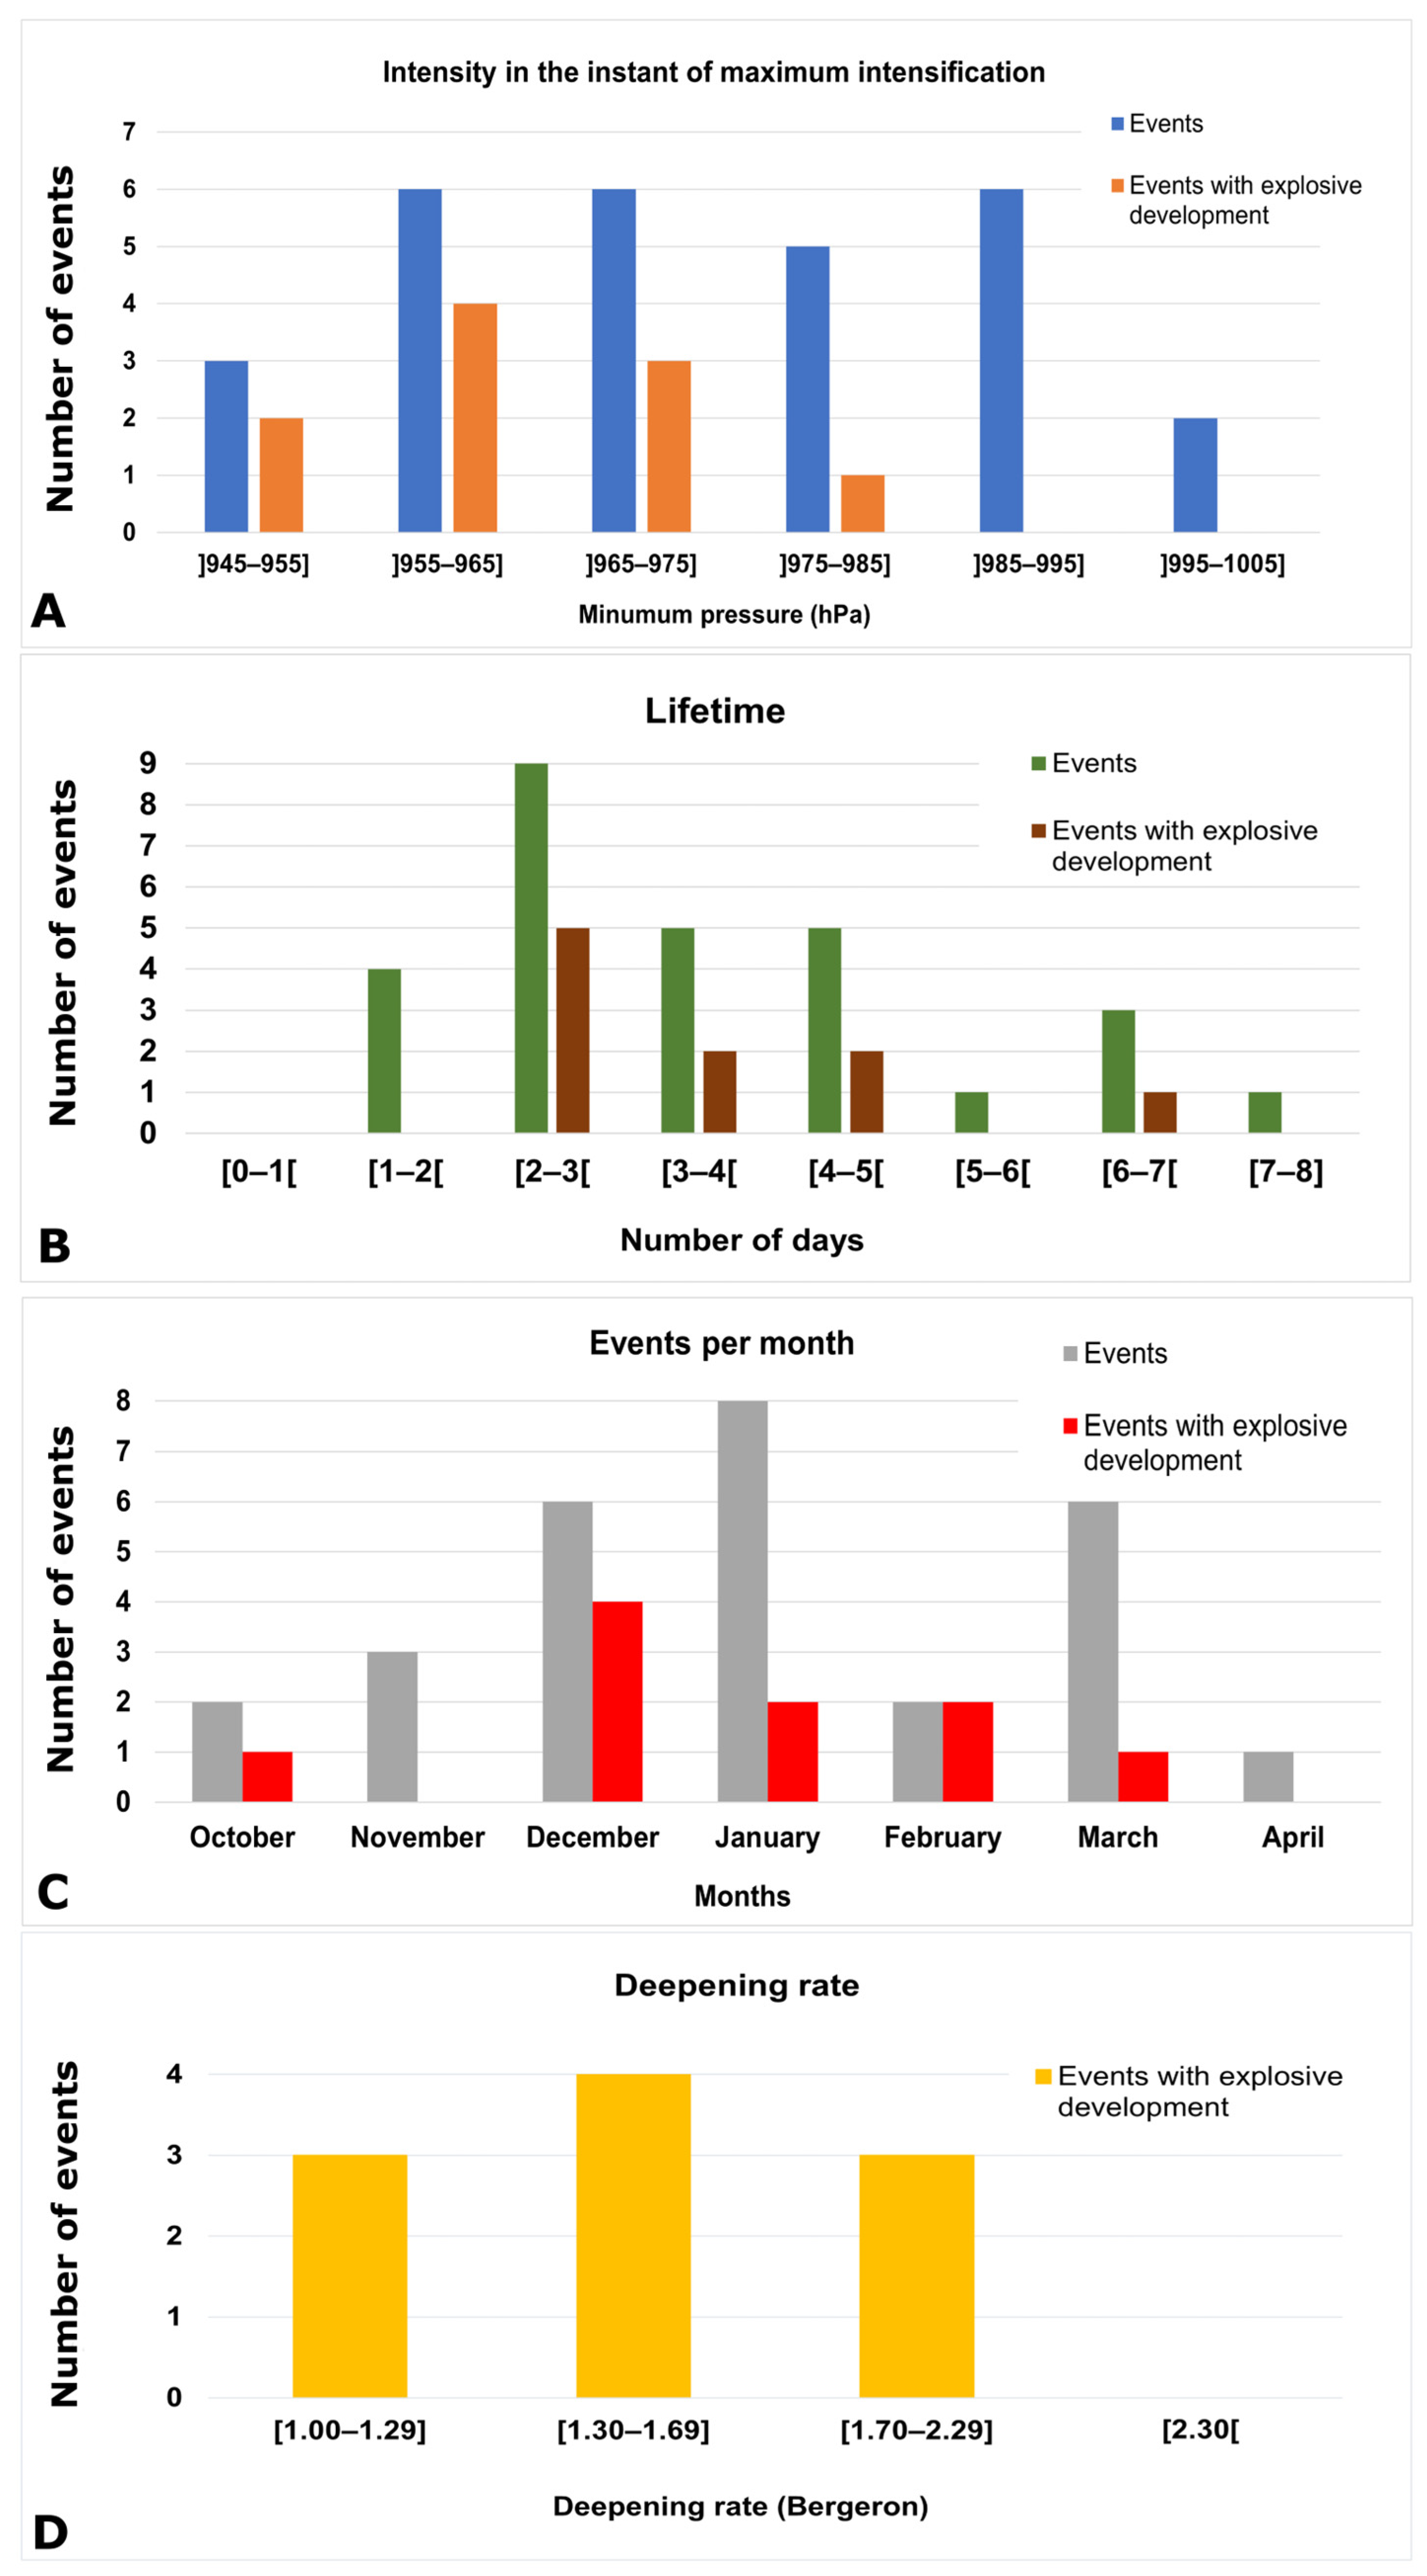
To characterize the variability of the events under study considering the maximum intensity (minimum central pressure), the lifetime of each event, and the number of events per month;
(iii).
To characterize the synoptic and dynamical conditions driving the events through critical meteorological variables;
(iv).
To evaluate the intensity of the selected events considering the precipitation and wind speed values reached for these;
(v).
Finally, to analyze the meteorological variable anomalies for the high-impact storms studied relative to the climatology of the 1991–2020 reference period.
The paper is structured in the following sections: Section 2 presents the data and method used in this study. Section 3 assesses the characteristics and variability of high-impact storms. Section 4 discusses the results of the case study analysis; the intensity of the selected events concerning the precipitation, wind speed, and instantaneous wind gust; the identification of extreme concurrent events of these variables; and the climatology and the respective anomaly analysis of the variables under study. Finally, Section 5 shows the discussion of the results, and the last section presents the conclusions and significance of this work.

2. Materials and Methods

2.1. Identification and Characterization of the High-Impact Events Affecting the IP

ECs that caused high impacts in the IP during the four extended winters (October 2017 to April 2021) are selected from the forty-nine high-impact storms designated by the so-called meteorological Southwest European Group (SW Group) dataset, and each event is analyzed individually.
First, the official reports of the meteorological institutes of the two countries IPMA [54] and AEMET [55] collected the information and meteorological impacts—wind and/or precipitation and/or snow—of each event. These climatological bulletins can be consulted in the respective links [73,74].
Then, weather charts (UK Met Office, available from www.wetter3.de/ (accessed on 7 June 2021) were used for the surface analysis of synoptic development, collecting the position (latitude and longitude) every six hours, and tracing their trajectories. Likewise, the pressure values in each position (six hours) were collected, and the instant of maximum intensity of each event was identified, that is, the instant when the storm reached the minimum core pressure. That said, having identified the high-impact storms that affected the IP, the events and their lifecycle characteristics were characterized.
Moreover, to identify the events with explosive development (explosive cyclogenesis or meteorological “bombs”), the criterion and definition used by Sanders and Gyakum [75] is followed, that is, when the central pressure, geostrophically adjusted to 60° N, decays at least 24 hPa in 24 h, i.e.,
d p d t adj = d p d t sin φ Ref sin φ 24   hPa / 24   h
where φ is the storm latitude, and φRef is 60° N. Thus, when the surface pressure falls in the central MSLP of at least (24 sin φ/sin 60°) hPa in 24 h, the events are characterized as events with explosive cyclogenesis [75,76].
In addition, the events were analyzed according to Bergeron’s rate of deepening (DR) (DR in Bergeron) by Sanders and Gyakum [75] and classified according to Sanders [77]. Thus, an EC is characterized as a cyclone with a central sea level pressure (SLP) that decreases at an average rate of at least 1 Bergeron:
1 Bergeron = (24 hPa/24 h) × sin60°/sinφ,
where φ is the latitude of the cyclone center and 60° is the adjusted latitude in geostrophically equivalent rate. Furthermore, Sanders [77] categorized ECs into three intensity levels: weak (1.0–1.2 Bergerons), moderate (1.3–1.8 Bergerons), and strong (>1.8 Bergerons).
Zhang et al. [78] revised the definition of EC given by Sanders and Gyakum [75] to be a cyclone where central SLP decrease normalized at 45° N is greater than 12 hPa within 12 h. The 12 h SLP change is used to find an instance of the most rapid deepening in a cyclone’s life.
In this study, the modified EC definition introduced by Zhang et al. [78] was used. The deepening rate (DR in Bergeron) of a cyclone’s SLP (hPa h−1) can be computed using the following equation:
P t 6 P t + 6 12 × sin 45 ° sin φ t 6 + φ t + 6 2 ,  
where t represents the analyzed time in hours, P is the central SLP, and φ is the latitude of the cyclone center defined as the position of minimum SLP. The subscripts “t − 6” and “t + 6” denote the time 6 h before and after the time t, respectively. EC is defined as a cyclone with a deepening rate greater than or equal to 1 Bergeron and classified as weak (1.00–1.29), moderate (1.30–1.69), strong (1.70–2.29), and super (≥2.30).
Cyclones were also classified according to their trajectories following the Karremann et al. [72] criteria developed for windstorms. They characterized the large-scale atmospheric conditions and cyclone trajectories associated with the 100 largest potential losses in the IP due to strong wind events (windstorms). The events could be classified as (1) group “Iberia”, those cyclones with tracks crossing over Iberia on the event day; (2) group “North”, cyclone tracks that cross north of Iberia on a zonal track, mainly to the southwest of the British Isles, and influence Iberia mainly due to their extended fronts; (3) group “West”, cyclone tracks that cross from southwest to northeast, but west of Iberia; (4) group “Hybrid”, the synoptic pattern with the juxtaposition of a cyclone and an anticyclone leading to a pronounced mean sea level pressure (MSLP) gradient over Iberia, and thus strong winds. They also found differences between these groups concerning the mean values of the minimum core pressure. The lowest minimum mean value for the ±1 day of the event was found for the West group (966 hPa), followed by the North group (976 hPa), and the Iberia and Hybrid groups (both with 983 hPa).
In the present study, an MSLP composite of the minimum pressure value reached for each event was calculated, and the trajectory of each event was analyzed, to then classify the events into the groups defined for windstorms by Karremann et al. [72]. Thus, it is possible to analyze the behavior and magnitude of the events under study and compare them with the results of Karremann et al. [72], in terms of their trajectories and magnitude.

2.2. Meteorological Data and Synoptic Analysis

To analyze the synoptic conditions and the large-scale dynamics associated with the development of the high-impact storms that affect the IP, meteorological parameters from the European Centre for Medium-Range Weather Forecasts (ECMWF) ERA5 Reanalysis [79] were used. Fields of wind; temperature (T); relative (RH) and specific humidity (q) at 27 pressure levels (from 100 to 1000 hPa); mean sea level pressure (MSLP); integrated vapor transport (IVT); and sea surface temperature (SST) have been used for the Euro-Atlantic region (90° W–25° E; 15° N–65° N). These fields were extracted for the 1991–2021 extended winter months (October to April, ONDJFMA), for the 6-hourly timesteps (00, 06, 12, and 18 UTC), with a horizontal spatial resolution of 0.25° (31 km) on a latitude/longitude grid.
To assess heat exchange between the ocean and atmosphere associated with high-impact storms, heat fluxes were used. The study of Dacre et al. [80] demonstrates that heat and moisture exchanges between the ocean and atmosphere in the cold sector behind the cold front of the ECs can lead to ocean cooling for the strongest cyclones, and Zhang et al. [81] showed the high contribution of latent and sensible heat fluxes in the initial development of super explosive cyclones. The net surface thermal radiation (QLW) refers to the thermal radiation emitted by the atmosphere and clouds reaching the Earth’s surface, minus the amount radiated back from the surface. Surface solar radiation (QSW) is the amount of solar radiation that reaches the surface, considering both direct and diffuse radiation, minus the portion reflected by the surface. Surface latent heat flux (QE) involves the exchange of latent heat with the surface through turbulent diffusion, while surface sensible heat flux (QH) involves the exchange of sensible heat with the surface. The magnitudes of QE and QH are influenced by factors such as wind speed, moisture, and temperature differences between the surface and the lower atmosphere. QN is given by the sum of QSW, QLW, QH, and QE. The ECMWF convention for vertical fluxes considers positive values in the downward direction.
Equivalent potential temperature (θe) signifies the temperature an air parcel would reach if all the contained water vapor condensed, releasing latent heat, and the parcel was compressed adiabatically to a standard reference pressure. So, achieving the equivalent potential value for an air parcel involves lifting it from its initial level until all water vapor condenses and then adiabatically compressing it to 1000 hPa pressure. Since the condensed water is assumed to fall out, the parcel’s temperature increase during compression follows the dry adiabatic rate, leading to a temperature higher than the initial level upon descent. This process is termed pseudoadiabatic ascent, and while not fully adiabatic due to heat carried by falling liquid water, it is a significant concept in atmospheric science [15,82,83]. θe at the 850 hPa was computed using ERA5 reanalysis data (T and RH) following Bolton’s formula [82]. The equivalent potential temperature at 850 hPa is commonly used to identify the approximate position of the surface fronts [84,85].
To analyze the synoptic conditions and the underlying dynamics of the events under study, a case study was chosen (Storm Ana, see Table 1 and Table S1) and the analysis was made for different meteorological variables (MSLP, θe at 850 hPa, IVT, wind speed at 250 hPa, QE, QH, QN, and SST) in different states of their development—the instant of maximum intensity (minimum pressure), as well as 12 h before and 24 before the instant of maximum intensity.
The climatological analysis was carried out for the extended winter months (ONDJFMA) of the 1991–2020 period and the meteorological fields studied. The anomalies of the storm composites—the average of the composites minus the long-term average—were calculated for the variables mentioned above. The composite was calculated for the average of meteorological variables considered at the instant maximum intensity (minimum central pressure) of each event. The analysis is also presented in Supplementary Material (See Table S1 and Figures S1 and S2).
The total precipitation, 10 m wind components (u and v components), and instantaneous 10 m wind gust (i10fg) fields are also obtained from ERA5 reanalysis on an hourly basis for a smaller region shown in Section 4.2 (10° W–4° E; 35° N–45° N). The hourly dataset covers the extended winter period of ONDJFMA for 1991–2020, and the same parameters are extracted for the days of greatest impact of the studied storms in the IP.
Moreover, the daily accumulated precipitation dataset was calculated from the hourly data adding the precipitation between 00 UTC (timestep 01 UTC of day n) and 00 UTC on the next day (timestep 01 UTC of day n + 1). The instantaneous 10 m wind gust used in this study corresponds to the maximum wind gust at the specified time, at a height of ten meters above the surface of the Earth.

2.3. Extreme Precipitation and Wind Associated with the Storms, and Concurrent Events

For a more specific analysis of the IP, high-impact storms are classified here into three types: windstorms (W), storms involving both wind and precipitation (W + P), and precipitation storms (P). These classifications are based on the values exceeding the 98th percentile for each respective variable in at least one ERA5 grid point in the IP domain (10° W–4° E; 35° N–45° N), during the storm days, as outlined in Table 1 and Section 2.3 and Section 4.2.
The days with the greatest impact of each storm are counted considering as a reference the day of maximum intensity (minimum central pressure). Comparative analysis was performed for each storm and then for the set of events. Each variable is analyzed individually to assess the percentage of days in which their values exceed the 98th percentile in at least one grid point in the domain considered during the storm days. In addition, to check if there are concurrent extreme events in terms of precipitation and wind, these shall be considered to reach values higher than the 98th percentile for both wind and precipitation variables at the same time.

3. Results

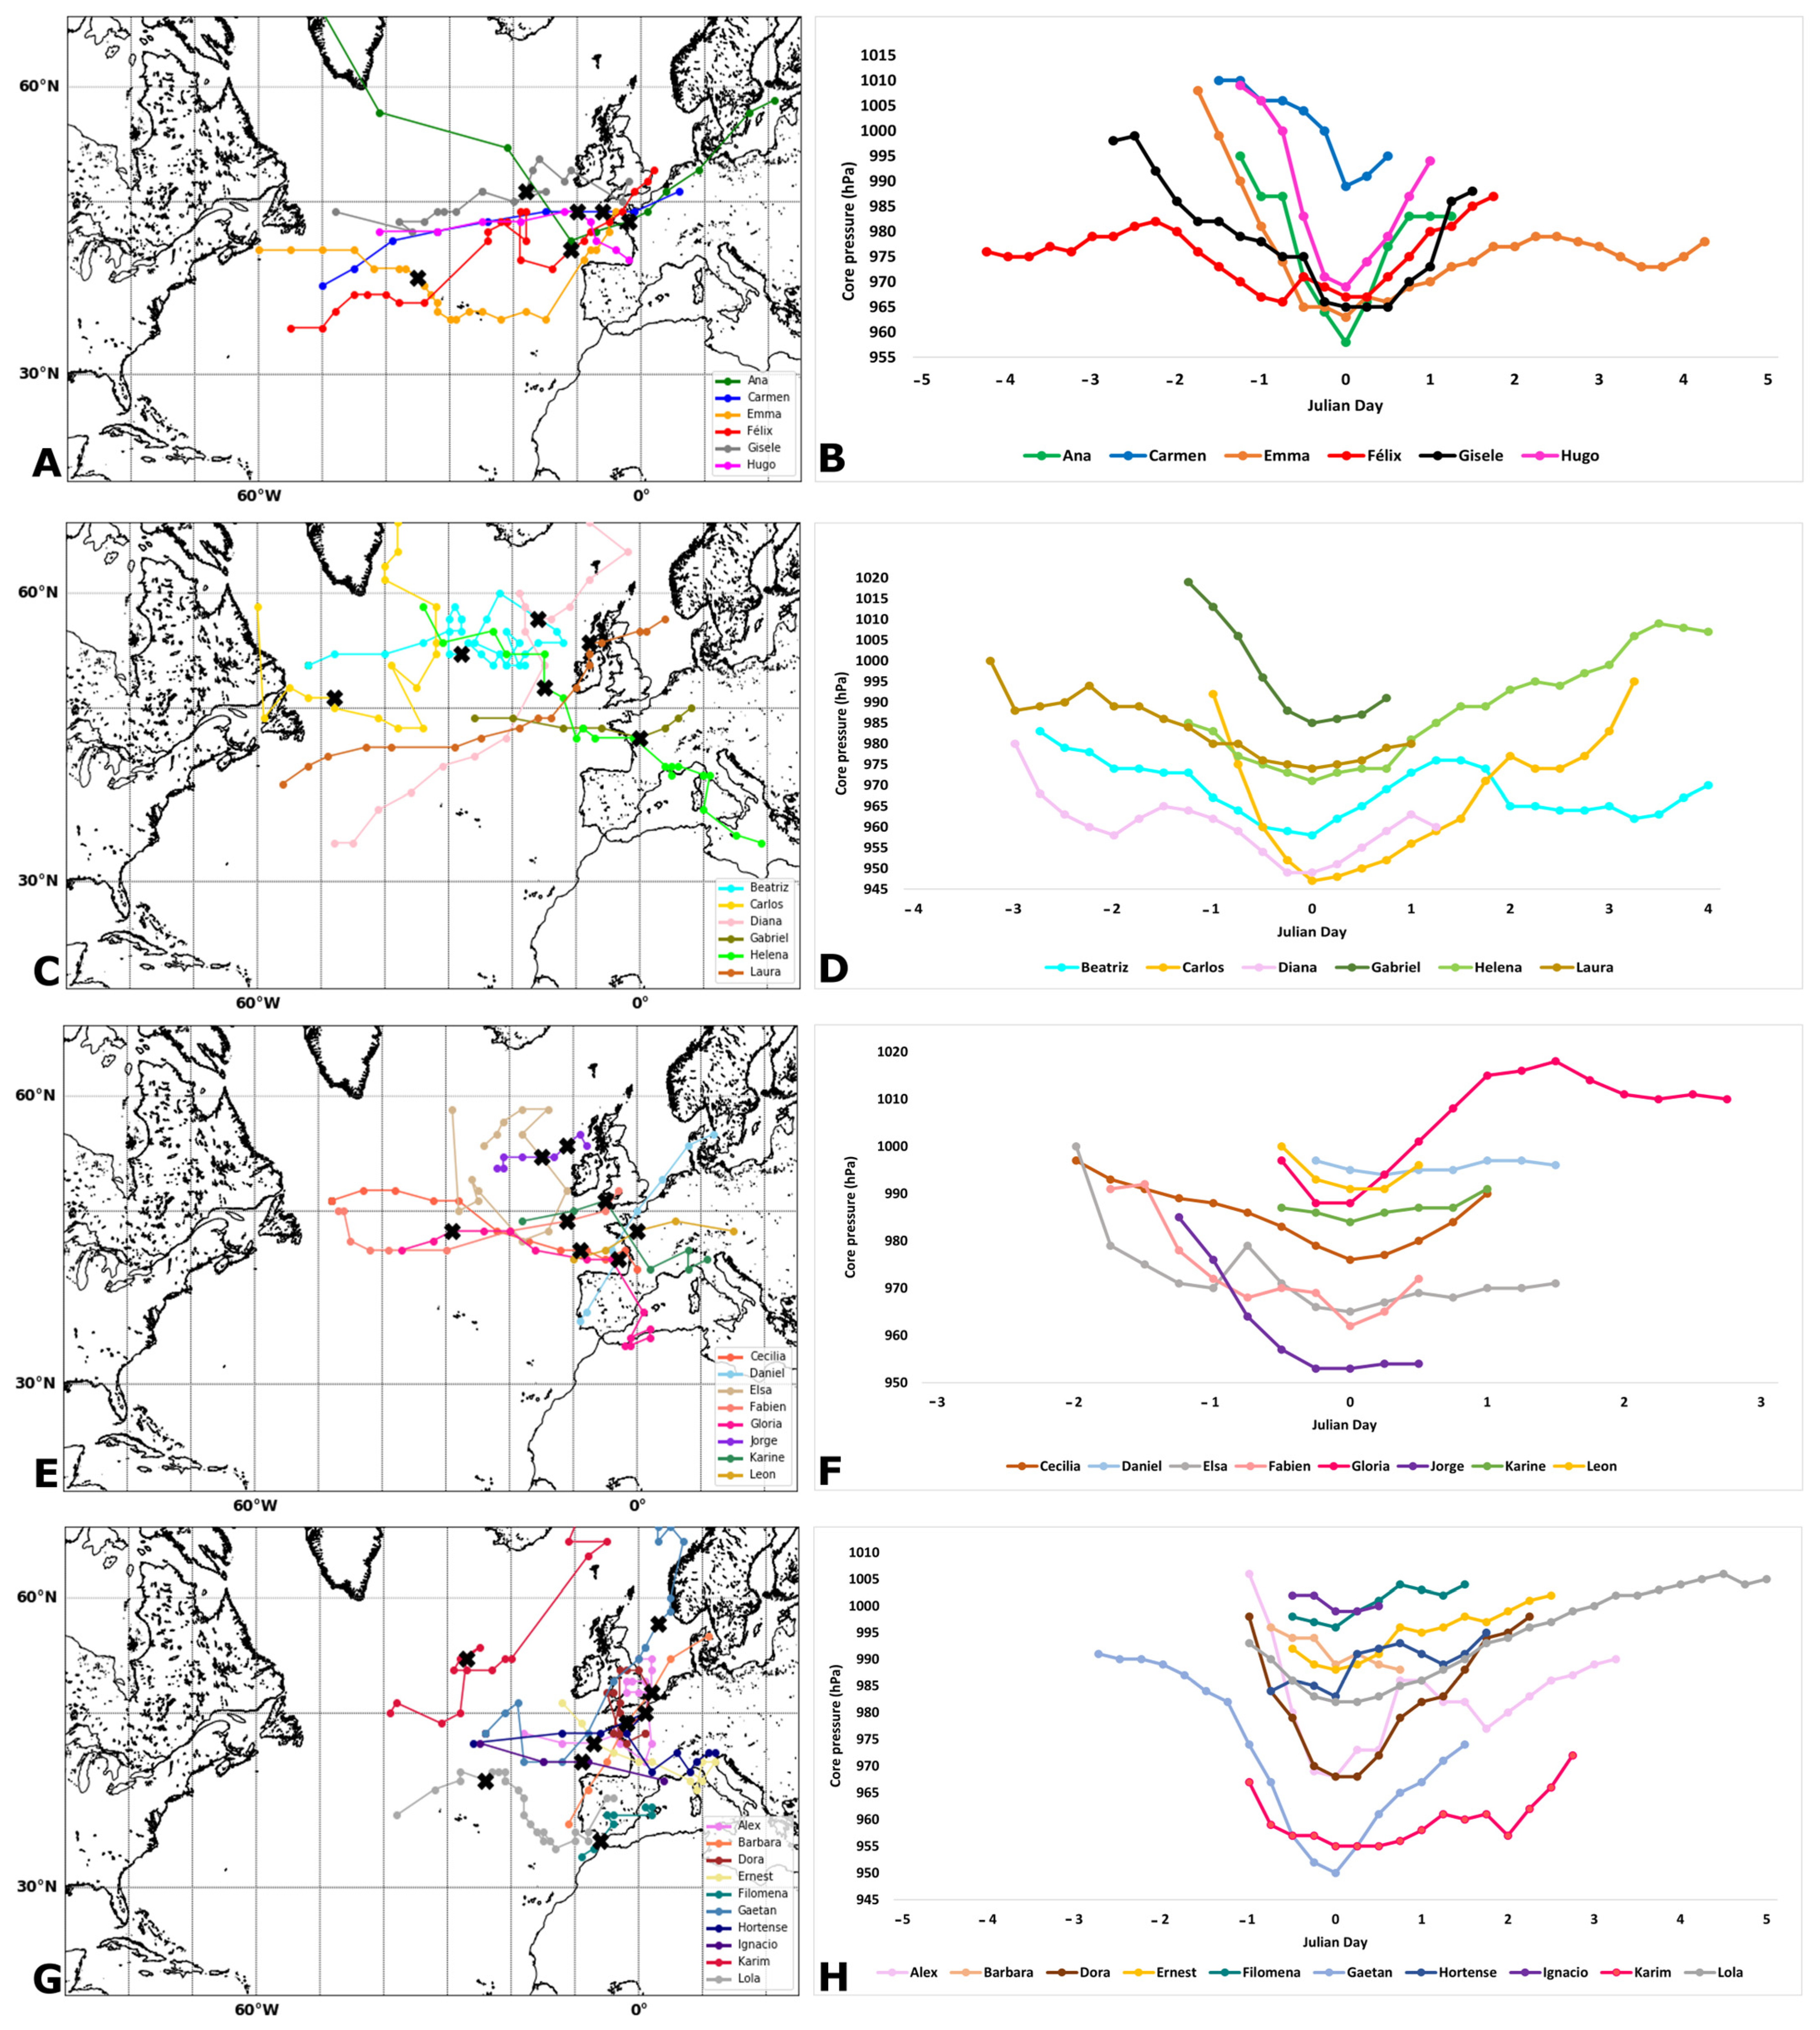
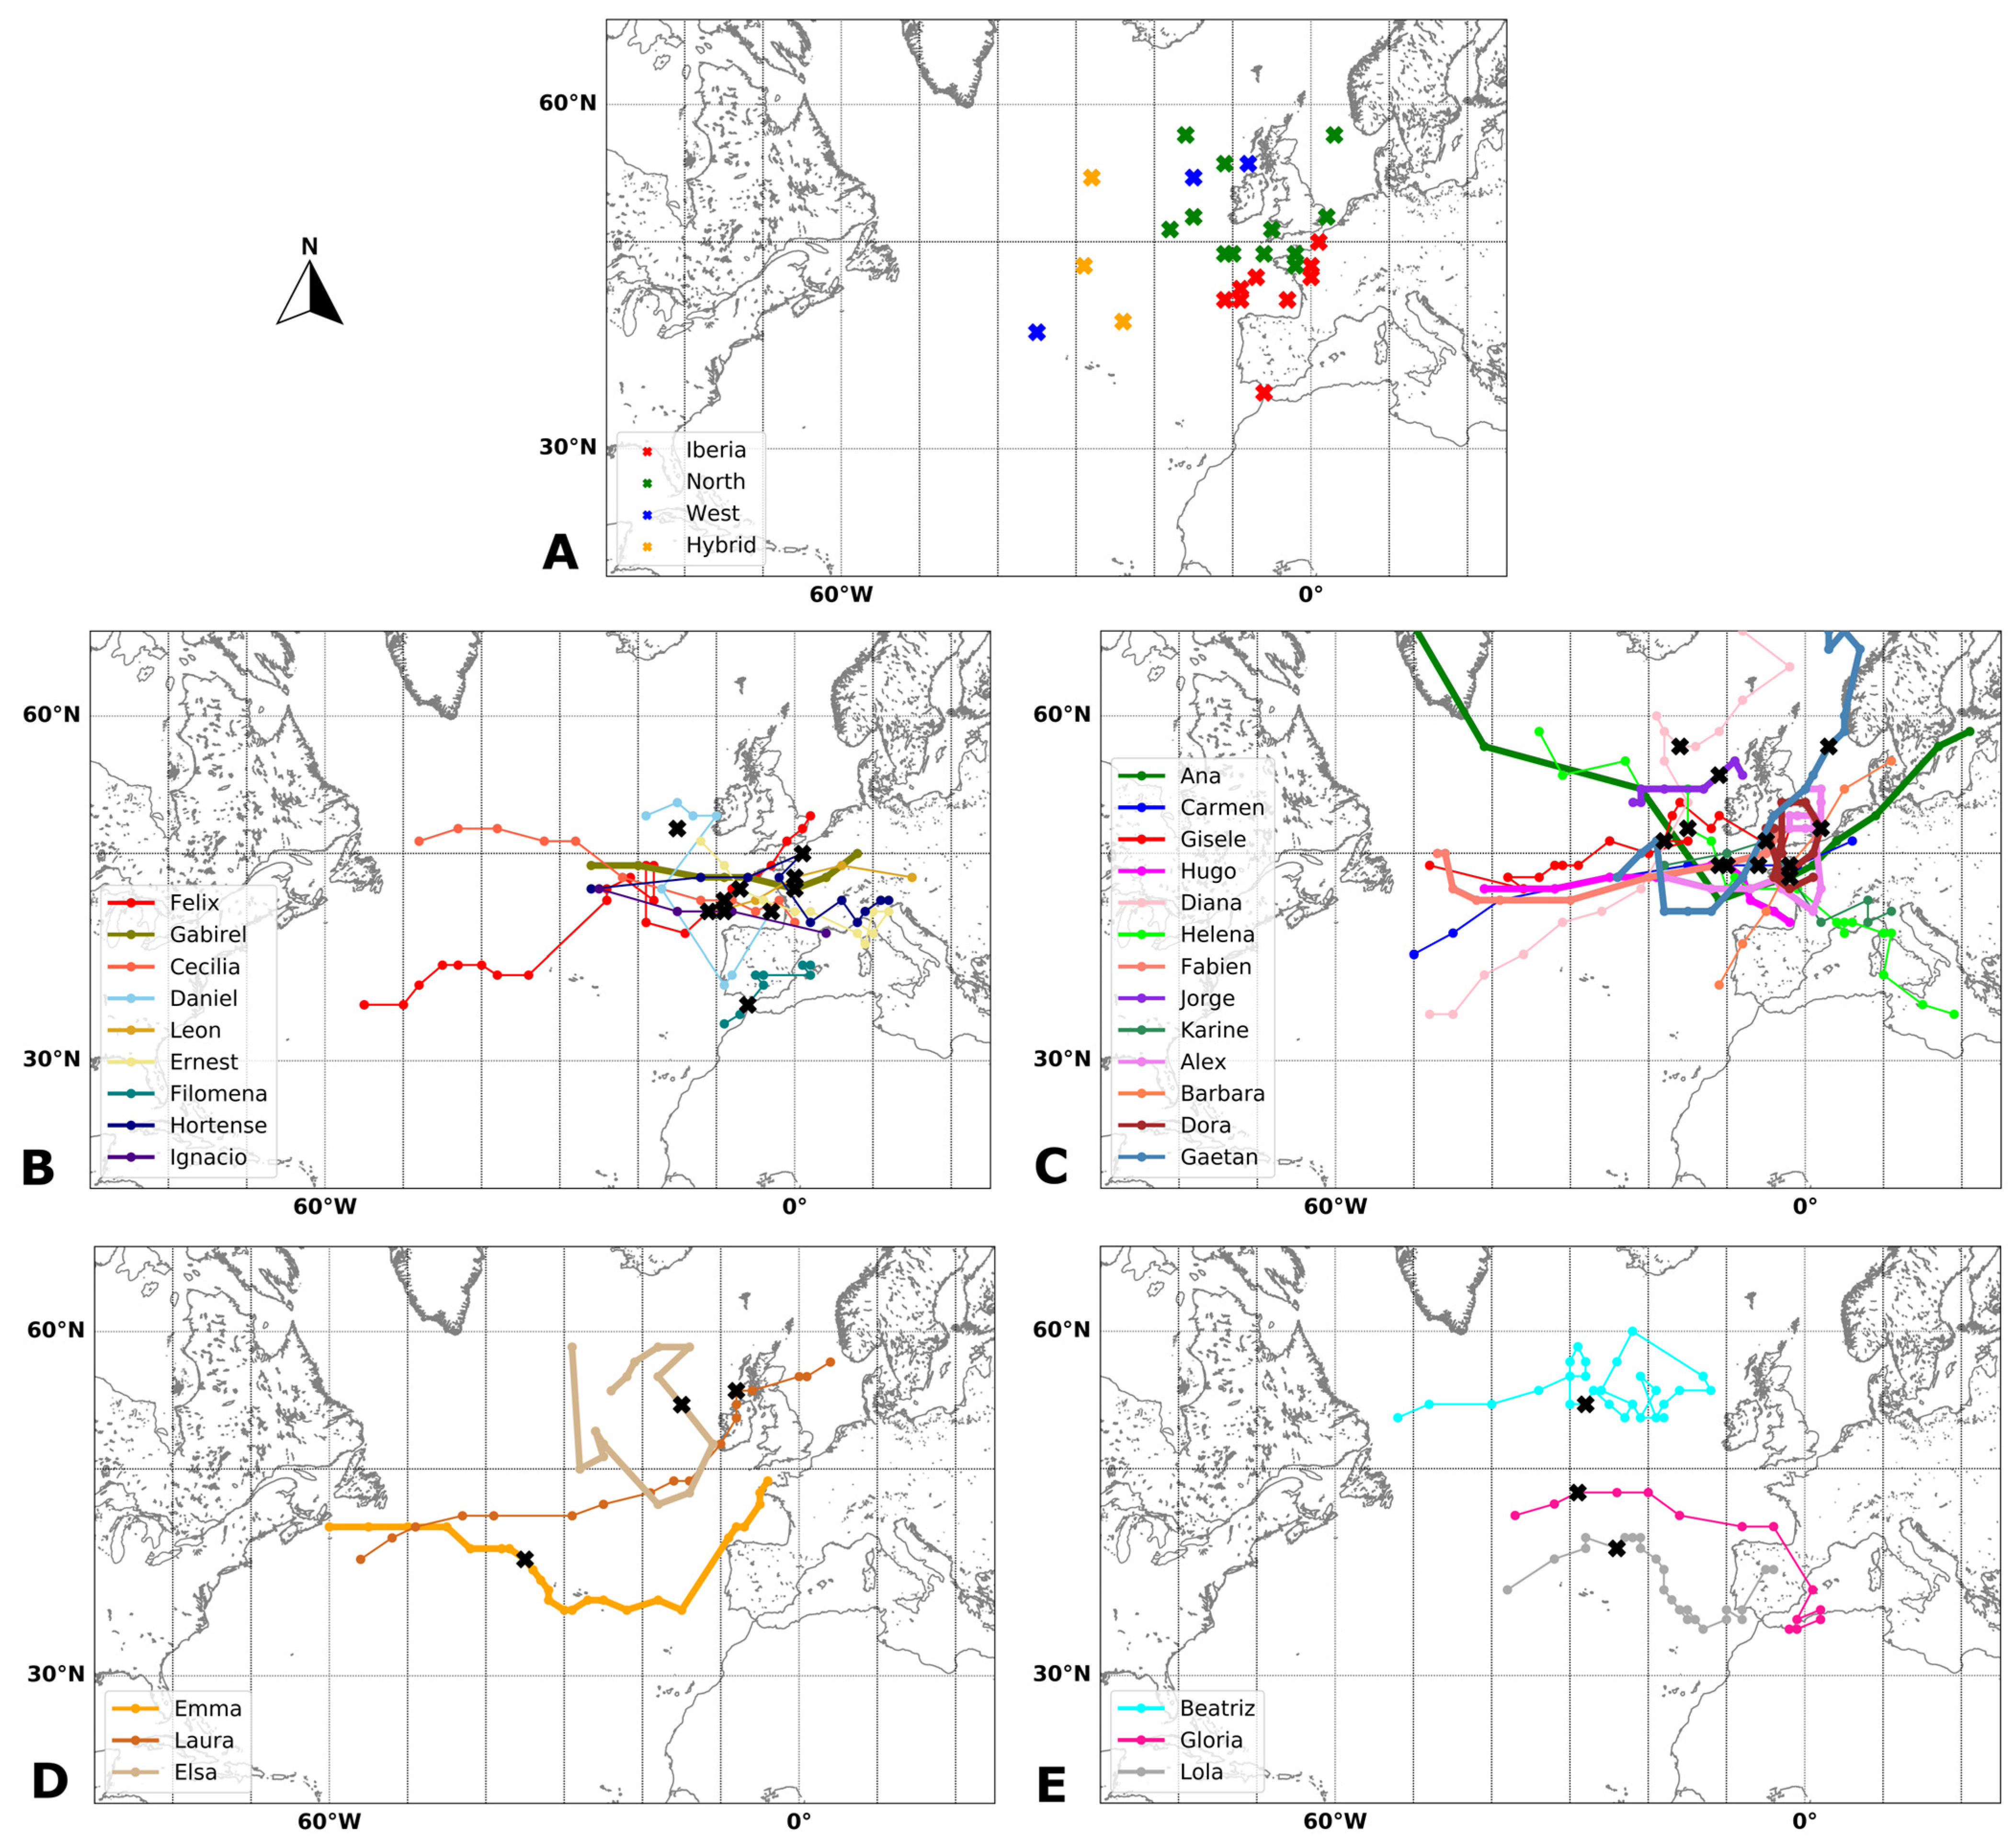
3.1. Characterization of the High-Impact Storms during Extended Winters 2018–2021

Of the forty-nine high-impact storms named and identified by the meteorological institutes of the Southwest European Group (SW Group), twenty-eight of them caused severe impacts on the IP, due to heavy precipitation and/or strong winds. Table 1 records the names of the storms that caused severe impacts on the IP during the four extended winters of 2018–2021, showing the date, position, and the instant of maximum intensity (defined as the instant when the EC reaches the minimum central pressure). In addition, it is worth noting that ten out of the twenty-eight high-impact storms have explosive cyclogenesis (marked with an asterisk in Table 1).
Concerning meteorological impacts (for details, see Section 2 and Section 4.2), high-impact storms are characterized by windstorms (W), wind and precipitation (W + P) storms, and precipitation storms (P), according to the values being higher than the 98th percentile of each variable (Table 1), in at least one grid point in the domain considered during the storm days. Most of the events (25 storms out of 28) that hit the IP are found to be accompanied by high precipitation values and strong winds (W + P), that is, extreme compound events. Only two of them are W storms, and two events are classified as P storms.
To identify the events with explosive development, the deepening rates of the core pressure for 24 h were analyzed for each storm and then geostrophically adjusted to the reference latitude of 60° N (see Equation (1)) and classified according to Sanders [77] (Equation (2)), and to Zhang et al. [78] (Equation (3)). The results are presented in Table S1 (see Supplementary Material). According to the classification of Sanders and Gyakum [75] and Sanders [77], all events with explosive development are considered “weak”. However, differences were found in the classification according to Zhang et al. [78], which are explained in each extended winter analyzed.
In the extended winter of 2017–2018, out of three events with explosive development, two are considered “strong” (Ana, DR = 1.74; and Hugo, DR = 2.28). In the extended 2018–2019 winter, the only event with explosive development is classified as “moderate” (Gabriel, DR = 1.43). In the extended winter of 2019–2020 in the IP, three storms presented explosive development and two of them are classified “moderate” with a DR of 1.59 (Fabien) and 1.38 (Jorge). During the last extended winter considered, 2020–2021, three storms had explosive development, with one being classified as “strong” (Alex, DR = 2.16) and another as “moderate” (Dora, DR = 1.46).
The definition of EC given by Sanders and Gyakum [75] was revised to be a cyclone whose central SLP decrease normalized at 45ºN is greater than 12 hPa within 12 h, and thus, the 12 h SLP change was used to find an instance of the most rapid deepening in a cyclone’s life. Thus, the results suggest that the modified definition is suitable to describe more detailed processes of the rapid deepening of ECs because the longer period for pressure dropping in Sanders and Gyakum [75] potentially smooths out the rapid development of ECs [78]. This is confirmed by the number of events classified as “moderate” and “strong”, instead of the 10 events classified as “weak” according to Sanders and Gyakum [75] and Sanders [77]. In addition, this analysis was made for the 28 events; however, the 10 events considered with explosive development according to Sanders and Gyakum [75] remain the same according to the classification of Zhang et al. [78].
Figure 1 shows the tracks and evolution of central pressure over the lifetime of the twenty-eight high-impact storms.
In the left panel (tracks), it can be observed that the storms started their development over the North Atlantic Ocean, moving towards Europe, where they mostly affected the north of the IP and the British Islands. The instants of maximum intensity of each storm are marked with an “X”, which allows us to verify the intensity of storms over the IP, British Islands, and northern France. The right panel shows the evolution of central pressure over the lifetime of the storms, where it is possible to easily observe events with explosive development (Table 1 and Table S1—Supplementary Material) through the more accentuated lines, for example, the storm Ana, Emma, Gabriel, Jorge and Gaetan, where the slope is very visible.
In addition, these events were classified according to their trajectories following the Karremann et al. [72] criteria for windstorms (see Section 2.1) as presented in Figure 2. In this way, of the twenty-eight storms, nine were classified as Iberia, thirteen as North, three storms as West, and another three as Hybrid.
Figure 2A presents the position of each storm in the instant of maximum intensity for the different groups, where it is possible to observe that most of the events reach this instant in the region of the IP (over the IP and south of the British Islands). Therefore, the events of the Iberia (Figure 2B) and North (Figure 2C) groups were the most impactful in the IP. Hybrid events (Figure 2E) present a different variety of tracks, and they are not clear as the other groups, because this group is primarily characterized by a strong large-scale pressure gradient over Iberia due to the juxtaposition of a low and a high-pressure center [72]. Some of these events reached the minimum pressure still far from the Iberian coast, over the ocean, as is the case of storm Emma (West group), Beatriz, Gloria, and Lola (Hybrid group), as shown in Figure 2D,E. Moreover, the mean values of minimum core pressure for the groups are as follows: Iberia = 986.56 hPa; North = 967.31 hPa; West = 967.33 hPa; Hybrid = 976 hPa. For the North group, the results show that the considered events are more intense (967.31 hPa) than those (976 ± 13.1 hPa) analyzed by Karreman et al. [72], in which of the thirteen considered in this group, seven presented explosive development. In the same way, the mean minimum pressure value for the Hybrid group (976 hPa) of under-study events is lower than those considered in the mentioned work (983 ± 15.8 hPa). On the other hand, the values obtained for the Iberia (986.56 hPa) and West (967.33 hPa) groups were higher than those obtained by Karreman et al. [72] (Iberia = 983 ± 9.31 hPa and West = 966 ± 13.3 hPa). Although there were few events, it is possible to verify that these presented very low minimum pressure values.
Hence, further study is essential due to the significant number, intensity, and severe impacts of all twenty-eight storms observed during the four consecutive extended winters.

3.2. Lifecycle Characteristics of the High-Impact Storms

Figure 3 presents the statistics of the lifecycle characteristics of high-impact storms: the distributions by intensity (minimum central pressure), lifetime, monthly distribution, and deepening rate classification by Zhang et al. [78] (see Section 2.1).
In general, all identified events (28 high-impact storms) present a wide range of values of minimum pressure reached in the instant of maximum intensity, between 955 hPa and 985 hPa (Figure 3A); in the lowest value ranges (the most intense storms) are those events with explosive development (10 events). Concerning the duration of high-impact storms, 70% of the events had a lifetime of between two to four days (Figure 3B); the same pattern occurred for the events with explosive development. However, four events with a minimum lifetime of one day and four events with a maximum duration of six to eight days were also identified, and one of them underwent explosive development.
Regarding the temporal variability of the events (Figure 3C), the monthly distribution of occurrence shows that January is the month in which the most storms occurred (8 events), followed by December and March (each month with 6 events). For the events with explosive development, the maximum occurred in December (4 events), followed by January and February (2 events, each month).
Figure 3D presents the deepening rate (in Bergeron) classification of the events with explosive development, and three of them are considered weak events (1.00–1.29 Bergeron), four are considered moderate events (1.30–1.69 Bergeron), and the other three are classified as strong events (1.70–2.29 Bergeron). This classification further reinforces the fact that these events were impactful.

4. Synoptic Analysis

4.1. Case Study Analysis

To investigate the synoptic conditions, a case study was chosen (storm Ana, see Table 1 and Table S1) and the analysis was made for different meteorological variables (MSLP, θe at 850 hPa, IVT, wind speed at 250 hPa, QE, QH, QN, and SST) in different states of their development—the instant of maximum intensity (minimum pressure), as well as minus 12 h before and minus 24 h before of the instant of maximum intensity. Storm Ana was the first named high-impact storm in December 2017. This storm formed in the center of the North Atlantic on 10 December 2017, and on 12 December 2017, it moved quickly toward northern Europe until it disappeared [86,87]. It showed explosive development and is classified as “strong” by Zhang et al. [78] (See Table 1 and Table S1, Supplementary Material).
This analysis is shown in Figure 4 (first column (Figure 4A,D,G,J,M,P)—24 h; second column—12 h (Figure 4B,E,H,K,N,Q); third column (Figure 4C,F,I,L,O,R), 0 h—the instant of maximum intensity).
Storm Ana appears as a very intense extratropical and complex system centered on the Bay of Biscay and affecting the northeast Atlantic, British Islands, IP, France, and the Mediterranean Sea. This system reached its maximum intensity at 06 UTC on 11 December 2017, with a minimum pressure of 958 hPa and with its pressure center located on the Bay of Biscay (48° N, −2° E), as shown in Figure 4C by the MSLP field, and the storm track in Figure 1.
The θe at 850 hPa is presented in Figure 4A–C, where the marked latitudinal gradient from 5 °C at northern latitudes is observed, and reaches the highest values over tropical regions (Gulf of Mexico) up to 70 °C. Around the IP, the values range between 25 °C and up to 50 °C at the instants of 24 and 12 h before the instant of maximum intensity. So, this event is accompanied by high values of θe at 850 hPa at unusually high latitudes up to 60° N, corresponding to a warm, moist air mass that travels north and acts as a source of energy, intensifying the storm’s development. These values confirmed the influence of moisture content and latent heat on the development and intensification of the studied storms.
Figure 4D–F show the field of the wind speed at 250 hPa for the three analyzed instants, where the jet stream position is observed, meandering over the North Atlantic and heading towards the IP, with strong winds up to 90 ms−1 at 12 h before the instant of maximum intensity (Figure 4E). IVT values (Figure 4G–I) allow us to identify the water vapor/moisture associated with this high-impact storm. The highest values are centered on the Atlantic Ocean, the Azores region, and the IP coast, where the values reached more than 1200 kg m−1s−1 (Figure 4H), 12 h before the instant of maximum intensity. The high IVT values associated with this event can explain the episodes of heavy precipitation and consequent flooding on the days of the storm passage.
The SST values are presented in Figure 4J–L, where the North Atlantic shows the highest values over tropical regions (Gulf of Mexico and Caribbean Sea) with a maximum of 29.2 °C, and near the IP, the values ranged from 10 °C in northern regions to 20 °C in southern regions.
Heat fluxes (QE, QH, QN) were used to evaluate the heat exchange between the ocean and atmosphere associated with the impactful storms. The QE analysis (Figure 4M–O) strongly presents negative values of up to—680 W m−2 (−12 h; Figure 4N) in the region where the pressure system is located. At the instant of maximum intensity (Figure 4O), the QE values around the system center (the IP and the southwest of the British Islands) are strongly negative (more than −520 W m−2), showing the latent heat exchange between the ocean and the atmosphere (energy supplied by the ocean to the storm).
Also noteworthy are the high QE values over the Atlantic Ocean, particularly in the Caribbean region and the Gulf of Mexico, with maximums reaching −838 W m−2 and 278 W m−2 (−24 h; Figure 4M).
At the same time, the QH field was also analyzed, and we obtained the same pattern with values that reached more than −175 W m−2 in the region of the system pressure (Figure 4Q,R). The maximum values concern the east coast of the United States of America, with −351 W m−2 and 265 W m−2 (Figure 4P). As the QH is related to sensible heat exchanges with the surface, the region of Europe affected by high-impact storms has positive values up to 35 W m−2 (Figure 4Q,R).
Moreover, the QN analysis of the event (shown in Supplementary Material Figure S1) presents the same pattern of QE and QH with negative values of up to −810 W m−2 in the region of the low-pressure system (Figure S1B,C). These results represent the heat fluxes between the ocean and atmosphere at those times when the ocean provided energy to the atmosphere, thus fueling storm development. So, it is verified that in the region where the center of pressure was located, the values of the fluxes (QE, QH, and QN) between the ocean and the atmosphere are higher (more negative), showing heat exchanges and the influence of the ocean on storm development. In addition, these fluxes are also influenced by factors such as wind speed, moisture, and temperature differences between the surface and the lower atmosphere, as was observed in the remaining parameters analyzed.
By analyzing the meteorological fields in these three different instants, it is possible to verify that despite the minimum pressure (instant of maximum intensity) having occurred on 11 December at 06 UTC, the storm presented higher values of wind and humidity to reach the region of Iberia in the 12 h before (12 December 2017 at 18 UTC).
The combination of all the above parameters over the IP region contributed to and allow for the justification of the heavy precipitation and strong winds that caused extensive damage during the passage of these extratropical storms over Iberia.

4.2. Concurrent Extreme Events Analysis

To assess and understand whether the values of moisture/water vapor and wind speed were extreme, the value of the 98th percentiles, at each grid point, of daily accumulated precipitation, wind speed at 10 m, and instantaneous wind gust (i10fg) at 10 m were calculated for the reference period 1991–2020 and the months in analysis (Figure 5), and they were compared with the values obtained from the same variables on the days of greatest impact of storms (Figure 6).
Figure 5A shows the 98th percentile values of daily accumulated precipitation with a maximum value of 53.80 mm day−1 in the northwest region (NW) of the IP. For the i10fg (Figure 5B), the maximum value was reached again in the NW IP (29.40 m s−1), the Pyrenees, and the Mediterranean coast. The wind speed at 10 m (Figure 5C) presents the highest percentile values on the NW and west coast of the IP, as well as the east coast (in the Mediterranean), with a maximum value of 20.05 m s−1.
Out of a total of ninety-four days of storm, the percentage of days in which the variables were greater than the 98th percentile values are shown in Figure 6, with the NW region of the IP presenting the higher percentage, and therefore, it is the area most affected by the storms under study. Figure 6A shows that in the NW of the IP, for 34.1% of the days of storms, the value of daily accumulated precipitation was higher than the 98th percentile, ranging from 30 to 54 mm day−1 (Figure 5A). For the i10fg (Figure 6B), it is verified that 45.7% of the storm days’ values were higher than the 98th percentile in the NW IP. For that region, the values of the 98th percentile range from 22 to 28 m s−1 (Figure 5B). Figure 6C indicates that in 46.8% of the storm days (maximum), the value of wind speed at 10 m was higher than the values of the 98th percentile, on the NW coast of the IP. Figure 5C shows that in this region, the values of the 98th percentile range from 10 m s−1 (onshore) to 22 m s−1 (offshore).
For the concurrent events (W + P)—daily accumulated precipitation and the i10fg (Figure 6D)—it is verified that in 28.7% of the storm days, the obtained values were higher than the 98th percentile values. Figure 6E shows the analysis of concurrent events—daily accumulated precipitation and wind speed at 10 m—in which for 25.5% of storm days, the values were higher than the 98th percentile values.

4.3. Climatological Analysis

This section presents the climatology for MSLP, IVT, ϴe at 850 hPa, wind speed at 250 hPa, and SST for the period of reference 1991–2020 and the respective anomalies of the twenty-eight storms composite. The climatology of MSLP (Figure 7A) presents the typical MSLP pattern, with low pressures in the north and high pressures in the south, including the Azores region and the IP. This observation confirms the known fact that low-pressure systems, such as ECs, commonly occur or reach the northern region of the British Islands. However, when we analyze the anomalies of MSLP for the composites of the twenty-eight events (Figure 7B), it is observed that the IP was under the influence of low-pressure systems centered over the British Isles, with values that range between −4 hPa to −12 hPa. The lowest mean values reached −21.6 hPa (Figure 7B) in the British Isles and the Scandinavia region. On the coast of North America, there is a minimum that is related to the low-pressure systems that are verified in that place on the same days that the northeastern coast of the Atlantic is affected by the studied ECs. The MSLP analysis results confirm the intensity of the four winter events, and those ECs that reached the IP and Southwest Europe in the last four winters were very intense, with a minimum value of pressure reaching too low, as also shown in Figure 1 and Figure 2.
Regarding moisture transport, the IVT climatology (Figure 7C) presents a long strip of the coast of North America, from the region of Florida to the east and the north of the Atlantic, with an inclination to the northeast. Moreover, the highest values are near the east coast of North America (ranging from 80 to 200 kg m−1s−1). The region of the IP and the British Isles has lower values up to 80 kgm−1s−1. When we analyzed the results of the anomalies (Figure 7D), we immediately verified that there was a large transport of water vapor associated with these storms. The storms that occurred in the winters of 2018–2021 show positive anomalies with very high values (up to 320 kg m−1s−1), which appear on the Atlantic Ocean, the Azores Islands, all of the coast of the IP, and northwest of France. In the IP, France, and the Mediterranean region, the values reached up to 240 kg m−1s−1, but with a major impact in Iberia.
Figure 7E displays the climatology of θe at 850 hPa, which is used to analyze its behavior and impact on storm development. The average θe values range from 20 °C to 40 °C across the IP. The high values, in the order of 50 °C to 60 °C, are observed in the region of the Gulf of Mexico and the Caribbean Sea. In Figure 7F, the anomaly values for the composite of all storms show a strong positive anomaly over the Atlantic Ocean, Europe, and northeast of North America, with values up to 19.1 °C, and there is an exception in the Gulf of Mexico and the Caribbean Sea regions, as well as in the North Pole. Moreover, this analysis shows that all events contained high moisture and latent heat during its development which contributed to its intensification [15,88].
Concerning the jet stream, analyzing the climatology for the 250 hPa wind speed (Figure 7G), it is observed that the highest values occur on the east coast of North America (28 to 44 m s−1). The values in southwest Europe, more specifically in the IP, are of the order of 12 to 20 m s−1. When we calculated the anomalies of the wind speed at 250 hPa of the studied storms (Figure 7H), the results showed a very strong positive anomaly at the west and in the IP, with a maximum of 29.6 m s−1. This strong positive anomaly along the Atlantic Ocean between the east coast of North America and the southwestern region of Europe, which includes the IP, the north of France, the south of the British Isles, and the Mediterranean region—confirms that the storms which reached these regions were very intense with very strong winds, i.e., windstorms. It is also possible to confirm that the jet stream, and then the wind speed, became more intense in lower latitudes, justifying the strong winds that hit the Iberian region in the passage of storms.
Figure 7I presents the climatology of SST, and the average values in the eastern North Atlantic Ocean offshore the IP are in the range of 12 °C in the northern regions to 18 °C in the southern regions. The high values (from 24 °C to 28 °C) are observed in the regions of the Gulf of Mexico and the Caribbean Sea. Concerning the anomaly analysis for the SST composite of the storms (Figure 7J), the results highlight the Gulf Stream, with a positive anomaly with values up to 3.5 °C and extending to 40° W. Additionally, the strong positive anomaly of SST is verified in a large part of the North Atlantic Ocean basin, which extends to 20° W (including the Azores and Madeira archipelagos), limited by the parallels between 30° N and approximately 45° N, with values that range from 2 °C to 0.5 °C. Along the North Atlantic Basin, the anomalies of SST are positive (up to 1 °C) between the Gulf Stream region to the Azores and Madeira archipelago. On the other hand, the values of SST anomalies reached −1 °C on the coast of the IP, the British Isles, France, and the African coast.
Figure 7K presents the climatology of QE where the average values vary between −360 W m−2 and 3.6 W m−2 in the same region of the North Atlantic Ocean, that is, in the regions of the Gulf of Mexico and the East Coast of the United States of America. On the other hand, along the coast of the IP, British Islands, and France, the average QE values are relatively low, varying between −95 W m−2 and −25 W m−2. The anomaly analysis for the QE composite of the 28 storms is presented in Figure 7L, and it reveals a strong negative anomaly with values up to −150 W m−2 in the northwest of the IP and France and southwest of the British Islands. The highest values are presented in the Gulf of Mexico and the East Coast of the United States of America, with −223.2 W m−2.
The QH follows the same pattern as QE, but with lower values. Figure 7M presents the climatology of QH, where the values range from −120.5 W m−2 to 33.9 W m−2 along the East Coast of the United States of America. On the other hand, in the IP region, British Islands, and France, the average QH values are lower, varying between −35 W m−2 and 5 W m−2. Figure 7N shows the anomaly values of the composite of the storms, where a negative anomaly up to −40 W m−2 located to the northwest of the IP and France, and southwest of the British Islands, was observed. In addition, a positive anomaly is verified over the IP and France (up to 40 W m−2). The highest and lowest values are found on the east coast of the United States of America and over the Atlantic Ocean, with values of −117.9 W m−2 and 69.3 W m−2, respectively. The climatology of the QN is present in the Supplementary Material (Figure S2A), where the average values vary between −442 W m−2 and 85 W m−2 in the same region of the North Atlantic Ocean, that is, in the regions of the Gulf of Mexico and the East Coast of the United States of America. On the other hand, along the coast of the IP, the British Islands, and France, the average QN values are relatively low, varying between −75 W m−2 and 25 W m−2 (Figure S2A). The anomaly analysis for the QN composite of the 28 storms is presented in Figure S2B (supplementary material), and it reveals a strong negative anomaly with values up to −350 W m−2 in the regions of the Gulf of Mexico and the East Coast of the United States of America. In addition, it is verified that a negative anomaly is located to the northwest of the IP and France, and southwest of the British Islands, with values that range from −40 W m−2 to −160 W m−2. The anomaly values are linked to the composite of the storms that affected the IP, and so reveal the heat fluxes (QE, QH, QN) between the ocean and the atmosphere, which favor the development of these high-impact storms with explosive development.

5. Discussion

Concerning the high-impact storms that affected the Iberian Peninsula (IP), we found that out of the twenty-eight events, ten of them presented explosive development.
The analysis of the trajectories of the events (Figure 1) and subsequent classification into groups (Figure 2) allowed us to understand their behavior and their intensity over the IP. It is observed that the North and Hybrid groups exhibited lower minimum pressure values compared to the findings of Karremann et al. [72]. Specifically, the North group recorded a mean minimum pressure of 967.31 hPa, while the Hybrid group recorded 976 hPa. In contrast, Karremann et al. [72] reported mean minimum pressure values of 976 ± 13.1 hPa for the North group and 983 ± 15.8 hPa for the Hybrid group. Of the thirteen events belonging to the North group, seven present an explosive development, which justifies the low average value of minimum pressure, and thus high intensity. In addition, it was possible to observe that the events of the North group had reached the maximum intensity along the coast of northern Europe or over the British Islands, becoming more impactful. It is also possible to justify this fact by analyzing anomaly values (Figure 7), where high values of wind speed at 250 hPa, IVT, θe at 850 hPa, QE, QH,, and QN are verified over the Atlantic Ocean (Azores), south of the British Islands and along the coast of the IP and from France.
The variability analysis (Figure 3) allows us to understand how the events studied were characterized by their intensity (minimum pressure value), duration (lifetime), distribution over the winter months, and deepening rate classification by Zhang et al. [78]. So, the results show that the values of minimum pressure (Figure 3A) reached by the events in the study range from 955 hPa and 985 hPa, where ten events with explosive development were identified. Concerning the duration of each high-impact storm (Figure 3B), the results demonstrate that the events had a duration of two to four days of lifetime, including nine events with explosive development. The distribution by month of the occurrence of each high-impact storm (Figure 3C) demonstrates that the month of January is the month in which the most storms occurred (eight events), two of them with explosive development. According to the classification by Zhang et al. [78], out of the 10 events with explosive development, 3 are considered weak, 4 as moderate, and 3 events as strong. This classification reinforces the intensity of the events studied.
The analysis of the conditions of the dynamics of the atmosphere (Figure 4 and Figure 7) permits us to justify its behavior and the impacts associated with strong wind and intense precipitation. Thus, by analyzing the meteorological fields for the case study of storm Ana, we obtained values of θe at 850 hPa up to 50 °C in the IP region, wind speeds at 250 hPa that reached 90 m s−1, IVT with values more than 1200 kg m−1s−1, and SST with values between 10 °C and 20 °C on the coast of Iberia. In the region of the IP and the southwest of the British Islands, the QE values reached −680 W m−2, QH presents values of −175 W m−2 and QN with values up to −810 W m−2.
In addition, when we analyze the anomalies related to the climatology of the 1991–2020 period, it is verified that when considering the instants of maximum intensity of the storms, they presented low MSLP values (up to −21.6 hPa), and high values of water vapor (up to 327.6 kg m−1s−1) and wind speed at 250 hPa (up to 29.6 m s−1) close to Iberia. In addition, the θe at 850 hPa presented values up to more than 19.1 °C over the ocean, Iberia, and throughout Europe. The relative positioning of an extratropical storm and the upper-level jet, which can influence the storm’s direction, is widely recognized as another significant factor in its explosive development [15,89]. In this sense, the high values of wind speed at 250 hPa close to Iberia can clarify the intensity of the events, and the strong winds at the surface. On the other hand, the θe of an air parcel increases with increasing temperature and increasing moisture content. Therefore, the gradient of θe at 850 hPa and the high baroclinicity in the region confirms the maximum availability of latent and sensible heat in the lower troposphere at the instant of maximum intensity of the storms, which supports the contribution of moist diabatic processes in the case of intense storms, such as latent heat release by cloud condensation processes, and in the intensification of the windstorm [13,14,15,71,88,90]. Thus, θe at 850 hPa is often used as an indicator to identify and track these warm and humid air masses [71], in addition, during the occurrence of explosive cyclogenesis, particularly during events like Klaus and Xynthia, extensive areas with θe values exceeding 320 K (46.85 °C) were observed [13,14,88]. So, our results are in line with the literature, in which at times of maximum intensity of the storms, the IP region had high θe at 850 hPa values (up to 50 °C).
The analysis of the net surface heat flux (QN) for the case study indicates negative values up to −810 W m−2 (Supplementary Material, Figure S1) in the IP region (northwest of the IP and southwest of the British Islands). At the same time, the QN anomaly analysis (Figure S2B) presents negative values that range from −40 W m−2 to −160 W m−2 in the IP region. So, it is verified that in the region where the center of pressure was located, the values of the heat fluxes between the ocean and the atmosphere are higher (more negative). Additionally, this indicates the transfer of heat between the ocean and the atmosphere during periods when the ocean supplied energy to the atmosphere, thereby supporting the formation and intensification of high-impact storms. These results follow the findings of Dacre et al. [80], in which heat and moisture exchanges between the ocean and atmosphere in the cold sector behind the cold front of the ECs can lead to ocean cooling for the strongest cyclones.
On the other hand, the negative anomalies of SST (up to −1 °C) on the Iberia coast (Figure 7J), and the results presented for QE, QH, and QN (Figure 4, Figure 7 and Figures S1 and S2) suggest that the ocean temperature contributed to the formation and intensification of storms, indicating a contribution of latent heat and energy to the formation and development of these storms [90,91,92]. Additionally, Zhang et al. [81] show that the surface latent heat flux (QE) has some contributions to the initial development of super explosive cyclones.
Furthermore, the SST and QN results also suggest a cooling of the ocean associated with the passage of ECs, which is caused by the heat exchanges between the ocean and atmosphere. Therefore, the strengthening of the SST gradient and associated increased baroclinicity in the central North Atlantic could be a factor that contributes to the storm track intensification [93].
The concurrent extreme events analysis (Figure 5 and Figure 6) revealed that the values on the days of the storms were considered extreme. That is, in the 94 days considered for the study (28 events), more than 34.1% of the days had daily accumulated precipitation values higher than the 98th percentile (Figure 5), 46.8% of the days had wind speed values at 10 m, and 45.7% of the days had instantaneous gusts of wind at 10 m with values above the 98th percentile. Furthermore, when we analyzed the events together, we found that 25.5 to 28.7% of the storm days occurred simultaneously, with daily accumulated precipitation values and wind speed/instantaneous gust at 10 m with values greater than the value of the 98th percentile. Henin et al. [36] studied extreme meteorological events associated with extreme precipitation and wind and analyzed the IP domain and the main Iberian hydrographic basins. In that study, it is concluded that 85% of the studied events with precipitation and wind extremes at the same time are associated with cyclonic characteristics. In addition, the areas most affected by the simultaneous events of precipitation and wind extremes are in the northwestern sector of the IP. In this sense, our results (Figure 6) agree with those obtained by Henin et al. [36], as the areas affected by precipitation and extreme wind events appear in the same regions and with high percentages, even though the number of cases in our study is smaller (28 storms) and associated only with ECs.
Moreover, the study by Owen et al. [45] has identified extreme precipitation and extreme wind events in the ERA5 reanalysis dataset using a definition of extremes of the 99th percentile. The results show that over Europe, high co-occurrence is found over western coasts and low co-occurrence is found over eastern coasts. In addition, the results show that given an extreme co-occurring event, the chance of a cyclone being within 1110 km is more than 70% for much of Europe. Regions with low co-occurrence have extremes caused by different weather systems and regions with large co-occurrence have both extremes caused by the same weather system. Therefore, cyclones linked to extreme events, particularly co-occurring precipitation, and extreme wind, have larger intensity than those not, and for most of Europe, these cyclones also have faster mean speed. Thus, the obtained results agree too with the study of Owen et al. [45] for our study region, where extreme co-occurring events are more associated with cyclones than non-extreme events, and with more intense development and impacts associated.
In this work, data from ERA5 reanalysis [94] are used, and as such, these have associated errors. Thus, it is considered that the ERA5 reanalysis data have errors in the wind gust field, which according to Brasseur [95] range from 5 m s−1 to 8 m s−1, in the case of events with explosive cyclogenesis. However, we acknowledge that the ERA5 reanalysis data employed in this research are more current and inclusive of recent information. These data are predominantly utilized in climatological analyses and demonstrate a high level of trust in the description of the wind speed pattern [96,97,98,99]. Nevertheless, it remains crucial to consider the possible associated errors. In this sense, we consider that the results obtained for the concurrent extreme events analysis (Section 4.2) are acceptable.
Other studies, such as those conducted by Roberts et al. [18] and Ramos et al. [23], provide valuable resources for understanding these extreme weather events (EWEs) in Europe. The work of Roberts et al. [18] provides storm tracks and wind-gust footprints for 50 severe winter windstorms in Europe between 1979 and 2012, available in the eXtreme WindStorms (XWS) catalog. On the other hand, Ramos et al. [23] developed a database ranking daily precipitation events for the IP from 1950 to 2008, considering factors such as affected area, intensity, and deviation from climatology. These resources are beneficial for academia and the (re)insurance sectors as they enable users to characterize and understand extreme events in Europe, and for evaluating and improving the predictions of weather and climate models [18].
Climate change (CC) studies reveal that extreme precipitation events simultaneously with extremes of wind may increase in the future, that is, moisture transport in the Northeast Atlantic is expected to increase dramatically in future scenarios [26,100], along with an increase in the intensity of cyclone-related fronts affecting Western Europe [1,32]. Hawcroft et al. [101] expect that, by the end of the century, the frequency of extreme ECs—the present-day 99th percentile of precipitation intensity—will significantly increase, and the number of these severely precipitating ECs will more than triple by the end of the century in both Europe and North America. In addition, it is known that CC leads to the occurrence of more frequent and intense EWEs (i.e., changes in weather patterns, temperature, and precipitation), with intense precipitation, strong winds, and snowstorms, or on the other hand severe heatwaves and droughts. These events provoke numerous adverse impacts on ecosystems, people, infrastructures, and related losses, beyond natural climate variability [102,103].
Therefore, studies for future scenarios [1,26,32,100,101] contrast with the older studies [68,69,70,71], where few high-impact and extreme storms are affecting the IP region. The present study also shows that in the extended winters of 2018–2021, there were a high number of events that intensely affected the IP. The high-impact storms, and in particular, the storms with explosive development, presented more intense values of humidity and wind speed (Figure 4), which can justify the strong and numerous impacts associated with their passage, first in the IP and then in the rest of Europe [54,55,56].
Although the climatological analysis reveals changes in the values of the studied variables (Figure 7), it is inconclusive whether these changes are attributable to anthropogenic climate change or simply natural climate variability. Nevertheless, further study of these events over a longer period of historical data will facilitate a more comprehensive investigation of their variability. Additionally, studying CC will enable the assessment of future trends in the frequency and intensity of these events.

6. Conclusions

Extratropical storms are associated with numerous socioeconomic impacts caused by strong winds and heavy precipitation. The region of the Iberian Peninsula (IP) is affected by a few high-impact and extreme storms; however, in the extended winters of 2018–2021 there was a high number of events, and therefore, this work intended to analyze the characteristics of these events.
The main conclusions of this study are:
  • Of the events named since 2017 by the meteorological institutes of the countries of the Southwest European Group (SW Group), twenty-eight had impacts on the IP, and of these events, ten had an explosive development.
  • The storms lasted for a period of two to four days, with January being the month that had the highest frequency of occurrences (Figure 3).
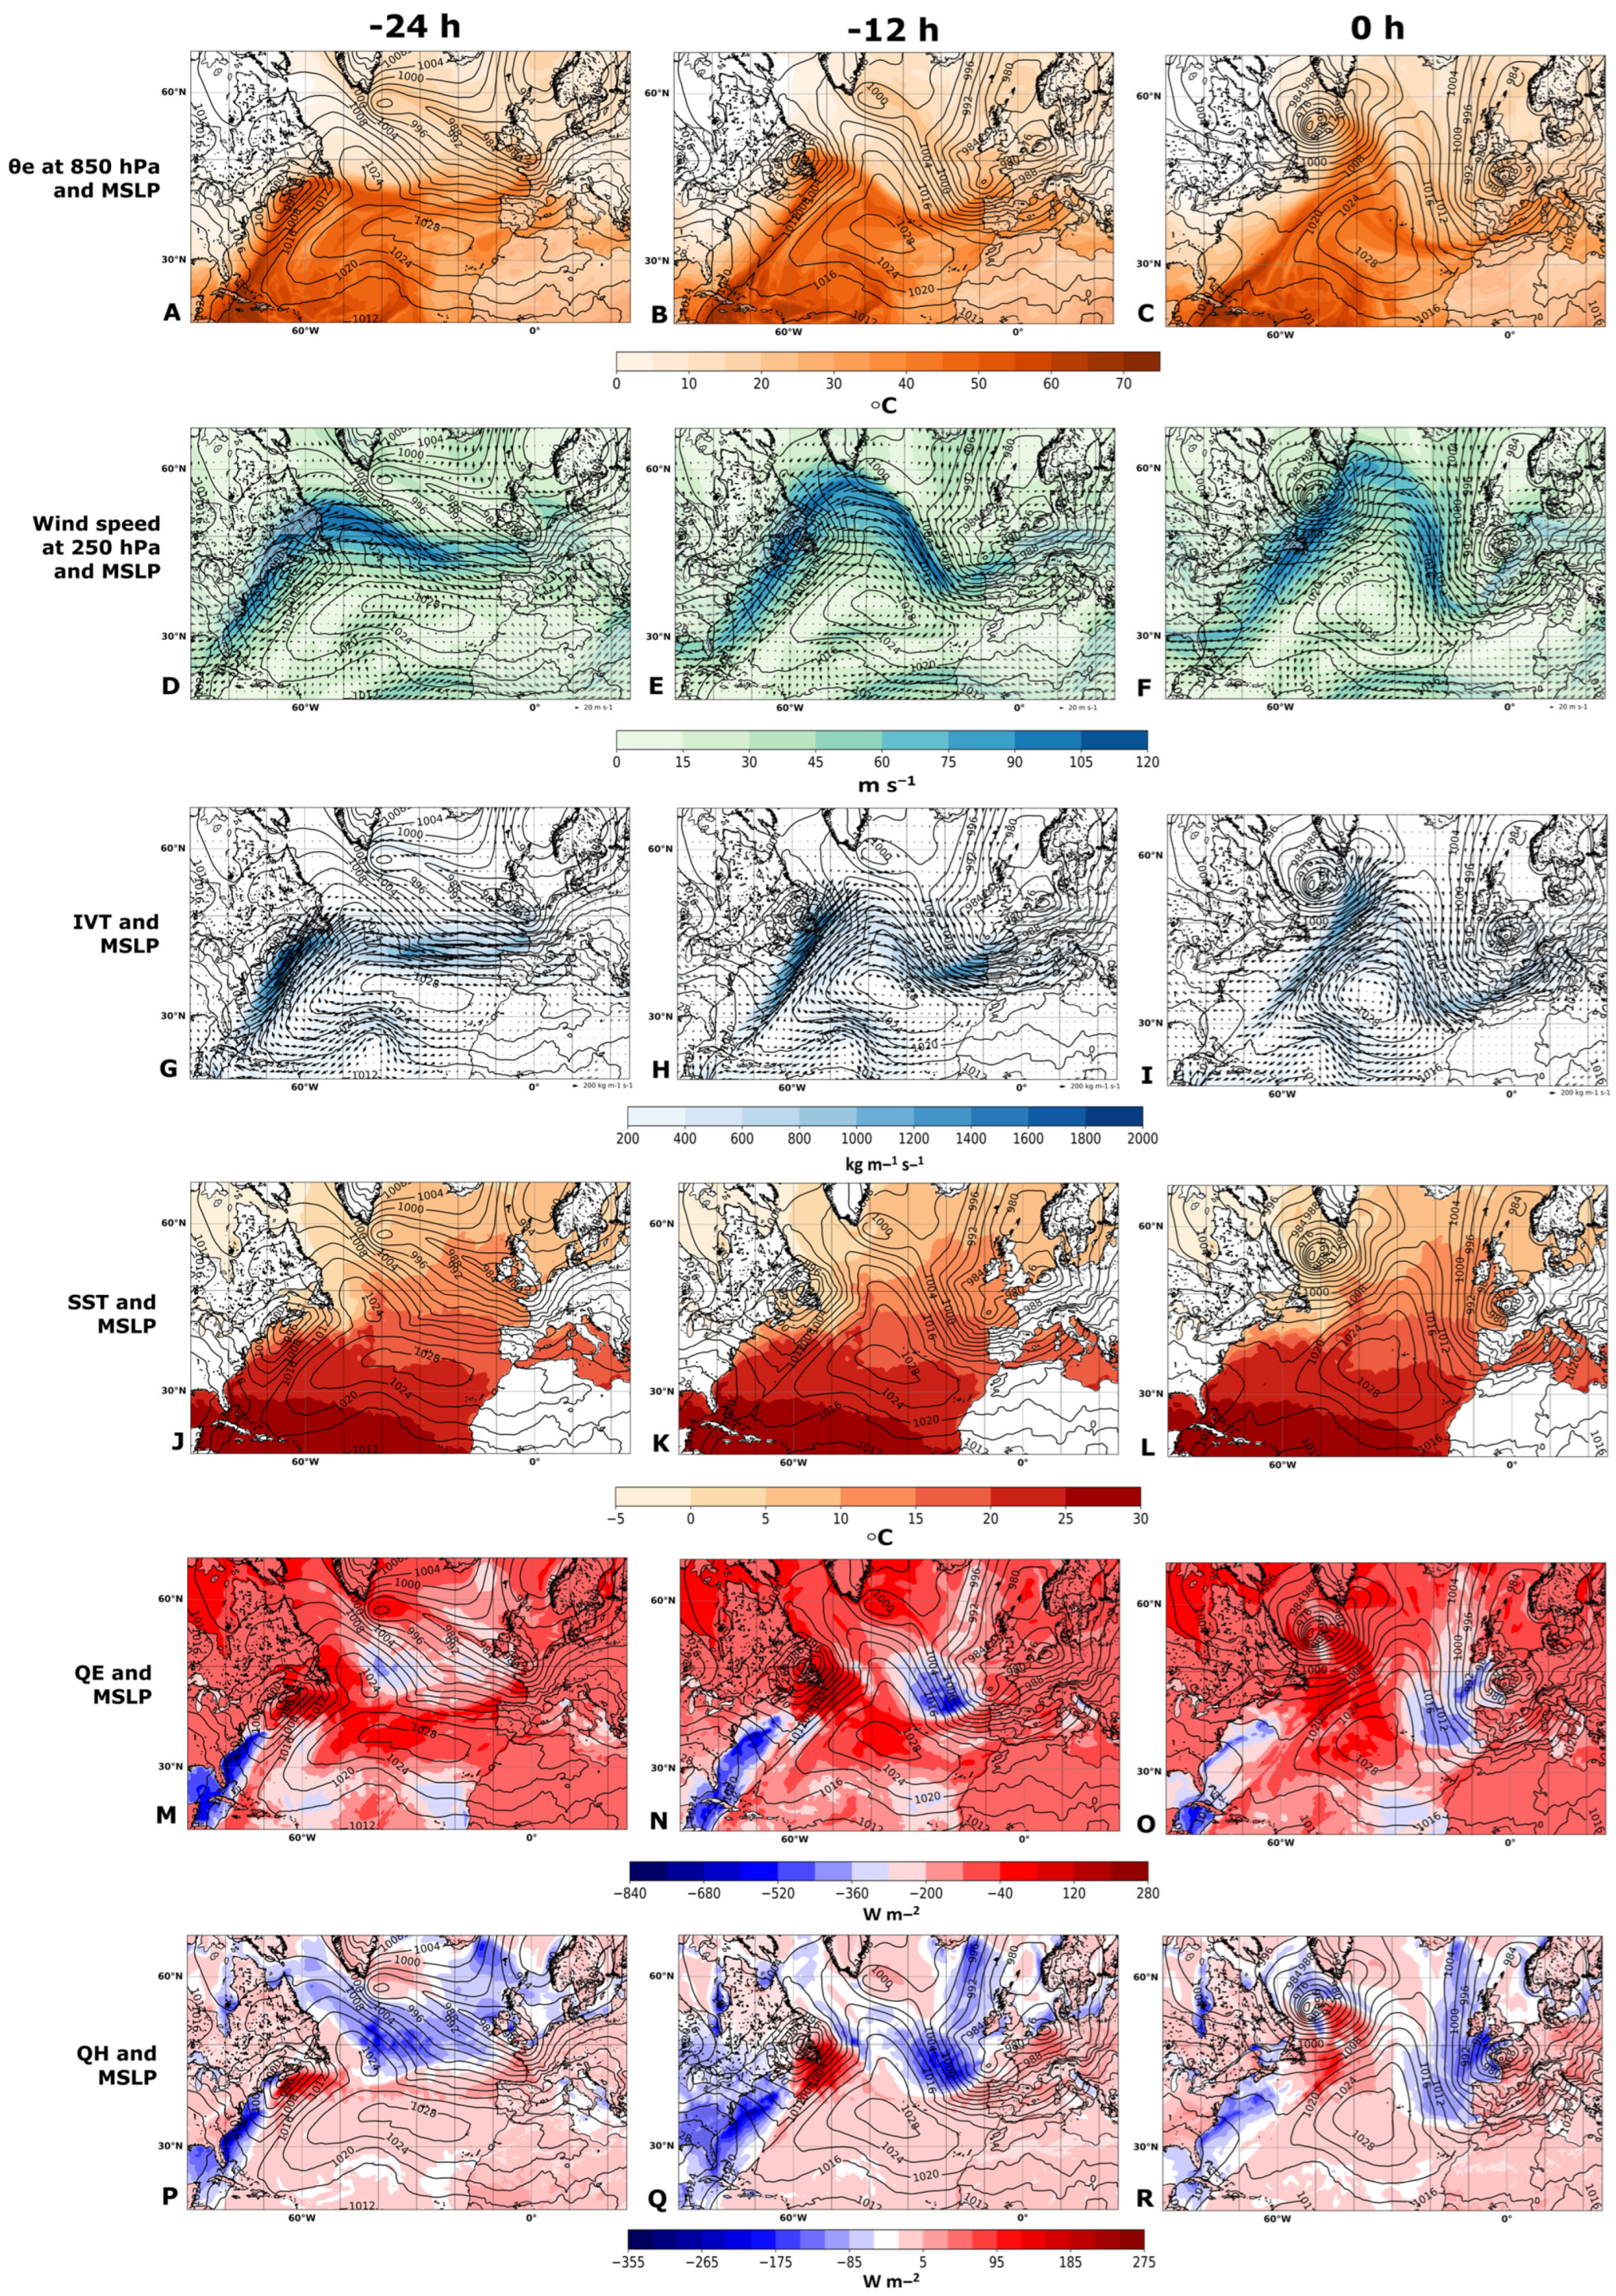
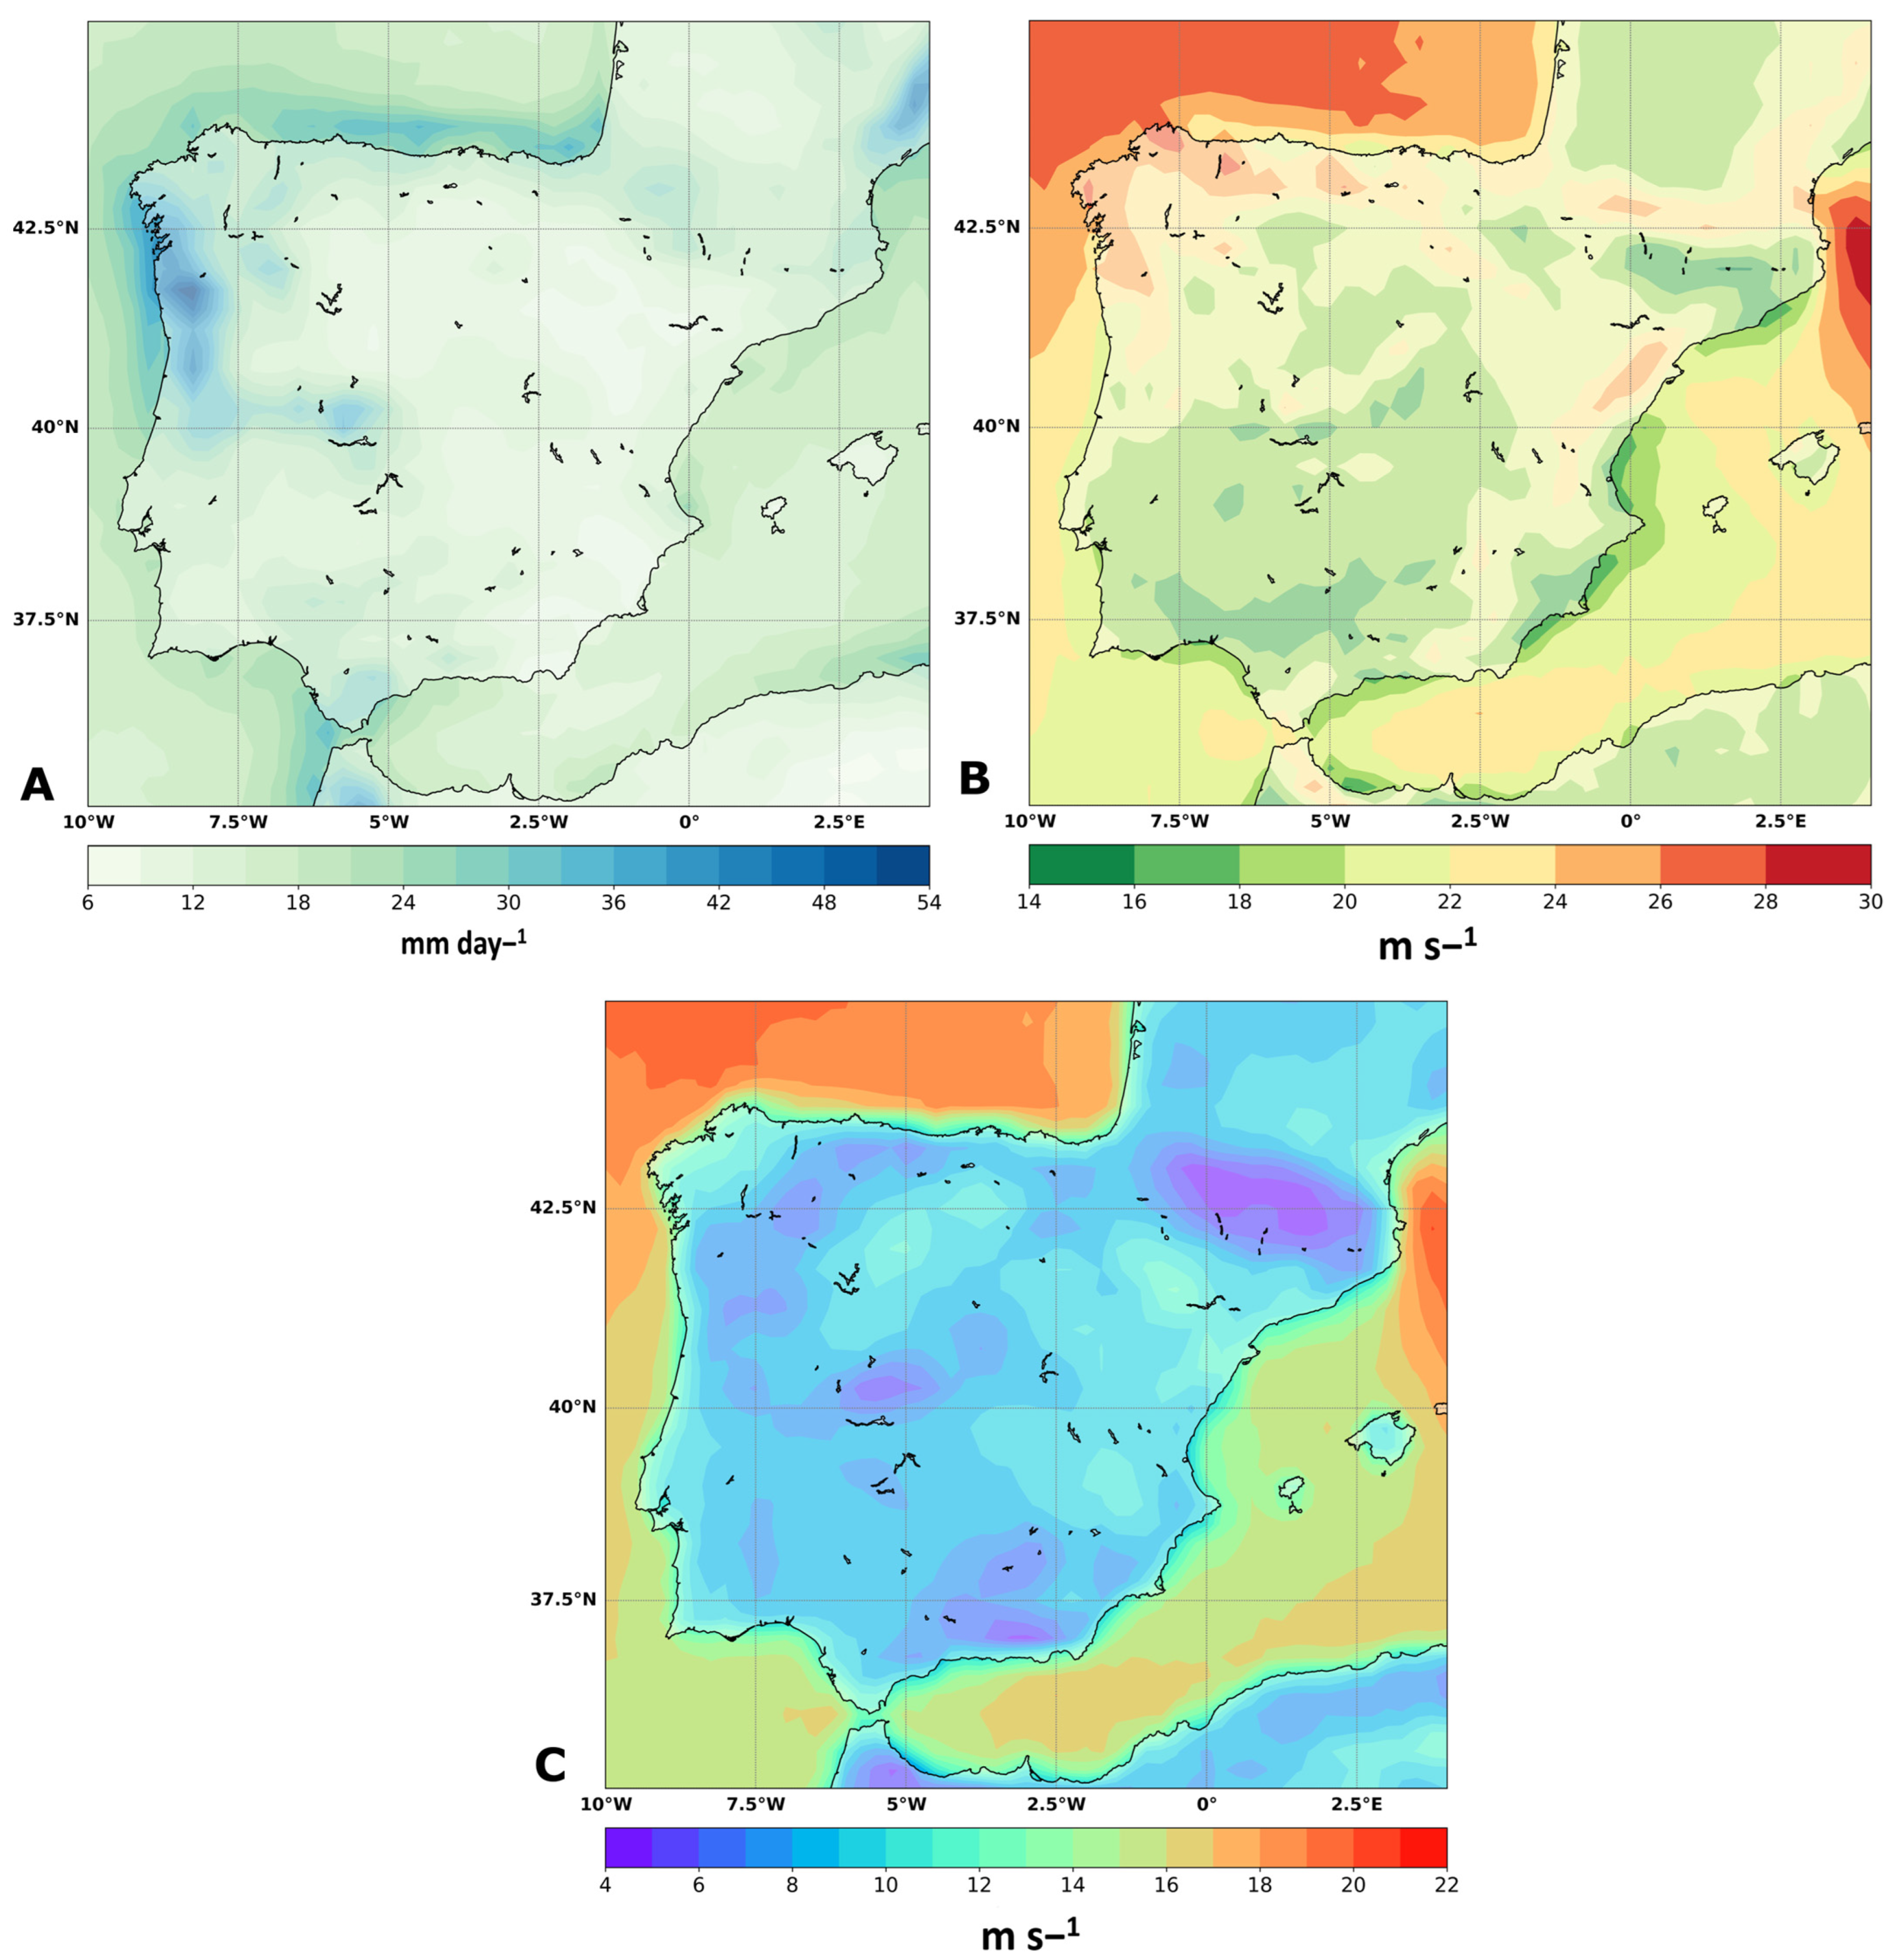
  • For the IP region, the meteorological field analysis for storm Ana (Figure 4 and Figure S1) on the coast of the IP presents values of θe at 850 hPa up to 50 °C, wind speeds at 250 hPa that reach 90 m s−1, IVT with values up to 1200 kg m−1s−1, SST with values between 10 °C and 20 °C, QE values of −680 W m−2, QH values of −175 W m−2, and QN values of −810 W m−2.
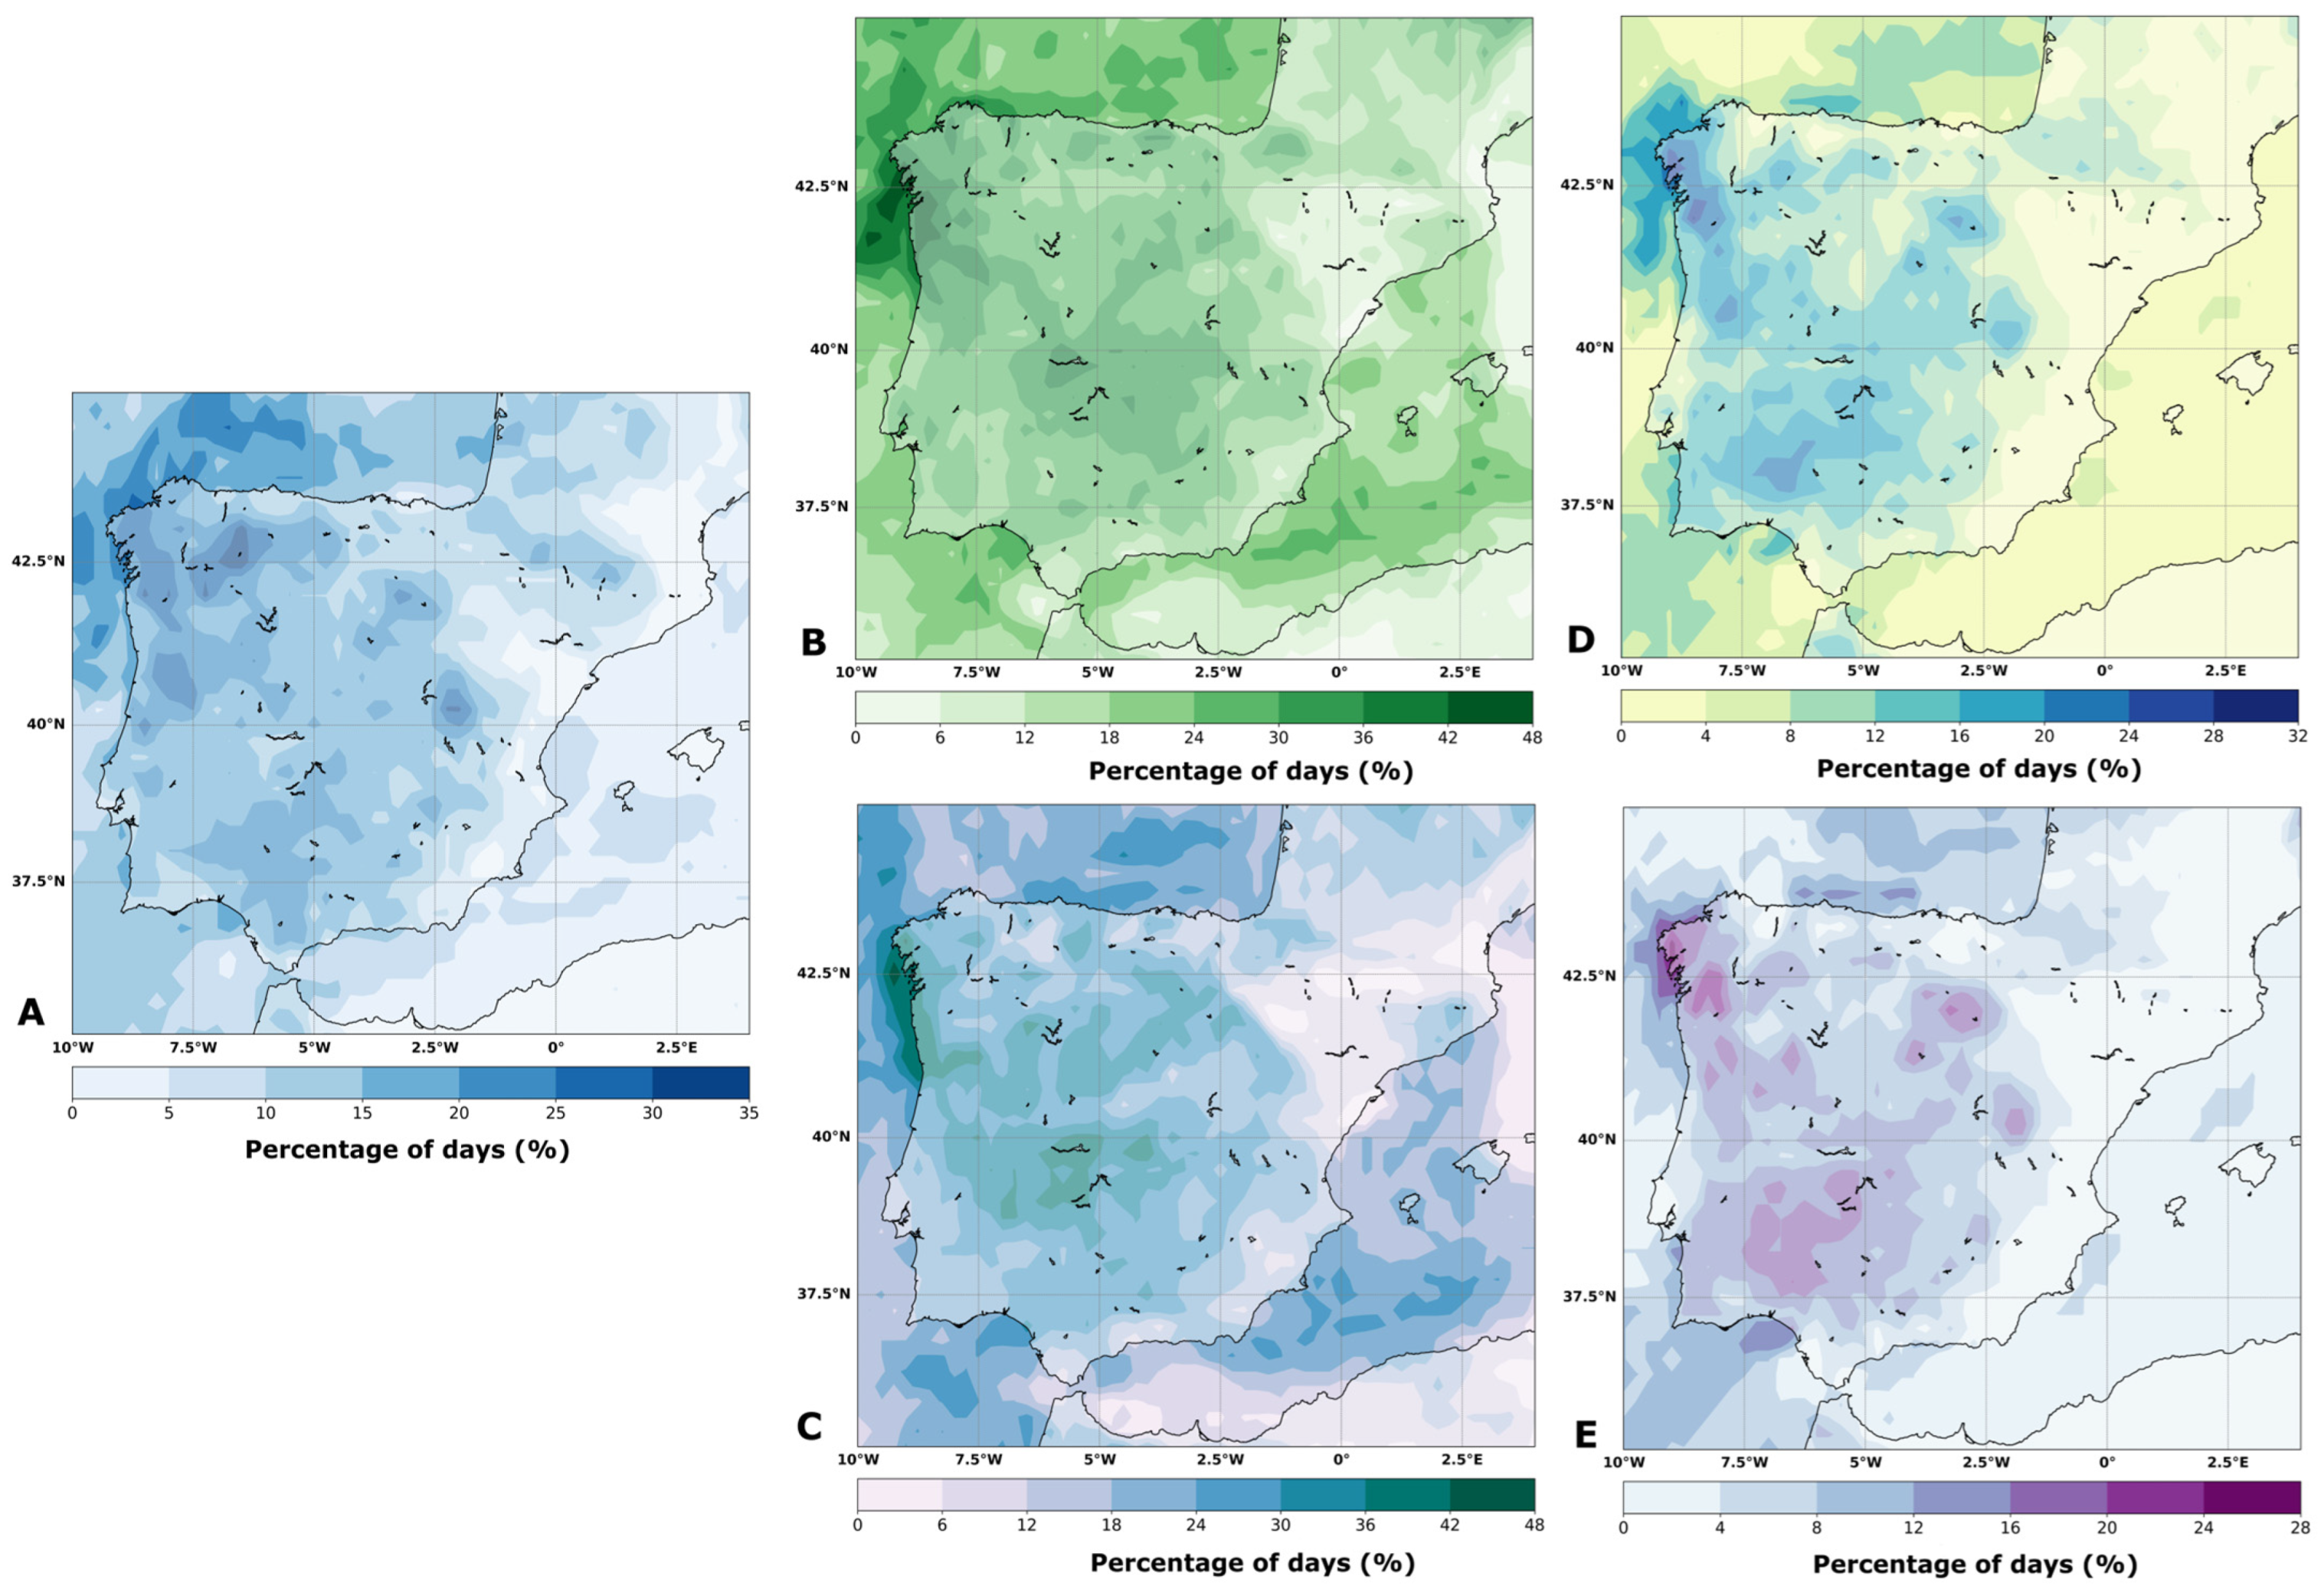
  • The examination of simultaneous extreme events revealed that the recorded values on storm days were classified as extreme (Figure 5 and Figure 6). Specifically, the Northwest region of the IP experienced the most significant impact from these events, where the value of the 98th percentile was higher in 34.1% of storm days for daily accumulated precipitation, in 45.7% of storm days for instantaneous gusts of wind at 10 m, and 46.8% of storm days of wind speed at 10 m.
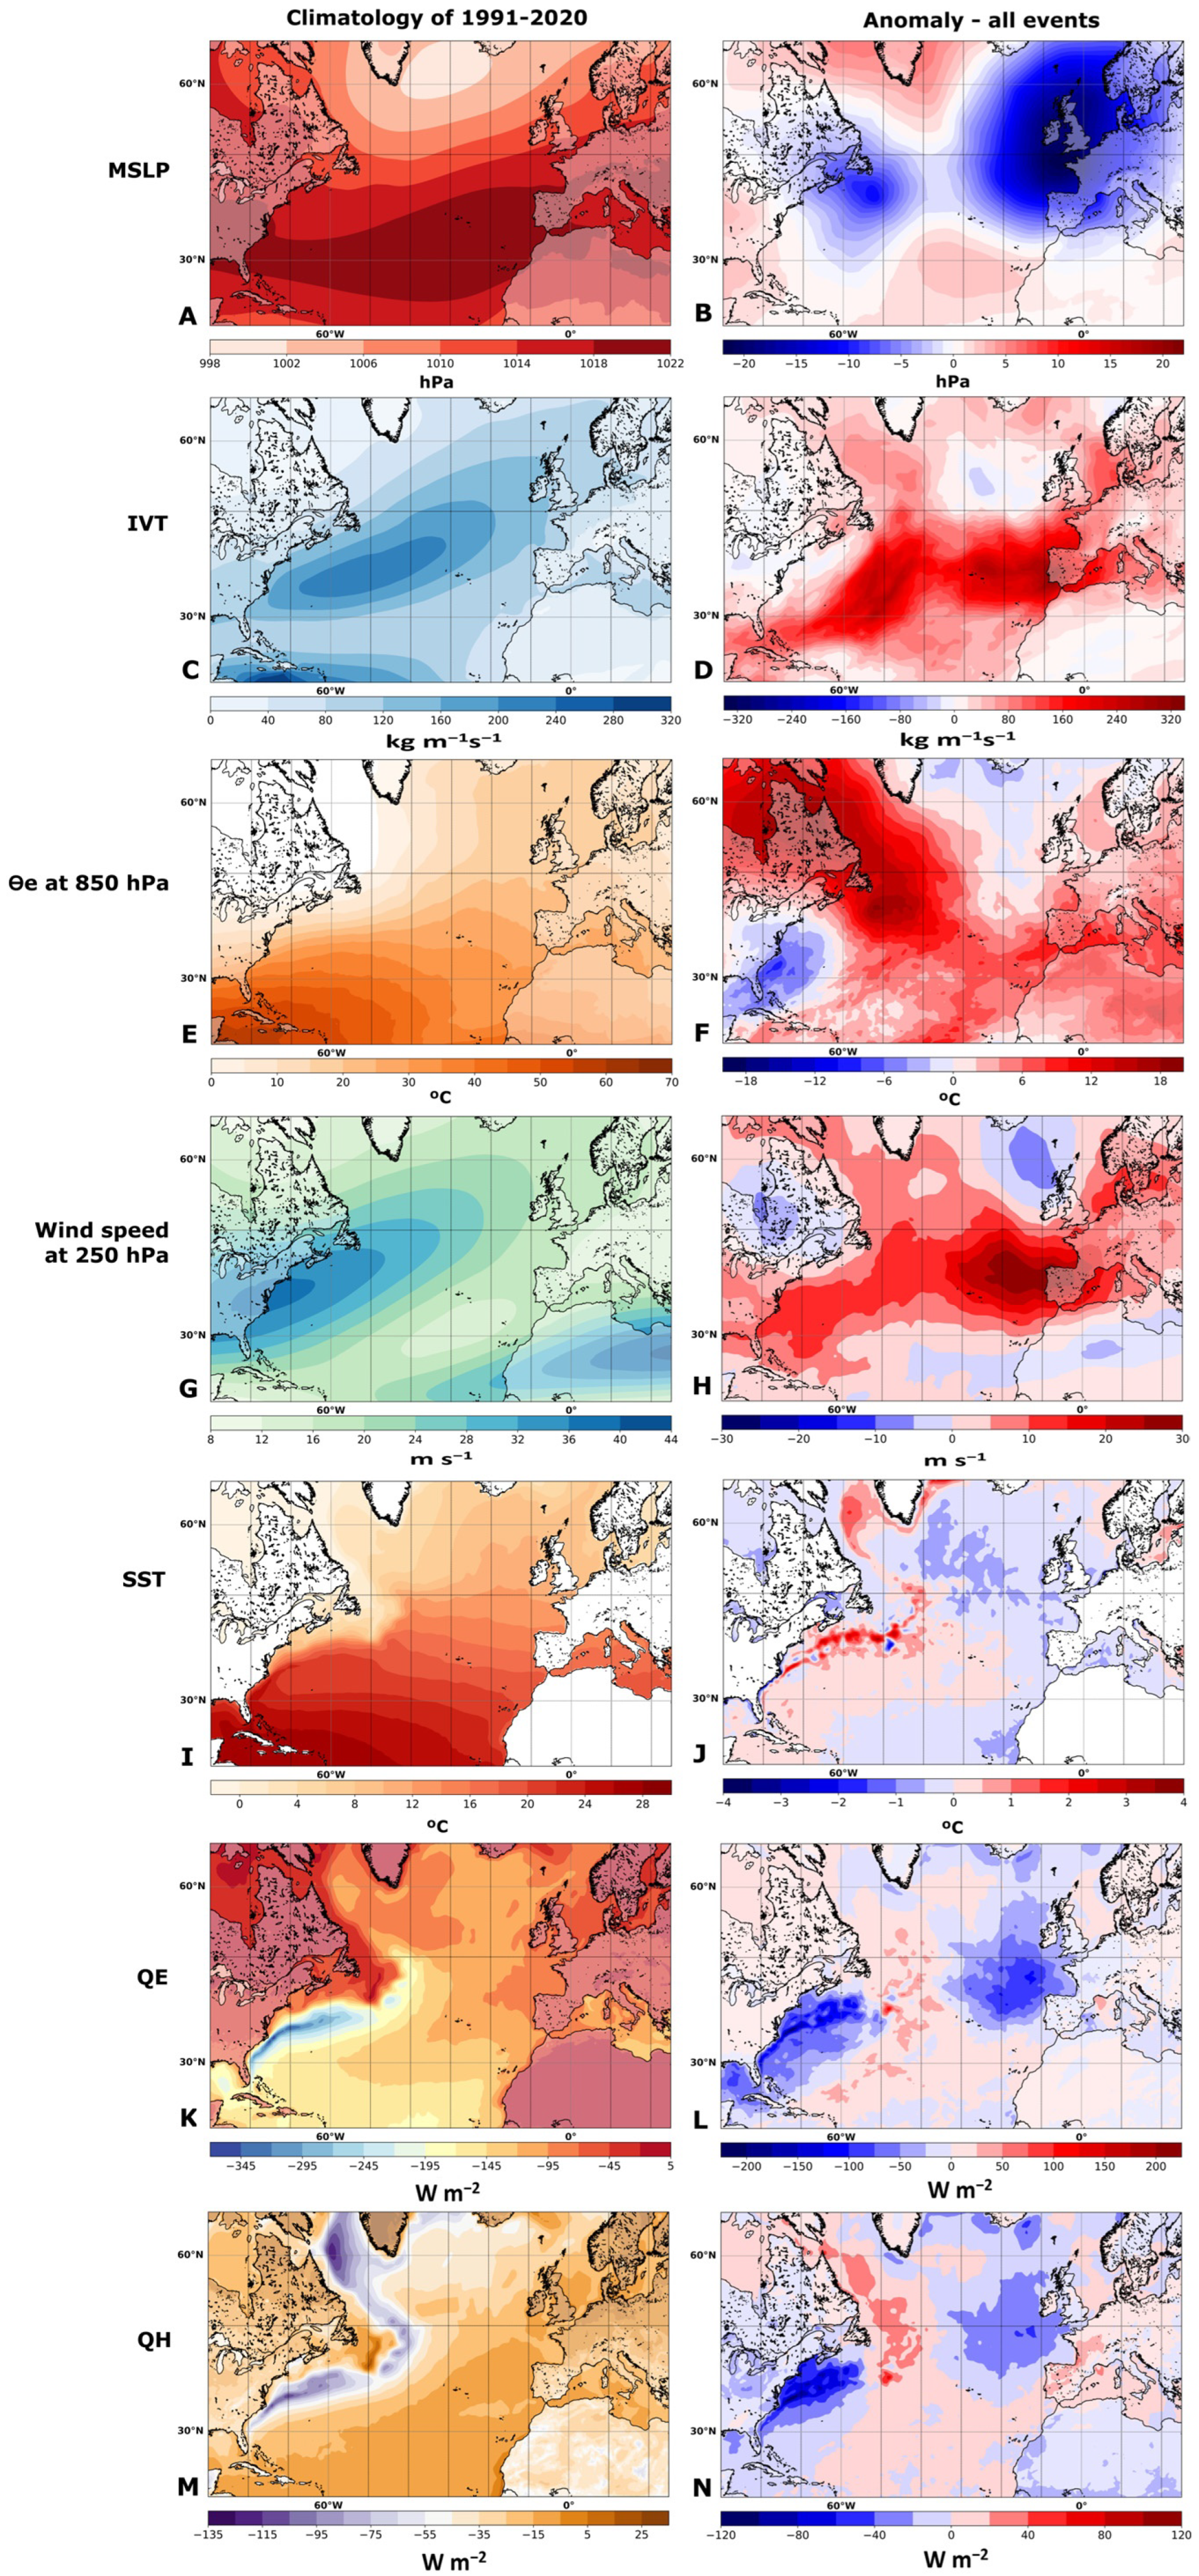
  • In the IP region, the anomaly analysis (Figure 7) related to the climatology of the 1991–2020 period shows low MSLP values (up to more than −21.6 hPa), high values of IVT (up to more than 327.6 kg m−1s−1) and wind speed at 250 hPa (up to more than 29.6 m s−1), high values of θe at 850 hPa (up to more than 19.1 °C), QE with values up to −150 W m−2, QH with values up to –40 W m−2, and QN values up to more than −160 W m−2.
  • The heat flux analysis (QE, QH, and QN) and the anomalies of SST with values up to −1 °C at the Iberian coast (Figure 7J), as well as the heat flux anomaly values (QE, QH, and QN) (Figure 7 and Figure S2) suggest a cooling of the ocean during the passage of the storm. These results reveal the heat exchangers between the ocean and atmosphere, and their contribution to the development of high-impact storms.
  • The results in the present work revealed that the high values of upper-level wind speed and lower-level moisture (Figure 4, Figure 5, Figure 6 and Figure 7) in the instant of maximum intensity had great importance for the development and intensification of the storms, being responsible for extreme precipitation events and flooding, as well as the strong winds associated with several destructive impacts.
In this sense, the naming of storms by the SW group has led to greater attention from the population to events affecting the region, but also greater availability of information and warnings by the competent authorities. Although the forecasts of the meteorological systems are more and more accurate, it is not yet possible to predict with total certainty its trajectory and the intensity of meteorological impacts. So, the information about these meteorological systems and the associated impacts must be clear, forecast, and in real-time, so that the general population can understand and take measures to minimize the damage.
Moreover, in future work, we consider applying the storm-centered composite analysis [85,104,105] to continue the study of high-impact storms that have affected the Iberian Peninsula. This approach allows us to obtain a different study perspective, with a different localized analysis.
In addition, the study of these events must be continued and considered in future works to understand the development, intensity, and frequency of these meteorological systems that affect the middle latitudes, in particular the IP, with higher values of precipitation and wind speed associated.
Thus, it is essential to improve knowledge of the mechanisms associated with the development of high-impact storms to promote population awareness of this kind of natural hazard and be able to act properly.

Supplementary Materials

The following supporting information can be downloaded at: https://www.mdpi.com/article/10.3390/atmos14091353/s1, Table S1. High-impact storms with explosive development. Figure S1: Analysis of the Net surface heat flux (QN) (W m−2) for storm Ana at 24 hours (A) and 12 hours (B) before the instant of maximum intensity (0 h) (C). MSLP (black contours at intervals of 4 hPa) is plotted in all figures. Figure S2: Climatology for extended winter months (ONDJFMA) of 1991–2020: (A) Net surface heat flux (QN) (W m−2). Anomaly for the composite of 2017–2021 extended winter storms (28 events): (B) QN (W m−2).

Author Contributions

Conceptualization, A.C.R.G.; methodology, A.C.R.G.; software, A.C.R.G.; validation, M.L.R.L. and R.N.; formal analysis, A.C.R.G.; investigation, A.C.R.G.; writing—original draft preparation, A.C.R.G.; writing—review and editing, M.L.R.L. and R.N.; supervision, M.L.R.L. and R.N.; project administration, M.L.R.L. and R.N.; funding acquisition, M.L.R.L. and R.N. All authors have read and agreed to the published version of the manuscript.

Funding

This work is supported by the Portuguese Science and Technology Foundation (Fundação para a Ciencia e a Tecnologia—FCT) through the projects UID/GEO/50019/2019, PTDC/CTAMET/29233/2017 (WEx-Atlantic), LISBOA-01-0145-FEDER-029233, NORTE-01-0145- FEDER-029233. The EPhysLab group was also funded by Xunta de Galicia, Consellería de Cultura, Educación e Universidade, under project ED431C 2021/44 “Programa de Consolidación e Estructuración de Unidades de Investigación Competitivas. FCT is providing for Ana Gonçalves doctoral grant (2021.04927.BD).

Institutional Review Board Statement

Not applicable.

Informed Consent Statement

Not applicable.

Data Availability Statement

Not applicable.

Conflicts of Interest

The authors declare no conflict of interest.

References

  1. Catto, J.L.; Ackerley, D.; Booth, J.F.; Champion, A.J.; Colle, B.A.; Pfahl, S.; Pinto, J.G.; Quinting, J.F.; Seiler, S. The Future of Midlatitude Cyclones. Curr. Clim. Chang. Rep. 2019, 5, 407–420. [Google Scholar] [CrossRef]
  2. Dacre, H.F.; Pinto, J.G. Serial clustering of extratropical cyclones: A review of where, when and why it occurs. Npj Clim. Atmos. Sci. 2020, 3, 48. [Google Scholar] [CrossRef]
  3. Peixoto, J.P.; Oort, A.H. Physics of Climate; American Institute of Physics: College Park, ML, USA, 1992; 520p. [Google Scholar]
  4. Rudeva, I.; Simmonds, I.; Crock, D.; Boschat, G. Midlatitude fronts and variability in the southern hemisphere tropical width. J. Clim. 2019, 32, 8243–8260. [Google Scholar] [CrossRef]
  5. Sinclair, V.A.; Rantanen, M.; Haapanala, P.; Räisänen, J.; Järvinen, H. The characteristics and structure of extra-tropical cyclones in a warmer climate. Weather Clim. Dyn. 2020, 1, 1–25. [Google Scholar] [CrossRef]
  6. Hawcroft, M.K.; Shaffrey, L.C.; Hodges, K.I.; Dacre, H.F. How Much Northern Hemisphere Precipitation Is Associated with Extratropical Cyclones? Geophys. Res. Lett. 2012, 39, L24809. [Google Scholar] [CrossRef]
  7. Catto, J.L.; Jakob, C.; Berry, G.; Nicholls, N. Relating Global Precipitation to Atmospheric Fronts. Geophys. Res. Lett. 2012, 39, L10805. [Google Scholar] [CrossRef]
  8. Pfahl, S.; Wernli, H. Quantifying the Relevance of Cyclones for Precipitation Extremes. J. Clim. 2012, 25, 6770–6780. [Google Scholar] [CrossRef]
  9. Catto, J.L.; Pfahl, S. The Importance of Fronts for Extreme Precipitation. J. Geophys. Res. Atmos. 2013, 118, 10791–10801. [Google Scholar] [CrossRef]
  10. Hawcroft, M.K.; Shaffrey, L.C.; Hodges, K.I.; Dacre, H.F. Can Climate Models Represent the Precipitation Associated with Extratropical Cyclones? Clim. Dyn. 2016, 47, 679–695. [Google Scholar] [CrossRef]
  11. Nieto, R.; Ciric, D.; Vázquez, M.; Liberato, M.L.R.; Gimeno, L. Contribution of the main moisture sources to precipitation during extreme peak precipitation months. Adv. Water Resour. 2019, 131, 103385. [Google Scholar] [CrossRef]
  12. Fink, A.H.; Brücher, T.; Ermert, V.; Krüger, A.; Pinto, J.G. The European storm Kyrill in January 2007: Synoptic evolution, meteorological impacts and some considerations with respect to climate change. Nat. Hazards Earth Syst. Sci 2009, 9, 405–423. [Google Scholar] [CrossRef]
  13. Liberato, M.L.R.; Pinto, J.G.; Trigo, I.F.; Trigo, R.M. Klaus—An exceptional winter storm over northern Iberia and southern France. Weather 2011, 66, 330–334. [Google Scholar] [CrossRef]
  14. Liberato, M.L.R.; Pinto, J.G.; Trigo, R.M.; Ludwig, P.; Ordóñez, P.; Yuen, D.; Trigo, I.F. Explosive development of winter storm Xynthia over the subtropical North Atlantic Ocean. Nat. Hazards Earth Syst. Sci. 2013, 13, 2239–2251. [Google Scholar] [CrossRef]
  15. Liberato, M.L.R. The 19 January 2013 windstorm over the North Atlantic: Large-scale dynamics and impacts on Iberia. Weather Clim. Extrem. 2014, 5, 16–28. [Google Scholar] [CrossRef]
  16. Pradhan, P.K.; Liberato, M.L.R.; Ferreira, J.A.; Dasamsetti, S.; Vijaya Bhaskara Rao, S. Characteristics of different convective parameterization schemes on the simulation of intensity and track of severe extratropical cyclones over North Atlantic. Atmos. Res. 2018, 199, 128–144. [Google Scholar] [CrossRef]
  17. Stojanovic, M.; Gonçalves, A.; Sorí, R.; Vázquez, M.; Ramos, A.M.; Nieto, R.; Gimeno, L.; Liberato, M.L.R. Consecutive Extratropical Cyclones Daniel, Elsa, and Fabien and Their Impact on the Hydrological Cycle of Mainland Portugal. Water 2021, 13, 1476. [Google Scholar] [CrossRef]
  18. Roberts, J.F.; Champion, A.J.; Dawkins, L.C.; Hodges, K.I.; Shaffrey, L.C.; Stephenson, D.B.; Stringer, M.A.; Thornton, H.E.; Youngman, B.D. The XWS Open Access Catalogue of Extreme European Windstorms from 1979 to 2012. Nat. Hazards Earth Syst. Sci. 2014, 14, 2487–2501. [Google Scholar] [CrossRef]
  19. Hewson, T.D.; Neu, U. Cyclones, Windstorms and the IMILAST Project. Tellus Ser. A Dyn. Meteorol. Oceanogr. 2015, 6, 27128. [Google Scholar] [CrossRef]
  20. Befort, D.J.; Wild, S.; Knight, J.R.; Lockwood, J.F.; Thornton, H.E.; Hermanson, L.; Bett, P.E.; Weisheimer, A.; Leckebusch, G.C. Seasonal forecast skill for extratropical cyclones and windstorms. Q. J. R. Meteorol. Soc. 2019, 145, 92–104. [Google Scholar] [CrossRef]
  21. Pfahl, S. Characterising the Relationship between Weather Extremes in Europe and Synoptic Circulation Features. Nat. Hazards Earth Syst. Sci. 2014, 14, 1461–1475. [Google Scholar] [CrossRef]
  22. Pfahl, S.; Sprenger, M. On the Relationship between Extratropical Cyclone Precipitation and Intensity. Geophys. Res. Lett. 2016, 43, 1752–1758. [Google Scholar] [CrossRef]
  23. Ramos, A.M.; Trigo, R.M.; Liberato, M.L.R. A Ranking of High-Resolution Daily Precipitation Extreme Events for the Iberian Peninsula. Atmos. Sci. Lett. 2014, 15, 328–334. [Google Scholar] [CrossRef]
  24. Ramos, A.M.; Trigo, R.M.; Liberato, M.L.R.; Tomé, R. Daily Precipitation Extreme Events in the Iberian Peninsula, and Its Association with Atmospheric Rivers. J. Hydrometeorol. 2015, 16, 579–597. [Google Scholar] [CrossRef]
  25. Ferreira, J.A.; Liberato, M.L.R.; Ramos, A.M. On the Relationship between Atmospheric Water Vapour Transport and Extra-Tropical Cyclones Development. Phys. Chem. Earth 2016, 94, 56–65. [Google Scholar] [CrossRef]
  26. Sousa, P.M.; Ramos, A.M.; Raible, C.C.; Messmer, M.; Tomé, R.; Pinto, J.G.; Trigo, R.M. North Atlantic integrated water vapor transport—From 850–2100 CE: Impacts on Western European rainfall. J. Clim. 2019, 33, 263–279. [Google Scholar] [CrossRef]
  27. Doiteau, B.; Dournaux, M.; Montoux, N.; Baray, J.L. Atmospheric Rivers and Associated Precipitation over France and Western Europe: 1980–2020 Climatology and Case Study. Atmosphere 2021, 12, 1075. [Google Scholar] [CrossRef]
  28. Ulbrich, U.; Leckebusch, G.C.; Pinto, J.G. Extra-tropical cyclones in the present and future climate: A review. Theor. Appl. Climatol. 2009, 96, 117–131. [Google Scholar] [CrossRef]
  29. Kron, W.; Löw, P.; Kundzewicz, Z.W. Changes in risk of extreme weather events in Europe. Environ. Sci. Policy 2019, 100, 74–83. [Google Scholar] [CrossRef]
  30. Eiras-Barca, J.; Ramos, A.M.; Pinto, J.G.; Trigo, R.M.; Liberato, M.L.R.; Miguez-Macho, G. The concurrence of atmospheric rivers and explosive cyclogenesis in the North Atlantic and North Pacific basins. Earth Syst. Dyn. 2018, 9, 91–102. [Google Scholar] [CrossRef]
  31. Raveh-Rubin, S.; Wernli, H. Large-scale wind and precipitation extremes in the Mediterranean: A climatological analysis for 1979–2012. Q. J. R. Meteorol. Soc. 2015, 141, 2404–2417. [Google Scholar] [CrossRef]
  32. Schemm, S.; Sprenger, M.; Martius, O.; Wernli, H.; Zimmer, M. Increase in the number of extremely strong fronts over Europe? A study based on ERA-interim reanalysis (1979–2014). Geophys. Res. Lett. 2017, 44, 553–561. [Google Scholar] [CrossRef]
  33. Raveh-Rubin, S.; Catto, J.L. Climatology and dynamics of the link between dry intrusions and cold fronts during winter, Part II: Front-centred perspective. Clim. Dyn. 2019, 53, 1893–1909. [Google Scholar] [CrossRef]
  34. Liberato, M.L.R.; Trigo, R.M. Extreme precipitation events and related impacts in Western Iberia. In Hydrology in a Changing World: Environmental and Human Dimensions; IAHS Red Book No 363; IAHS Publ.: Göttingen Germany, 2014; pp. 171–176. ISSN 0144-7815. [Google Scholar]
  35. Pereira, S.; Ramos, A.M.; Rebelo, L.; Trigo, R.M.; Zêzere, J.L. A centennial catalogue of hydro-geomorphological events and their atmospheric forcing. Adv. Water Resour. 2018, 122, 98–112. [Google Scholar] [CrossRef]
  36. Hénin, R.; Ramos, A.M.; Liberato, M.L.R. A ranking of concurrent precipitation and wind events for the Iberian Peninsula. Int. J. Climatol. 2021, 41, 1421–1437. [Google Scholar] [CrossRef]
  37. Seneviratne, S.I.; Nicholls, N.; Easterling, D.; Goodess, C.; Kanae, S.; Kossin, J.; Luo, Y.; Marengo, J.; McInnes, K.; Rahimi, M.; et al. Changes in climate extremes and their impacts on the natural physical environment. In Managing the Risks of Extreme Events and Disasters to Advance Climate Change Adaptation; A Special Report of Working Groups I and II of the Intergovernmental Panel on Climate Change (IPCC); Field, C.B., Barros, V., Stocker, T.F., Qin, D., Dokken, D.J., Ebi, K.L., Mastrandrea, M.D., Mach, K.J., Plattner, G.-K., Allen, S.K., et al., Eds.; Cambridge University Press: Cambridge, UK; New York, NY, USA, 2012; pp. 109–230. [Google Scholar]
  38. Leonard, M.; Westra, S.; Phatak, A.; Lambert, M.; van den Hurk, B.; McInnes, K.; Risbey, J.; Schuster, S.; Jakob, D.; Stafford-Smith, M. A Compound Event Framework for Understanding Extreme Impacts. Wiley Interdiscip. Rev. Clim. Chang. 2014, 5, 113–128. [Google Scholar] [CrossRef]
  39. Zscheischler, J.; Martius, O.; Westra, S.; Bevacqua, E.; Raymond, C.; Horton, R.M.; van den Hurk, B.; AghaKouchak, A.; Jézéquel, A.; Mahecha, M.D.; et al. A Typology of Compound Weather and Climate Events. Nat. Rev. Earth Environ. 2020, 1, 333–347. [Google Scholar] [CrossRef]
  40. Zscheischler, J.; Westra, S.; van den Hurk, B.; Seneviratne, S.I.; Ward, P.J.; Pitman, A.; Aghakouchak, A.; Bresch, D.N.; Leonard, M.; Wahl, T.; et al. Future Climate Risk from Compound Events. Nat. Clim. Chang. 2018, 8, 469–477. [Google Scholar] [CrossRef]
  41. Liberato, M.L.R.; Ramos, A.M.; Trigo, R.M.; Trigo, I.F.; Durán-Quesada, A.M.; Nieto, R.; Gimeno, L. Moisture Sources and Large-Scale Dynamics Associated With a Flash Flood Event. In Lagrangian Modeling of the Atmosphere; Geophysical Monograph Series; American Geophysical Union: Washington, DC, USA, 2012. [Google Scholar] [CrossRef]
  42. Bevacqua, E.; Maraun, D.; Hobæk Haff, I.; Widmann, M.; Vrac, M. Multivariate statistical modelling of compound events via pair-copula constructions: Analysis of floods in Ravenna (Italy). Hydrol. Earth Syst. Sci. 2017, 21, 2701–2723. [Google Scholar] [CrossRef]
  43. De Luca, P.; Messori, G.; Pons, F.M.E. Dynamical systems theory sheds new light on compound climate extremes in Europe and Eastern North America. Q. J. R. Meteorol. Soc. 2020, 146, 1636–1650. [Google Scholar] [CrossRef]
  44. Poschlod, B.; Zscheischler, J.; Sillmann, J.; Wood, R.R.; Ludwig, R. Climate Change Effects on Hydrometeorological Compound Events over Southern Norway. Weather Clim. Extrem. 2020, 28, 100253. [Google Scholar] [CrossRef]
  45. Owen, L.E.; Catto, J.L.; Stephenson, D.B.; Dunstone, N.J. Compound Precipitation and Wind Extremes over Europe and Their Relationship to Extratropical Cyclones. Weather Clim. Extrem. 2021, 33, 100342. [Google Scholar] [CrossRef]
  46. Bloomfield, H.C.; Hillier, J.; Griffin, A.; Kay, A.L.; Shaffrey, L.C.; Pianosi, F.; James, R.; Kumar, D.; Champion, A.; Bates, P.D. Co-Occurring Wintertime Flooding and Extreme Wind over Europe, from Daily to Seasonal Timescales. Weather Clim. Extrem. 2023, 39, 100550. [Google Scholar] [CrossRef]
  47. Waliser, D.; Guan, B. Extreme Winds and Precipitation during Landfall of Atmospheric Rivers. Nat. Geosci. 2017, 10, 179–183. [Google Scholar] [CrossRef]
  48. Zhang, Y.; Sun, X.; Chen, C. Characteristics of Concurrent Precipitation and Wind Speed Extremes in China. Weather Clim. Extrem. 2021, 32, 100322. [Google Scholar] [CrossRef]
  49. Martius, O.; Pfahl, S.; Chevalier, C. A global quantification of compound precipitation and wind extremes. Geophys. Res. Lett. 2016, 43, 7709–7717. [Google Scholar] [CrossRef]
  50. Messmer, M.; Simmonds, I. Global Analysis of Cyclone-Induced Compound Precipitation and Wind Extreme Events. Weather Clim. Extrem. 2021, 32, 100324. [Google Scholar] [CrossRef]
  51. Catto, J.L.; Dowdy, A. Understanding Compound Hazards from a Weather System Perspective. Weather Clim. Extrem. 2021, 32, 100550. [Google Scholar] [CrossRef]
  52. Ridder, N.N.; Ukkola, A.M.; Pitman, A.J.; Perkins-Kirkpatrick, S.E. Increased Occurrence of High Impact Compound Events under Climate Change. Npj Clim. Atmos. Sci. 2022, 5, 3. [Google Scholar] [CrossRef]
  53. Institut für Meteorologie. Met.fu-berlin. 2023. Available online: http://www.met.fu-berlin.de/adopt-a-vortex/historie/ (accessed on 7 June 2021).
  54. Instituto Português do Mar e da Atmosfera-IPMA. 2023. Available online: https://www.ipma.pt/en/index.html (accessed on 7 June 2021).
  55. Agencia Estatal Meteorología-AEMet. Borrascas Con Gran Impacto: Información Divulgativa y de Otras Temporadas. 2023. Available online: http://www.aemet.es/es/conocermas/borrascas (accessed on 7 June 2021).
  56. Météo France. 2023. Available online: http://www.meteofrance.com/accueil (accessed on 7 June 2021).
  57. RMI. 2023. Available online: https://www.meteo.be/en/ (accessed on 9 June 2021).
  58. MeteoLux. 2023. Available online: https://www.meteolux.lu/?lang=fr/ (accessed on 9 June 2021).
  59. Met Office. 2023. Available online: https://www.metoffice.gov.uk/ (accessed on 9 June 2021).
  60. Met Éireann. 2023. Available online: https://www.met.ie/ (accessed on 9 June 2021).
  61. KNMI. 2023. Available online: https://www.knmi.nl/home (accessed on 9 June 2021).
  62. Gonçalves, A.; Liberato, M.L.R.; Nieto, R. High impact storms affecting the Iberian Peninsula: 2017–2019 extended winters. In Proceedings of the 2nd International Conference on Urban Risks (ICUR 2022), Lisbon, Portugal, 23–25 June 2022. [Google Scholar]
  63. Zschenderlein, P.; Wernli, H. How Intense Daily Precipitation Depends on Temperature and the Occurrence of Specific Weather Systems–an Investigation with ERA5 Reanalyses in the Extratropical Northern Hemisphere. Weather Clim. Dyn. 2022, 3, 391–411. [Google Scholar] [CrossRef]
  64. Gonçalves, A.; Marques, M.C.; Loureiro, S.; Nieto, R.; Liberato, M.L.R. Disruption Risk Analysis of the Overhead Power Lines in Portugal. Energy 2023, 263, 125583. [Google Scholar] [CrossRef]
  65. Vautard, R.; van Oldenborgh, G.J.; Otto, F.E.L.; Yiou, P.; de Vries, H.; van Meijgaard, E.; Stepek, A.; Soubeyroux, J.-M.; Philip, S.; Kew, S.F.; et al. Human influence on European winter windstorms such as those of January 2018. Earth Syst. Dynam. 2019, 10, 271–286. [Google Scholar] [CrossRef]
  66. Zhuozhuo, L.; Fei, L.I.; Orsolini, Y.J.; Yongqi, G.A.O.; Shengping, H.E. Understanding of European cold extremes, sudden stratospheric warming, and Siberian snow accumulation in the winter of 2017/18. J. Clim. 2020, 33, 527–545. [Google Scholar] [CrossRef]
  67. Ribeiro, S.L.; Gonçalves, A.; Cascarejo, I.; Liberato, M.L.R.; Fonseca, T.F. Development of a Catalogue of Damage in Portuguese Forest Associated with Extreme Extratropical Cyclones. Sci. Total Environ. 2022, 814, 151948. [Google Scholar] [CrossRef] [PubMed]
  68. Sousa, P.M.; Barriopedro, D.; Trigo, R.M.; Ramos, A.M.; Nieto, R.; Gimeno, L.; Turkman, K.F.; Liberato, M.L.R. Impact of Euro-Atlantic Blocking Patterns in Iberia Precipitation Using a Novel High Resolution Dataset. Clim. Dyn. 2016, 46, 2573–2591. [Google Scholar] [CrossRef]
  69. Ulbrich, U.; Leckebusch, G.C.; Grieger, J.; Schuster, M.; Akperov, M.; Bardin, M.Y.; Feng, Y. Are Greenhouse Gas Signals of Northern Hemisphere Winter Extra-Tropical Cyclone Activity Dependent on the Identification and Tracking Algorithm? Meteorol. Z. 2013, 22, 61–68. [Google Scholar] [CrossRef]
  70. Neu, U.; Akperov, M.G.; Bellenbaum, N.; Benestad, R.; Blender, R.; Caballero, R.; Cocozza, A. Imilast: A Community Effort to Intercompare Extratropical Cyclone Detection and Tracking Algorithms. Bull. Am. Meteorol. Soc. 2013, 94, 529–547. [Google Scholar] [CrossRef]
  71. Pinto, J.G.; Zacharias, S.; Fink, A.H.; Leckebusch, G.C.; Ulbrich, U. Factors contributing to the development of extreme North Atlantic cyclones and their relationship with the NAO. Clim. Dyn. 2009, 32, 711–737. [Google Scholar] [CrossRef]
  72. Karremann, M.K.; Liberato, M.L.R.; Ordóñez, P.; Pinto, J.G. Characterization of synoptic conditions and cyclones associated with top ranking potential wind loss events over Iberia. Atmos. Sci. Lett. 2016, 17, 354–361. [Google Scholar] [CrossRef]
  73. IPMA–Boletim Climatológico. 2023. Available online: https://www.ipma.pt/pt/publicacoes/boletins.jsp?cmbDep=cli&cmbTema=pcl&idDep=cli&idTema=pcl&curAno=-1 (accessed on 20 June 2021).
  74. Resúmenes Climatológicos. España. 2023. Available online: https://www.aemet.es/es/serviciosclimaticos/vigilancia_clima/resumenes (accessed on 20 June 2021).
  75. Sanders, F.; Gyakum, J.R. Synoptic-Dynamic Climatology of the “Bomb”. Am. Meteorol. Soc. 1980, 108, 1589–1606. [Google Scholar]
  76. Trigo, I.F. Climatology and interannual variability of storm-tracks in the Euro-Atlantic sector: A comparison between ERA-40 and NCEP/NCAR reanalyses. Clim. Dyn. 2006, 26, 127–143. [Google Scholar] [CrossRef]
  77. Sanders, F. Explosive cyclogenesis in the west-central North Atlantic Ocean, 1981–1984. Part I: Composite structure and mean behavior. Mon. Wea. Rev. 1986, 114, 1781–1794. [Google Scholar] [CrossRef]
  78. Zhang, S.; Fu, G.; Lu, C.; Liu, J. Characteristics of Explosive Cyclones over the Northern Pacific. J. Appl. Meteorol. Clim. 2017, 56, 3187–3210. [Google Scholar] [CrossRef]
  79. Hersbach, H.; Bell, W.; Berrisford, P.; Horányi, A.; Sabater, J.M.; Nicolas, J.; Radu, R.; Schepers, D.; Simmons, A.; Soci, C.; et al. Global reanalysis: Goodbye ERA-Interim, hello ERA5. ECMWF Newsl. 2019, 159, 17–24. [Google Scholar] [CrossRef]
  80. Dacre, H.F.; Josey, S.A.; Grant, A.L.M. Extratropical-Cyclone-Induced Sea Surface Temperature Anomalies in the 2013–2014 Winter. Weather Clim. Dyn. 2020, 1, 27–44. [Google Scholar] [CrossRef]
  81. Zhang, S.; Liu, C.; Xu, J.; Zhang, S.; Tang, R.; Huang, Z.; Zheng, Y.; Guan, Z.; Mao, H.; Xue, Y. Physical Process Contributions to the Development of a Super Explosive Cyclone Over the Gulf Stream. Front. Earth Sci. 2021, 9, 1–15. [Google Scholar] [CrossRef]
  82. Bolton, D. The computation of equivalent potential temperature. Mon. Weather Rev. 1980, 108, 1046–1053. [Google Scholar] [CrossRef]
  83. Holton, J.R.; Hakim, G.J. Basic Conservation Laws. In An Introduction to Dynamic Meteorology, 5th ed.; Academic Press: Cambridge, MA, USA, 2013; pp. 31–66. ISBN 9780123848666. [Google Scholar] [CrossRef]
  84. Schemm, S.; Rudeva, I.; Simmonds, I. Extratropical fronts in the lower troposphere–global perspectives obtained from two automated methods. Q. J. R. Meteorol. Soc. 2015, 141, 1686–1698. [Google Scholar] [CrossRef]
  85. Catto, J.L.; Shaffrey, L.C.; Hodges, K.I. Can Climate Models Capture the Structure of Extratropical Cyclones? J. Clim. 2010, 23, 1621–1635. [Google Scholar] [CrossRef]
  86. Agencia Estatal Meteorología-AEMet. Borrascas Con Gran Impacto: Borrasca Ana. 2023. Available online: https://www.aemet.es/es/conocermas/borrascas/2017-2018/estudios_e_impactos/ana (accessed on 20 August 2023).
  87. IPMA. Boletim Climatológico Dezembro 2017. Portugal Continental. 2017. Available online: https://www.ipma.pt/resources.www/docs/im.publicacoes/edicoes.online/20180111/FwUgbvLXmdNueCABQKBI/cli_20171201_20171231_pcl_mm_co_pt.pdf (accessed on 20 August 2023).
  88. Fink, A.H.; Pohle, S.; Pinto, J.G.; Knippertz, P. Diagnosing the Influence of Diabatic Processes on the Explosive Deepening of Extratropical Cyclones. Geophys. Res. Lett. 2012, 39, L07803. [Google Scholar] [CrossRef]
  89. Baehr, C.; Pouponneau, B.; Ayrault, F.; Joly, A. Dynamical Characterization of the FASTEX cyclogenesis cases. Q. J. R. Meteorol. Soc. 1999, 125, 3469–3494. [Google Scholar] [CrossRef]
  90. Ludwig, P.; Pinto, J.G.; Reyers, M.; Gray, S.L. The role of anomalous SST and surface fluxes over the southeastern North Atlantic in the explosive development of windstorm Xynthia. Q. J. R. Meteorol. Soc. 2014, 140, 1729–1741. [Google Scholar] [CrossRef]
  91. Nelson, J.; He, R.; Warner, J.C.; Bane, J. Air-Sea Interactions during Strong Winter Extratropical Storms. Ocean Dyn. 2014, 64, 1233–1246. [Google Scholar] [CrossRef]
  92. Kobashi, F.; Doi, H.; Iwasaka, N. Sea Surface Cooling Induced by Extratropical Cyclones in the Subtropical North Pacific: Mechanism and Interannual Variability. J. Geophys. Res. Ocean. 2019, 124, 2179–2195. [Google Scholar] [CrossRef]
  93. Bengtsson, L.; Hodges, K.I.; Roeckner, E. Storm Tracks and Climate Change. J. Clim. 2006, 19, 3518–3543. [Google Scholar] [CrossRef]
  94. Hersbach, H.; Bell, B.; Berrisford, P.; Biavati, G.; Horányi, A.; Muñoz Sabater, J.; Nicolas, J.; Peubey, C.; Radu, R.; Rozum, I.; et al. ERA5 hourly data on single levels from 1940 to present. Copernic. Clim. Change Serv. (C3S) Clim. Data Store (CDS) 2023, 10. [Google Scholar] [CrossRef]
  95. Brasseur, O. Development and Application of a Physical Approach to Estimating Wind Gusts. Mon. Weather. Rev. 2001, 129, 5–25. [Google Scholar] [CrossRef]
  96. Ágústsson, H.; Ólafsson, H. Forecasting Wind Gusts in Complex Terrain. Meteorol. Atmos. Phys. 2009, 103, 173–185. [Google Scholar] [CrossRef]
  97. Thomas, S.R.; Nicolau, S.; Martínez-Alvarado, O.; Drew, D.J.; Bloomfield, H.C. How Well Do Atmospheric Reanalyses Reproduce Observed Winds in Coastal Regions of Mexico? Meteorol. Appl. 2021, 28, e2023. [Google Scholar] [CrossRef]
  98. Molina, M.O.; Gutiérrez, C.; Sánchez, E. Comparison of ERA5 Surface Wind Speed Climatologies over Europe with Observations from the HadISD Dataset. Int. J. Climatol. 2021, 41, 4864–4878. [Google Scholar] [CrossRef]
  99. Zhai, R.; Huang, C.; Yang, W.; Tang, L.; Zhang, W. Applicability Evaluation of ERA5 Wind and Wave Reanalysis Data in the South China Sea. J. Oceanol. Limnol. 2023, 41, 495–517. [Google Scholar] [CrossRef]
  100. Ramos, A.M.; Tomé, R.; Trigo, R.M.; Liberato, M.L.R.; Pinto, J.G. Projected changes in atmospheric rivers affecting Europe in CMIP5 models. Geophys. Res. Lett. 2016, 43, 9315–9323. [Google Scholar] [CrossRef]
  101. Hawcroft, M.; Walsh, E.; Hodges, K.; Zappa, G. Significantly Increased Extreme Precipitation Expected in Europe and North America from Extratropical Cyclones. Environ. Res. Lett. 2018, 13, 124006. [Google Scholar] [CrossRef]
  102. IPCC. Global Warming of 1.5 °C. In An IPCC Special Report on the Impacts of Global Warming of 1.5 °C above Pre-Industrial Levels and Related Global Greenhouse Gas Emission Pathways, in the Context of Strengthening the Global Response to the Threat of Climate Change, Sustainable Development, and Efforts to Eradicate Poverty; Masson-Delmotte, V.P., Zhai, H.-O., Pörtner, D., Roberts, J., Skea, P.R., Shukla, A., Pirani, W., Moufouma-Okia, C., Péan, R., Pidcock, S., et al., Eds.; World Meteorological Organization: Geneva, Switzerland, 2018. [Google Scholar]
  103. IPCC. Climate Change 2022-Impacts, Adaptation, and Vulnerability. Summary for Policymakers. 2022. Available online: https://report.ipcc.ch/ar6wg2/pdf/IPCC_AR6_WGII_SummaryForPolicymakers.pdf (accessed on 10 May 2023).
  104. Dacre, H.F.; Hawcroft, M.K.; Stringer, M.A.; Hodges, K.I. An Extratropical Cyclone Atlas a Tool for Illustrating Cyclone Structure and Evolution Characteristics. Bull. Am. Meteorol. Soc. 2012, 93, 1497–1502. [Google Scholar] [CrossRef]
  105. Calvo-Sancho, C.; González-Alemán, J.J.; Bolgiani, P.; Santos-Muñoz, D.; Farrán, J.I.; Martín, M.L. An Environmental Synoptic Analysis of Tropical Transitions in the Central and Eastern North Atlantic. Atmos. Res. 2022, 278, 106353. [Google Scholar] [CrossRef]
Figure 1. Tracks of high-impact storms with dots indicating storms’ location at six-hour intervals. Maximum intensity instants of each storm are marked with an ‘X’, for winters: (A) 2017–2018; (C) 2018–2019; (E) 2019–2020; (G) 2020–2021. Central MSLP evolution over the lifetime of each storm (core pressure in hPa). Dates are relative to the minimum core pressure time (zero Julian day) for winters: (B) 2017–2018; (D) 2018–2019; (F) 2019–2020; (H) 2020–2021.
Atmosphere 14 01353 g001
Figure 2. (A) Position of each storm in the instant of maximum intensity (marked with an “X”), for the different groups; Tracks of each storm and the position in the instant of maximum intensity marked with an “X” for the groups: (B) Iberia (9 events); (C) North (13 events); (D) West (3 events); (E) Hybrid (3 events). The thick lines present the event with explosive development.
Atmosphere 14 01353 g002
Figure 3. (A) Distribution of high-impact storm intensity (the instant of maximum intensity, hPa) for all events (in blue) and the events with explosive development (in orange); (B) distribution of lifetime (in days) for all events (in green) and the events with explosive development (in maroon); (C) distribution per month for all events (in gray) and the events with explosive development (in red); (D) deepening rate (in Bergeron) of the events with explosive development (in gold).
Atmosphere 14 01353 g003
Figure 4. Analysis of storm Ana at 24 h (first column) and 12 h (second column) before the instant of maximum intensity (third column). MSLP (black contours at intervals of 4 hPa) is plotted in all figures. (AC) Equivalent potential temperature field at 850 hPa (θe; in °C); (DF) wind speed (m s −1) intensity and direction (vectors) at 250 hPa; (GI) integrated vapor transport (IVT; kg m−1 s−1) intensity and direction (vectors); (JL) sea surface temperature (SST; °C); (MO) surface latent heat flux (QE) (W m−2); (PR) surface sensible heat flux (QH) (W m−2).
Atmosphere 14 01353 g004
Figure 5. The 98th percentile values of the period of 1991–2020 for (A) daily accumulated precipitation (mm day−1), (B) instantaneous 10 m wind gust (m s−1), and (C) wind speed at 10 m (m s−1).
Atmosphere 14 01353 g005
Figure 6. Percentage of days (%) (a total of 94 days) in which the 98th percentile for the period 1991–2020 was surpassed, for (A) daily accumulated precipitation; (B) instantaneous gusts of wind at 10 m; (C) wind speed at 10 m; (D) concurrent extremes of daily accumulated precipitation and instantaneous wind gusts at 10 m; (E) concurrent extremes of daily accumulated precipitation and wind speed at 10 m.
Atmosphere 14 01353 g006
Figure 7. Climatology for extended winter months (ONDJFMA) of 1991–2020: (A) mean sea level pressure (MSLP) (hPa); (C) integrated vapor transport (IVT) (kg m−1s−1); (E) equivalent potential temperature (ϴe) at 850 hPa (°C); (G) wind speed at 250 hPa (m s−1); (I) sea surface temperature (SST) (°C); (K) surface latent heat flux (QE) (W m−2); (M) surface sensible heat flux (QH) (W m−2). anomaly for the composite of 2017–2021 extended winter storms (28 events): (B) MSLP (hPa); (D) IVT (kg m−1s−1); (F) θe at 850 (°C); (H) wind speed at 250 hPa (m s−1); (J) SST (°C); (L) QE (W m−2); (N) QH (W m−2).
Atmosphere 14 01353 g007
Table 1. Characteristics of the studied SW European Group named storms in the extended winters of 2018–2021 affecting IP: name (including the name attributed by the Institute of Meteorology of the Freie Universität Berlin, Germany); date; position (in latitude and longitude); minimum pressure; and impacts of the storms in terms of wind (W), precipitation (P), wind and precipitation (W + P). Explosive cyclones are highlighted with an asterisk (*).
Name of the StormDate, Position, and the Minimum Pressure of the StormImpacts of Storm (W, P, W + P)
SW European GroupMet Fu BerlinDateLatitudeLongitudeMinimum Pressure (hPa)
(dd/mm/yyyy UTC)(°N)(°E)
2017–2018
Ana *Yves11/12/2017 0648−2958W + P
CarmenIngmar01/01/2018 0649−6989W
Emma *Ulrike26/02/2018 0642−35963W + P
FélixYuliya11/03/2018 0045−11967W + P
GiseleZsuzsa14/03/2018 1251−18965W + P
Hugo *Carola23/03/2018 1849−10969W + P
2018–2019
BeatrizYaprak07/11/2018 0655−28958W + P
DianaHalka29/11/2018 1258−16949P
Gabriel *Oskar29/01/2019 18470985W + P
HelenaQuirin31/01/2019 1252−15971W + P
LauraCornelius06/03/2019 1856−8974W + P
2019–2020
CecicliaLuis22/11/2019 1246−9976W + P
DanielXander16/12/2019 1845−3994W + P
Elsa *Yadid19/12/2019 0055−15965W + P
Fabien *Ailton21/12/2019 1249−11962W + P
GloriaIlka17/01/2020 1248−29988W + P
Jorge *Charlotte29/02/2020 1256−11953W + P
KarineDiana I02/03/2020 0051−5984W + P
LeonDiana II01/03/2020 12480991W + P
2020–2021
Alex *Brigitte02/10/2020 0649−2968W + P
BarbaraImika I21/10/2020 0649−2989W + P
Dora *Wenke I and II04/12/2020 06522968W
ErnestYvonne07/12/2020 1247−7988W + P
FilomenaBartosz08/01/2021 1836−6996P
Gaetan *-21/01/2021 18583950W + P
HortenseIrek21/01/2021 18501983W + P
IgnacioLars23/01/2021 1245−9999W + P
Lola-22/04/2021 1843−24982W + P
Disclaimer/Publisher’s Note: The statements, opinions and data contained in all publications are solely those of the individual author(s) and contributor(s) and not of MDPI and/or the editor(s). MDPI and/or the editor(s) disclaim responsibility for any injury to people or property resulting from any ideas, methods, instructions or products referred to in the content.

