Article

Research on Typhoon Precipitation Prediction over Hainan Island Based on Dynamical–Statistical–Analog Technology

1
Key Laboratory of South China Sea Meteorological Disaster Prevention and Mitigation of Hainan Province, Haikou 570203, China
2
Hainan Meteorological Observatory, Haikou 570203, China
3
CMA Henan Key Laboratory of Agrometeorological Support and Applied Technique, Zhengzhou 450003, China
4
Henan Meteorological Observatory, Zhengzhou 450003, China
5
State Key Laboratory of Severe Weather, Chinese Academy of Meteorological Sciences, Beijing 100081, China
6
Public Meteorological Service Center of CMA, Beijing 100081, China
*
Author to whom correspondence should be addressed.
Atmosphere 2023, 14(8), 1210; https://doi.org/10.3390/atmos14081210
Submission received: 7 June 2023 / Revised: 22 July 2023 / Accepted: 26 July 2023 / Published: 27 July 2023

Abstract

:
Based on the Dynamical–Statistical–Analog Ensemble Forecast model for Landfalling Typhoon Precipitation (DSAEF_LTP model), the optimal forecast scheme for the tropical cyclone (TC) accumulated precipitation over Hainan Island, China (DSAEF_LTP_HN) is established. To test the forecasting performance of DSAEF_LTP_HN, its forecasting results are compared with other numerical models. The average threat score (TS) of accumulated precipitation forecast by DSAEF_LTP_HN is compared with other numerical models over independent samples. The results show that for accumulated precipitation ≥ 100 mm, the TS produced by DSAEF_LTP_HN reaches 0.39, ranking first, followed by ECMWF (0.36). For accumulated precipitation ≥ 250 mm, the TS of DSAEF_LTP_HN (0.04) is second only to ECMWF (0.19). Further analysis reveals that the forecasting performance of DSAEF_LTP_HN for TC precipitation is closely related to the TC characteristics. The longer the TC impacts Hainan Island and the heavier the precipitation delivered to Hainan Island, the better the forecasting performance of DSAEF_LTP_HN is. DSAEF_LTP_HN can successfully capture the center of heavy precipitation. However, there is still a phenomenon of false forecasts for some TC heavy precipitation, which requires further improvement of the model in the future.

1. Introduction

A tropical cyclone (TC) is a rotating and violent storm that occurs in the tropical ocean, sometimes with extremely destructive power. It may cause an alarming loss of life and property, and can become one of the most serious natural disasters on earth. As one of the triggers of TC hazards, heavy rainfall can cause flash floods, river overflows, reservoir collapses, and so on [1,2,3,4]. For example, Typhoon Nina (1975) caused an extraordinary rainstorm event in Henan Province, resulting in more than 90,000 deaths, six medium-large reservoirs collapsing, 102 km of the Beijing-Guangzhou Railway being destroyed, and direct economic losses of nearly CNY 10 billion [5]. Therefore, to defend and mitigate the disasters caused by TCs, it is crucial to improve the skill of TC precipitation forecasting. However, in recent years, although the track forecasting of TC has become more and more mature, the forecasting of precipitation caused by TCs has progressed slowly. Therefore, the study of TC precipitation forecasting technology is very important, and it can provide a reference for the government to make decisions when defending against TC heavy precipitation disasters.
Previous research results on forecasting techniques surrounding landfalling TC (LTC) precipitation can be summarized into the following three categories: dynamical forecasts, statistical forecasts, and dynamical–statistical forecasts. Dynamical forecasts mainly refer to numerical model forecasts. Although the numerical model has been improving the forecasting skill of TC precipitation in recent years [6,7,8,9,10,11,12,13,14,15], its ability to forecast TC precipitation is still limited [16,17,18,19,20,21,22]. Statistical forecasts [23,24,25,26,27] consider historical TC-caused precipitation, but it is unlikely to be the mainstream direction for LTC precipitation forecasting because of the lack of consideration of the physical processes (dynamical and thermal processes) in the atmosphere. Therefore, dynamical–statistical forecasts have been proposed for forecasting LTC precipitation. For this approach, some studies used forecasted TC tracks and historical precipitation data to forecast TC precipitation from a climatological average perspective [28,29,30], some studies used rainfall integration of forecasted TC tracks and initial rainfall rates to forecast LTC precipitation [31,32,33], and others considered dynamical–statistical schemes constructed by various TC internal variables and their environmental fields [34,35].
Recently, Ren et al. [36] proposed the theory of Dynamical–Statistical–Analog Ensemble Forecast (DSAEF), and applied it to LTC accumulated precipitation (the precipitation on land caused by a TC during its whole life) forecasting, developing the Dynamical–Statistical–Analog Ensemble Forecast model for Landfalling Typhoon Precipitation (DSAEF_LTP model). The model contained two physical factors initially: the TC track and the TC landfall season. Subsequently, Ding et al. [37] introduced TC intensity into the model and conducted rainfall forecasting experiments for 21 LTCs in South China. Other studies added new values of two parameters to the model: similarity region [38] and ensemble forecast scheme [39], and further improved the DSAEF_LTP model by conducting simulation experiments for a single TC (Lekima) and 10 TCs, respectively, over China. To test the forecasting performance of the improved model with the new parameter values added, Ma et al. [40] and Qin et al. [41] applied the improved model to TC precipitation forecasting in south China and southeast China, respectively, and found that the improved model outperformed other dynamical models in forecasting heavy precipitation.
Hainan Island, the only tropical island in China, is affected by typhoons, with frequent typhoon activities and serious heavy precipitation disasters. In addition, the complex topography of Hainan Island, with high inland elevation in the south-central part and low surrounding elevation, has a complex impact on TC precipitation, which increases the difficulty of TC precipitation forecasting. Therefore, it is of great significance to further study the precipitation forecasting technology suitable for Hainan Island. In this study, the DSAEF_LTP model is used to establish a typhoon precipitation forecast scheme, to provide a reference for improving the forecasting ability of typhoon extreme precipitation events over Hainan Island. The second section of this paper introduces the data and methods, and the third section presents the experimental design. The fourth section is the analysis of the results, while the fifth section includes the conclusion and discussion.

2. Data and Methods

2.1. Data

The data include the best-track dataset for TCs in the Northwest Pacific from the Shanghai Typhoon Institute of the China Meteorological Administration, the daily precipitation data (from 1200 UTC on the previous day to 1200 UTC on the current day) for 18 meteorological stations over Hainan Island, provided by the Meteorological Information Center of Hainan Province, and the TC track and intensity forecast data from the official subjective forecasts of the National Meteorological Information Center of the China Meteorological Administration.
An important task of this study was to test the forecasting performance of the DSAEF_LTP model. The forecasting data of other numerical models commonly used for operational weather forecasting were selected to compare with the forecasting results of the DSAEF_LTP model. These models include the China Meteorological Administration Global Forecast System (CMA-GFS), available online (http://data.cma.cn/data/cdcdetail/dataCode/A.0012.0001.html, accessed on 13 January 2022), the European Centre for Medium-Range Weather Forecasts (ECMWF) atmospheric model, available online (https://www.ecmwf.int/en/forecasts/datasets, accessed on 13 January 2022), and the National Centers for Environmental Prediction Global Forecast System (NCEP-GFS), available online (https://www.ncdc.noaa.gov/data-access/model-data/model-datasets/global-forcast-system-gfs, accessed on 14 January 2022). The horizontal resolutions of the data of the CMA-GFS, ECMWF, and NCEP-GFS models were 0.25° × 0.25°, 0.125° × 0.125°, and 0.25° × 0.25°, respectively. To deal with the data uniformly, the horizontal resolutions of the three models were converted into 0.1° × 0.1° by bilinear interpolation.

2.2. Methods

The DSAEF_LTP model proposed by Ren et al. [36] was used for the TC precipitation forecasting experiments. The combination of the dynamic method and statistical method of this model is mainly reflected in two aspects. Firstly, the DSAEF idea is absorbed in the forecast theory, that is, an accurate model (the model describing the real atmosphere, which is the ultimate goal of the development of the current numerical model) is used to make forecasts and an ensemble forecast is adopted to achieve forecasts. Secondly, the forecasting track of the numerical model is directly absorbed, considering that the forecasting track is the biggest advantage of the numerical model of TC forecasting [42]. The characteristic ability of the DSAEF_LTP model is to use the similarity of several physical factors that affect TC precipitation for forecasting, which is different from directly constructing a dynamic framework that affects TC precipitation. The model doesn’t refer to dynamic factors directly but can reflect dynamic factors to some extent. When forecasting the precipitation of a given TC (called target TC) using the DSAEF_LTP model, the forecasting procedure consists of four steps, that is, (1) obtaining the forecast track of the target TC, (2) determining the generalized initial values (GIVs), (3) identifying the similarity of the GIVs, and (4) conducting an ensemble forecasting of TC rainfall. The first step takes advantage of the good performance of the TC track forecasting of numerical weather prediction (NWP). Considering that the TC track and the intensity of the official subjective forecasts of the National Meteorological Information Center are revised from the results of the NWP, the revised forecast can be comparable to the NWP forecast. In the second step, GIVs are the physical variables that may impact TC precipitation, and are determined by both TC internal variables and environmental variables. So far, the model has considered three GIVs: TC track, landfall season, and intensity. The third step refers to the selection of TCs similar to the target TC from the historical TCs within a rectangular region (similarity region) of interest. The fourth step is to make an ensemble of the accumulated precipitation of the selected similar TCs using the best ensemble scheme to obtain the accumulated precipitation forecast of the target TC.
The third step of the DSAEF_LTP model uses the TC track Similarity Area Index (TSAI) [43] as a criterion to discern the TC track similarity of any two TCs. It refers to the area enclosed by any two TC tracks, the connecting line between their starting points, and the connecting line between their ending points. The smaller the TSAI, the more similar the two TC tracks are.
The fourth step of the DSAEF_LTP model assembles historical similar TC precipitation. The separation of TC precipitation uses the Objective Synoptic Analysis Technique (OSAT) [44,45], which distinguishes the TC precipitation from the total precipitation by analyzing the historical daily precipitation of Hainan Island.
Based on simulation experiments of multiple training samples of the DSAEF_LTP model, the optimal forecast scheme applicable to the TC accumulated precipitation over Hainan Island (called DSAEF_LTP_HN) was established. To test the performance of DSAEF_LTP_HN, the threat score (TS), the bias score (BS), the false alarm rate (FAR), and the missing rate (MR) were used as evaluation indices. Since the model mainly focused on TC heavy precipitation forecasting, and the two precipitation thresholds (≥100 mm and ≥250 mm) are often concerned with operations, evaluation indices for the two thresholds of accumulated precipitation forecast by each model (DSAEF_LTP_HN, ECMWF, NCEP-GFS, CMA-GFS) were compared. The formulas of evaluation indices are as follows.
T S = N A N A + N B + N C
B S = N A + N B N A + N C
F A R = N B N A + N B
M R = N C N A + N C
The test evaluation of TC accumulated precipitation is shown in Table 1.
In these formulas, NA is the number of stations correctly forecast for a certain threshold of precipitation, NB is the number of stations falsely forecast for a certain threshold of precipitation, and NC is the number of stations that were missing a forecast for a certain threshold of precipitation.

3. Experimental Design

The experiment based on the DSAEF_LTP model was mainly divided into two parts. One was the simulation experiment, and the other was the forecast experiment. The simulation experiment used the historical TCs affecting Hainan Island in recent years to obtain the optimal forecast scheme applicable to the TC accumulated precipitation over Hainan Island. Then, the optimal forecast scheme was applied to the forecast experiment to examine the forecasting performance of DSAEF_LTP_HN. The specific steps are as follows.
(1)
Establish the data set of historical TCs. The data set contains information on historical TCs affecting Hainan Island, including their precipitation fields, TC locations, and intensity at 6 h intervals from 1960 to 2020. The precipitation fields are identified by the OSAT method.
(2)
Select suitable TC samples to conduct the simulation and forecast experiments of TC accumulated precipitation.
Since the starting time of the TC track and intensity data obtained from the official subjective forecast of the National Meteorological Information Center was 2004, TC samples were selected from 2004. TCs having caused maximum daily precipitation ≥100 mm to Hainan Island were selected. From 2004 to 2020, 37 TCs met the conditions and were selected for experiments (Table 2). Among them, 27 TCs from 2004 to 2017 (Figure 1a) were training samples used for simulation experiments, to establish DSAEF_LTP_HN, and 10 TCs from 2018 to 2020 (Figure 1b) were independent samples used for the forecast experiments to test the forecasting performance of this model.
(3)
Conduct simulation experiments based on the DSAEF_LTP model. The DSAEF_LTP model consists of eight parameters, shown in Table 3, each with several values. These values can produce many numerical combinations, and one combination is one forecast scheme. These combined forecast schemes for 27 training samples affecting Hainan Island were run one by one.
(4)
Conduct forecast experiments. After conducting simulation experiments for 27 training samples, the common forecast schemes of the 27 TCs were screened and the average TS of each common scheme was calculated for two different thresholds of accumulated precipitation (≥250 mm and ≥100 mm). The scheme with the maximum sum (TSsum) of the TS for accumulated precipitation ≥ 250 mm (TS250) and that for accumulated precipitation ≥ 100 mm (TS100) was selected as the best forecast scheme of the DSEAF_LTP model (Figure 2), and was applied to forecast the TC precipitation of 10 independent samples.

4. Results

4.1. Simulation Experiments

Table 3 lists the parameters of the DSAEF_LTP model. Under the current parameter combinations, a single TC may have a total of 7,560,000 sets of forecast schemes, ideally. Since some TCs cannot be fully valued on certain parameters, such as the initial time (P1) or the similarity region (P2), the number of schemes for each TC may be different. Finally, there were a total of 447,853 sets of common schemes for the 27 TCs. The average TSsum of each common scheme was calculated, and the optimal forecast scheme applicable to the TC accumulated precipitation over Hainan Island was established based on the maximum TSsum (solid box in Figure 2). The specific parameters of the optimal scheme are listed in the fourth column of Table 3. When the initial time was selected as 1200 UTC on the day of LTC precipitation starting on land, the similarity region was selected as 20, the threshold of the segmentation ratio of a latitude extreme point was selected as 0.2, the overlapping percentage threshold of two TC tracks was set to 0.5, the seasons of similar historical TCs were controlled from May to November, the TC intensity was set such that the intensity difference between the maximum intensity of the historical TCs during its precipitation process and the target TC intensity was controlled within one grade, the number of similar historical TCs was set to eight, and the ensemble forecast scheme was selected as the 90% percentile value, the forecasting performance was the best.

4.2. Forecast Experiments

The best forecast scheme was applied to precipitation forecasts of independent samples. Figure 3 shows the average TS of TC accumulated precipitation forecast by each model. For accumulated precipitation ≥ 100 mm, DSAEF_LTP_HN has the highest TS of 0.39, and ECMWF ranks second (0.36). NCEP-GFS and CMA-GFS rank third (0.28) and fourth (0.24), respectively. For accumulated precipitation ≥ 250 mm, the TS of ECMWF (0.19) ranks first, mainly because of the better forecasting performance of the accumulated precipitation of Typhoon Ewiniar (2018) and Typhoon Wipha (2019). DSAEF_LTP_HN ranks second, with a score of 0.04, whereas NCEP-GFS and CMA-GFS both have a score of 0, having no forecasting capability for the heavy precipitation of these 10 TCs. From the TSsum, the ranking of the four models is ECMWF, DSAEF_LTP_HN, NCEP-GFS, and CMA-GFS. Therefore, DSAEF_LTP_HN has advantages in forecasting TC heavy precipitation, especially precipitation over 100 mm, and is second only to ECMWF.
The average BS, FAR, and MR of TC accumulated precipitation forecast by each model were further analyzed (Figure 4). For accumulated precipitation ≥100 mm, DSAEF_LTP_HN has the highest FAR, and ECMWF is second only to DSAEF_LTP_HN, while the MR of DSAEF_LTP_HN performs the best, followed by ECMWF. BSs indicate that DSAEF_LTP_HN tends to overestimate the precipitation, and the remaining three models tend to underestimate it. For accumulated precipitation ≥250 mm, ECMWF shows the best performance in terms of MR, followed by DSAEF_LTP_HN. CMA-GFS has a higher FAR than DSAEF_LTP_HN and ECMWF. The FAR of NCEP-GFS is null and the MR is 1, which shows that NCEP-GFS completely underestimated the precipitation, neither forecasting correctly nor overestimating the precipitation. For BSs, ECMWF performed the best, with the BS closest to 1, and DSAEF_LTP_HN performed second best. Therefore, the forecast results of the other three numerical models tended to underestimate the precipitation, whereas DSAEF_LTP_HN tended to overestimate the precipitation. However, in general, DSAEF_LTP_HN and ECMWF show better forecasting performance.
To better understand the characteristics of DSAEF_LTP_HN’s forecasting performance for TC precipitation over Hainan Island, two groups, the top four TCs, with higher TSsums and the bottom four TCs, with lower TSsums, were selected from independent samples, and the average TSs, BSs, FARs, and MRs of the two groups were compared. For the top four TCs with higher TSsums (Figure 5a), for accumulated precipitation ≥ 100 mm, DSAEF_LTP_HN has the highest TS and the lowest MR, but its false forecast is obvious. For the accumulated precipitation ≥ 250 mm, DSAEF_LTP_HN ranks second in TS and MR following ECMWF, but also had the phenomenon of overestimating precipitation. Therefore, for the top four TCs with higher TSsums, the performance of each evaluation index for each model was similar to that of all the 10 independent samples.
For the bottom four TCs with lower TSsums (Figure 5b), for accumulated precipitation ≥ 100 mm, the TS of DSAEF_LTP_HN performed second, following CMA-GFS, with fewer missed stations and more false stations. The false forecast led to the poor performance of other related indices.
From the above, whether from the view of all the samples in the forecast experiments, the samples that performed well in the forecast experiments, or the samples that performed poorly in the forecast experiments, it was found that DSAEF_LTP_HN has advantages in forecasting TC heavy precipitation, especially precipitation over 100 mm, but there was still a phenomenon of false forecasts.
To further explore the characteristics of DSAEF_LTP_HN’s forecasting performance for TC precipitation over Hainan Island, the TC track, impact period (the number of days TCs have generated precipitation on Hainan Island), station maximum daily precipitation, and station maximum accumulated precipitation (Figure 6 and Figure 7) of the top four TCs with higher TSsums and the bottom four TCs with lower TSsums were compared. Three of the top four TCs with higher TSsums made landfall on Hainan Island and hovered near Hainan Island and its nearby sea with a long impact period, with the average impact period reaching as long as 5.25 days. They also caused large precipitation amounts, with the average station maximum daily precipitation reaching 215 mm, and the average station maximum accumulated precipitation reaching 347 mm. The bottom four TCs with lower TSsums all moved straight west–northwest and only one made landfall on Hainan Island, with a short impact period of only 2.00 days on average. The precipitation they caused was weak, with a station maximum daily precipitation of 133 mm on average and a station maximum accumulated precipitation of 147 mm on average. Therefore, the longer the TC impacts on Hainan Island and the heavier the precipitation caused to Hainan Island, the better the forecasting performance of DSAEF_LTP_HN for TC precipitation. This is because this model pays more attention to extreme precipitation, and the stronger the precipitation, the better the forecast ability. The longer the impact period, the longer the duration of precipitation, and the stronger the TC precipitation may be.

4.3. Analysis of Typical Cases

To prove that DSAEF_LTP_HN has advantages in forecasting TC heavy precipitation, especially precipitation over 100 mm, despite the phenomenon of false forecasts discussed in Section 4.2, two typical cases were selected to discuss it further from the two groups, that is, Typhoon Kajiki (2019), with good forecasting performance, and Typhoon Vamco (2020), with poor forecasting performance.
The spatial distribution characteristics of precipitation forecast by each model were compared. From the observation of Typhoon Kajiki (Figure 8), the accumulated precipitation of over 250 mm was distributed in the northeast of Hainan Island, and DSAEF_LTP_HN forecast this heavy precipitation center in the northeast, but overestimated the accumulated precipitation of over 400 mm, whereas the other three numerical models all missed the accumulated precipitation of more than 250 mm. Therefore, DSAEF_LTP_HN can capture the heavy precipitation center for accumulated precipitation of over 250 mm, whereas the other models have no forecasting capability, that is, DSAEF_LTP_HN has advantages for heavy precipitation forecasting.
Analyzing the accumulated precipitation of Typhoon Vamco (Figure 9), DSAEF_LTP_HN could also successfully forecast accumulated precipitation of over 100 mm, whereas other models did not have this forecasting capability. However, DSAEF_LTP_HN still showed false forecasts.
From the above, it is proved further that DSAEF_LTP_HN can successfully forecast the center of heavy precipitation when other numerical models cannot, but for some TC heavy precipitation, there is still a phenomenon of false forecasts, which necessitates further improvement.

5. Conclusions and Discussion

Based on the DSAEF_LTP model, the optimal scheme applicable to the TC accumulated precipitation forecast over Hainan Island, China was established using the best-track dataset for TCs in the Northwest Pacific from the Shanghai Typhoon Institute of the China Meteorological Administration, the daily precipitation data of the meteorological observatories over Hainan Island from the Meteorological Information Center of Hainan Province, and the TC track and intensity data from the official subjective forecasts of the National Meteorological Information Center of the China Meteorological Administration. Then, the forecasting performance of DSAEF_LTP_HN was further tested. The main conclusions are as follows.
(1)
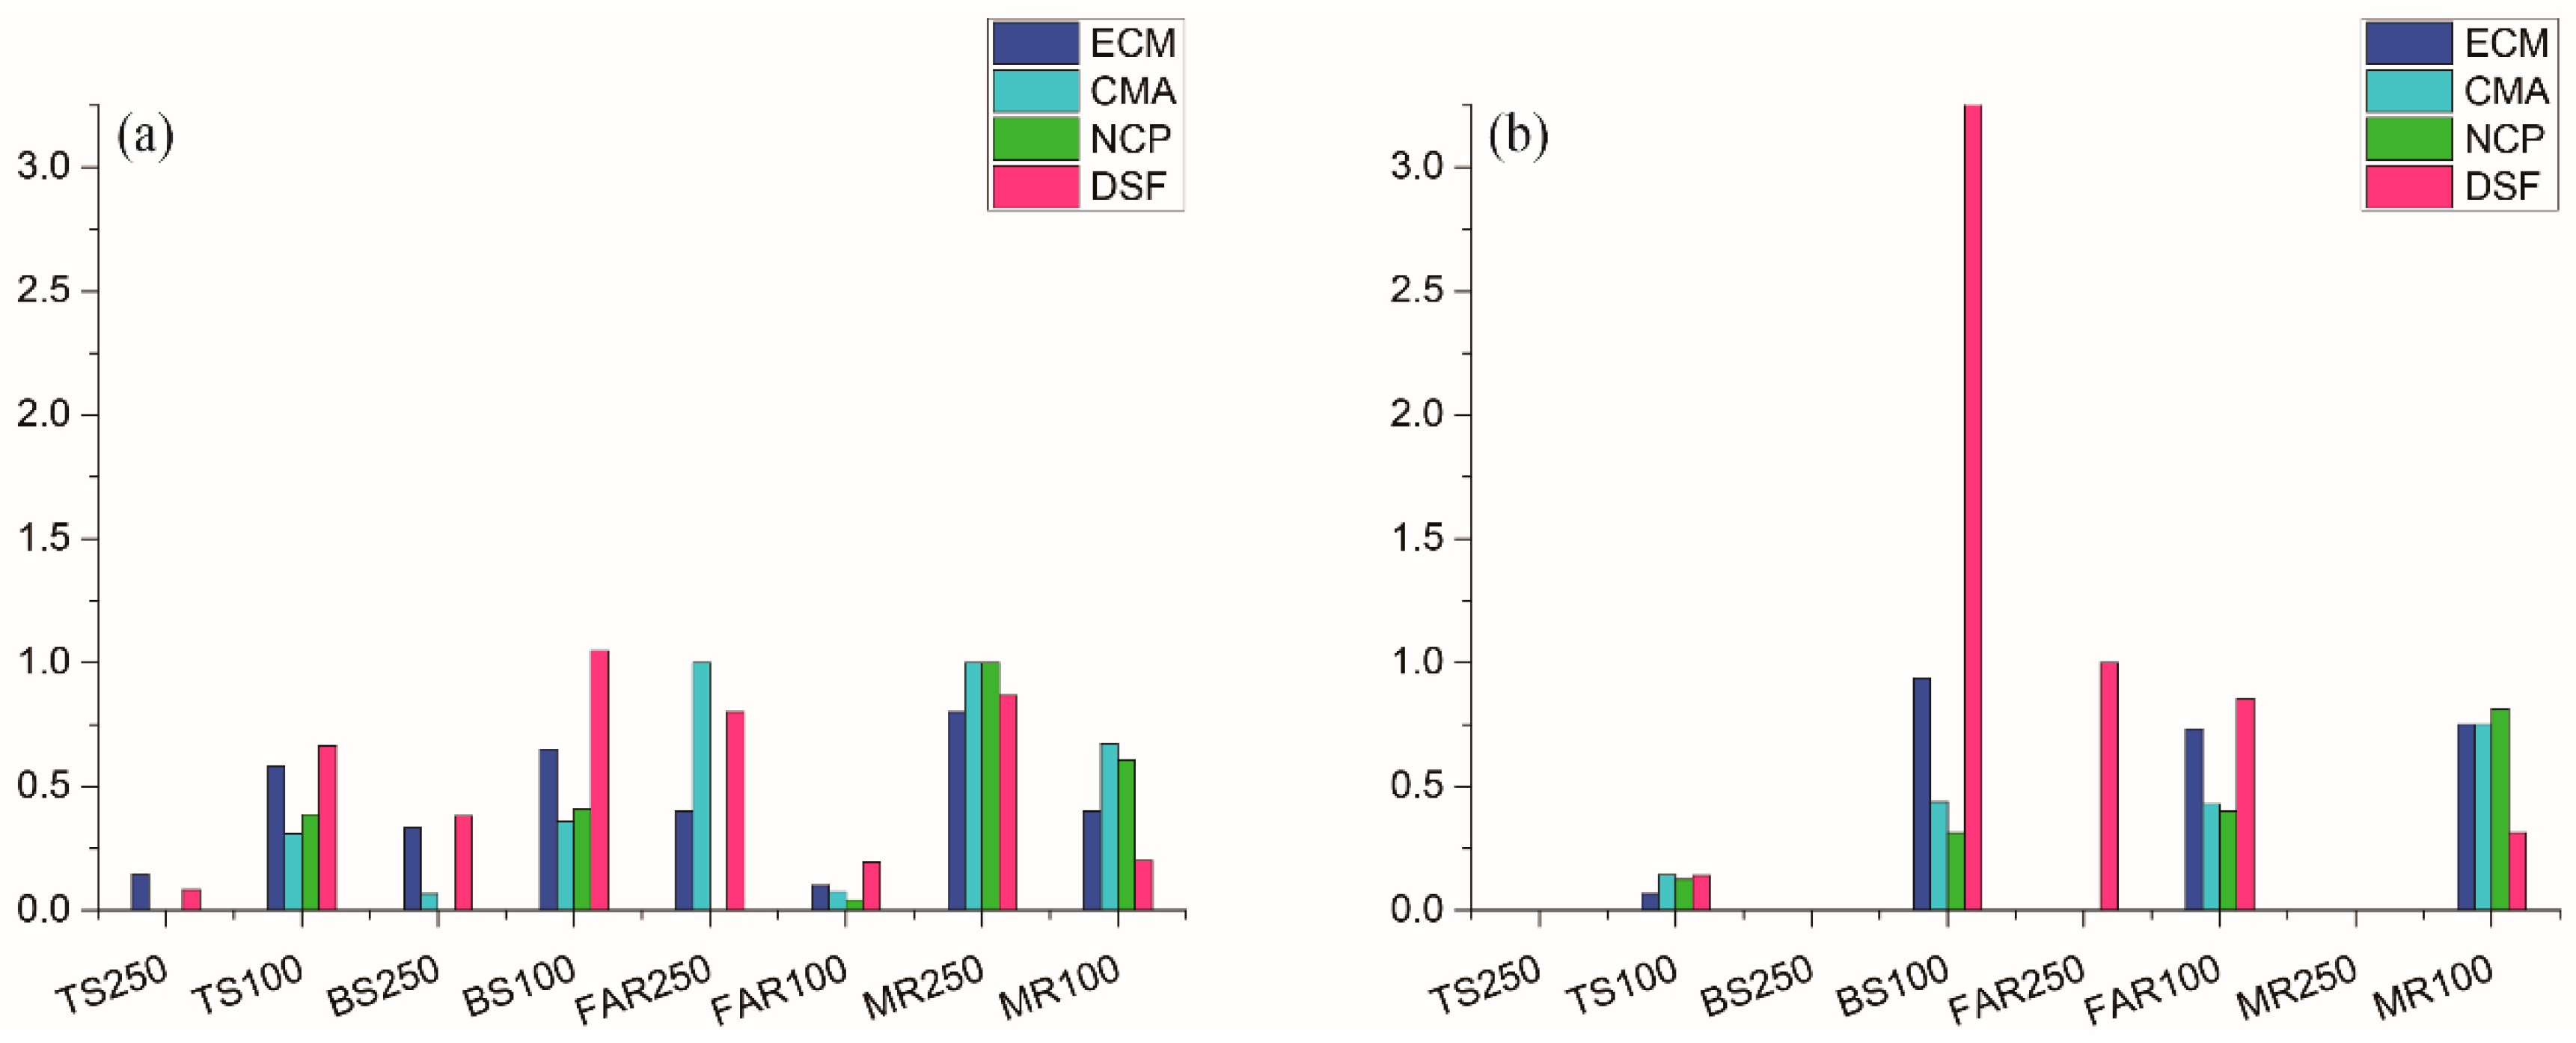
Compared with other numerical models, for accumulated precipitation ≥ 100 mm, the TS of the DSAEF_LTP_HN forecast reaches 0.39, ranking first, followed by ECMWF, NCEP-GFS, and CMA-GFS, with TSs of 0.36, 0.28, and 0.24, respectively. For accumulated precipitation ≥ 250 mm, the TS of ECMWF ranks first (0.19), and the DSAEF_LTP_HN forecast ranks second (0.04).
(2)
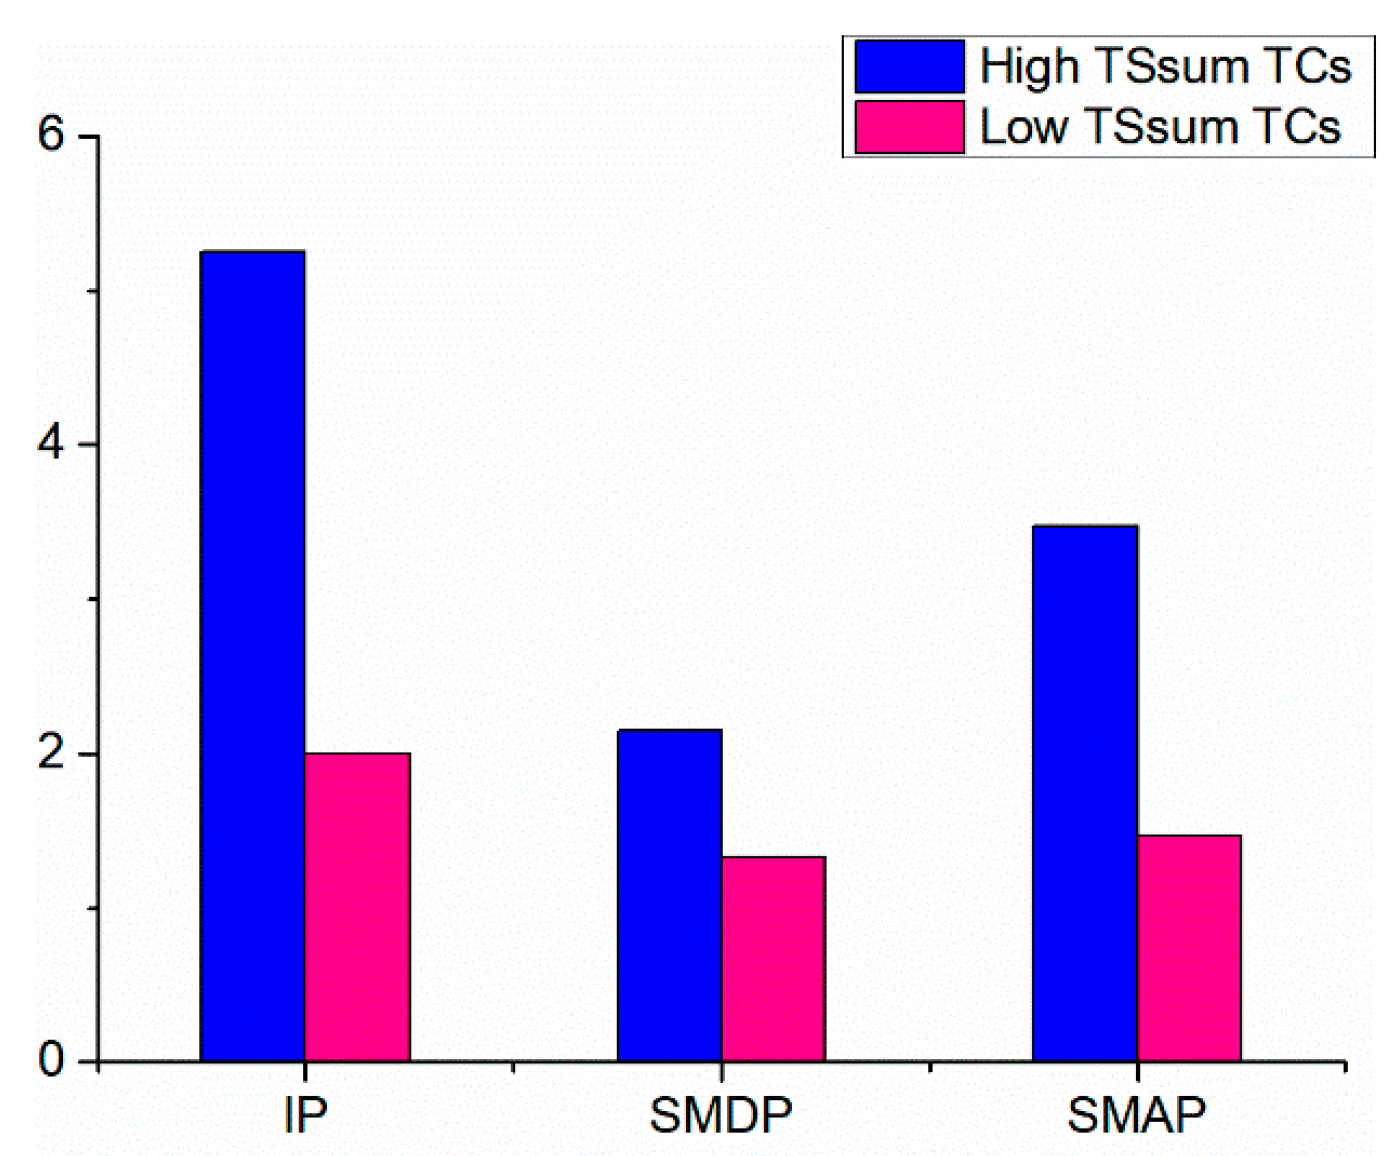
The forecasting performance of DSAEF_LTP_HN for TC precipitation is closely related to TC characteristics. The longer the TC impacts on Hainan Island and the heavier the precipitation caused to Hainan Island, the better the forecasting performance of DSAEF_LTP_HN is.
(3)
Further analysis shows that the distribution of heavy precipitation areas forecast by DSAEF_LTP_HN is reasonable, and the center of heavy precipitation can be successfully captured, albeit with heavier precipitation than observations sometimes.
Therefore, DSAEF_LTP_HN is promising for precipitation forecasting for TCs affecting Hainan Island. It is believed that with the continuous improvement and development of DSAEF_LTP_HN, it will play an increasingly important role in the forecasting of TC precipitation over Hainan Island. At present, DSAEF_LTP_HN takes into account track similarity, seasonal similarity, and intensity similarity when discriminating the similarity among the target TC and historical TCs. Moreover, TC translation speed, as an important impact factor on TC precipitation [11], should also be considered to introduce into the DSAEF_LTP model. Future research work will focus on adding the parameter of the TC translation speed similarity into the model so that DSAEF_LTP_HN can be further improved.

Author Contributions

Conceptualization, X.J., F.R. and Y.M.; Data curation, X.J. and Y.M.; Formal analysis, X.J. and C.D.; Methodology, Y.M., F.R. and X.J.; Software, J.H.; Supervision, F.R.; Visualization, Y.M. and J.S.; Writing—original draft, X.J. and Y.M.; Writing—review and editing, X.J., Y.M., C.D. and J.H. All authors have read and agreed to the published version of the manuscript.

Funding

This research was jointly supported by the Regional Innovation and Development Joint Fund of the National Natural Science Foundation of China (Grant No. U21A6001), the Key Laboratory of South China Sea Meteorological Disaster Prevention and Mitigation of Hainan Province (Grant No. SCSF202102), the Hainan Natural Science Foundation of China (Grant No. 420QN372, 422RC803), the China Meteorological Administration Review Special Project (Grant No. FPZJ2023-101), the National Natural Science Foundation of China (Grant No. 42275037), the Hainan Provincial Key R&D Program of China (Grant No. ZDYF2019213), and the Specific Research Fund of Innovation Platform for Academicians of Hainan Province (YSPTZX202143).

Institutional Review Board Statement

Not applicable.

Informed Consent Statement

Not applicable.

Data Availability Statement

The datasets generated during and/or analyzed during the current study are available from the corresponding author upon reasonable request.

Conflicts of Interest

The authors declare no conflict of interest.

References

  1. Ge, X.; Li, T.; Zhang, S.; Pen, M.G. What causes the extremely heavy rainfall in Taiwan during Typhoon Morakot (2009)? Atmos. Sci. Lett. 2010, 11, 46–50. [Google Scholar] [CrossRef]
  2. Ren, F.; Wu, G.; Wang, X.; Wang, Y.; Dong, W.; Liang, J.; Bai, L. Tropical Cyclones Affecting China over the Last 60 Years; China Meteorological Press: Beijing, China, 2011; 203p. (In Chinese) [Google Scholar]
  3. Yu, Z.; Wang, Y.; Xu, H.; Davidson, N.; Chen, Y.; Chen, Y.; Yu, H. On the Relationship between Intensity and Rainfall Distribution in Tropical Cyclones Making Landfall over China. J. Appl. Meteor. Climatol. 2017, 56, 2883–2901. [Google Scholar] [CrossRef]
  4. Jiang, X.; Ren, F.; Li, Y.; Qiu, W.; Ma, Z.; Cai, Q. Characteristics and preliminary causes of tropical cyclone extreme rainfall events over Hainan Island. Adv. Atmos. Sci. 2018, 35, 580–591. [Google Scholar] [CrossRef]
  5. Chen, L.; Luo, Z.; Li, Y. Research advances on tropical cyclone landfall process. Acta Meteorol. Sin. 2004, 62, 541–549. (In Chinese) [Google Scholar]
  6. Xiao, Q.; Kuo, Y.; Sun, J.; Lee, W.; Barker, D.; Lim, E. An approach of radar reflectivity data assimilation and its assessment with the inland QPF of Typhoon Rusa (2002) at landfall. J. Appl. Meteor. Climatol. 2007, 46, 14–22. [Google Scholar] [CrossRef] [Green Version]
  7. Xue, G.; Zhang, J.; Chen, H.; Zhu, X. The comparisons of different convective parameterization schemes applying precipitation’s forecast of typhoon landing on Zhejiang and Fujian provinces. Plateau Meteor. 2007, 26, 765–773. (In Chinese) [Google Scholar]
  8. Yuan, B.; Fei, J.; Wang, Y.; Lu, Q. 4DVAR numerical simulation analysis using ATOVS data and asymmetrical Bogus data on landing Typhoon Weipha. Meteor. Mon. 2010, 36, 13–20. (In Chinese) [Google Scholar]
  9. Zhang, F.; Weng, Y.; Kuo, Y.; Whitaker, J.S.; Xie, B. Predicting Typhoon Morakot’s Catastrophic Rainfall with a Convection-Permitting Mesoscale Ensemble System. Weather Forecast. 2010, 25, 1816–1825. [Google Scholar] [CrossRef] [Green Version]
  10. Zhao, K.; Li, X.; Xue, M.; Jou, B.J.D.; Lee, W.C. Short-term forecasting through intermittent assimilation of data from Taiwan and mainland China coastal radars for Typhoon Meranti (2010) at landfall. J. Geophys. Res. Atmos. 2012, 117, D06108. [Google Scholar] [CrossRef] [Green Version]
  11. Hsiao, L.-F.; Yang, M.-J.; Lee, C.-S.; Kuo, H.-C.; Shih, D.-S.; Tsai, C.-C.; Wang, C.-J.; Chang, L.-Y.; Chen, D.Y.-C.; Feng, L.; et al. Ensemble forecasting of typhoon rainfall and floods over a mountainous watershed in Taiwan. J. Hydrol. 2013, 506, 55–68. [Google Scholar] [CrossRef] [Green Version]
  12. Fang, X.; Kuo, Y. Improving Ensemble-Based Quantitative Precipitation Forecasts for Topography-Enhanced Typhoon Heavy Rainfall over Taiwan with a Modified Probability-Matching Technique. Mon. Weather Rev. 2013, 141, 3908–3932. [Google Scholar] [CrossRef] [Green Version]
  13. Yu, X.; Park, S.K.; Lee, Y.H.; Choi, Y.S. Quantitative precipitation forecast of a tropical cyclone through optimal parameter estimation in a convective parameterization. SOLA 2013, 9, 36–39. [Google Scholar] [CrossRef] [Green Version]
  14. Zhang, H.; Pu, Z. Influence of Assimilating Surface Observations on Numerical Prediction of Landfalls of Hurricane Katrina (2005) with an Ensemble Kalman Filter. Mon. Weather Rev. 2014, 142, 2915–2934. [Google Scholar] [CrossRef]
  15. Hong, J.; Fong, C.; Yu, Y.; Tzeng, C. Ensemble Typhoon Quantitative Precipitation Forecasts Model in Taiwan. Weather Forecast. 2015, 30, 217–237. [Google Scholar] [CrossRef]
  16. Cheng, Z.; Chen, L.; XU, X.; Peng, T. Research progress on typhoon heavy rainfall in China for last ten years. Meteor. Mon. 2005, 31, 3–9. (In Chinese) [Google Scholar]
  17. Marchok, T.; Rogers, R.; Tuleya, R. Validation Schemes for Tropical Cyclone Quantitative Precipitation Forecasts: Evaluation of Operational Models for U.S. Landfalling Cases. Weather Forecast. 2007, 22, 726–746. [Google Scholar] [CrossRef] [Green Version]
  18. Tuleya, R.E.; DeMaria, M.; Kuligowski, R.J. Evaluation of GFDL and Simple Statistical Model Rainfall Forecasts for U.S. Landfalling Tropical Storms. Weather Forecast. 2007, 22, 56–70. [Google Scholar] [CrossRef]
  19. Huang, W.; Yu, H.; Liang, X. Evaluation of GRAPES-TCM rainfall forecast for China landfall tropical cyclone in 2006. Acta Meteor. Sin. 2009, 67, 892–901. (In Chinese) [Google Scholar]
  20. Yu, Z.; Chen, Y.; Ebert, B.; Davidson, N.; Xiao, Y.; Yu, H.; Duan, L. Benchmark rainfall verification of landfall tropical cyclone forecasts by operational ACCESS-TC over China. Meteorol. Appl. 2020, 27, e1842. [Google Scholar] [CrossRef] [Green Version]
  21. Wang, Y.; Shen, X.; Chen, D. Verification of tropical cyclone rainfall predictions from CMA and JMA global models. J. Trop. Meteorol. 2012, 18, 537–542. [Google Scholar]
  22. Qu, A.; Ma, S.; Zhang, J. Updated experiments of tropical cyclone initialization in global model T639. Meteor. Mon. 2016, 42, 664–673. (In Chinese) [Google Scholar]
  23. Gong, J.; Niu, X.; Li, H. Forecast Epitomized of Typhoon’s Precipitation in East China. Chin. J. Atmos. Sci. 1995, 19, 101–110. (In Chinese) [Google Scholar] [CrossRef]
  24. Yue, C.; Chen, P.; Lei, X.; Yang, Y. Preliminary study of short-term quantitative precipitation forecast method for landfalling typhoon. Meteorol. Sci. Technol. 2006, 34, 7–11. (In Chinese) [Google Scholar]
  25. Wei, C. RBF Neural Networks Combined with Principal Component Analysis Applied to Quantitative Precipitation Forecast for a Reservoir Watershed during Typhoon Periods. J. Hydrometeorol. 2012, 13, 722–734. [Google Scholar] [CrossRef]
  26. Wei, C. Wavelet Support Vector Machines for Forecasting Precipitation in Tropical Cyclones: Comparisons with GSVM, Regression, and MM5. Weather Forecast. 2012, 27, 438–450. [Google Scholar] [CrossRef]
  27. Li, Q.; Lan, H.; Chan, C.L.J.; Cao, C.; Li, C.; Wang, X. An Operational Statistical Scheme for Tropical Cyclone Induced Rainfall Forecast. J. Trop. Meteorol. 2015, 21, 101–110. [Google Scholar]
  28. Marks, F.D.; Kappler, G.; DeMaria, M. Development of a tropical cyclone rainfall climatology and persistence (R-CLIPER) model. In Proceedings of the 25th Conference on Hurricanes and Tropical Meteorology, San Diego, CA, USA, 29 April–3 May 2002; pp. 327–328. [Google Scholar]
  29. Lee, C.S.; Huang, L.R.; Shen, H.S.; Wang, S.T. A climatology model for forecasting typhoon rainfall in Taiwan. Nat. Hazards 2006, 37, 87–105. [Google Scholar] [CrossRef]
  30. Lonfat, M.; Rogers, R.; Marchok, T.; Marks, F.D. A Parametric Model for Predicting Hurricane Rainfall. Mon. Weather Rev. 2007, 135, 3086–3097. [Google Scholar] [CrossRef]
  31. Kidder, S.Q.; Knaff, J.A.; Kusselson, S.J.; Turk, M.; Ferraro, R.R.; Kuligowski, R.J. The Tropical Rainfall Potential (TRaP) Technique. Part I: Description and Examples. Weather Forecast. 2005, 20, 456–464. [Google Scholar] [CrossRef] [Green Version]
  32. Liu, C. The Influence of Terrain on the Tropical Rainfall Potential Technique in Taiwan. Weather Forecast. 2009, 24, 785–799. [Google Scholar] [CrossRef]
  33. Ebert, E.E.; Turk, M.; Kusselson, S.J.; Yang, J.; Seybold, M.; Keehn, P.R.; Kuligowski, R.J. Ensemble Tropical Rainfall Potential (eTRaP) Forecasts. Weather Forecast. 2011, 26, 213–224. [Google Scholar] [CrossRef]
  34. Zhong, Y.; Yu, H.; Teng, W.; Chen, P. A dynamic similitude scheme for tropical cyclone quantitative precipitation forecast. J. Appl. Meteor. Sci. 2009, 20, 17–27. (In Chinese) [Google Scholar]
  35. Li, B.; Zhao, S. Development of forecasting model of typhoon type rainstorm by using SMAT. Meteor. Mon. 2009, 35, 3–12. (In Chinese) [Google Scholar]
  36. Ren, F.; Ding, C.; Zhang, D.; Chen, D.; Ren, H.; Qiu, W. A Dynamical-Statistical-Analog Ensemble Forecast Model: Theory and an Application to Heavy Rainfall Forecasts of Landfalling Tropical Cyclones. Mon. Weather Rev. 2020, 148, 1503–1517. [Google Scholar] [CrossRef]
  37. Ding, C.; Ren, F.; Liu, Y.; McBride, J.L.; Feng, T. Improvement in the Forecasting of Heavy Rainfall over South China in the DSAEF_LTP Model by Introducing the Intensity of the Tropical Cyclone. Weather Forecast. 2020, 35, 1967–1980. [Google Scholar] [CrossRef]
  38. Jia, L.; Jia, Z.; Ren, F.; Ding, C.; Wang, M.; Feng, T. Introducing TC intensity into the DSAEF_LTP model and simulating precipitation of super-typhoon Lekima (2019). Q. J. R. Meteorol. Soc. 2020, 146, 3965–3979. [Google Scholar] [CrossRef]
  39. Jia, L.; Ren, F.; Ding, C.; Jia, Z.; Wang, M.; Chen, Y.; Feng, T. Improvement of the ensemble methods in the dynamical-statistical-analog ensemble forecast model for landfalling typhoon precipitation. J. Meteorol. Soc. Jpn. 2022, 100, 2022–2592. [Google Scholar] [CrossRef]
  40. Ma, Y.; Ren, F.; Jia, L.; Ding, C. Experiments with the Improved Dynamical-Statistical-Analog Ensemble Forecast Model for Landfalling Typhoon Precipitation over South China. J. Trop. Meteorol. 2022, 28, 139–153. [Google Scholar] [CrossRef]
  41. Qin, S.; Jia, L.; Ding, C.; Ren, F.; McBride, J.L.; Li, G. Experiments of DSAEF_LTP Model with Two Improved Parameters for Accumulated Precipitation of Landfalling Tropical Cyclones over Southeast China. J. Trop. Meteorol. 2022, 28, 286–296. [Google Scholar]
  42. Ren, F.; Jia, L.; Wu, C.; Ding, C.; Zhang, D.; Jia, Z.; Ma, Y.; Qiu, W. Advances in dynamic-statistical analog ensemble forecasting and its application to precipitation prediction of landfalling typhoons: A renewed understanding. Acta Meteor. Sin. 2023, 81, 193–204. (In Chinese) [Google Scholar]
  43. Ren, F.; Qiu, W.; Ding, C.; Jiang, X.; Wu, L.; Xu, Y. An Objective Track Similarity Index and Its Preliminary Application to Predicting Precipitation of Landfalling Tropical Cyclones. Weather Forecast. 2018, 33, 1725–1742. [Google Scholar] [CrossRef]
  44. Ren, F.; Gleason, B.; Easterling, D.R. A technique for partitioning tropical cyclone precipitation. J. Trop. Meteorol. 2001, 17, 308–313. (In Chinese) [Google Scholar]
  45. Ren, F.; Wang, Y.; Wang, X.; Li, W. Estimating tropical cyclone precipitation from station observations. Adv. Atmos. Sci. 2007, 24, 700–711. [Google Scholar] [CrossRef]
Figure 1. TC tracks of experimental samples. (a) Training samples; (b) Independent samples.
Atmosphere 14 01210 g001
Figure 2. The distribution of average TS in simulation experiments (solid circles indicate common schemes, and the solid box indicates the optimal forecast scheme).
Atmosphere 14 01210 g002
Figure 3. Comparison of average TS of TC accumulated precipitation forecast in forecast experiments among DSAEF_LTP_HN, ECMWF, NCEP-GFS, and CMA-GFS.
Atmosphere 14 01210 g003
Figure 4. Comparison of average BIAS, FAR, and MR of accumulated precipitation forecast in forecast experiments among DSAEF_LTP_HN, ECMWF, NCEP-GFS, and CMA-GFS.
Atmosphere 14 01210 g004
Figure 5. Comparison of average TS, BIAS, FAR, and MR of TC accumulated precipitation forecast among DSAEF_LTP_HN, ECMWF, NCEP-GFS, and CMA-GFS. (a) The top four TCs with higher TSsums in forecast experiments; (b) the bottom four TCs with lower TSsums in forecast experiments.
Atmosphere 14 01210 g005
Figure 6. Tracks of TCs with different forecasting performances. (a) The top four TCs with higher TSsums in forecast experiments; (b) the bottom four TCs with lower TSsums in forecast experiments.
Atmosphere 14 01210 g006
Figure 7. Comparison of impact period (IP, unit: day), station maximum daily precipitation (SMDP, unit: 100 mm), and station maximum accumulated precipitation (SMAP, unit: 100 mm) of TCs with different forecasting performances in forecast experiments.
Atmosphere 14 01210 g007
Figure 8. Spatial distribution of the observation and forecasts of accumulated precipitation (unit: mm) during Typhoon Kajiki (2019). (a) Observation; (b) forecast of DSAEF_LTP_HN; (c) forecast of ECMWF; (d) forecast of NCEP-GFS; (e) forecast of CMA-GFS.
Atmosphere 14 01210 g008
Figure 9. Spatial distribution of the observation and forecasts of accumulated precipitation (unit: mm) during Typhoon Vamco (2022). (a) Observation; (b) forecast of DSAEF_LTP_HN; (c) forecast of ECMWF; (d) forecast of NCEP-GFS; (e) forecast of CMA-GFS.
Atmosphere 14 01210 g009
Table 1. The test evaluation table of TC accumulated precipitation.
ObservationForecast
≥T<T
≥T N A N C
<T N B N D
Table 2. List of TCs for experiments.
Sample TypeYearTC Name
Training samples2005Vicente, Damrey, Kai-Tak
2006Jelawat, Prapiroon
2007Lekima
2008Hagupit, Higos
2009Goni, Ketsana, Parma
2011Haima, Nock-Ten, Nesat, Nalgae
2012Kai-Tak, Son-Tinh
2013Rumbia, Jebi, Utor, Haiyan
2014Rammasun, Kalmaegi
2016Mirinae, Aere, Sarika
2017Doksuri
Independent samples2018Ewiniar, Son-Tinh, Mangkhut
2019Wipha, Podul, Kajiki
2020Noul, Nangka, Molave, Vamco
Table 3. Parameters of the DSAEF_LTP model and parameter values of the optimal forecast scheme for TC accumulated precipitation over Hainan Island.
Parameters
(1–8)
Tested ValuesNumber
of Values
Parameter Values of the Optimal Forecast Scheme
Initial time (P1)1–3 for 12:00, 00:00 UTC on the day of LTC precipitation falling on land and 12:00 UTC on the day before31
Similarity region (P2)A TSAI parameter: decided by the predicted TC track, initial time, and diameter of the TC. There are 20 experimental values (1–20)2020
Threshold of the segmentation ratio of a latitude extreme point (P3)A TSAI parameter: 1–3 for 0.1, 0.2, and 0.3, respectively32
The overlapping percentage threshold of two TC tracks (P4)A TSAI parameter: 1–6 for 0.9, 0.8, 0.7, 0.6, 0.5 and 0.4, respectively65
Seasonal similarity (P5)1–5 for the whole year, May to November, July to September, the same landfall month with the target TC, and within 15 days of the target TC landfall time, respectively52
Intensity similarity (P6)Four categories: average and maximum intensity on first rainy day, average and maximum intensity on all rainy days. Five levels: all grades (grade 1 tropical depression to grade 6 super typhoon), same grade and above, same grade and below, same grade, and less than one grade, respectively4 × 54, 5
Number (N) of
TCs with the top N closest similarity (P7)
1–10 for 1, 2, …, and 10, respectively108
Ensemble forecast scheme (P8)Mean, maximum, optimal percentile, fuse, probability matching mean (PM), equal difference–weighted mean (ED-WM), TSAI-weighted mean (TSAI-WM)73
Total number of schemes3 × 20 × 3 × 6 × 5 × 4 × 5 × 10 × 7 = 7,560,000
Disclaimer/Publisher’s Note: The statements, opinions and data contained in all publications are solely those of the individual author(s) and contributor(s) and not of MDPI and/or the editor(s). MDPI and/or the editor(s) disclaim responsibility for any injury to people or property resulting from any ideas, methods, instructions or products referred to in the content.

