Article

Extremeness Comparison of Regional Drought Events in Yunnan Province, Southwest China: Based on Different Drought Characteristics and Joint Return Periods

1
National Institute of Natural Hazards, Ministry of Emergency Management of China, Beijing 100085, China
2
Key Laboratory of Compound and Chained Natural Hazards Dynamics, Ministry of Emergency Management of China, Beijing 100085, China
3
School of Geomatics and Urban Spatial Informatics, Beijing University of Civil Engineering and Architecture, Beijing 102616, China
4
College of Geoscience and Surveying Engineering, China University of Mining & Technology (Beijing), Beijing 100083, China
*
Author to whom correspondence should be addressed.
Atmosphere 2023, 14(7), 1153; https://doi.org/10.3390/atmos14071153
Submission received: 16 June 2023 / Revised: 13 July 2023 / Accepted: 14 July 2023 / Published: 16 July 2023

Abstract

:
Droughts frequently occur in Yunnan province, the southwest of China, which leads to crop loss, ecosystem degradation, and difficulties in drinking water for people. In order to assess and compare the extremeness for different drought events, this study quantified it by utilizing the joint return period of drought multi-characteristics. Three characteristics at the regional scale: drought duration, severity, and affected areas were obtained by a simple regional drought process methodology, and their relationship was considered based on three types of Archimedean Copulas. Standard Precipitation Evapotranspiration Index at a six-month time scale was selected as the optimal drought index based on actual drought impact data. Results showed that drought events in Yunnan province were mostly short drought duration, low severity, and high drought-affected areas. By comparing the historical reported droughts’ loss, the return periods of drought events calculated by the combination of duration and severity and drought-affected area are much more suitable to reflect the real drought situations than those calculated by one- or two-dimensional drought characteristics, especially for extreme drought events. On average, the drought in Yunnan province was almost shown a return period of ~10 yr. The frequency of droughts in Yunnan province has gradually increased due to climate change, and droughts with ~100 yr or even larger return periods occurred in 2009–2010 and 2011–2013.

1. Introduction

Drought is the main natural disaster that causes global grain production reduction. It also causes ecological disasters such as forest fires and vegetation degradation, as well as basic livelihood problems such as water storage for people in ecologically fragile areas. What’s more, it has caused millions of deaths throughout human history [1]. Human activities’ impact on the global climate has resulted in an increase in severe drought events, and changes in climatic parameters are expected to escalate the severity of droughts. Being influenced by climate change, it is projected that the severity, duration, and affected area of drought may increase continuously in the future [2,3].
Droughts are generalized water deficit phenomenon that can be characterized quantitatively by different indices. Reasonably, the precipitation anomaly percentage (Pa) (Henry, 1906) [4] was initiated and used widely to assess the degree of drought for several decades. After the Standardized Precipitation Index (SPI) was developed by McKee et al. [5], it was demonstrated to be suitable for drought comparison at different spatial and temporal scales. In addition to precipitation factors, temperature, evapotranspiration, vegetation, soil moisture, etc., are also significant factors reflecting drought. Thus, drought indices considering multiple factors were developed one after another, such as Relative Moisture Index (MI) [6], Palmer Drought Severity Index (PDSI) [7], Standard Precipitation Evapotranspiration Index (SPEI) [8], Multivariate Standard Drought Index (MSDI) [9]. With the development of remote sensing technology, drought indices based on remotely sensed data are mushrooming [10,11]. These drought indices have been developed for drought monitoring throughout the world or regions [12,13]. However, the applicability of the indices varies across regions for reflecting the real drought impact [14]. Therefore, it is necessary to assess drought events for one designated study area based on the optimal drought index, which shows a higher link with actual drought impact [15].
To a certain extent, the drought index only reflects the severity of the drought. To properly evaluate or compare any changes in drought events, additional characteristics of droughts are required. Due to the need to incorporate these characteristics into any modeling, an analysis based on drought frequency alone is not enough if it is not quantitatively related to other information such as duration, severity, and areal extent [16]. Assessing the risk of drought events by integrating different drought characteristics is relevant. The Copula joint probability function can establish a dependence model for multidimensional random variables and is widely used in the study of multidimensional drought characteristics. Due to the dynamic nature of the spatial and temporal evolution of drought impact areas, previous research often used the run theory to identify the drought duration and severity at the site scale and then conducted bivariate drought return period analysis using the Copula [17,18,19]. Although site-based drought return period analysis can provide useful local information, these results seem to embed with high uncertainty in drought management or drought risk assessment in a wide area. During the development progress for one drought event, the timing and location of the drought both influence its consequences. Droughts are considered regional when the spatial extent exceeds a certain threshold [20], so it is crucial to include the affected area of drought with duration and severity in the drought risk studies [21,22,23].
Droughts can occur in both arid and humid areas across the world. Despite being located in the humid climate zone, the region of Southwest China has frequently been hit by exceptional and sustained droughts in recent years, with the summer of 2006, the autumn of 2009 to the spring of 2010, the summer of 2011, and the winter of 2019 to the spring of 2020 [24,25,26]. As one of the five regions that make up Southwest China, Yunnan Province (YP) suffered from frequent and the most severe drought disaster since 2006 [22,27,28]. The drought disaster record in YP indicated that the crop area affected by droughts reached a total of 308,349 km2 during 1972–2020 [26]. Wang and Yuan [29] indicate that anthropogenic climate change increased the risk of hot and dry extremes in 2019 over YP by 123–157% and 13–23%, respectively. Many researchers have paid attention to the drought evolution in YP. For instance, Li et al. [30] analyzed the drought trend and drought coverage area at various timescales over YP, and the results showed that droughts in YP occurred frequently, and the change point was detected in 2002. Wang et al. [31] used Copulas to analyze the joint return period of drought events by considering two-dimensional drought characteristics: duration and severity. Due to the impact of climate change, extreme events occur frequently in different regions, and it is particularly important to combine multiple characteristics to evaluate the extremity of drought events. However, the joint return period of three-dimensional drought characteristics that include the drought duration, severity, and affected area has been few explorations in YP.
Therefore, this study addresses the spatiotemporal variations of drought duration, severity, and affected areas, using the regional drought characteristics extraction method, and discusses the drought extremeness of YP based on the return periods analysis. The objectives of this study are (1) to select the optimal drought index for the assessment of drought events in YP, (2) to identify the spatiotemporal characteristics of drought events and verify by the actual records of drought events, and (3) to discuss the joint return periods of droughts using Copulas, as well as the differences of return period combining drought characteristics in different dimensions.

2. Materials and Methods

2.1. Study Area

YP is located in Southwestern China, covered with a total area of 3.94 × 10⁵ km2. The main types of land use in the province are forest land, grassland, and cultivated land, which account for 57%, 23%, and 18%, respectively (Figure 1). This region is the river source or the upstream of many major rivers, such as the Nujiang River, Lancang River, Red River, Yangtze River, and Pearl River. Precipitation is spatially and temporally uneven across the region (ranging from 560 to 2300 mm) due to the influences of the monsoons and complex terrain and is primarily concentrated from May to October [32]. Therefore, droughts occur more frequently and severely in winter, spring, or early summer in YP and have a serious impact on agricultural production and human life [30,33]. For example, the severe drought in northern and central YP from November 2002 to early May 2003 affected 10.53 million people and 0.86 million hectares of crops, which led to a direct economic loss of 1.98 billion yuan [34]. The drought from November 2009 to May 2010 resulted in 24.98 million people affected, with 2.96 million hectares of crops affected and direct economic losses of 27.33 billion yuan [35].

2.2. Data

Three types of data were used in this study: meteorological and remotely sensed data used for the calculation of drought indices, actual drought impact data used for the optimal drought index selection, and drought event records used for the verification of whether the theoretical drought events extracted in this study are consistent with the drought events that actual occurred.
Meteorological data includes daily observations of precipitation and temperature at 101 stations from 1961 to 2020 (Figure 1), which were obtained from the China Meteorological Data Sharing Service System (http://data.cma.cn, accessed on 1 May 2022). Remotely sensed data mainly comes from Moderate Resolution Imaging Spectroradiometer (MODIS) productions to extract Land Surface Temperature (such as LST) and Normalized Difference Vegetation Index (NDVI). The included MODIS11A2 and MODIS13A2 productions ranging from 2002 to 2020 with 1 km spatial resolution, 8 and 16 days respective synthesis periods were used in this study. The data were obtained from the Land Processes Distributed Active Archive Center (LPDAAC) of NASA (https://ladsweb.modaps.eosdis.nasa.gov/, accessed on 20 September 2022).
The actual drought impact data were obtained from the drought statistics reporting system in China. In general, drought impact data are collected after the event has ended; and no data are collected if there is no drought event. Once the drought emergency response levels are triggered, the statistical frequency of drought impact data will increase, such as in the range of 3 weeks or even every day [15]. Six types of drought impact data during the period of 2003–2017 were available and used in this study (listed in Table 1). Considering that these impact data were reported by administrative units, this study will select the optimal drought index by calculating the correlation coefficient based on the sum of drought impact data and mean of drought indices in the sixteen cities (Figure 1) in YP during 2003–2017.
The drought event records data were obtained from the China Meteorological Disaster Yearbook (https://data.cnki.net/yearBook/single?id=N2023020114, accessed on 15 August 2022) and the literature of Zhang et al. [36], which were available from 1949 to 2020 and used to verify whether the theoretical drought events extracted in this study are consistent with the drought events that actual occurred.

2.3. Methods

2.3.1. Alternative Drought Indices

Drought indices are an effective way to quantify drought phenomena, but there are a variety of drought indices currently available, as mentioned above. In view of this, this study selected six commonly used drought indices (Table 2) as candidates. Then, the rank correlations (Equation (1)) between the values of the indices and the actual drought impact data were calculated to find the optimal one for drought analysis in YP. Until this section; we finished part I of Figure 2.
R c = 1 6 d i 2 n ( n 2 1 )
where d i is the rank difference between the drought index and drought impact data series. The drought index series is the mean of the drought index at each station within one city. The drought impact data series is the sum of drought impact data at different counties within one city. n is the length of the used data series.
Table 2. The drought indices candidates used in this study.
Drought IndexTime ScalesReferences
Percentage of precipitation anomaly (Pa)monthly[4]
Standardized precipitation index (SPI)1, 3, 6, 12-month [5]
Standardized precipitation and evapotranspiration index (SPEI)1, 3, 6, 12-month [8]
Days without continuous rain (CDD)maximum days without continuous effective rain in one month[37]
Relative moisture index (MI)monthly[6]
Vegetation Supply Water Index (VSWI)monthly[38]

2.3.2. Regional Drought and Drought Characteristics Extraction

The occurrence of drought events is not limited to a single point, and the duration (D), severity (S), and affected area (A) are the main characteristics generally used to describe regional drought events from the temporal and spatial perspective. Previous research usually extracted D and S by the run theory method at a single site scale [31,39]. A is difficult to synthesize simultaneously with D and S to describe a drought event at a regional scale.
In order to obtain these three drought characteristics simultaneously, we referenced a regional drought process assessment methodology from Liao et al. [40]. Firstly, we determined the regional average drought index (Im) and drought impact area (Am) for each month:
I m = 1 n i = 1 k I n d e x o p t i , i f   I n d e x o p t i d r o u g h t   t h r e s h o l d
A m = k n × 1
where k means the number of stations with optimal drought index under the threshold and n is the total number of stations in the study region. The drought threshold value is given as −0.5 in this study.
Secondly, based on the run theory, the Im series was used to extract the regional D and S based on a threshold value (−0.5). D is the sum month when Im less than −0.5 for a drought spell, and S is the cumulative sum of the difference between the Im value and its threshold value in the drought spell. If a certain two drought events were adjacent to each other for only one month, the two events would be combined as a single event (Figure 3).
Finally, the drought-affected area (A) for a drought event during the drought duration is calculated as follows, and until this section, we finished part II of Figure 2.
A = m = 1 D A m D

2.3.3. Framework of Copula-Based Joint Return Period

The joint return period of different drought characteristics is defined as the average time elapsing between two successive realizations of the drought events and can be used to compare the comprehensive risk of drought events. To a certain extent, the larger return period corresponds to the more extreme drought event, the higher the risk of damage it may cause.
The joint return period is calculated as the inverse of exceedance probability of different variables, and the Copulas functions are usually used for this calculation due to their flexibility in modeling the dependence structure among random variables based on their marginal distributions [19,31,41]. After obtaining the appropriate Copula joint distributions, we can proceed with the analysis of drought return periods (as shown in part III of Figure 2).
Copula is defined as the multivariate distribution function of multidimensional random variables ( x 1 , x 2 , , x m ). It could be served to connect m-dimensional marginal distributions ( F x 1 , F x 2 , , F x m ) to form a multivariate distribution function on [0, 1]:
F x 1 , x 2 , , x m = C F 1 x 1 , F 2 x 2 , , F m x m = C ( u 1 , u 2 , , u m )
where C is the cumulative distribution function (CDF) of Copula, and Fm(xm) is the marginal distribution for random variable xm, i.e., the marginal distribution.
The formula for the return period of one drought characteristic is expressed as:
T o n e d = E ( L ) P ( X x ) = E L 1 F x ( x )
where E(L) is the expectation of the average drought interval and P(Xx) is the CDF of a given value x. FX is the marginal distribution of variable X.
The joint return period of two or three drought characteristics is expressed as:
T t w o d = E ( L ) P ( X x Y y ) = E ( L ) 1 F x x F y y + C X Y ( F x x , F y y )
T t h r e e d = E L P X x Y y Z z = E ( L ) 1 F x x F y y F z z + C X Y F x x , F y y + C X Z F x x , F z z + C Z Y F z z , F y y C X Y Z ( F x x , F y y , F z z )
where CXY is the optimal Copula describing the joint distribution of random variables X and Y. CXYZ is the optimal Copula describing the joint distribution of random variables X, Y, and Z.
  • Marginal distribution
Before the establishment of the joint distribution, the optimal marginal distribution of random variables should first be identified. Six distribution functions (Table 3) were used to fit and optimize the marginal distribution for each of the three drought characteristics (D, S, and A). Kolmogorov–Smirnov (K–S) method [42] was used to test the theoretical distribution and empirical distribution in order to determine the optimal one.
  • Copula functions
In this study, three common Archimedean Copula functions: Clayton Copula, Gumbel-Hougaard Copula, and Frank Copula, were used. Details are shown in Table 4, where d in the formulas denotes the variable dimensionality. The parameter estimation of the Copula function is performed by the method of great likelihood estimation. The optimal Copula function is tested by using the Akaike information criteria (AIC) and Bayesian Information Criterions (BIC) based on the joint empirical and theoretical probability of the random variables [43]. The smaller the statistic value of AIC and BIC, the better the corresponding Copula function fitting.

3. Results

3.1. Optimal Drought Index Selection

The rank correlation coefficients between drought indices and drought impact data in 16 cities of YP are shown in Figure 4. It can be seen that SPI, SPEI, Pa, MI, and VSWI drought indices show a negative correlation with drought impact data, and CDD shows a positive relationship. This phenomenon is consistent in 13 out of 16 cities in YP, while the three cities of Nujiang, Dehong, and Xishuangbanna are not consistent. The topography of YP is complex, with an area of 1000–3500 m accounting for more than 90% of the total area, showing large change in elevation. For example, the area of Nujiang with elevation above 2000–3500 m accounts for ~66% (weaker correlation results shown in Nujiang), and the area of Baoshan with elevation below 2000 m accounts for ~66% (higher correlation results shown in Baoshan); agricultural drought in high altitude areas is not easily assessed by drought index. The proverb says that the weather varies within 10 miles of YP, which is the main result of topographic influence, and coupled with the different drought resistance for different cities, synthetically leading to different drought impacts in adjacent cities even under the influence of the same drought degree.
It is worth noting that for drought indices at longer time scales such as SPI, SPEI indices at 3-, 6-, and 12-month time scales, and VSWI, their negative correlation with drought impact data is more significant with the time scale increasing. While for the drought impact data of CA_ED and WMA_P, the VSWI shows a weaker correlation in the 16 cities compared with SPI and SPEI. For drought indices at shorter time scales, such as SPI and SPEI at a one-month time scale, CDD, Pa, and MI indices, the correlations are weaker, which indicates that using the current month drought index does not fully reflect the actual cumulative damage effect by drought. Although a remotely sensed-based drought index VSWI could indicate a drought situation at a relatively high spatial resolution, sometimes the lower values of VSWI are usually not only affected by drought but may also be affected by a combination of other factors, such as pest disease, forest fire, and human logging. Moreover, the remotely sensed data still have the problem of missing data due to the weather; this will result in drought events not being fully identified.
Based on the coefficient of variation (Cv) of the rank correlation coefficients for 16 cities (Table 5), we could see that the absolute Cv values of SPI and SPEI indices at a 6-month time scale (SPI6 and SPEI6) for different drought impact data are smaller than other drought indices, especially for the drought impact of CA_ED, CA_SD, P_D, and WMA_P (the Cv values are −0.53, −0.54, −0.48, −0.84, and −0.55, −0.55, −0.48, −0.75, respectively), indicating that SPI6 and SPEI6 can generally reflect the drought spatial distribution in YP. We initially suggested to select SPI6 or SPEI6 as the appropriate index to assess the drought situations in YP. Considering that the SPI index has only precipitation data as input, while the SPEI index takes into account the effect of temperature. Therefore, the following study will analyze the drought return period based on SPEI6.

3.2. Drought Events and Drought Characteristics in YP

Based on the method in Section 2.3.2, we extracted 41 drought events in YP during 1961–2020 (Table A1). Averagely, a drought event in YP generally lasts 5 months; cumulative S is almost 4.2, A is about 60% of the total stations, and drought starts mostly in February or December and ceases in March (Figure 5d). Since the turning point of climate change in China is thought to have occurred around 1990 [44], we compared the difference of drought characteristics before and after No. 20 drought event (~the year of 1990). Before 1990, the average D of drought in YP was 4 months, with an average S of 2.7 and an average A of 59%; while after 1990, the average D increased to 6 months, the average S increased to 5.6, and the average A was 61% (Figure 5a–c), this is main caused by the drought No. 35 and No. 36, which shows higher D and S than other events. However, the affected areas of these two droughts do not stand out among other events. This well illustrates the multidimensional spatiotemporal nature of drought events. Therefore, in order to facilitate comparison and assessment of the extremeness of a drought event among multiple events, it is necessary to analyze a drought event by jointing different drought characteristics.

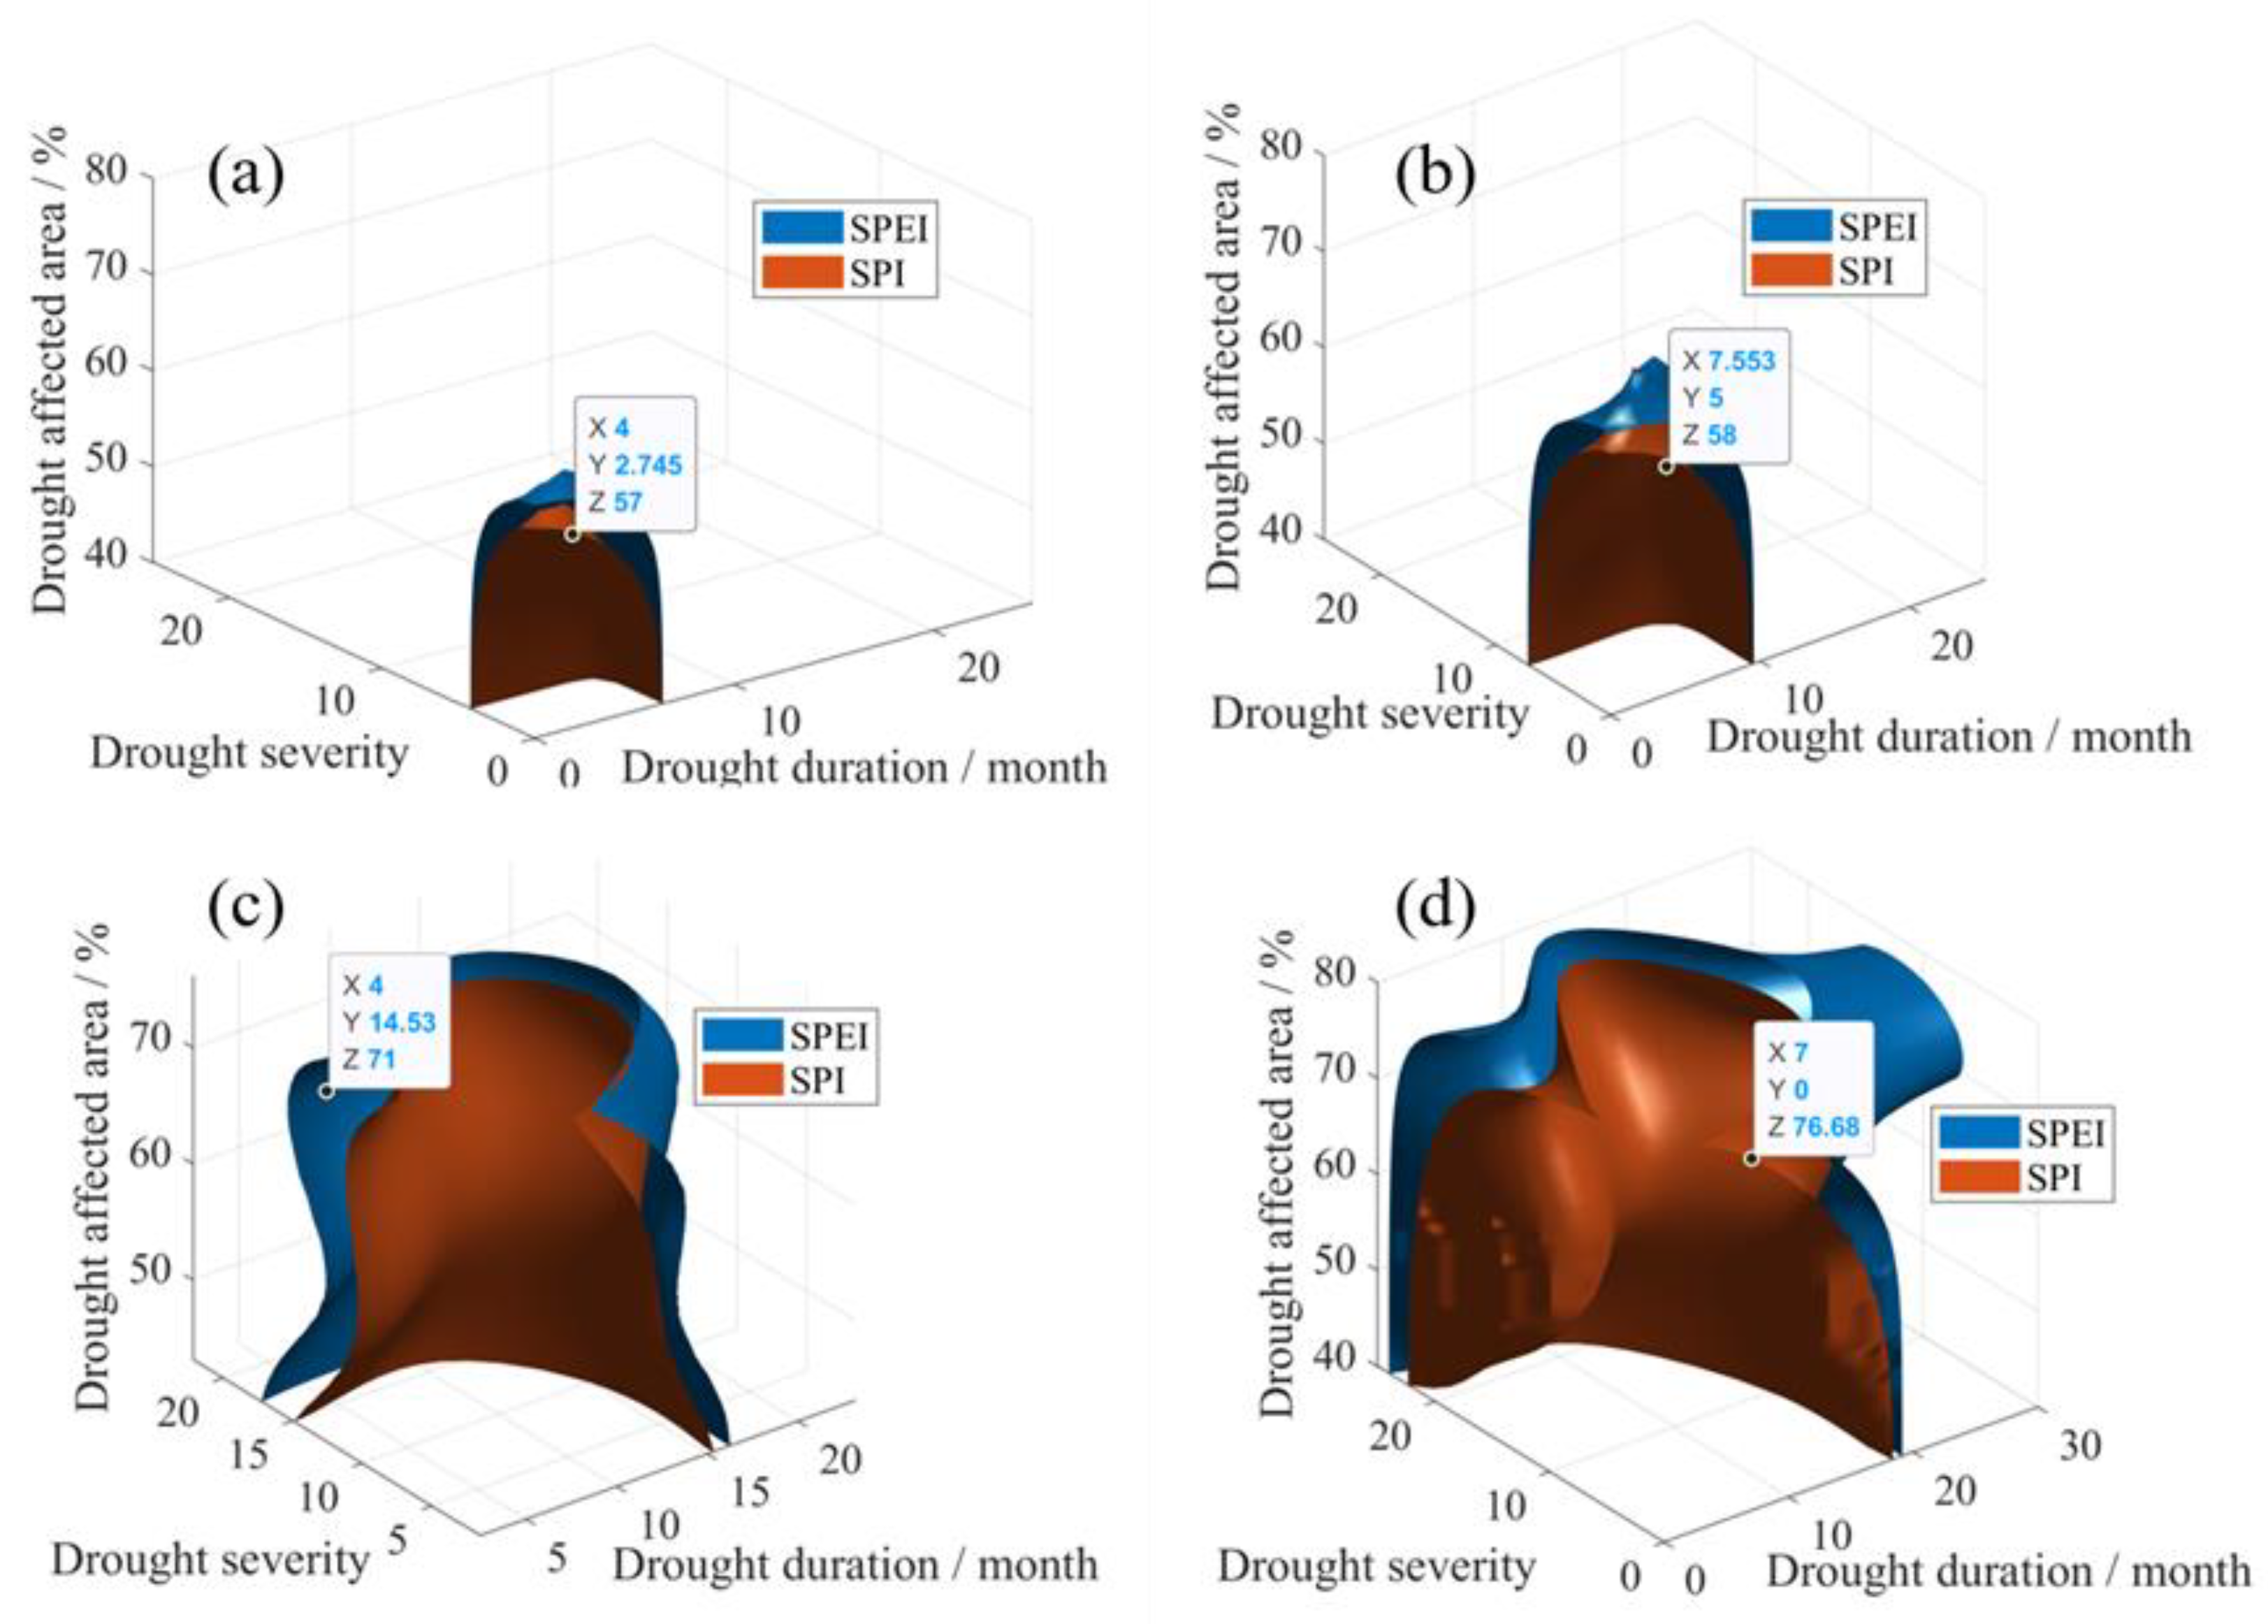
3.3. Optimal Marginal Distribution and Joint Distribution for Different Drought Characteristics

The statistical results of the K–S test of marginal distributions for drought characteristics D, S, and A are shown in Table 6. We can see that the marginal distribution to fit the one-dimensional drought characteristic was not unique, so the optimal distribution based on the minimum statistical value of K–S (D) was selected. The optimal marginal distributions for D, S, and A in YP were WBL, LOGN, and LOGN, respectively (Table 6).
For the joint distribution of multidimensional drought characteristics, the statistical results are shown in Table 7. Based on the minimum statistical values of AIC and BIC, the optimal joint distributions for D and S, D and A, S and A, and D and S and A in YP were Frank, Frank, Gumbel-Hougaard, and Frank Copula, respectively (Table 7).

3.4. Return Period of Drought Events in YP

According to the optimal distribution for different dimensional drought characteristics (Table 6 and Table 7) and Equations (6)–(8), we calculated the return periods (RP) for the 41 drought events. We can see that from Figure 6, although the fluctuation of RP assessed by one-dimensional drought characteristics is consistent with those assessed by three-dimensional characteristics, the results based on D are different from those based on S or A, and the assessment results for specific events are significantly different. For drought events with relatively small RPs, the assessment results based on three-dimensional drought characteristics are similar to those considering only one-dimensional characteristics. For example, the four drought events (No. 12–15) that occurred during 1982–1985, which lasted 1–3 months, with severity between 0.52 and 1.82, and affected areas less than 60%, all of which were lower than the average drought characteristics of YP.
Since the significant correlation between D and S, the drought RPs assessed based on D or S are very close, but the results of RPs based on A differ significantly from D or S. For example, the No. 4 (March 1969–July 1969) drought event’s RP assessed only by A was 117 yr, while the RPs of these two drought events of No. 35 (May 2009–November 2010) and No. 36 (July 2011–November 2013) were only 19 yr and 27 yr. However, the actual impacts of the latter two drought events were more severe according to the relevant records of the China Water and Drought Disaster Bulletin. As for extreme drought events, only using one-dimensional drought characteristics to assess the RP has a large discrepancy for each other; and for the common drought events, the RP based on three-dimensional characteristics was larger than those based on one-dimensional. This indicates that there is an overestimation or underestimation of the extremeness of a drought event if the characteristics are not fully considered.
When considering a combination of two drought characteristics to assess the RP for a given drought, we found that the assessment results were more consistent with the results by considering three-dimensional drought characteristics for the drought events where the magnitude of drought characteristics was small (Figure 7). For example, the RPs assessed by two-dimensional drought characteristics for the No. 11 to No. 25 drought events were more consistent with the results assessed by three-dimensional characteristics, but there were still differences for certain drought events with larger drought features. The No. 4 drought event lasted for 5 months, with a severity of 5.78 and a drought-affected area of 82.77%. The RP of this event was 7 yr assessed based on the combination of D and S, but after considering the drought-affected area, the RPs based on D and A, and S and A were assessed to be 119 yr.
Similarly, the D, S, and A of the No. 40 drought event (April 2019–March 2020) were 12 months, 13.06, and 75.91%. Although A was smaller than the No. 4 drought event, it was larger in D, and S. The RP assessed by D and S was 32 yr, while the RPs assessed by D and A, and S and A was 101 yr and 49 yr, respectively, which were larger than the RP assessed by D and S and A. This suggested that drought characteristic A was an important factor for assessing the extremeness of one drought event since it is associated with the impact degree of drought disaster, such as cropland areas affected by different severity of drought, population with drinking water difficulties due to drought. As we can see that when we combined other drought characteristics with variable A, the RP assessed by two-dimensional characteristics for the 41 drought events was most consistent with RP assessed by three-dimensional characteristics, especially for the common drought events (No. 11–25). The RP assessed by D and A were all higher than RP assessed by three-dimensional characteristics. If RP assessed by D and S or D and A was used to assess the extremeness of the No. 36 drought event, the result was higher than 1000 yr; it might be overestimated since the A was the same as the event of No. 35.
The above joint RP analysis indicates that extreme drought events do not imply that all features are large in magnitude; it is possible that they are the combined result of multiple features with different magnitudes. The identified drought events also show that it is rare for different drought characteristics to reach the maximum magnitude at the same time. In a word, a comprehensive assessment of the extremeness of a drought event using the joint RP based on spatial and temporal multidimensional characteristics is more reasonable.

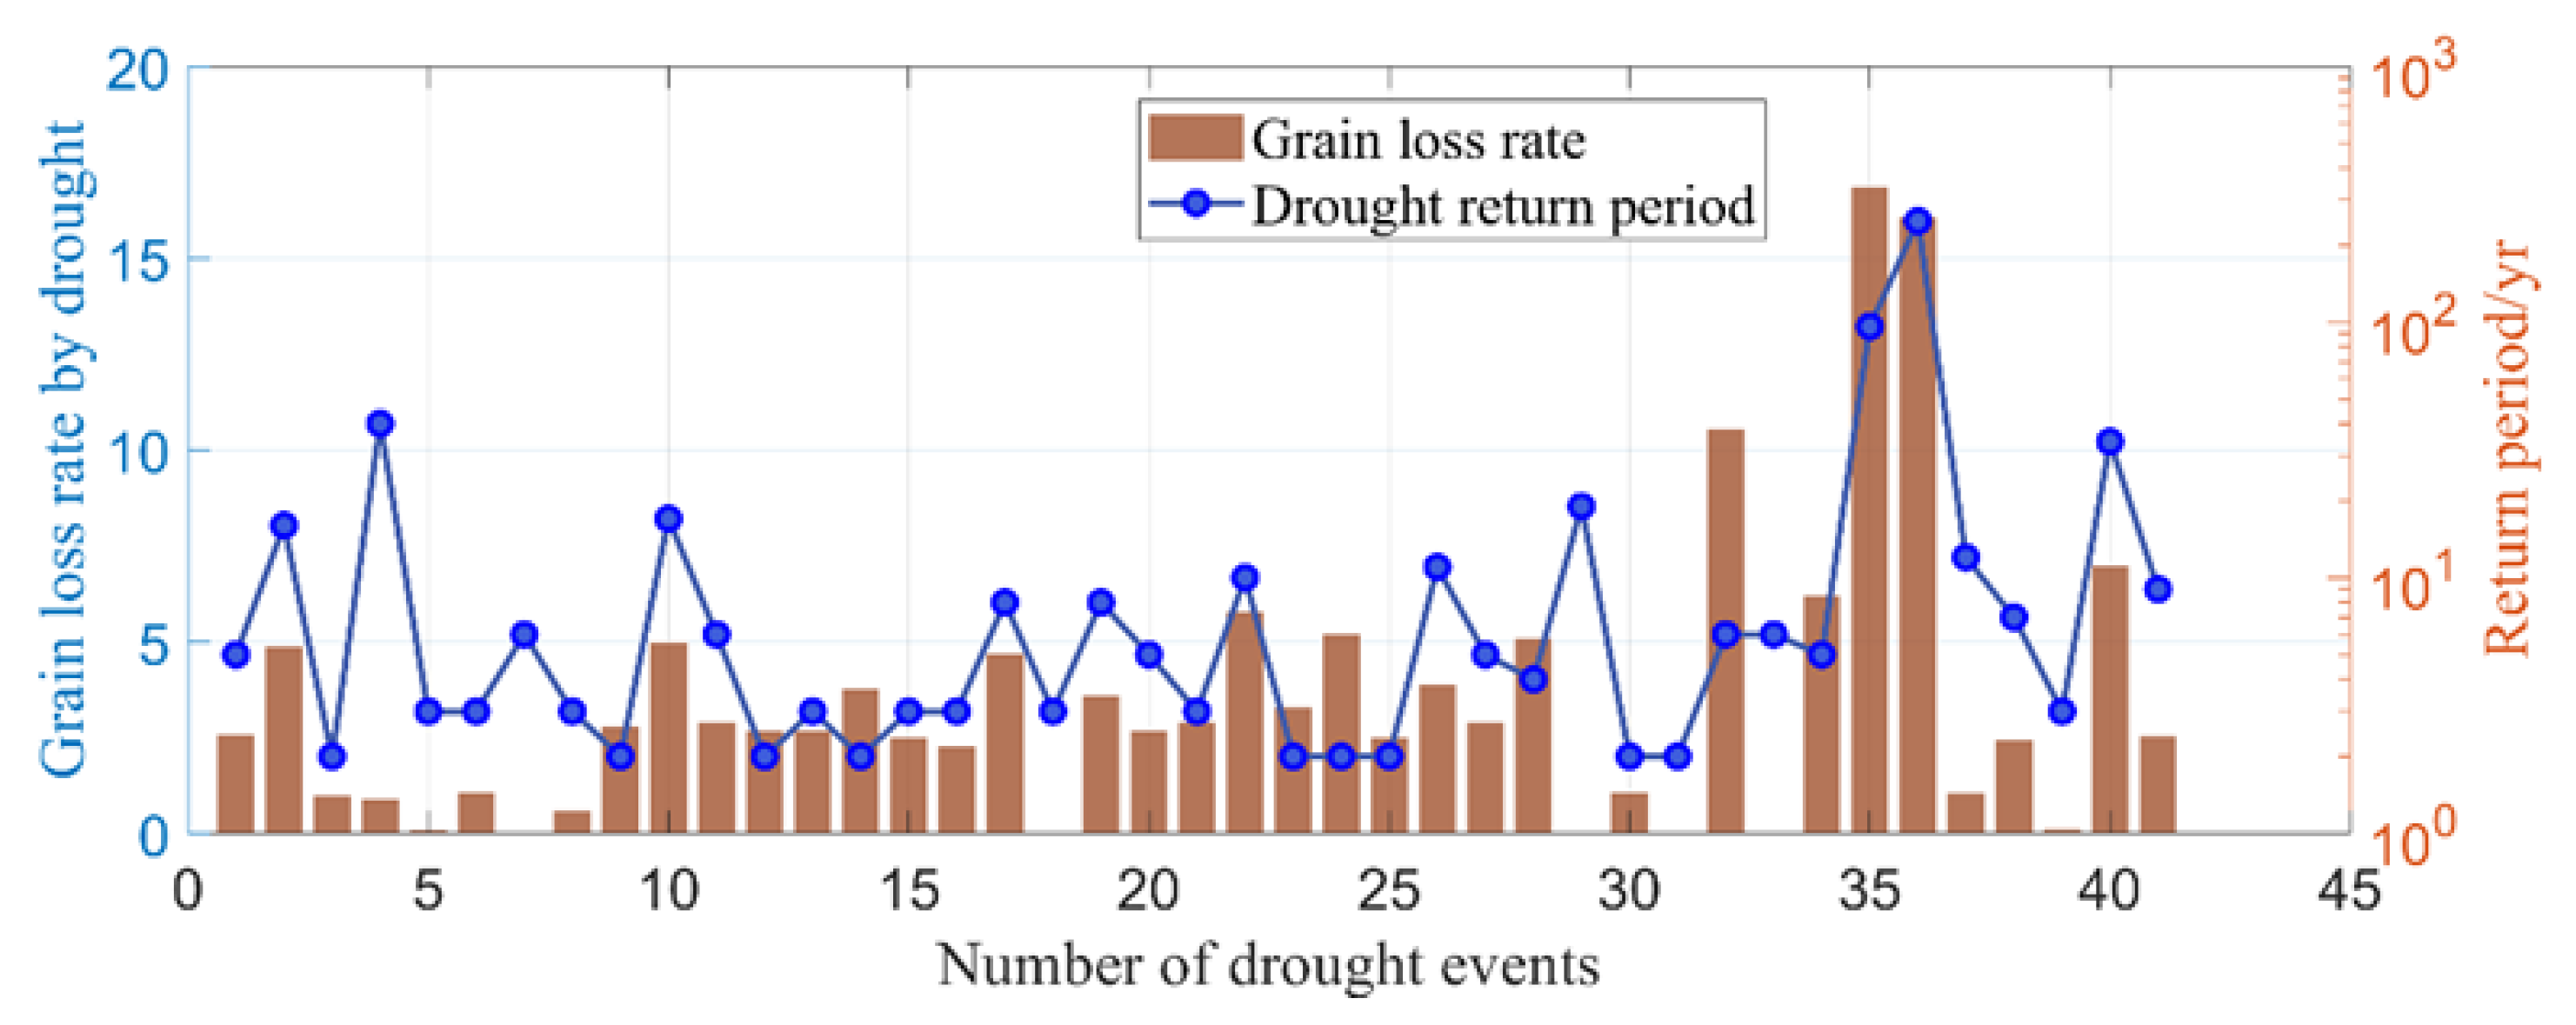
3.5. Case Validation

In order to prove the credibility of the RP assessed by three-dimensional drought characteristics, we verified the results based on the actual drought-affected area, grain loss rate, and the textual description of the drought events in YP.
The change of RPs was consistent with the grain loss rate, and the correlation coefficient was 0.74, which indicates that RP could reflect the real damage caused by droughts, especially by the extreme drought in 2009–2010, 2011–2013, and 2019–2020 (Figure A1). There were night years the crop area affected by drought exceeded 1 million hectares since 1961, which were all reflected in the theoretical drought events extracted in this study (Table 8). With the exception of the drought event in 2005, for which the RP was less than 10 yr, the RPs of all other high-impact drought events were greater than 10 yr, and the actual textual description of drought events is also consistent with the expression of RP size.
For the three drought events (No. 4, 35, 36) with more controversial RP results (in Figure 6 and Figure 7), No. 4 was recorded as few major drought spells since 1949; it was more reasonable to assess this event with RP of 40 yr rather than 10 yr or 100 yr (RPs assessed by one- or two-dimensional characters).
The No. 35 drought occurred during 2009–2010 and was recorded as the most harmful extreme drought since meteorological records began. Not only did the textual material show how serious this drought was at that time, but the research published afterward may also indicate the severity of the drought’s impact on society. The ratio of actual drought-affected area to total sown area was 44%, which were highest during 1972–2020. Therefore, the RP of 96 yr was reasonable to describe the extremeness of this drought event.
The No. 36 drought extracted from this study showed that the drought event lasted for nearly three years (July 2011–November 2013). The actual drought process had interruptions during the three years, so the final impact extent was not as severe as the drought in 2010, but the actual drought-affected area exceeded 1 million hectares each year, which indicates the cumulative damage effect formed by the three-year drought. Similar to the drought in 2009–2010, the RP of No. 36 drought in 2011–2013 should also be on the century scale rather than the millennium scale.

4. Discussion

4.1. Uncertainty of Regional Drought Event Identification

It is necessary and challenging to effectively and accurately identify regional drought events. The development of regional drought identification methods has been ongoing for nearly 20 years. Ren et al. [20] provide a systematic review of methods for identifying regional extreme drought events, with a representative example of Andreadis et al. [46] and Lloyd-Hughes [21], who used spatial clustering methods to extract drought patches and propose a severity-area-duration method (abbreviated as SAD). Zhang et al. [47] used the precipitation data from 22 meteorological stations and the SAD methods to identify drought events with D, S, and A in YP during 1961–2018. This study took 101 meteorological stations as the basis; we referenced the method proposed by Liao et al. [40], simplified and combined it with the run theory to identify 41 regional drought events in YP from 1961 to 2020. And the extremeness of theoretical drought events is basically consistent with the result of Zhang et al. [47] and the historical actual drought records (Table 8). In order to reflect the three-dimensional dynamic evolution process of drought, quantitative analysis of the whole process of drought events from the time–longitude–latitude has become a hot topic [48].
The results of regional drought event identification have uncertainties due to the optimal drought index selected, drought threshold, spatial and temporal resolutions of the data used, the weight for each station when to calculate the regional drought index, and the methods adopted, etc. In future work, we will use grid data with higher resolution and set up tests with different drought thresholds to systematically analyze the joint RP risk of drought in YP.

4.2. Comparison of Joint Return Period Based on SPI and SPEI

The correlation results in Section 3.1 show that the SPI6 could also reflect the change of drought impact; this study wanted to detect the differences between SPI6 and SPEI6 in the assessment of drought RPs in YP.
For one-dimensional drought characteristics, it was found that the RPs of drought events with shorter duration, less severe, or less affected areas (such as events of E1, E3, and E5 in Figure 8) were similar for SPI6 and SPEI6; however, with the magnitude of drought characteristics increase, the SPI6-based RPs were higher than those of SPEI6 (such as the events of E2, E4, and E6 in Figure 8).
The RPs’ difference is more obvious when considering two-dimensional drought characters. As the drought characteristics magnitude increases, the SPI6-based RP is higher than that of SPEI6 (the solid line is always away from the dotted line with the same color). For example, for drought events with D ≥ 7 and S ≥ 7, the RP is about 10 yr for both SPI- and SPEI-based evaluations (Figure 9a). E (20,15) in Figure 8a means a drought event with D ≥ 20 and S ≥ 15. The SPEI6-based RP of this event is shown to be 200 yr, while it is greater than 200 years based on SPI6. The same phenomenon is also observed in the joint RPs of D and A (Figure 9b) and S and A (Figure 9c).
Figure 10 shows the RP surfaces (5 yr, 10 yr, 50 yr, and 100 yr) with three-dimensional drought characters. Similarly, we can see that if a drought event is evaluated by SPI6, the RP is higher than that by SPEI6. For example, the RP of the drought event (D > 4 ∩ S > 2.74 ∩ A > 57%) in Figure 10a is on the 5 yr surface of SPI6, while it is inside the 5 yr surface of SPEI6, which indicates that this event is less than 5 yr return period assessed by SPEI6. The same result is also reflected in the comparison of the 10 yr return period surface (Figure 10b). However, for the cases with larger RPs (Figure 10c,d), instead of showing a complete surface like 5 yr and 10 yr return periods, 50 yr and 100 yr RPs show depressions on the sides, and top of the surface, but the red surface is still surrounded by the blue. This means that the magnitude of drought characteristics of drought events with 50 yr or 100 yr RP assessed by SPI6 are less than SPEI6. For the occurrence of depressions in RP surface, it also reflects that the correlation structure between drought characteristics may change under extreme conditions: drought events with high RPs showing longer D, less S, and larger A, or higher S, shorter D, and larger A is recorded in YP. However, the drought events with large magnitude for D, S, and A have a more irregular RP surface, which indirectly indicates the rare frequency of such events.

4.3. Effect of Global Warming on Drought in YP

The frequency of extreme events has changed under the background of global warming, with events previously considered to be extreme becoming more frequent and will probably no longer be classified as extreme events [49,50,51]. Southwestern China has also been particularly affected by serious droughts; this was especially true in 2009 and 2010. The regional circulation patterns are strongly affected by the high-elevation Himalayas Mountains, which block the flows of air masses, and the large variation in landform conditions combine to increase the drought frequency [52]. Researchers have also analyzed that anthropogenic climate change increased the drought risk in the region of Southwestern China [53]. Global warming is the main feature of climate change. Since 1961, YP has shown a significant increasing warming tendency (p < 0.01) either at seasonal or annual scale [30]. Meanwhile, the interval time between the end of one drought event and the beginning of the next drought event in YP showed a decreasing trend (Figure 11a). This suggests that YP is more and more prone to occur drought, and it is confirmed by the decreasing trend change in the cumulative anomaly of RP of the 41 drought events (Figure 11b).

5. Conclusions

In this study, several drought indices were first compared with the drought impact dataset, and the optimal one was selected. Then we explored the spatial and temporal dynamics risk of drought events in YP by considering D, S, and A. There were 41 drought events identified during 1961–2020 in YP. Different types of RP for droughts were estimated based on Copulas and compared with each other. The main findings can be summarized as follows.
(1)
The drought indices on a shorter time scale can only characterize the degree of water shortage in the current month; the longer time scale drought indices can better reflect the actual drought-impacted situation in YP, especially SPEI and SPI at more than six-month time scale.
(2)
Drought is more likely to occur in YP during the winter and spring. The fluctuations of drought characteristics magnitude have been relatively stable over the study periods, except for the years 2009–2013. For the 41 drought events, the optimal marginal distribution functions for D, S, and A were WBL, LOGN, and LOGN distribution, respectively. Frank Copula function is suitably used to construct the joint distribution of D and S, D and A, and D and S and A, and Gumbel Copula is the optimal joint distribution function for S and A.
(3)
The joint RP analysis showed that the 41 events during 1961–2020 differed in different combinations of D, S, and A. When assessing the RP based on one-dimensional drought characteristics only, the D-based and S-based RPs’ fluctuation was similar and differed with A-based RP. When assessing the joint RP based on two-dimensional drought characteristics, the D and A-based and S and A-based assessment results show consistent fluctuations. For drought events with large differences in drought characteristics, it is more reasonable to utilize joint RP based on D and S and A for their extremeness assessment.
(4)
The interval between drought events in YP has gradually decreased, and the risk of drought has gradually increased since 1961. Compared with other drought events, the extremeness of two droughts during 2009.05–2010.11 and 2011.07–2013.11 was highest with RP larger than 100 yr.

Author Contributions

R.Z.: Manuscript writing, Data analysis. S.Y.: Conceptualization, Content review. H.S.: Content review, Software. L.Z.: Content review. M.L.: Software. L.X. and R.T.: Data collection and calculation. All authors have read and agreed to the published version of the manuscript.

Funding

This study was supported by the National Key Research and Development Project (Grant Number: 2021YFB3901203).

Institutional Review Board Statement

Not applicable.

Informed Consent Statement

Not applicable.

Data Availability Statement

The data used in this study can be obtained from the Website listed in Section 2.2. The dataset is available from ruxinzhao@ninhm.ac.cn upon reasonable request.

Acknowledgments

We gratefully acknowledge the China Meteorological Administration for providing the dataset.

Conflicts of Interest

The authors declare no conflict of interest.

Appendix A

Table A1. Theoretical drought events identified in this study.
No. Drought EventsD/MonthSA/%
101/1961~02/196121.4164.85
212/1962~09/1963108.0167.33
304/1966~04/196610.5447.52
403/1969~07/196955.7882.77
502/1970~03/197021.3660.89
610/1972~10/197210.6661.39
702/1975~03/197521.4266.83
809/1975~11/197531.6250.83
906/1977~08/197731.4344.22
1012/1978~08/197998.1272.61
1104/1980~09/198064.0257.59
1212/1981~01/198221.4453.47
1308/1982~10/198231.7452.15
1407/1983~07/198310.5249.50
1512/1984~02/198531.8259.41
1603/1986~06/198641.8346.29
1705/1987~10/198764.5964.85
1803/1988-03/198810.5358.42
1906/1988~12/198874.8960.54
2008/1989~01/199063.6854.62
2112/1990~01/199121.2956.93
2206/1992-12/199275.7964.36
2307/1993~07/199310.5753.47
2401/1997~01/199710.5354.46
2503/1998~03/199810.5351.49
2612/1998~06/199976.1768.03
2702/2001~04/200132.2263.37
2802/2003~04/200331.8760.73
2908/2003~30/200487.6974.63
3011/2004~11/200410.5249.50
3102/2005~02/200510.5049.50
3205/2005~10/200563.9857.92
3302/2006~04/200632.0167.00
3408/2006~01/200763.4950.99
3505/2009~11/20101919.5473.58
3607/2011~11/20132928.4975.35
3704/2014~12/201496.7461.50
3806/2015~10/201554.3764.36
3901/2018~04/201842.4852.23
4004/2019~03/20201213.0675.91
4106/2020~12/202075.4464.07
Figure A1. Variations in the extent of grain loss rate and the joint return period calculated by three-dimensional drought characteristics for 41 drought events in Yunnan province.
Atmosphere 14 01153 g0a1

References

  1. Eklund, L.; Theisen, O.M.; Baumann, M.; Tollefsen, A.F.; Kuemmerle, T.; Nielsen, J. Societal drought vulnerability and the Syrian climate-conflict nexus are better explained by agriculture than meteorology. Commun. Earth Environ. 2022, 3, 85. [Google Scholar] [CrossRef]
  2. Intergovernmental Panel on Climate Change (IPCC). Food Security and Food Production Systems. In Climate Change 2014: Impacts, Adaptation, and Vulnerability; Porter, J.R., Xie, L., Challinor, A.J., Cochrane, K., Howden, S.M., Iqbal, M.M., Lobell, D.B., Travasso, M.I.., Eds.; Cambridge University Press: London, UK, 2014. [Google Scholar] [CrossRef] [Green Version]
  3. Huang, J.; Yu, H.; Guan, X.; Wang, G.; Guo, R. Accelerated dryland expansion under climate change. Nat. Clim. Chang. 2016, 6, 166–171. [Google Scholar] [CrossRef]
  4. Henry, A.J. The Climatology of the United States; Weather Bureau Bulletin Q: Washington, DC, USA, 1906; pp. 51–58. [Google Scholar]
  5. McKee, T.B.; Doesken, N.J.; Kleist, J. The relationship of drought frequency and duration to time scales. In Proceedings of the 8th Conference on Applied Climatology: American Meteorological Society, Boston, MA, USA, 17–22 January 1993; pp. 179–183. [Google Scholar]
  6. China Meteorological Administration. GB/T 20481-2017; Grades of meteorological drought (TEXT OF DOCUMENT IS IN CHINESE). Grades of Meteorological Drought: Beijing, China, 2017.
  7. Palmer, W.C. Meteorologic Drought; US Department of Commerce, Weather Bureau: Silver Spring, MD, USA, 1965; p. 45. [Google Scholar]
  8. Vicente-Serrano, S.M.; Beguería, S.; López-Moreno, J.I. A Multiscalar Drought Index Sensitive to Global Warming: The Standardized Precipitation Evapotranspiration Index. J. Clim. 2010, 23, 1696–1718. [Google Scholar] [CrossRef] [Green Version]
  9. Hao, Z.C.; AghaKouchak, A. Multivariate Standardized Drought Index: A parametric multi-index model. Adv. Water Resour. 2013, 57, 12–18. [Google Scholar] [CrossRef] [Green Version]
  10. Sandholt, I.; Rasmussen, K.; Andersen, J. A simple interpretation of the surface temperature/vegetation index space for assessment of surface moisture status. Remote Sens. Environ. 2002, 79, 213–224. [Google Scholar] [CrossRef]
  11. Brown, J.F.; Wardlow, B.D.; Tadesse, T.; Hayes, M.J.; Reed, B.C. The Vegetation Drought Response Index (VegDRI): A new integrated approach for monitoring drought stress in vegetation. GIScience Remote Sens. 2008, 45, 16–46. [Google Scholar] [CrossRef]
  12. Mishra, A.K.; Singh, V.P. A review of drought concepts. J. Hydrol. 2010, 391, 202–216. [Google Scholar] [CrossRef]
  13. Zargar, A.; Sadiq, R.; Naser, B.; Khan, F.I. A review of drought indices. Environ. Rev. 2011, 19, 333–349. [Google Scholar] [CrossRef] [Green Version]
  14. Parsons, D.J.; Rey, D.; Tanguy, M.; Holman, I.P. Regional variations in the link between drought indices and reported agricultural impacts of drought. Agric. Syst. 2019, 173, 119–129. [Google Scholar] [CrossRef]
  15. Wang, Y.; Lv, J.; Hannaford, J.; Wang, Y.; Sun, H.; Barker, L.J.; Ma, M.; Su, Z. Linking drought indices to impacts to support drought risk assessment in Liaoning province, China. Nat. Hazards Earth Syst. Sci. 2020, 20, 889–906. [Google Scholar] [CrossRef] [Green Version]
  16. Shao, D.; Chen, S.; Tan, X.; Gu, W. Drought characteristics over China during 1980–2015. Int. J. Climatol. 2018, 38, 3532–3545. [Google Scholar] [CrossRef]
  17. Chamorro, A.; Ivanov, M.; Tölle, M.H.; Luterbacher, J.; Breuer, L. Analysis of future changes in meteorological drought patterns in Fulda, Germany. Int. J. Clim. 2020, 40, 5515–5526. [Google Scholar] [CrossRef]
  18. Vergni, L.; Todisco, F.; Di Lena, B.; Mannocchi, F. Bivariate analysis of drought duration and severity for irrigation planning. Agric. Water Manag. 2020, 229, 105926. [Google Scholar] [CrossRef]
  19. Samantaray, A.K.; Ramadas, M.; Panda, R.K. Assessment of impacts of potential climate change on meteorological drought characteristics at regional scales. Int. J. Climatol. 2021, 41, E319–E341. [Google Scholar] [CrossRef]
  20. Ren, F.-M.; Trewin, B.; Brunet, M.; Dushmanta, P.; Walter, A.; Baddour, O.; Korber, M. A research progress review on regional extreme events. Adv. Clim. Chang. Res. 2018, 9, 161–169. [Google Scholar] [CrossRef]
  21. Lloyd-Hughes, B. A spatio-temporal structure-based approach to drought characterisation. Int. J. Clim. 2012, 32, 406–418. [Google Scholar] [CrossRef] [Green Version]
  22. Ren, J.; Zhang, W.; Wan, Y.; Chen, Y. Advances in the Research of Yunnan’s Arid Climate and Extreme Drought. Atmos. Clim. Sci. 2017, 7, 23–35. [Google Scholar] [CrossRef] [Green Version]
  23. Zhu, Y.; Liu, Y.; Wang, W.; Singh, V.P.; Ma, X.; Yu, Z. Three dimensional characterization of meteorological and hydrological droughts and their probabilistic links. J. Hydrol. 2019, 578, 124016. [Google Scholar] [CrossRef]
  24. Sun, C.; Yang, S. Persistent severe drought in southern China during winter–spring 2011: Large-scale circulation patterns and possible impacting factors. J. Geophys. Res. Atmos. 2012, 117, D10112. [Google Scholar] [CrossRef]
  25. Wang, L.; Chen, W.; Zhou, W. Assessment of future drought in Southwest China based on CMIP5 multimodel projections. Adv. Atmos. Sci. 2014, 31, 1035–1050. [Google Scholar] [CrossRef]
  26. Compilation Group of China Flood and Drought Disaster Prevention Bulletin. Summary of China Flood and Drought Disaster Prevention Bulletin 2020. China Flood Drought Manag. 2021, 31, 26–32. (In Chinese) [Google Scholar]
  27. Qiu, J. China drought highlights future climate threats. Nature 2010, 465, 142–143. [Google Scholar] [CrossRef] [PubMed] [Green Version]
  28. Wang, L.; Chen, W.; Zhou, W.; Huang, G. Drought in Southwest China: A review. Atmos. Ocean. Sci. Lett. 2015, 8, 339–344. [Google Scholar] [CrossRef]
  29. Wang, Y.; Yuan, X. Anthropogenic Speeding Up of South China Flash Droughts as Exemplified by the 2019 Summer-Autumn Transition Season. Geophys. Res. Lett. 2021, 48, e2020GL091901. [Google Scholar] [CrossRef]
  30. Li, Y.; Wang, Z.; Zhang, Y.; Li, X.; Huang, W. Drought variability at various timescales over Yunnan Province, China: 1961–2015. Theor. Appl. Climatol. 2019, 138, 743–757. [Google Scholar] [CrossRef]
  31. Wang, L.; Zhang, X.; Wang, S.; Salahou, M.K.; Fang, Y. Analysis and Application of Drought Characteristics Based on Theory of Runs and Copulas in Yunnan, Southwest China. Int. J. Environ. Res. Public Health 2020, 17, 4654. [Google Scholar] [CrossRef]
  32. Duan, X.; Gu, Z.; Li, Y.; Xu, H. The spatiotemporal patterns of rainfall erosivity in Yunnan Province, southwest China: An analysis of empirical orthogonal functions. Glob. Planet. Chang. 2016, 144, 82–93. [Google Scholar] [CrossRef]
  33. Zhang, W.; Zheng, J.; Ren, J. Climate characteristics of extreme drought events in Yunnan. J. Catastrophol. 2013, 28, 59–64, (In Chinese with English abstract). [Google Scholar]
  34. China Meteorological Administration. China Meteorological Disaster Yearbook (2004); China Meteorological Press: Beijing, China, 2004; pp. 117–119. [Google Scholar]
  35. China Meteorological Administration. China Meteorological Disaster Yearbook (2011); China Meteorological Press: Beijing, China, 2011; pp. 144–145. [Google Scholar]
  36. Zhang, S.F.; Su, Y.S.; Song, D.D.; Zhang, Y.Y.; Song, H.Z.; Gu, Y. The Drought History in China (1949–2000); Hohai University Press: Nanjing, China, 2008; pp. 672–676. (In Chinese) [Google Scholar]
  37. Duan, Y.; Ma, Z.; Yang, Q. Characteristics of consecutive dry days variations in China. Theor. Appl. Climatol. 2017, 130, 701–709. [Google Scholar] [CrossRef] [Green Version]
  38. Yan, H.; Zhou, G.; Lu, X. Comparative analysis of surface soil moisture retrieval using VSWI and TVDI in karst areas. Intell. Earth Obs. Syst. 2015, 9808, 37–49. [Google Scholar] [CrossRef]
  39. Zhou, Y.; Zhou, P.; Jin, J.; Wu, C.; Cui, Y.; Zhang, Y.; Tong, F. Drought identification based on Palmer drought severity index and return period analysis of drought characteristics in Huaibei Plain China. Environ. Res. 2022, 212, 113163. [Google Scholar] [CrossRef]
  40. Liao, Y.; Zhang, C.; Zou, X.; Ye, D.; Wang, X.; Li, W.; Cheng, J.; Duan, J. Regional Drought Process Monitoring and Assessment Method (QX/T 597-2021); Meteorological Press: Beijing, China, 2021. [Google Scholar]
  41. Dai, M.; Huang, S.; Huang, Q.; Leng, G.; Guo, Y.; Wang, L.; Fang, W.; Li, P.; Zheng, X. Assessing agricultural drought risk and its dynamic evolution characteristics. Agric. Water Manag. 2020, 231, 106003. [Google Scholar] [CrossRef]
  42. Mosaedi, A.; Abyaneh, H.Z.; Sough, M.G.; Samadi, S.Z. Quantifying Changes in Reconnaissance Drought Index using Equiprobability Transformation Function. Water Resour. Manag. 2015, 29, 2451–2469. [Google Scholar] [CrossRef]
  43. Amirataee, B.; Montaseri, M.; Rezaie, H. Regional analysis and derivation of copula-based drought Severity-Area-Frequency curve in Lake Urmia basin, Iran. J. Environ. Manag. 2018, 206, 134–144. [Google Scholar] [CrossRef]
  44. Zhao, R.; Wang, H.; Zhan, C.; Hu, S.; Ma, M.; Dong, Y. Comparative analysis of probability distributions for the Standardized Precipitation Index and drought evolution in China during 1961–2015. Theor. Appl. Climatol. 2020, 139, 1363–1377. [Google Scholar] [CrossRef]
  45. Wen, K.G.; Liu, J.H. China Meteorological Disaster Dictionary—Yunnan Volume; Meteorological Publishing House Press: Beijing, China, 2006; pp. 47–96. (In Chinese) [Google Scholar]
  46. Andreadis, K.M.; Clark, E.A.; Wood, A.W.; Hamlet, A.F.; Lettenmaier, D.P. Twentieth-Century Drought in the Conterminous United States. J. Hydrometeorol. 2005, 6, 985–1001. [Google Scholar] [CrossRef]
  47. Zhang, L.; Yang, X.; Ren, L.; Sheffield, J.; Zhang, L.; Yuan, S.; Zhang, M. Dynamic multi-dimensional identification of Yunnan droughts and its seasonal scale linkages to the El Niño-Southern Oscillation. J. Hydrol. Reg. Stud. 2022, 42, 101128. [Google Scholar] [CrossRef]
  48. Liu, Y.; Zhu, Y.; Ren, L.; Singh, V.P.; Yong, B.; Jiang, S.; Yuan, F.; Yang, X.-L. Understanding the Spatiotemporal Links Between Meteorological and Hydrological Droughts From a Three-Dimensional Perspective. J. Geophys. Res. Atmos. 2019, 124, 3090–3109. [Google Scholar] [CrossRef]
  49. Dai, A. Increasing drought under global warming in observations and models. Nat. Clim. Chang. 2013, 3, 52–58. [Google Scholar] [CrossRef]
  50. Carrão, H.; Naumann, G.; Barbosa, P. Global projections of drought hazard in a warming climate: A prime for disaster risk management. Clim. Dyn. 2018, 50, 2137–2155. [Google Scholar] [CrossRef] [Green Version]
  51. Samaniego, L.; Thober, S.; Kumar, R.; Wanders, N.; Rakovec, O.; Pan, M.; Zink, M.; Sheffield, J.; Wood, E.F.; Marx, A. Anthropogenic warming exacerbates European soil moisture droughts. Nat. Clim. Chang. 2018, 8, 421–426. [Google Scholar] [CrossRef] [Green Version]
  52. Han, L.; Zhang, Q.; Ma, P.; Jia, J.; Wang, J. The spatial distribution characteristics of a comprehensive drought risk index in southwestern China and underlying causes. Theor. Appl. Climatol. 2015, 124, 517–528. [Google Scholar] [CrossRef]
  53. Zhao, R.; Sun, H.; Xing, L.; Li, R.; Li, M. Effects of anthropogenic climate change on the drought characteristics in China: From frequency, duration, intensity, and affected area. J. Hydrol. 2023, 617, 129008. [Google Scholar] [CrossRef]
Figure 1. The location of meteorological stations in the YP.
Atmosphere 14 01153 g001
Figure 2. The flow chart of this study (Part I: Optimal drought index selection, Part II: Regional drought and drought characteristics extraction, Part III: Joint return periods based on different drought characteristics).
Atmosphere 14 01153 g002
Figure 3. Schematic diagram of the drought event and characteristics extraction process (The bule dots mean the stations with drought index larger than the threshold).
Atmosphere 14 01153 g003
Figure 4. Rank correlation coefficients between drought indices and drought impact data in 16 cities of YP.
Atmosphere 14 01153 g004
Figure 5. Changes of different drought characteristics in 41 drought events ((a): Drought duration, (b): drought severity, (c): drought affected area, (d): drought onset and ending time).
Atmosphere 14 01153 g005
Figure 6. The comparison of return period based on one- and three-dimensional drought characteristics.
Atmosphere 14 01153 g006
Figure 7. The comparison of return period based on two- and three-dimensional drought characteristics.
Atmosphere 14 01153 g007
Figure 8. Comparison of the return period of one-dimensional drought characteristics based on SPI and SPEI ((a): return period based on D, (b): return period based on S, (c): return period based on A).
Atmosphere 14 01153 g008
Figure 9. The return periods (with different colors) of two-dimensional drought characteristics based on SPI6 (the dotted line) and SPEI6 (the solid line) ((a): the return period based on D and S, (b): the return period based on D and A, (c): the return period based on S and A).
Atmosphere 14 01153 g009
Figure 10. Comparison of the return period of three-dimensional drought characteristics based on SPI and SPEI. ((a): 5 yr RP, (b): 10 yr RP, (c): 50 yr RP, (d): 100 yr RP; x means D, y means S, z means A).
Atmosphere 14 01153 g010
Figure 11. Trends of the cumulative anomaly of drought interval (a) and return period (b) in YP.
Atmosphere 14 01153 g011
Table 1. Six types of drought impact data used in this study.
Impact TypeAbbreviationUnit
Crop area affected by light droughtCA_LD103 ha
Crop area affected by severe droughtCA_SD103 ha
Crop area affected by extreme droughtCA_ED103 ha
Water shortage and moisture shortage area of paddy fieldsWMA_P103 ha
Water shortage and moisture shortage area of drylandWMA_D103 ha
Population with drinking water difficulties due to droughtP_D104 persons
Table 3. Alternative marginal distribution functions for a one-dimensional variable.
DistributionFormulaParameters
Exponential (EXP) F x = 1 e x θ , x ξ θ
Weibull (WBL) F x = 1 e ( x b ) a , x > 0 a ,   b
Gamma (GAM) F x = β α Γ ( α ) 0 x t α 1 e t β d t , x > 0 α , β
Log-normal (LOGN) F x = 0 x 1 x σ y 2 π e ( l n x μ y ) 2 2 σ y 2 d x , x > 0 μ y , σ y
Normal (NOR) F x = x 1 σ 2 π e ( x μ ) 2 2 σ 2 d x , < x < μ , σ
Logistic (LOGC) F x = ( 1 + e x m a ) 1 , < x < m , a
Table 4. Basic information of commonly used Archimedean Copula functions.
Copula TypeFormulaParameter Value Range
Clayton C θ = ( i = 1 d u i θ d + 1 ) 1 θ θ > 0
Gumbel-Hougaard C θ = exp i = 1 d ( lnu i ) θ 1 θ θ 1
Frank C θ = 1 θ ln [ 1 + i = 1 d ( e θ u i 1 ) ( e θ 1 ) d 1 ] θ R
Table 5. The coefficient of variation of different drought indices for different drought impact data.
SPI1SPI3SPI6SPI12SPEI1SPEI3SPEI6SPEI12CDDPaMIVSWI
CA_ED−1.55−0.55−0.53−0.64−1.41−0.59−0.55−0.641.68−1.29−1.94−0.75
CA_LD−1.68−0.60−0.64−0.79−1.35−0.55−0.63−0.790.39−0.60−1.39−0.55
CA_SD−1.71−0.60−0.54−0.69−1.48−0.56−0.55−0.700.80−0.76−1.69−0.64
P_D−1.44−0.53−0.48−0.53−1.29−0.51−0.48−0.550.92−0.87−1.64−0.57
WMA_D−2.05−0.57−0.79−0.89−1.47−0.57−0.72−0.910.87−0.90−1.86−0.73
WMA_P−2.28−0.86−0.84−0.91−1.85−0.82−0.75−0.9116.74−2.64−4.15−0.91
Table 6. The optimal marginal distributions for one-dimensional drought characteristics.
Distribution Parameter DSA
EXP𝜃0.1930.2370.016
K–S(D)0.147 *0.132 *0.521
Pass or notYesYesNo
WBL𝑎1.1490.9476.932
𝑏5.4674.09364.098
K–S(D)0.105 *0.128 *0.094 *
Pass or notYesYesYes
GAM α 1.4331.01645.05
β 0.2770.2410.749
K–S(D)0.112 *0.135 *0.086 *
Pass or notYesYesYes
LOGN μ y 1.2550.8714.085
σ y 0.8821.0610.148
K–S(D)0.114 *0.107 *0.082 *
Pass or notYesYesYes
NOR μ 5.1714.21260.132
σ 5.2405.3499.035
K–S(D)0.204 *0.2440.096 *
Pass or notYesNoYes
LOGC m 4.3463.23759.754
a 2.3342.2365.276
K–S(D)0.185 *0.2270.091 *
Pass or notYesNoYes
Note: * means that p-values of K–S test larger than the significant level of 0.05 and the variable is obeyed the corresponding distribution. The optimal marginal distribution is selected when the corresponding value of K–S(D) is minimal.
Table 7. The optimal joint distributions for multidimensional drought characteristics.
CopulasDrought Characteristics’ CombinationParameterAICBICAccepted
ClaytonD and S14.067−52.444−50.730
D and A1.734−8.546−6.832
S and A2.357−4.118−2.405
D and S and A1.600−56.428−54.715
FrankD and S29.904−120.319−118.605Yes
D and A4.513−16.367−14.653Yes
S and A5.226−23.823−22.109
D and S and A6.636−73.887−72.173Yes
Gumbel-HougaardD and S5.546−99.423−97.710
D and A1.600−14.207−12.493
S and A1.897−26.404−24.690Yes
D and S and A2.069−72.625−70.911
Table 8. Comparison of drought record information and theoretical drought event in this study.
No. YearDrought-Affected Crop Area/104 haRecords of Actual Drought in Statistical Yearbook of YPTheoretical Drought Event Extracted in This Study (RP)
11963102.67The droughts in YP in 1963 and 1969 were described as few major drought years since 1949 [45] December 1962–September 1963 (16 yr)
21969March 1969–July 1969 (40 yr)
31979121.27In 1979, following the winter drought of the previous year, YP continued to receive low precipitation and experienced a rare drought in its history [45]December 1978–August 1979 (17 yr)
42005205.33This year was the worst drought disaster year in nearly 50 yearsMay 2005–October 2005 (6 yr)
52009103.67This drought was the longest-lasting, most extensive, and most harmful mega-drought since meteorological records beganMay 2009–November 2010 (96 yr)
62010283.85
72011123.05YP suffered from persistent drought, with 25 counties breaking historical records of least precipitationJuly 2011–November 2013 (248 yr)
82012107.27Drought in YP continued to worsen and finally affected tens of millions of people
92013117.74
102019138.12The impacted scope, intensity, and duration of drought disasters in Yunnan in 2019 ranked the second severity of drought disaster since 2010April 2019–March 2020 (32 yr)
Disclaimer/Publisher’s Note: The statements, opinions and data contained in all publications are solely those of the individual author(s) and contributor(s) and not of MDPI and/or the editor(s). MDPI and/or the editor(s) disclaim responsibility for any injury to people or property resulting from any ideas, methods, instructions or products referred to in the content.

