Article

Similarities of Three Most Extreme Precipitation Events in North China

1
National Meteorological Centre, Beijing 100081, China
2
State Key Laboratory of Severe Weather, Chinese Academy of Meteorological Sciences, Beijing 100081, China
3
Nanjing Meteorology Bureau, Nanjing 210000, China
*
Author to whom correspondence should be addressed.
Atmosphere 2023, 14(7), 1149; https://doi.org/10.3390/atmos14071149
Submission received: 27 May 2023 / Revised: 1 July 2023 / Accepted: 12 July 2023 / Published: 14 July 2023
(This article belongs to the Special Issue Weather and Climate Extremes: Observations, Modeling, and Impacts)

Abstract

:
In this study, three typical and most extreme precipitation events in the history of North China are analyzed and compared in terms of accumulated precipitation and synoptical circulation using surface station observations of China and the ERA5 dataset. The three events happened in August 1963 (“63.8” event, hereafter), August 1975 (“75.8” event), and July 2021 (“21.7” event), respectively, mainly in Hebei and Henan Provinces of North China. The results show that the maximum daily and 4-day accumulated precipitation of all three events exceeded 500 mm and 800 mm, with many stations’ daily precipitation ranking Top 1. The “63.8” event persisted for the longest time, affected the largest area, and rained the most in 7 days (over 1000 mm). The “75.8” event was characterized by the most extreme daily precipitation and a concentrated area. All three events characterize a normal northward subtropical high that was located in North China and Northeast China. At 500 hPa, the area from South China to the South China Sea was dominated by a uniform pressure field. In the upper levels, there were troughs and divergence anomalies in all three events. In the low levels, there were anomalous low-level jets and the associated water vapor flux anomalies, which were located at different levels and came from different directions. Stable synoptical circulation and persistent jet and water vapor flux anomalies are the key factors in these extreme events.

Graphical Abstract

1. Introduction

Climate change, in particular extreme weather events, caused damage to production systems [1,2]. In the context of global climate change, numerous studies have shown a significant increasing trend of extreme precipitation events in North China [3,4,5,6]. Extreme precipitation often causes severe disasters due to its suddenness and excessive precipitation [7,8]. Meanwhile, it is a low-probability event and is difficult to be precisely forecasted by not only numeric weather models but also forecasters [9,10].
In the history of North China, there were three extreme precipitation events with severe disasters. First, the event happened mainly from 2–8 August 1963 in Hebei province of North China (“63.8” event hereafter) (Figure S1), and second, it happened mainly from 4–8 August 1975 in Henan province of North China (“75.8” event hereafter) (Figure S2) [11]. The third is the event that happened from 18–22 July 2021 in Henan province of North China (“21.7” event hereafter) (Figure S3) [12]. The three events have been researched in many papers. For example, Tao 1980 [11] analyzed the planetary scale, synoptical scale, and meso-scale weather systems and the effects of topography. Research on the “75.8” event has shown that the adjustment and stable maintenance of large-scale systems and the interactions between multi-scale systems that resulted in significant water vapor transport are identified as the major causes for this extreme precipitation event [13,14,15,16]. Research on the “21.7” event has shown that the upper-level synoptic disturbance [17] and low-level jets [18] are critical for the “21.7” event. Yin et al. (2023) [19] and Cheng et al. (2022) [20] researched the water vapor budget and micro-physics processes of this event. Yin et al. (2022) [21] pointed out that the arc-shaped convergence zone of a well-organized mesoscale convective system concentrating the precipitation may be a possible dynamic mechanism.
It is shown that a lot of research has been conducted on these three events and the key points of these studies are not the same [10,11,13]. However, for weather forecasters, they may care about the similarities and differences of these three events between precipitation and circulation, and just these similar features could be useful. There is little comparison or comprehensive analysis between them. Analyzing the precipitation and synoptic circulation differences and similarities of these three events may be helpful to realize and forecast similar extreme events.
For precipitation analysis, not only the daily precipitation but also the 4-day and 7-day accumulated precipitations are studied and compared. For synoptic circulation analysis, the standardized anomaly method is used. This method has been successfully used to quantitatively analyze the extremities of circulation situations and physical quantities and is one of the most common and intuitive analytical methods used in extreme case research and forecasting [22,23]. In recent years, this method has been widely used in the analysis and forecasting of extreme precipitation events [24,25].
The remainder of this paper is organized as follows: Section 2 describes the data and methods used in this study. Section 3 presents the comparison and analysis of these three events in precipitation and synoptic circulation. Section 4 presents a brief discussion, and the conclusion is summarized in Section 5.

2. Materials and Methods
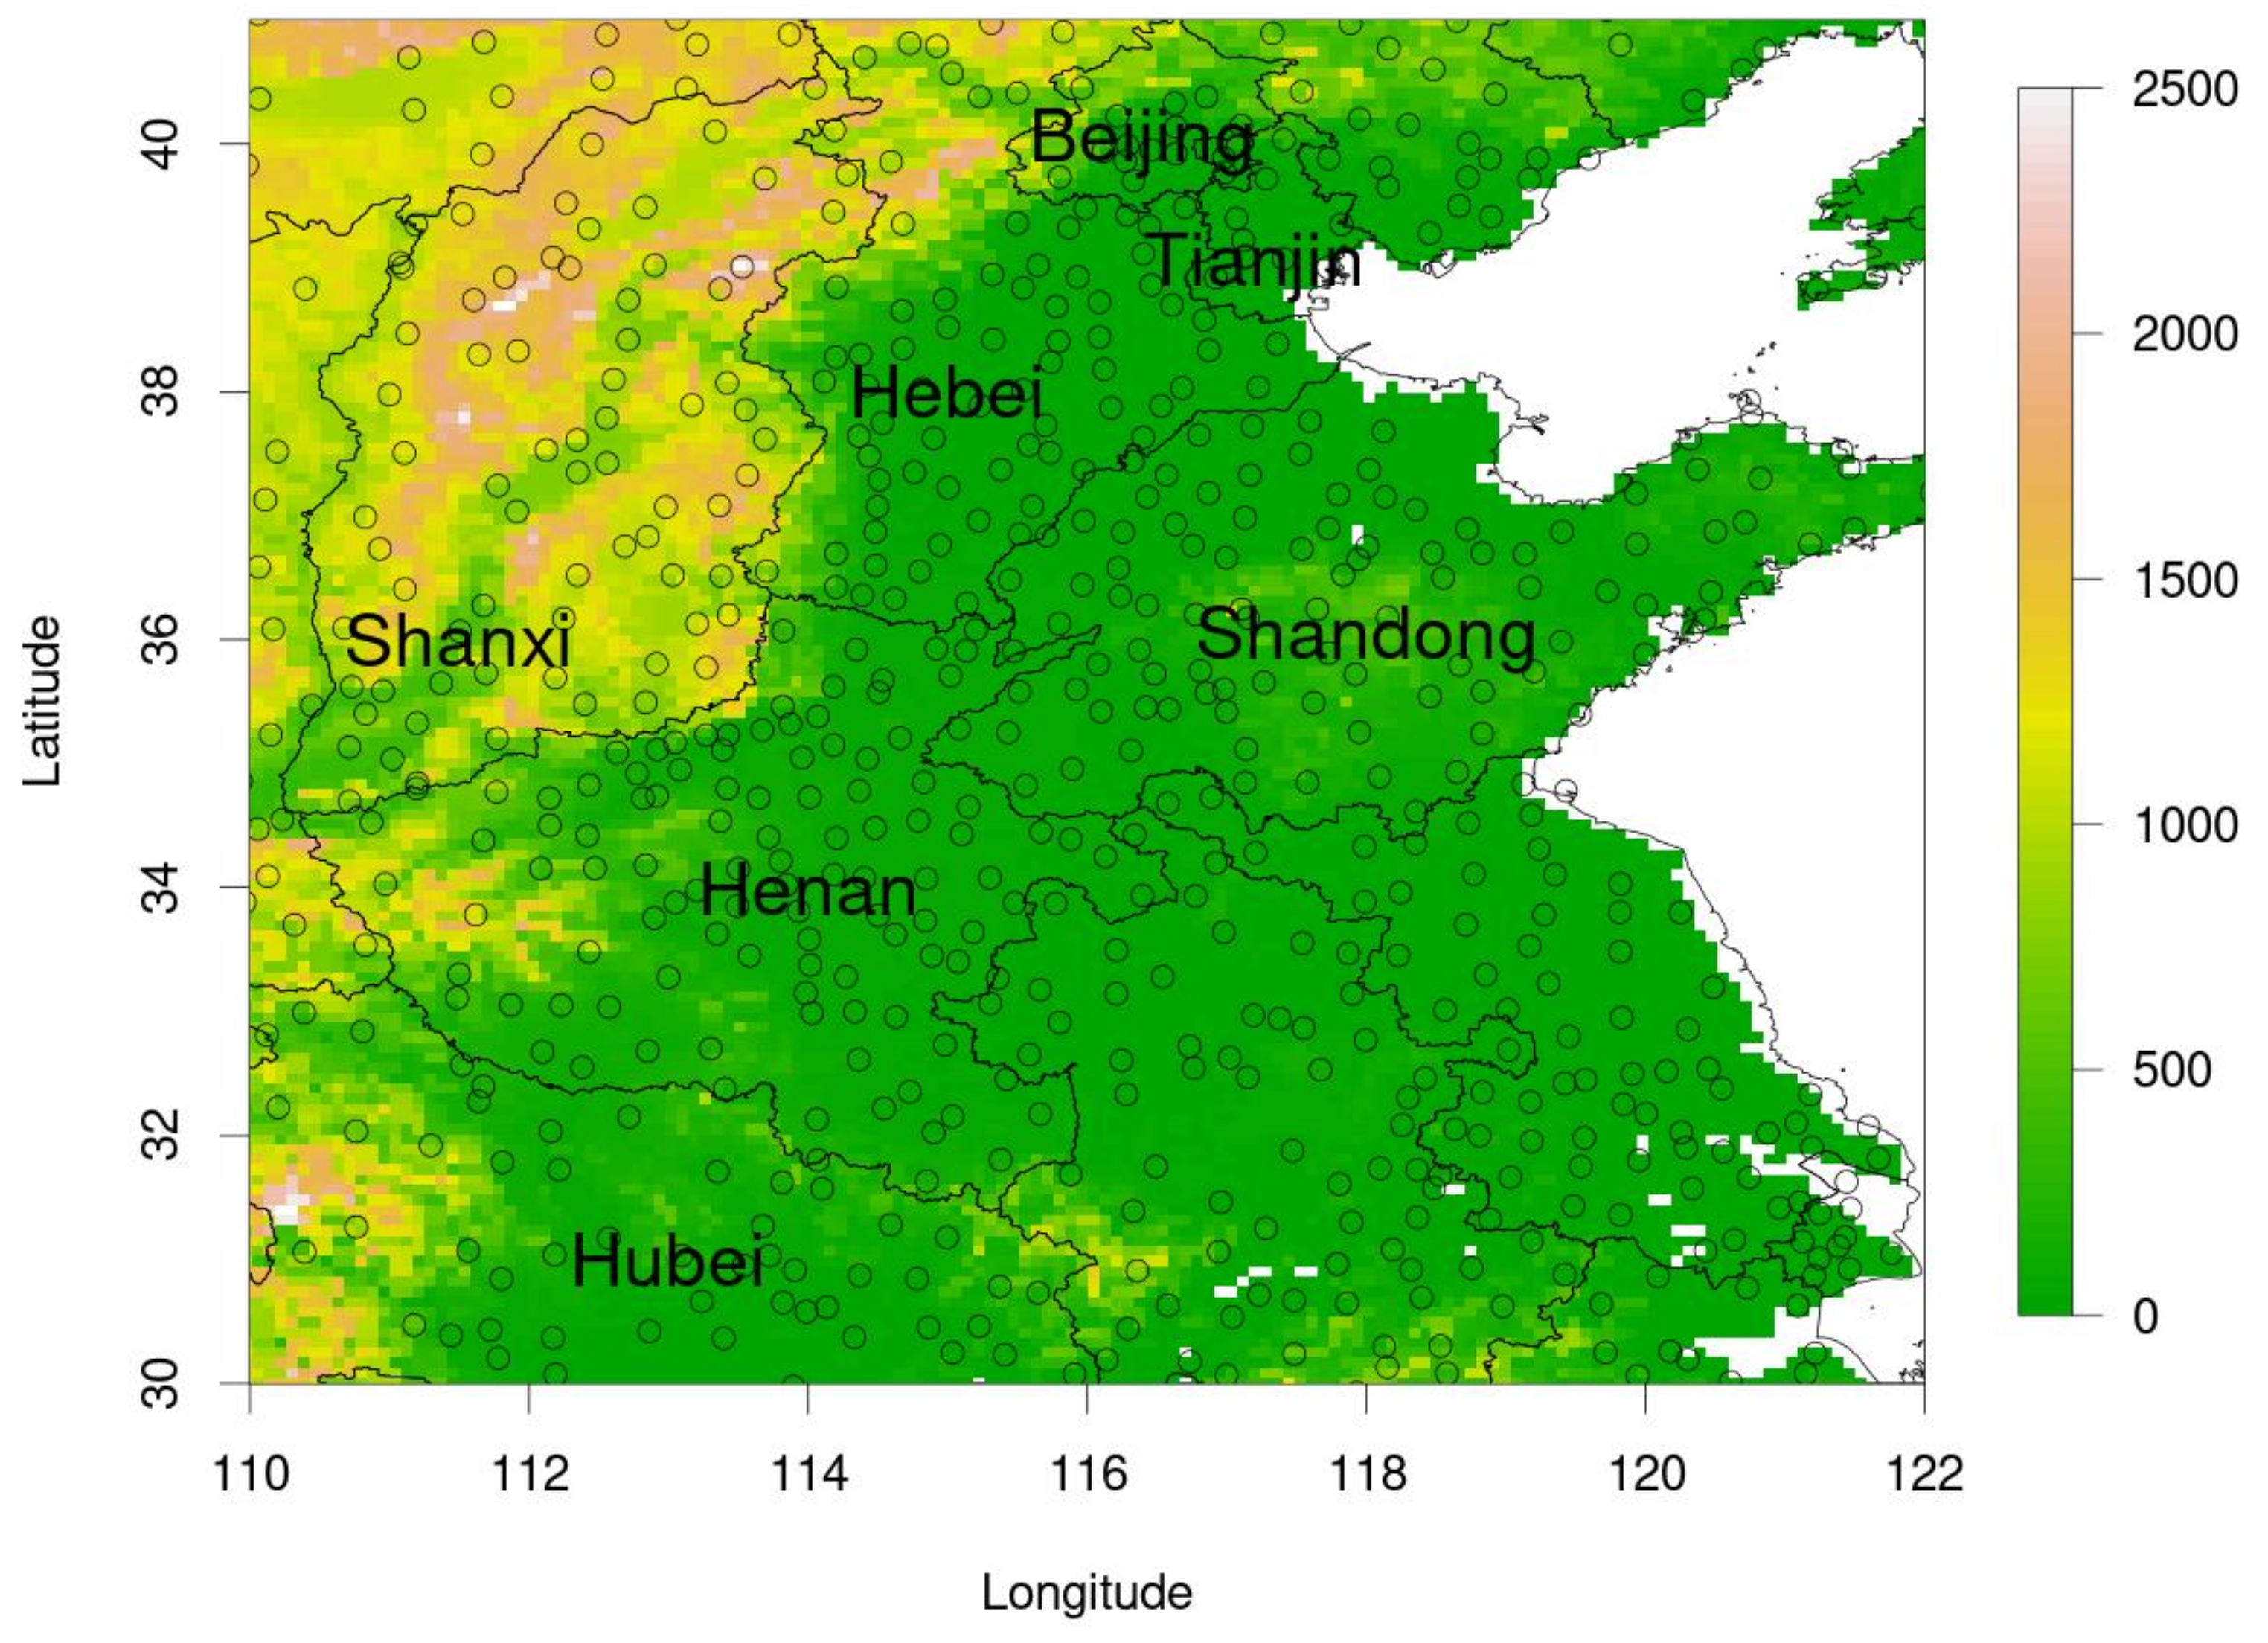
2.1. Data

The daily precipitation dataset accumulated from the previous 20:00 BJT to the 20:00 BJT from the National Meteorological Information Center of the China Meteorological Administration (CMA) is used in this study, which includes 2481 national stations on the Chinese mainland. The data is from 1 January 1951 to 31 December 2021. The sample numbers of stations in this dataset increase from more than 100 in 1951 to about 2000 in 1960, then increase to about 2400 in the 1970s, and then have been basically stable. To ensure the consistency of the data, the data in the year with annual missing samples greater than 20 days is excluded, and the number of valid years between 1951 and 2021 is ensured to be greater than or equal to 55 [4]. Most of the above-mentioned stations have been relocated, even more than once. The average relocation distance is more than 6 km. Lu et al. (2016) [26] showed almost no effects on the statistics of daily extremes at the stations with relocation distances less than 40 km. To preserve as many samples as possible, samples with a relocation distance greater than 20 km are excluded. Finally, the daily precipitation data of 532 stations across China’s mainland are deleted, and the station distribution of the research area is shown in Figure 1.

2.2. Standardized Anomaly Methods

For extreme precipitation events, the synoptic circulation and physical environment in which extreme events occur can be analyzed by the anomalies of circulation and physical quantities [22,23,24,25]. The standardized anomaly (SA) is defined as the degree of deviation of variables from the climatic mean states:
S A = V M / σ
where V is the value of a variable at a certain moment or point. M and σ are the climate mean and standard deviation of that variable at the same period and point, respectively. The SA value represents the multiple of the variable anomaly to the climate standard deviation σ. Generally, |SA| ≥ 3 indicates a more significant anomaly. The climate state is selected as in previous studies [7], in which samples of 21 days (10 days before and 10 days after the current day) from 1981 to 2010 were selected to calculate the 30-year climate mean and standard deviation. The climate analysis data are based on the hourly ERA5 global reanalysis data with a 0.25° × 0.25° resolution.
Based on the hourly ERA5 reanalysis data, the circulation patterns of the three events are analyzed. The circulation at different levels, including surface, 925 hPa, 850 hPa, 700 hPa, 500 hPa, and 200 hPa, and so on, with wind, geopotential height, water vapor, water vapor flux, and CAPE, are analyzed.

3. Results

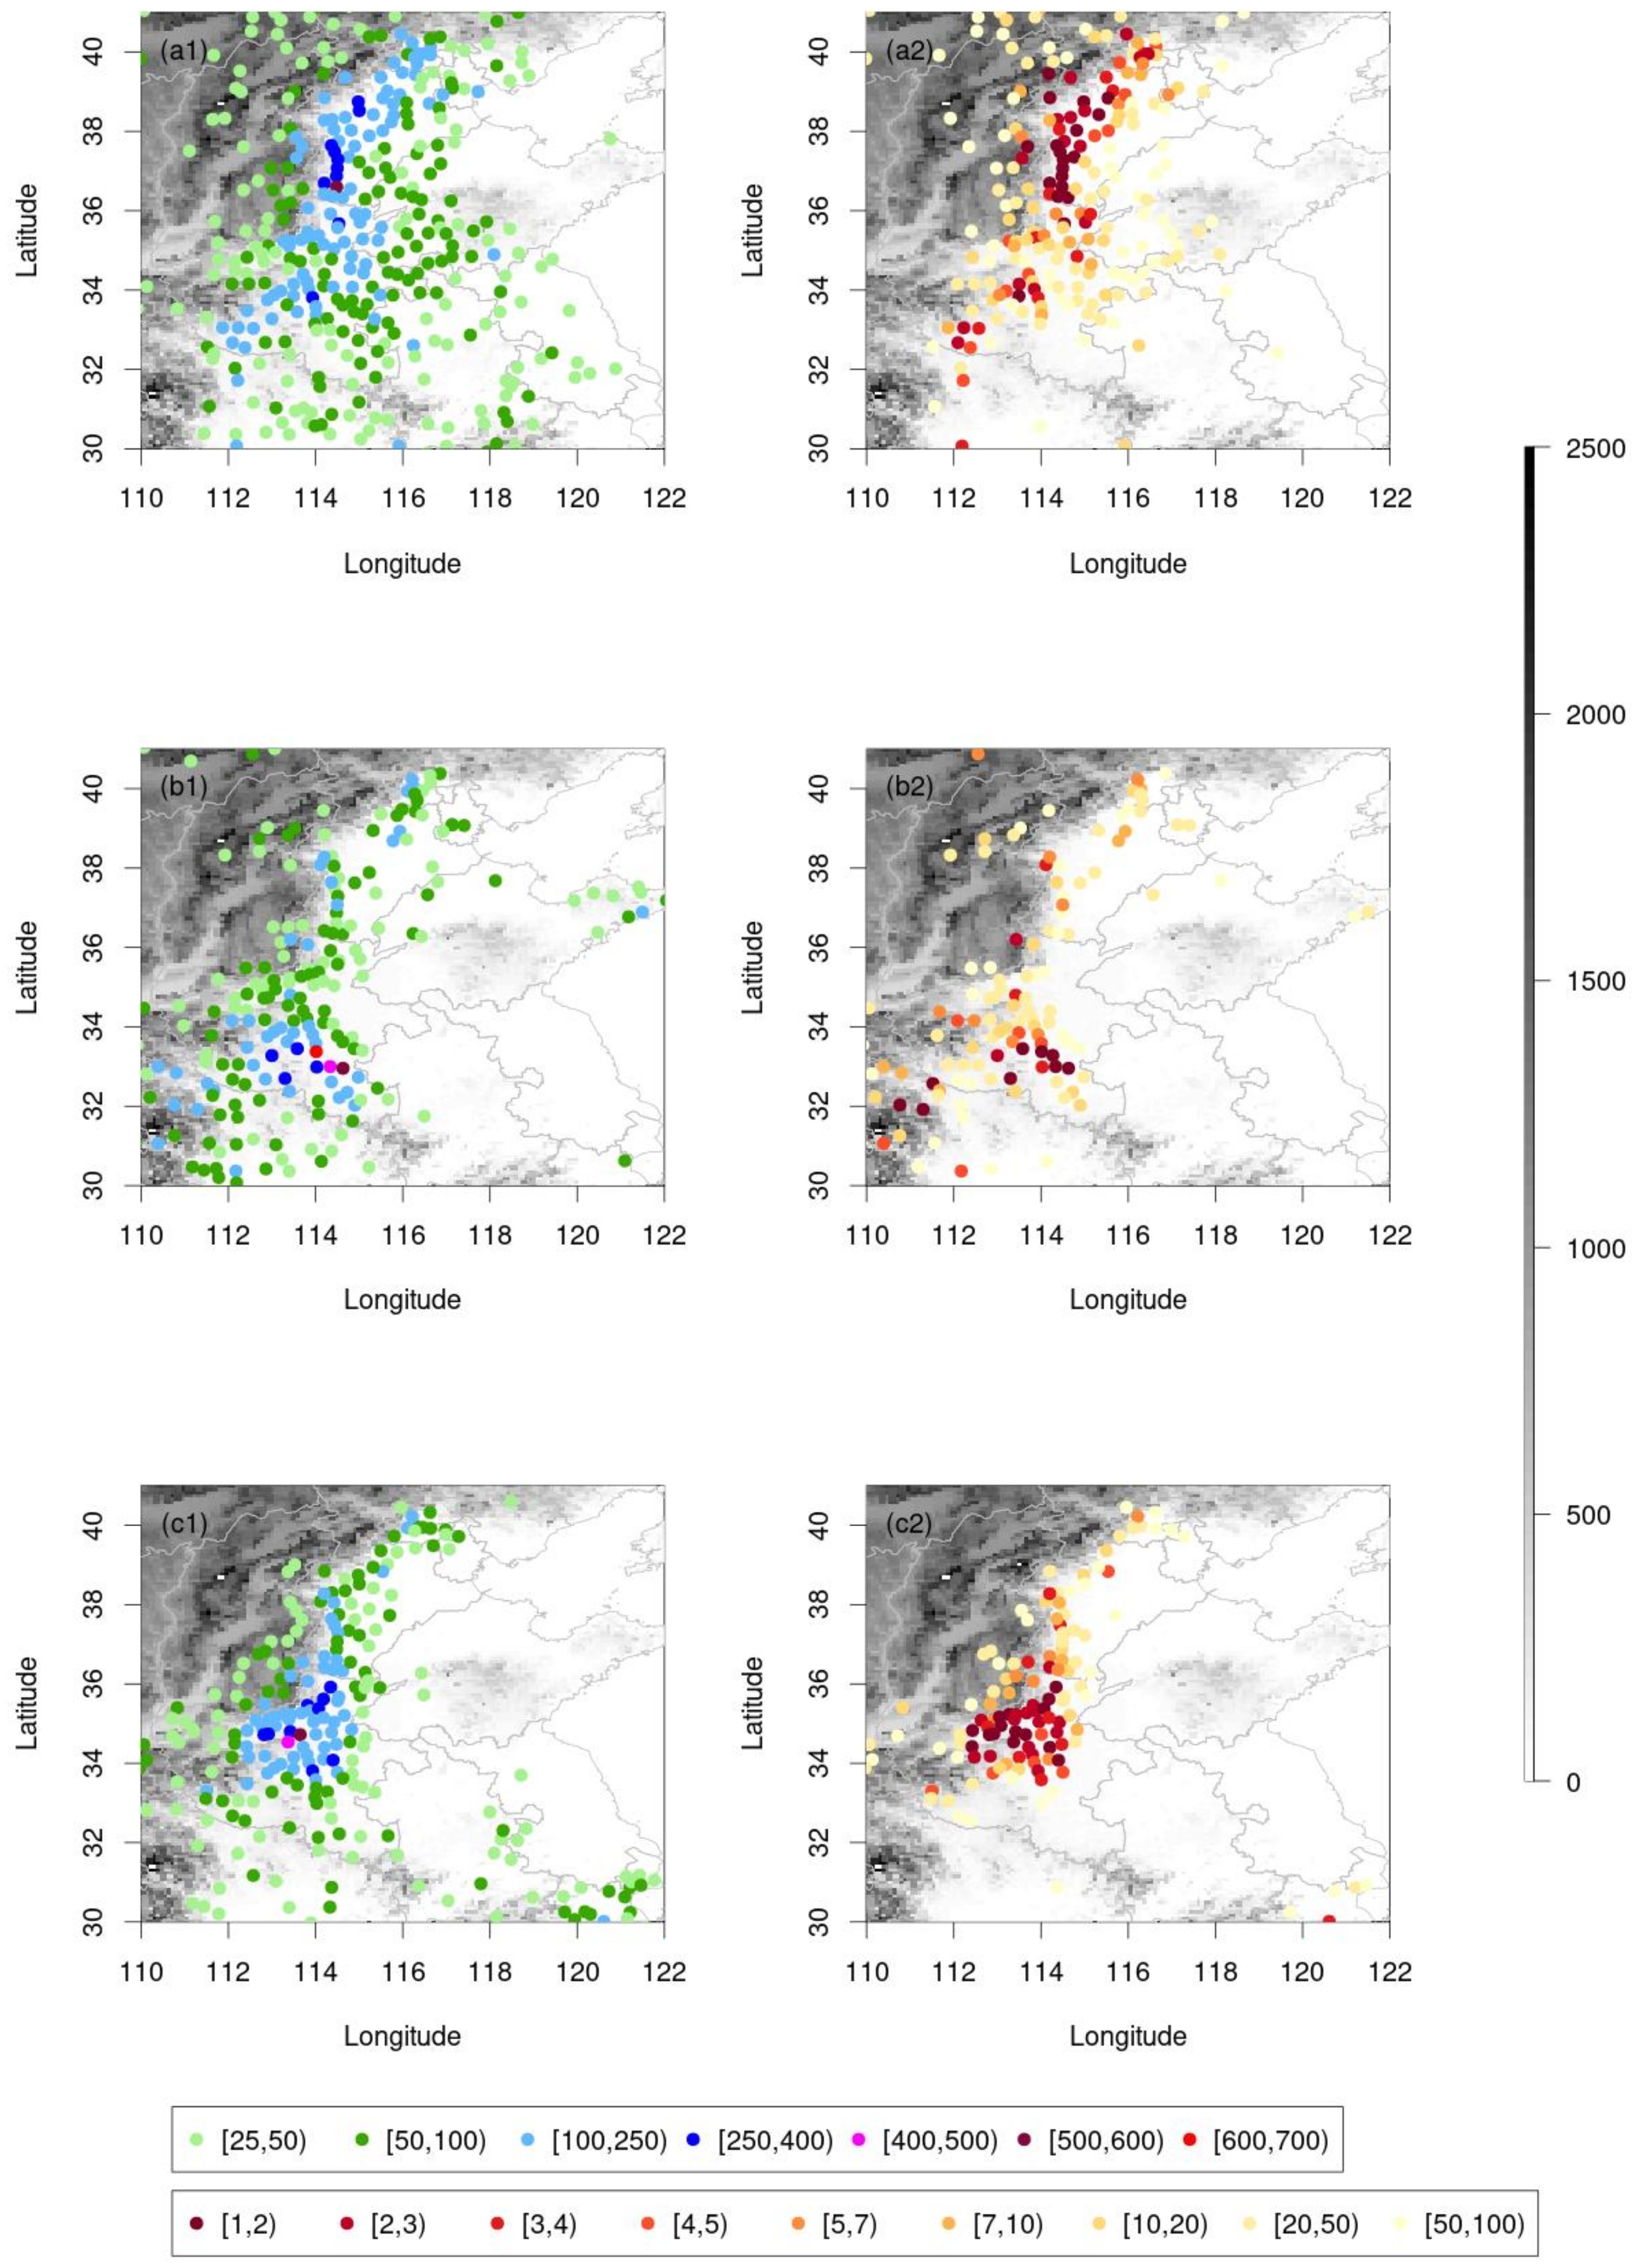
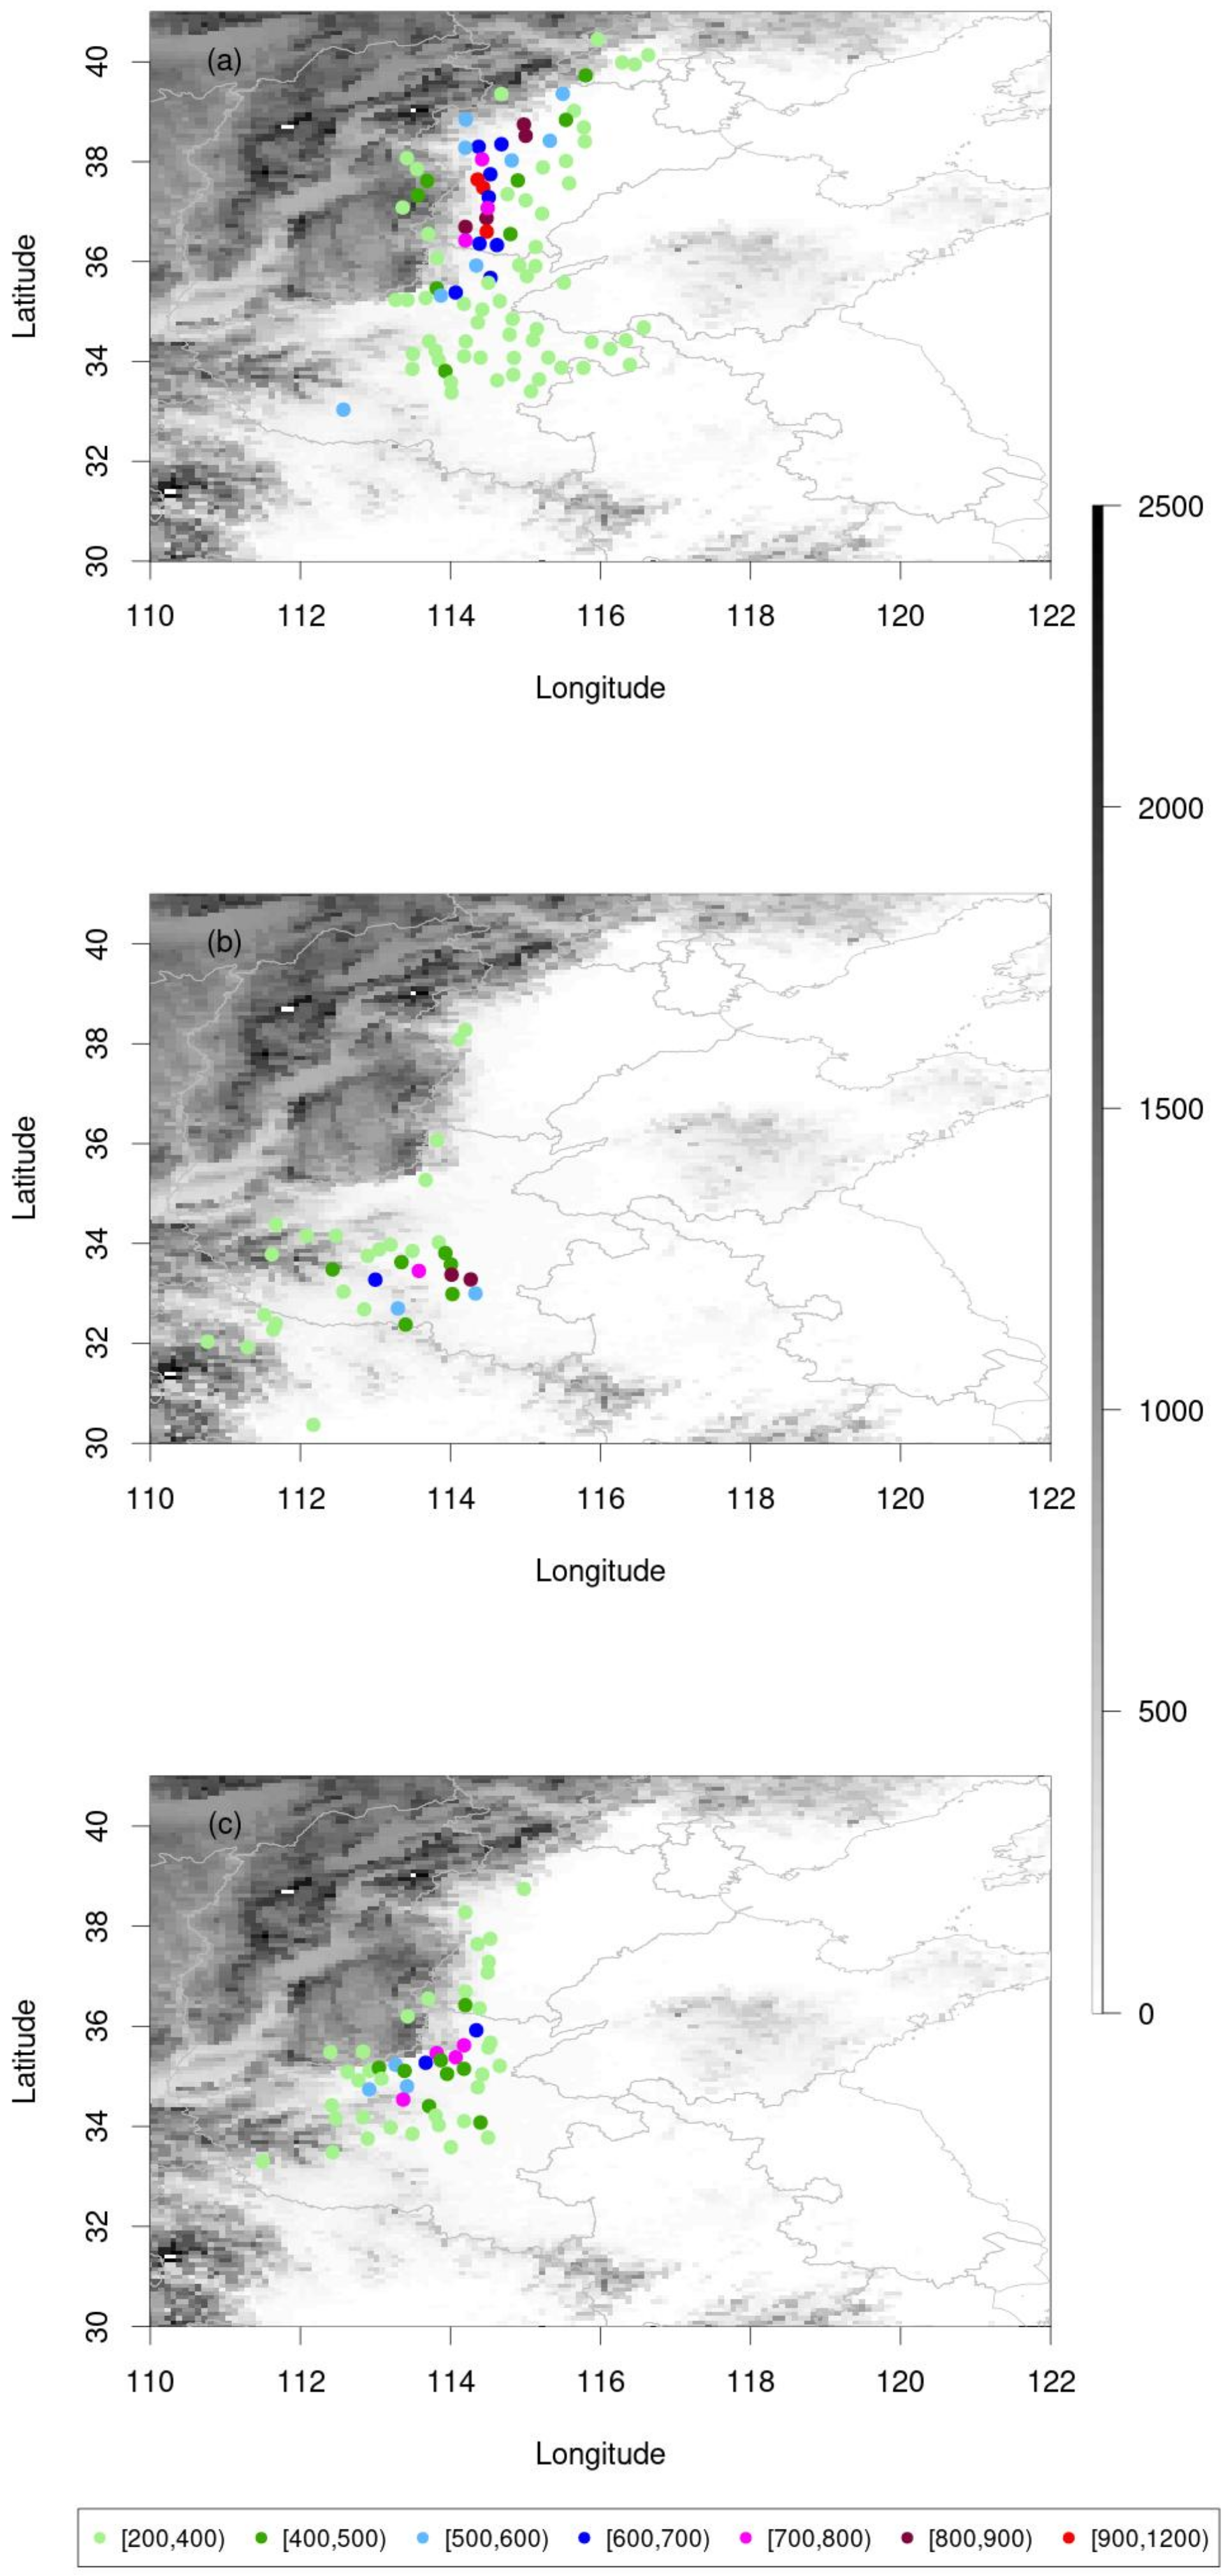
3.1. Precipitation Extremes of the Three Events

The basic information about the three extreme events is shown in Table 1. It is indicated that the time period of “63.8” is the longest, which is 9 days, and the time period of “75.8” is the shortest, which is 5 days. It has the highest 7-day accumulated precipitation (1137.1 mm) and is significantly larger than the other two events. However, the maximum daily precipitation of “75.8” (755.1 mm/d) is the largest among the three events, which is also the Top 1 daily precipitation observed in China mainland in history [11,14] (Table S1), and the maximum daily precipitation of “63.8” (518.5 mm/d) is the smallest among the three events, which is ranked around the Top 30 of daily precipitation in China’s mainland. In addition, there is another daily precipitation of “75.8” ranked in the Top 7 of daily precipitation on the Chinese mainland. So, the “75.8” event is characterized by the most extreme daily precipitation. The time period of “21.7” (6 days) is shorter than that of “63.8” and longer than that of “75.8” and the daily maximum of “21.7” is larger than that of “63.8” and smaller than that of “75.8”.
Except for the common features of extreme precipitation and similar impact regions, the typical characteristic of “63.8” is its persistent long period, which is featured by the largest 4 days and 7 days of accumulated precipitation. Especially the 7-day amount is 1137.1 mm, which is significantly larger than that of the other two events. The typical characteristics of “75.8” are its most extreme daily precipitation, with Top 1 and Top 7 of daily precipitation on the Chinese mainland (Table S1). The typical characteristics of “21.7” are its Top 1 hourly precipitation on the Chinese mainland in history [12].
From the special distribution of maximum daily (Figure 2(a1,b1,c1)), 4-day (Figure 3), and 7-day (Figure 4) accumulated precipitations and maximum daily precipitation ranks (Figure 2(a2,b2,c2)) of the three events, it is shown that the extreme precipitation centers are different. But the main area affected is in front of the mountain in Henan and Hebei Provinces. The “75.8” event is characterized by the most extreme daily precipitation. However, the stations over 100 mm/day and 250 mm/day of the “75.8” event are the least (Figure 2(b1)), which means the most extreme precipitation was concentrated in the smallest area, which may be the reason for the Wangjiaba dam bursting flood during the event [27]. The maximum daily precipitation and their ranks of “63.8” event (Figure 2(a1,a2)) and “21.7” event (Figure 2(c1,c2)) are similar, with over ten stations featuring over 250 mm/day rainfall and ranked Top 1, which means these two events affected a larger area than that of the “75.8” event.
For 4-days of accumulated precipitation, the ”63.8” event was characterized by 11 stations with more than 600 mm (Figure 3a). The station numbers with more than 600 mm of “75.8” (Figure 3b) and “21.7” (Figure 3c) events are all 5, which means the extreme precipitation of the “63.8” event affected the most area and longest period.
For 7 days of accumulated precipitation, the ”63.8” event was characterized by 10 stations with more than 700 mm (Figure 4a). The station numbers with more than 700 mm of “75.8” (Figure 4b) and “21.7” (Figure 4c) events are 3 and 4. It is different from the 4-day accumulation of precipitation. It is indicated that the “63.8” event was characterized by not only the maximum 7-day accumulated precipitation but also the largest area. The “75.8” event featured the most extreme daily precipitation and the most concentrated area. The “21.7” event was characterized by more extreme daily precipitation than the “63.8” event and a larger affected area than the “75.8” event.

3.2. Circulation and Physical Quantities Comparison

Based on the widely used standardized anomaly method [25], the similarities and differences of the anomalies of circulation and physical quantities among the three events are analyzed in detail.

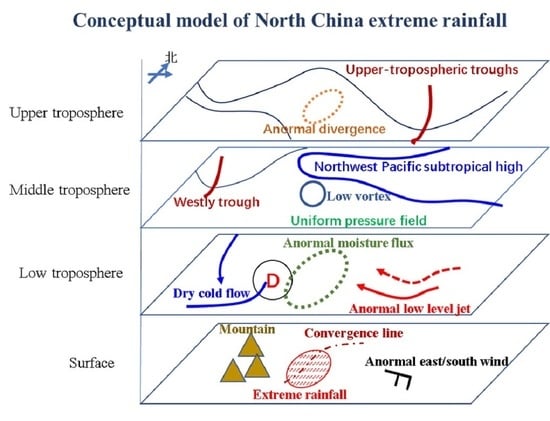
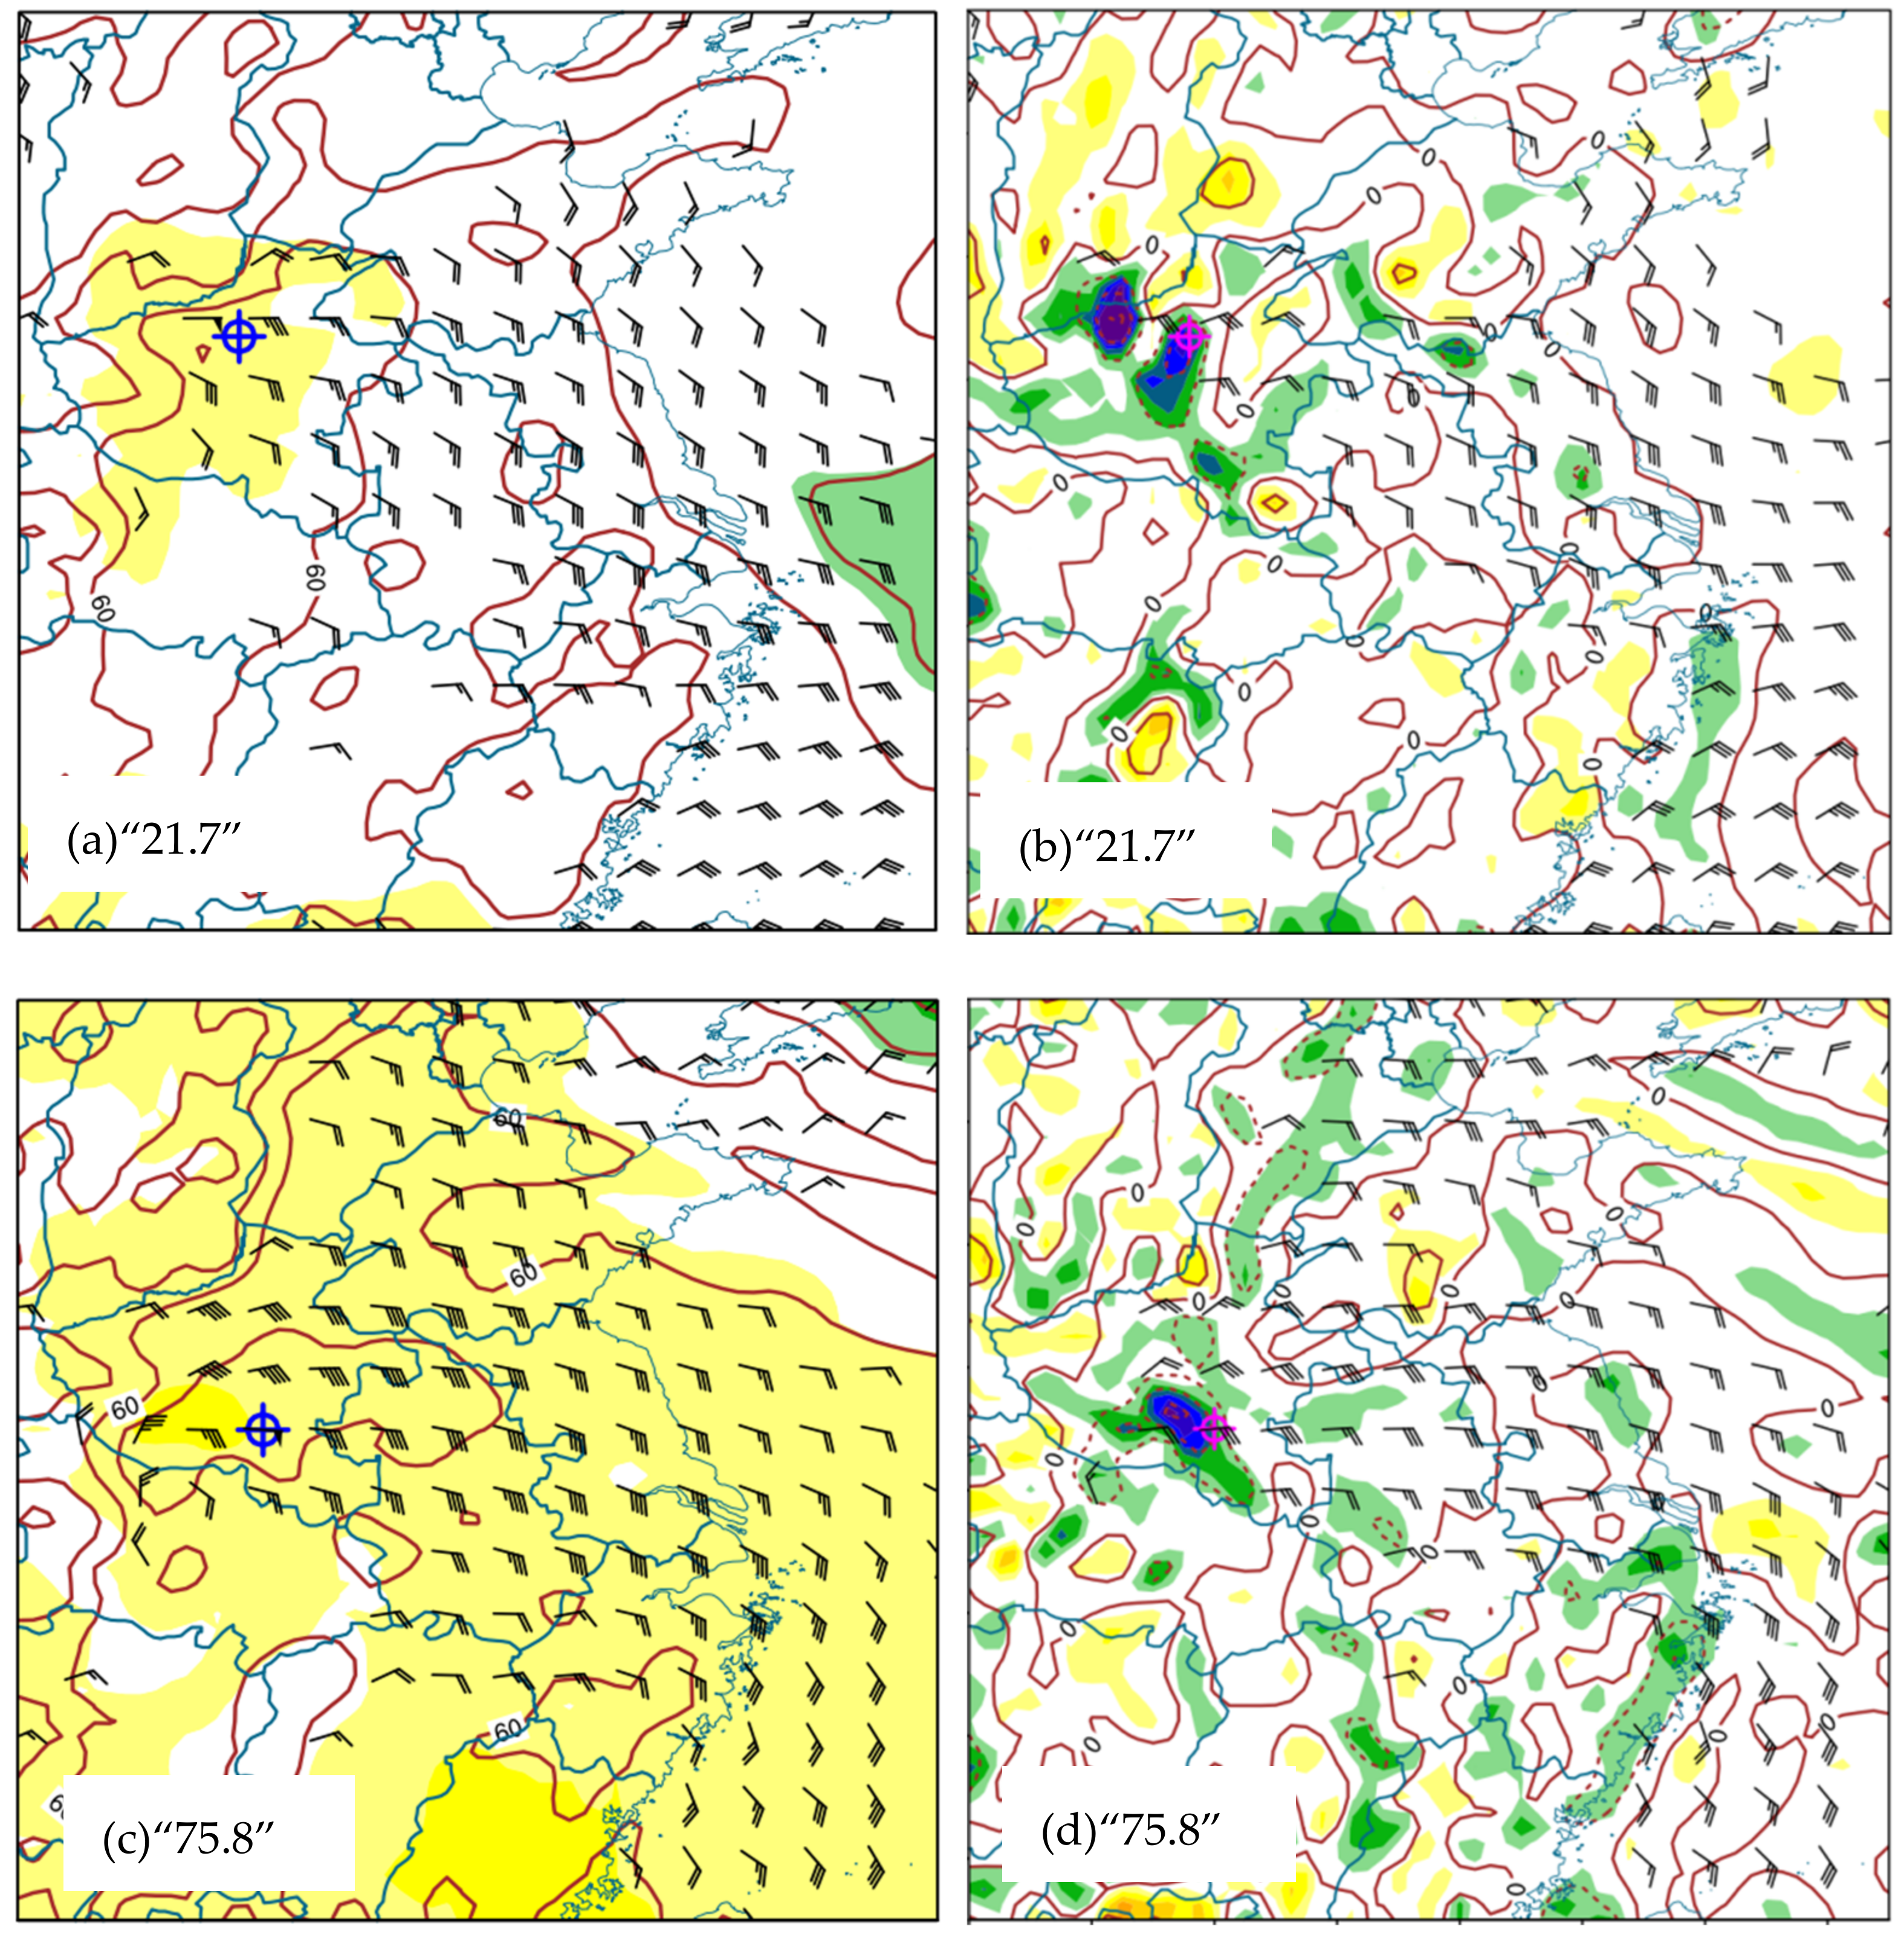
3.2.1. Circulation Anomalies

In the three events, the western Pacific subtropical high (WPSH) at 500 hPa extended abnormally northwestward and controlled Northeast China, North China, and eastern Mongolia. The extreme precipitation areas are all to the south of the WPSH, and the standardized anomaly of the WPSH height field is between 1σ and 2σ (Figure 5a,c,e), forming a stable and strong “high-pressure barrier”. It blocks the northward movement of the precipitation system and facilitates the maintenance of precipitation in North China for a long time. Another common feature of the three events is that a westerly trough exists in western Siberia, but its standardized anomaly is not significant. In addition, the contours at 500 hPa are sparse from South China to the South China Sea in the three events. It is indicated that a uniform pressure field exists over a wide range of areas south of the events.
During the “75.8” and “21.7” events, there were typhoons or tropical depressions in the South China Sea or the Northwest Pacific, which contributed to stronger water vapor transport [12]. But there was no typhoon activity in the “63.8” event. This might be the reason for the smaller daily precipitation intensity in the “63.8” event. At 200 hPa, all three events are in front of the upper tropospheric trough. There are obvious upper-level divergences near this rainstorm area, with the standardized anomaly of divergence reaching about 4σ. It means that, like the “21.7” event, the upper-level disturbances are critical for all three events. Research has shown that the upper-level trough/low is important for persistent weather events, like extreme precipitation, because of its long life [28]. The range and intensity of the divergence anomalies in the northern part of the rainstorm area of the “21.7” event and the “75.8” event are significantly larger than those of the “63.8” event (Figure 5b,d,f). The above-mentioned circulation signals in the middle and upper troposphere persist for more than three days in all three events (figure omitted), which are the key reasons for these events [11].

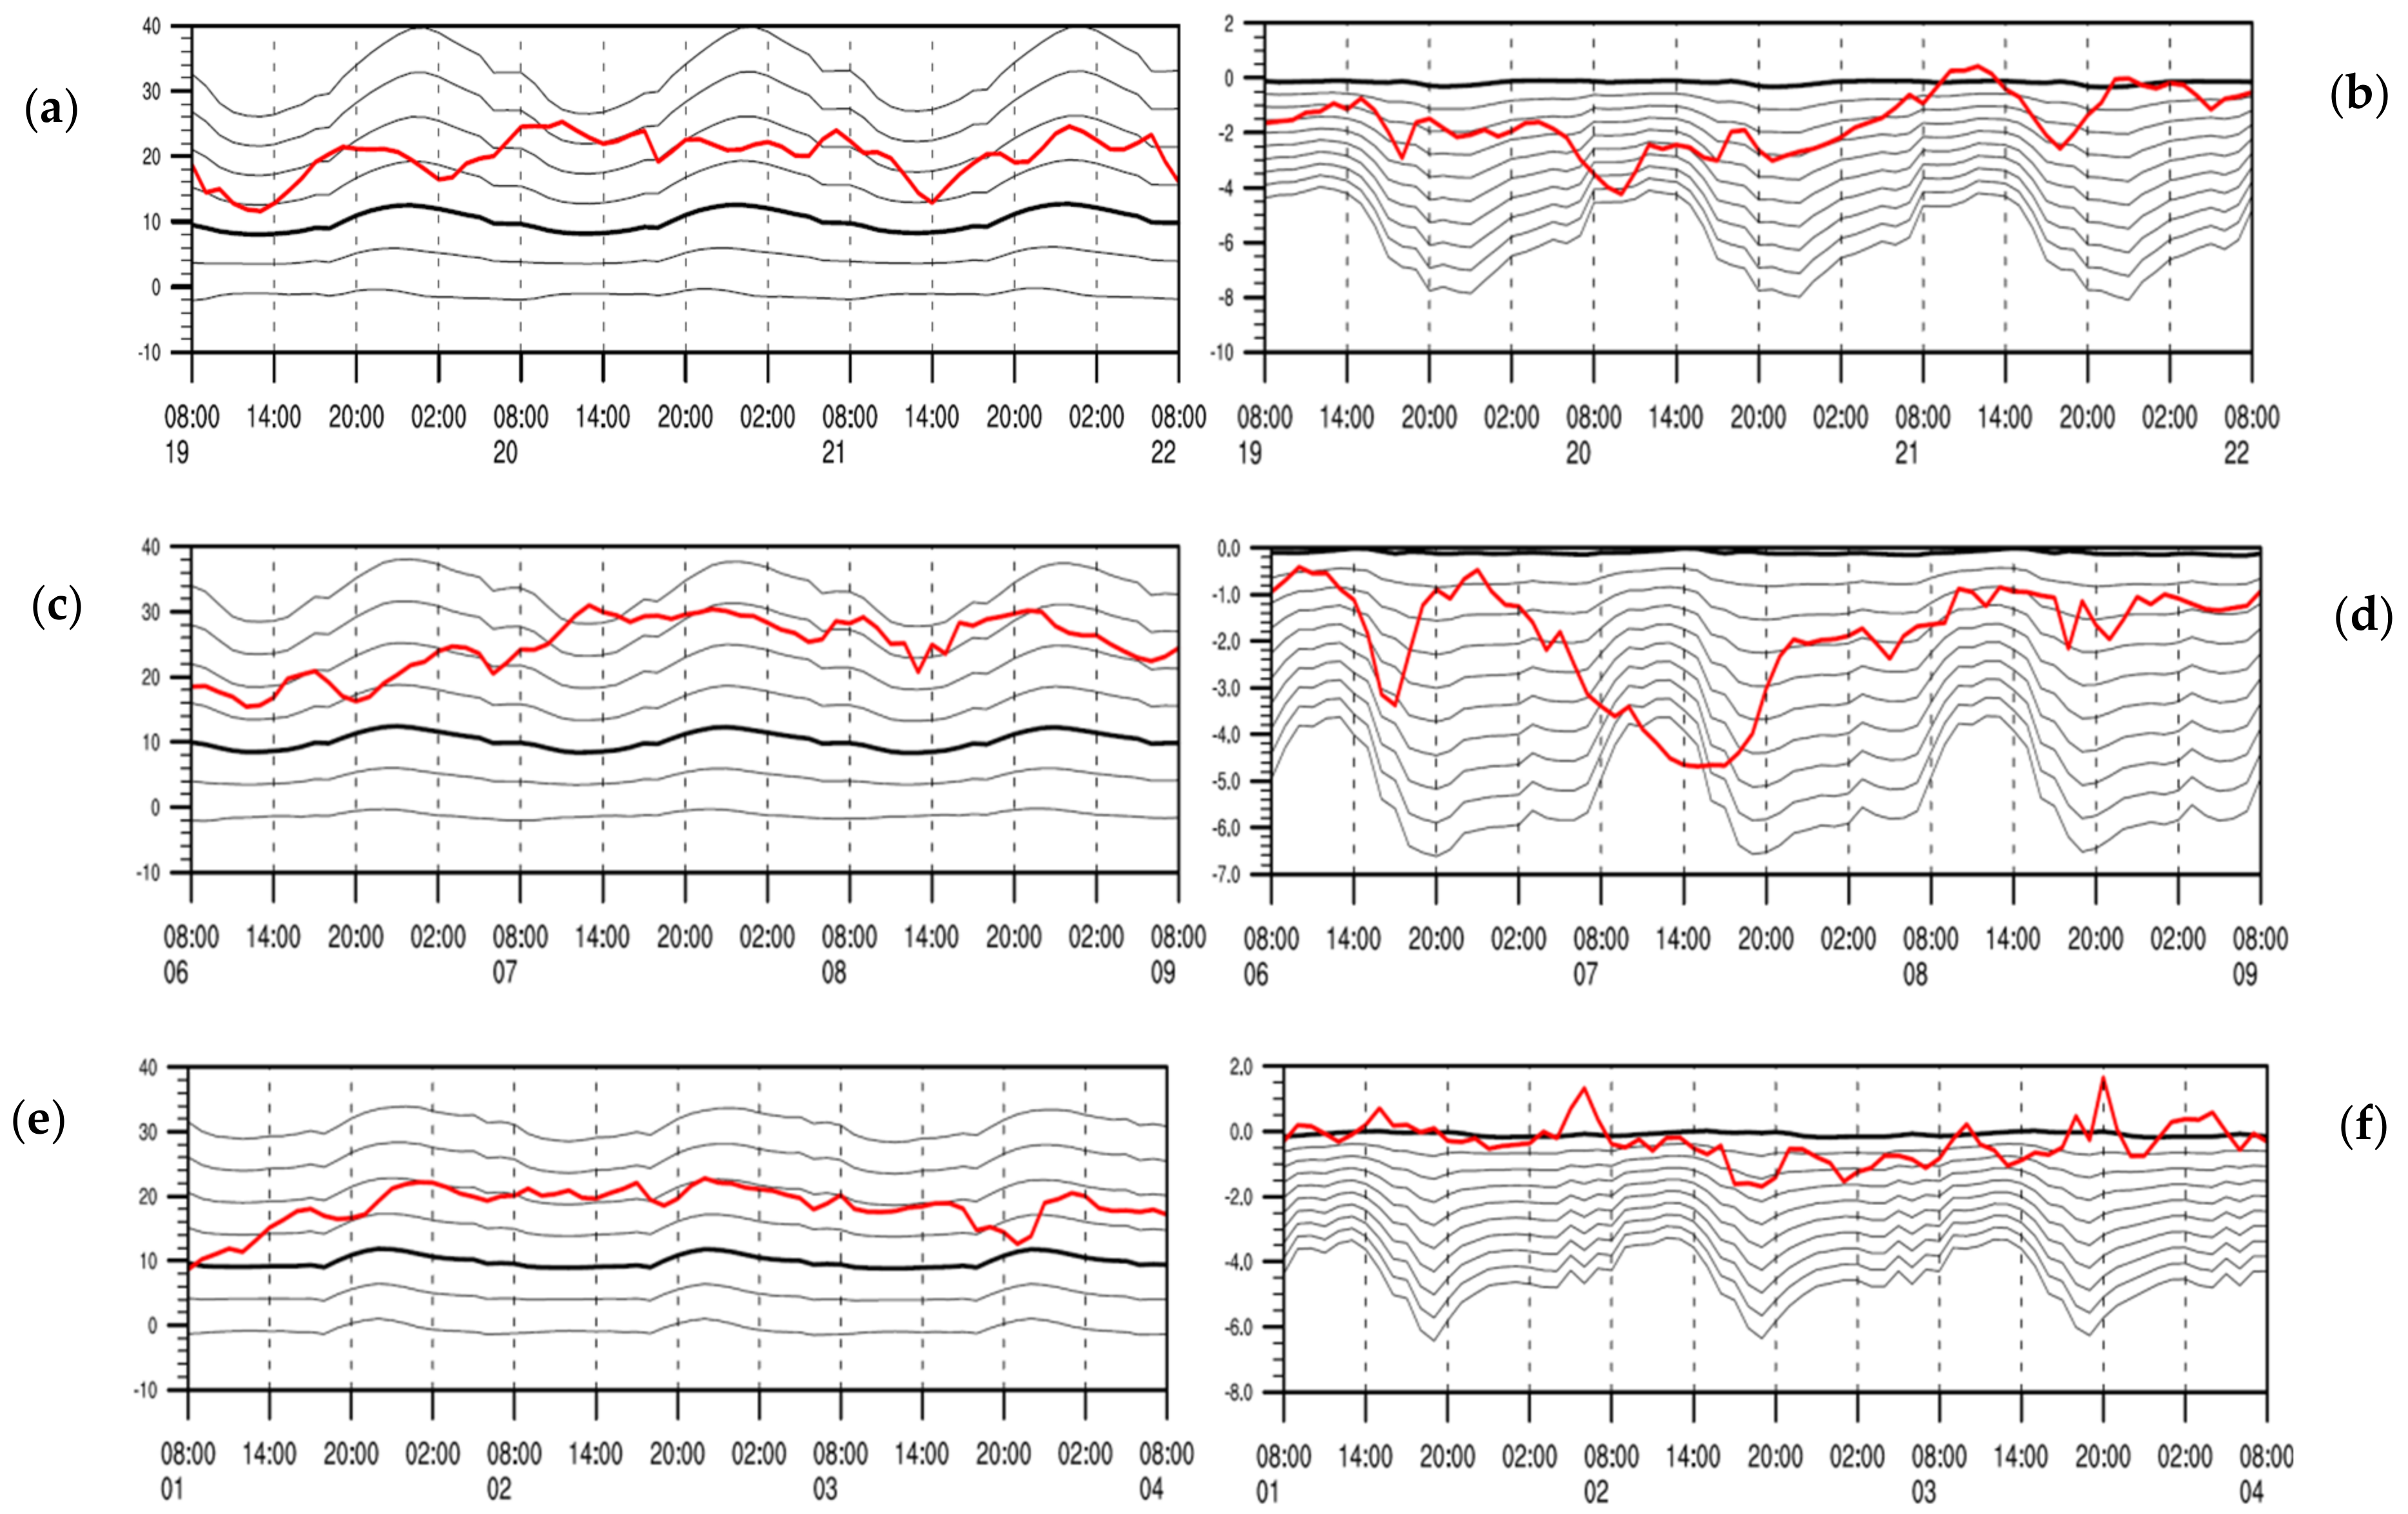
3.2.2. Water Vapor Anomalies

Abundant water vapor supply is necessary for the occurrence of extreme precipitation [19,20,24,29]. In this section, the water vapor characteristics of the three events are analyzed from the extremities of water vapor flux, low-level wind, and whole-layer water vapor content. Figure 6 shows the distributions of low-level water vapor transportation and its standardized anomalies for the three extreme precipitation events. As can be seen, there is obvious low-level water vapor transport in the upstream areas in all three events. The water vapor transport for the “21.7” and “75.8” events originates from the southeast of the rainstorm area, while it originates from the south of the rainstorm area in the “63.8” event (Figure 6a,c,e). The heights of the strongest water vapor transport are different in the three events. The strongest water vapor transport in the “21.7” event is at 950 hPa, and the standardized anomaly of water vapor flux near Zhengzhou station is 3σ. The anomaly of water vapor transport at 850 hPa is weaker than that at 950 hPa. The anomalies of water vapor transport at 850 hPa and 950 hPa for the “75.8” event and the “63.8” event are equivalent. The maximum standardized anomaly of water vapor flux in the “75.8” and “21.7” events, which have a larger precipitation rate, reaches about 3σ, while that of the “63.8” event is about 2σ. Evidently, the standardized anomaly of water vapor flux is positively correlated to the precipitation rate of extreme precipitation events (Figure 6b,d,f).
Extreme precipitation is always accompanied by low-level jets [18,30]. From the low-level wind speeds of the three events, the most prominent feature is the anomalously strong and stable low-level jet. The “21.7” and “75.8” events are dominated by easterly jets, while the “63.8” event is dominated by the southerly jet. The standardized anomalies of the jet wind speed are all up to 3σ to 4σ (figure omitted). Figure 7 shows the distributions of low-level wind, whole-layer water vapor content, water vapor flux divergence, and the standardized anomalies for the three extreme precipitation events. In the “21.7” event, the area with an easterly wind speed anomaly on the south of the WPSH and the north of Typhoon In-Fa extended to Henan Province and steadily maintained itself from 20–22 July. In particular, at 950 hPa, the wind speed in the upstream area of the easterly wind was maintained at 10 m/s or more. Persistent southeasterly ultra-low-level jets over 12 m/s occurred in several areas, which provided favorable dynamical conditions and water vapor transport for the persistent extreme precipitation in its downstream areas (Henan Province). Overall, the low-level jet and the accompanied strong water vapor transport are common features of the three extreme precipitation events. The anomaly of low-level water vapor transport has a certain positive correlation with the precipitation extremity.
Figure 7 shows that the anomaly of the whole-layer water vapor content in the “75.8” event is the most obvious, generally reaching above 70 mm in south-central Henan, with a standardized anomaly of 2σ to 3σ. The whole-layer water vapor content is above 60 mm in the “21.7” and “63.8” events, with a standardized anomaly of 1σ to 2σ. The area where the whole-layer water vapor content exceeds 60 mm in the “21.7” event is slightly larger than that in the “63.8” event (Figure 7a,c,e). In terms of the water vapor flux divergence at 975 hPa, the standardized anomaly of all three events reaches about −4σ, and there is anomalous water vapor convergence in the low level. The anomalies of water vapor flux divergence in the “21.7” and “75.8” events are also stronger than in the “63.8” event (Figure 7b,d,f).
In terms of water vapor conditions, the water vapor anomaly of the “21.7” event is mainly reflected in the water vapor flux and water vapor flux divergence. The rainfall in the “21.7” event reaches its strongest in the afternoon and evening of 20 July. At 17:00 BJT, the extreme hourly precipitation (201.9 mm/h) occurred at Zhengzhou station, breaking the historical record for the Chinese mainland [12]. At 12:00 BJT and 22:00 BJT, the hourly precipitation at Yanshui and Fugou stations broke their own historical records. Figure 8 shows the temporal variations of 950 hPa water vapor flux and 975 hPa water vapor flux divergence in the three extreme precipitation events at some stations. As can be seen, in the “21.7” event, the 950 hPa water vapor flux in the upstream area of Zhengzhou station reaches its peak at 10:00 BJT and 16:00 BJT on 20 July, and the standardized anomaly reaches 3σ (Figure 8a,b). From the second half of the night of 19 July to the first half of the night of 20 July, the standardized anomaly of the 975 hPa water vapor flux divergence is basically below −3σ, with the peak up to −8σ. The most significant anomalies of water vapor flux and water vapor flux divergence are in the “75.8” event (Figure 8c,d). The 950 hPa water vapor flux anomaly could reach 4σ and the 975 hPa water vapor flux divergence anomaly could reach below −9σ. Compared with the other two events, the anomalies of water vapor flux and water vapor flux divergence in the “63.8” event are smaller (Figure 8e,f). The above analysis shows that the physical quantities related to water vapor conditions in the “21.7” event show obvious anomalies. The overall anomaly is weaker than that in the “75.8” event and slightly stronger than that in the “63.8” event.
Compared with the “7.21” heavy rainfall case in Beijing in 2012 [7] and the “7.19” heavy rainfall case in Henan and Hebei in 2016 [29] (figure omitted), the anomaly of whole-layer water vapor content in the “21.7” event is weaker. But the daily precipitation and hourly precipitation of this case are much higher than the above-mentioned “7.21” and “7.19” events. This indicates that the relationship between the intensity of the extreme precipitation and the extremity of the whole-layer water vapor content is not simply positive. All the mentioned extreme precipitation events are accompanied by anomalous whole-layer water vapor content, indicating that the anomaly of whole-layer water vapor content is a necessary condition for extreme precipitation events. Therefore, the occurrence of extreme precipitation can be predicted based on whole-layer water vapor content, but the strength of extreme precipitation cannot be inferred from this.
The anomalies of convective energy associated with these events are not significant (figure omitted), which is a feature of heavy rainfall. But the CAPEs at the upstream of these events are around 2000 J/kg with a standardized anomaly around 1σ, which means the low-level jet transports not only vapor but also energy, which is important for the mesoscale convective system to persist [31].
Evidently, the standardized anomalies of circulation situations and physical quantities in the three extreme events have certain common features. At 500 hPa, one prominent feature is that the precipitation system is obstructed by the WPSH, which extends northwestward and maintains steadiness in North China and Northeast China. In addition, both the uniform pressure field in South China and the trough in the westerlies contribute to the extreme precipitation of the three events. Moreover, an obvious trough and anomalous divergence area are found in the upper levels. The common features of the physical quantities are the anomalously strong low-level jets and water vapor transport. But the direction and height of the low-level jets, as well as the source of water vapor, are different. Moreover, a positive correlation is detected between the strength of anomalies in physical quantities such as water vapor transport and the extremity of daily precipitation. The anomaly in the whole-layer water vapor content and in the convective available potential energy of upstream areas is another common feature of the three extreme precipitation events, but the correlation between the whole-layer water vapor content and the precipitation extremity is not positive.

4. Discussion

There have been many studies on the “75.8” event from the 1970s to the 2010s, and much attention has been paid to the weakened typhoon and the high located near North China [13,14,15,16]. The research on the “63.8” event is limited and shows that the high in the Japan Sea persisting for about 7 days is important [11]. The research on the “21.7” event indicated that the northward WPSH, upper-level tropospheric trough, low-level jet, and typhon are key synoptic systems [17,18,19,20,21]. This study shows that the typhon/weakened typhon is not a common feature of extreme precipitation in North China. And the low-level jet may come from the east, southeast, south, or southwest, and its core may be positioned at different levels. So these findings are beneficial for understanding extreme precipitation events in North China.
Although there have been many studies on the mechanisms [21,32] and forecast methods for extreme precipitation [9], quantitative precipitation forecasting for extreme events is one of the most difficult challenges in meteorology, not only for the numerical weather prediction (NWP) model but also for forecasters. The NWP models or objective methods that can forecast the daily precipitation over 400 mm always show significant false alarms, and other models or models with a lower false alarm rate cannot forecast the extreme daily precipitation quantitively [12]. So, the forecaster’s knowledge and experience are very important for the forecast of these extreme events. In this study, the “63.8”, “75.8”, and “21.7” extreme precipitation events in North China were compared in detail, and some similarities have been found. These similar features will be useful to forecast these extreme events. However, are these features necessary for extreme precipitation in North China? For example, the extreme northward of WPSH and upper-level tropospheric troughs happen almost every year, but the extreme precipitations do not happen every year in North China. Therefore, other research should be conducted. In addition, there are still other aspects that need to be further investigated, such as the analysis of the extremity of process accumulated precipitation and areal rainfall, the scientific estimation of the recurrence period of each case, the scientific assessment of the uncertainty of the recurrence period, the spatial correlation characteristics of extreme precipitation events, the role of topography in different extreme precipitation events, and the application of different anomalous meteorological factors in extreme precipitation forecast. These questions need to be further studied in the future.
In addition, most of the extreme precipitation could not be forecast precisely and quantitatively. Not only the amount of precipitation but also the exact positions and time periods cannot be predicted accurately nowadays. However, the potential of these extreme events could be forecast and warned about with some false alarms. So, policymakers and people should pay more attention to precipitation warnings and take steps in time.

5. Conclusions

In this study, the three most extreme precipitation events in North China, affecting mainly Hebei and Henan provinces of China, namely the “63.8” event, the “21.7” event, and the “75.8” events, are compared and analyzed in aspects of precipitation and synoptic circulation. The main conclusions are as follows.
All three events have maximum daily and 4-day accumulated precipitation of over 500 mm and 800 mm. The “75.8” event was the most extreme daily precipitation event, with the largest daily precipitation in the history of mainland China and concentrated in the smallest area. The “63.8” event persisted for the longest time, with 7 days of accumulated precipitation over 1100 mm, whereas the other two events were over 800 mm. And the “63.8” event affected the largest area with 10 stations of 7-day accumulated precipitation over 700 mm, whereas the other two events had just 3 and 4 stations.
The circulation comparison among the three extreme precipitation events shows that the anomalies of the synoptic situation and physical quantities have some similar characteristics. First, the atmospheric circulation conditions are relatively stable during these events. Second, the WPSH is anomalously strong and is more northwestward, while the wide area from South China to the South China Sea is dominated by the uniform pressure field. Westly troughs are active in the upper levels. Third, anomalous low-level jet and water vapor transport are common in these events. However, the centers of jet and water vapor transport are located at different heights in different events.

Supplementary Materials

The following supporting information can be downloaded at: https://www.mdpi.com/article/10.3390/atmos14071149/s1, Figure S1: Daily precipitation of event “63.8” from 31 July to 10 August 1963; Figure S2: Daily precipitation of event “75.8” from 2–9 August 1975; Figure S3: Daily precipitation of event “21.7” from 17–24 July 2021; Table S1: Top 20 events of 08:00 BJT and 20:00 BJT fused daily precipitation in China mainland.

Author Contributions

Conceptualization, Q.D. and B.C.; methodology, J.S.; software, B.C.; validation, Q.D. and B.C.; formal analysis, Q.D.; investigation, Q.D.; resources, Q.D. and J.S.; data curation, J.S.; writing—original draft preparation, Y.C.; writing—review and editing, Q.D. and Y.S.; funding acquisition, Y.C. All authors have read and agreed to the published version of the manuscript.

Funding

This research was funded by the National Key Resarch and Development Program of China (2022YFC3003905), the Innovation and Development Project of CMA (CXFZ2022J016-01, CXFZ2023J021), Key Innovation Team of CMA (CMA2022ZD04, CMA2023ZD01), the Chinese National Sciences Fund (41975001) and the Open Project of State Key Laboratory of Severe Weather of Chinese Academy of Meteorological Sciences (2021LASW-A16).

Institutional Review Board Statement

Not applicable.

Informed Consent Statement

Not applicable.

Data Availability Statement

The data that support the findings of this study are available from the National Meteorological Information Centre of China. Restrictions apply to the availability of these data, which were used under license for this study. Data are available from the authors with the permission of the National Meteorological Information Centre of China.

Acknowledgments

We thank Fanghua Zhang and Wei Zhao of National Meteorological Centre, CMA for useful advices and suggestions for this paper.

Conflicts of Interest

The authors declare no conflict of interest.

References

  1. Abbas, A.; Waseem, M.; Ullah, W.; Zhao, C.; Zhu, J. Spatiotemporal Analysis of Meteorological and Hydrological Droughts and Their Propagations. Water 2021, 13, 2237. [Google Scholar] [CrossRef]
  2. Elahi, E.; Khalid, Z.; Tauni, M.Z.; Zhang, H.; Lirong, X. Extreme weather events risk to crop-production and the adaptation of innovative management strategies to mitigate the risk: A retrospective survey of rural Punjab, Pakistan. Technovation 2022, 117, 102255. [Google Scholar] [CrossRef]
  3. Zhai, P.; Sun, A.; Ren, F.; Liu, X.; Gao, B.; Zhang, Q. Changes of climate extremes in China. Clim. Changes 1999, 42, 203–218. [Google Scholar] [CrossRef]
  4. Sun, J.; Zhang, F.Q. Daily extreme precipitation and trends over China. Sci. China Earth Sci. 2017, 60, 2190–2203. [Google Scholar] [CrossRef]
  5. Karl, T.R.; Easterling, D.R. Climate extremes: Selected review and future research directions. Clim. Change 1999, 42, 309–325. [Google Scholar] [CrossRef]
  6. Dong, Q.; Chen, T.X.; Chen, X. Characteristics and Changes of Extreme Precipitation in the Yellow–Huaihe and Yangtze–Huaihe Rivers Basins. China J. Clim. 2011, 24, 3781–3795. [Google Scholar] [CrossRef]
  7. Sun, J.; Chen, Y.; Yang, S.N.; Dai, K.; Chen, T.; Yao, R.; Xu, J. Analysis and Thinking on the Extremes of the 21 July 2012 Torrential Rain in Beijing Part II: Preliminary Causation Analysis and Thinking. Meteor Mon. 2012, 38, 1267–1277. (In Chinese) [Google Scholar]
  8. Tabari, H. Climate change impact on flood and extreme precipitation increases with water availability. Sci. Rep. 2020, 10, 13768. [Google Scholar] [CrossRef]
  9. Dong, Q. Calibration and Quantitative Forecast of Extreme Daily Precipitation Using the Extreme Forecast Index (EFI). J. Geosci. Environ. Prot. 2018, 6, 143–164. [Google Scholar] [CrossRef]
  10. Dong, Q.; Jin, R.H.; Dai, K. Comparison between ECMWF Ensemble and Deterministic Forecast for Heavy Rainfall in the Huaihe River Basin of China. Meteor Mon. 2016, 42, 1146–1153. (In Chinese) [Google Scholar]
  11. Tao, S.Y. Rainstorms in China; Meteorology Press: Beijing, China, 1980; pp. 147–166. (In Chinese) [Google Scholar]
  12. Sun, J.; Fu, S.; Wang, H.; Zhang, Y.; Chen, Y.; Su, A.; Wang, Y.; Tang, H.; Ma, R. Primary characteristics of the extreme heavy rainfall event over Henan in July 2021. Atmos. Sci. Lett. 2023, 24, e1131. [Google Scholar] [CrossRef]
  13. Ding, Y.H.; Cai, Z.Y.; Li, J.S. A case study on the excessively severe rainstorm in Henan Province in early August 1975. Chin. J. Atmos. Sci. 1978, 2, 276–289. (In Chinese) [Google Scholar]
  14. Ding, Y.H. On the study of the unprecedented heavy rainfall in Henan Province during 4–8 August 1975: Review and assessment. Acta Meteor Sin. 2015, 73, 411–424. [Google Scholar]
  15. Tan, Y.; Chen, D.H. Mesoscale Ensemble Forecasts on “75.8” Heavy Rain in Henan. Meteor Mon. 2008, 34, 10–21. (In Chinese) [Google Scholar]
  16. Hu, Y.M.; Zhai, P.M.; Chen, Y. “75.8” Persistent Heavy Precipitation Event and the Characteristics of Large-scale Water Vapor Transport. Meteorol. Environ. Sci. 2015, 38, 13–18. (In Chinese) [Google Scholar]
  17. Zhao, Y.; Son, S.W.; Back, S.Y. The critical role of the upper-level synoptic disturbance on the China Henan “21.7” extreme precipitation event. SOLA 2023, 19, 42–49. [Google Scholar] [CrossRef]
  18. Luo, Y.H.; Du, Y. The roles of low-level jets in “21·7” Henan extremely persistent heavy rainfall event. Adv. Atmos. Sci. 2023, 40, 350–373. [Google Scholar] [CrossRef]
  19. Yin, L.; Ping, F.; Mao, J.H.; Jin, S.G. Analysis on precipitation efficiency of the “21.7” Henan extremely heavy rainfall event. Adv. Atmos. Sci. 2023, 40, 374–392. [Google Scholar] [CrossRef]
  20. Cheng, J.B.; Zhao, Y.H.; Zhi, R.; Feng, G.L. Analysis of the July 2021 extreme precipitation in Henan using the novel moisture budget equation. Theor. Appl. Climatol. 2022, 149, 15–24. [Google Scholar] [CrossRef]
  21. Yin, J.; Gu, H.; Liang, X.; Yu, M.; Sun, J.; Xie, Y.; Wu, C. A possible dynamic mechanism for rapid production of the extreme hourly rainfall in Zhengzhou City on 20 July 2021. J. Meteor. Res. 2022, 36, 6–25. [Google Scholar] [CrossRef]
  22. Grumm, R.H.; Hart, R. Standardized anomalies applied to significant cold season weather events: Preliminary findings. Wea. Forecast. 2001, 16, 736–754. [Google Scholar] [CrossRef]
  23. Hart, R.H.; Grumm, R.H. Using normalized climatological anomalies to rank synoptic-scale events objectively. Mon. Wea. Rev. 2001, 129, 2426–2442. [Google Scholar] [CrossRef]
  24. Tao, Y.; Dai, K.; Dong, Q. Extreme analysis and ensemble prediction verification on cold wave process in January 2016. Meteor Mon. 2017, 43, 1176–1185. (In Chinese) [Google Scholar]
  25. Du, J.; Grumm, R.H.; Deng, G. Ensemble anomaly forecasting approach to predicting extreme weather demonstrated by extremely heavy rain event in Beijing. Chin. J. Atmos. Sci. 2014, 38, 685–699. (In Chinese) [Google Scholar]
  26. Lu, X.Q.; Yu, H.; Ying, M.; Qi, L.B. Effects of Different Density Station on Climate Statistical Characteristics Analysis of Tropical Cyclones Precipitation. J. Trop. Meteorol. 2016, 32, 597–606. [Google Scholar]
  27. Li, Z.C.; Chen, Y.; Zhang, F.; Sun, J.; Wang, Y.; Fu, J.; Yu, C. Consideration by “75·8” extreme heavy rainfall event in Henan. Meteorol. Environ. Sci. 2015, 38, 1–12. (In Chinese) [Google Scholar]
  28. Whitfield, M.B.; Lyons, S.W. An upper-tropospheric low over Texas during Summer. Wea. Forecast. 1992, 7, 89–106. [Google Scholar] [CrossRef]
  29. Fu, J.L.; Ma, X.K.; Chen, T.; Zhang, F.; Zhang, X.D.; Sun, J.; Shen, X.L. Characteristics and Synoptic Mechanism of the July 2016 Extreme Precipitation Event in North China. Meteor Mon. 2017, 43, 528–539. (In Chinese) [Google Scholar]
  30. Zhang, F.H.; Chen, T.; Zhang, F.; Shen, X.L.; Lan, Y. Extreme features of severe precipitation in Meiyu period over the middle and lower reaches of Yangtze River Basin in June–July 2020. Meteor Mon. 2020, 46, 1405–1414. (In Chinese) [Google Scholar]
  31. Fritsch, J.M.; Murphy, J.D.; Kain, J.S. Warm core vortex amplification over land. J. Atmos. Sci. 1994, 51, 1780–1807. [Google Scholar] [CrossRef]
  32. Tang, Y.; Huang, A.; Wu, P.; Huang, D.; Xue, D.; Wu, Y. Drivers of summer extreme precipitation events over East China. Geophys. Res. Lett. 2021, 48, e2021GL093670. [Google Scholar] [CrossRef]
Figure 1. The research area and the distribution of national stations, with altitude shaded (unit: meter).
Atmosphere 14 01149 g001
Figure 2. Daily precipitation maximums (a1,b1,c1) and the ranks of the maximus (a2,b2,c2) of the three events (a: “63.8”, from 12:00 UTC 2 to 12:00 UTC 10 August 1963; b: “75.8”, from 12:00 UTC 4 to 12:00 UTC 10 August 1975; c: “21.7”, from 12:00 UTC 17 to 12:00 UTC 23 July 2021).
Atmosphere 14 01149 g002
Figure 3. Amount of 4 days precipitation of the three events ((a): “63.8”, from 12:00 UTC 2 to 12:00 UTC 8 August 1963; (b): “75.8”, from 12:00 UTC 5 to 12:00 UTC 8 August 1975; (c): “21.7”, from 12:00 UTC 19 to 12:00 UTC 22 July 2021).
Atmosphere 14 01149 g003
Figure 4. Same as Figure 3, but for 7 days ((a): “63.8”, from 12:00 UTC 2 to 12:00 UTC 8 August 1963; (b): “75.8”, from 12:00 UTC 4 to 12:00 UTC 10 August 1975; (c): “21.7”, from 12:00 UTC 17 to 12:00 UTC 23 July 2021).
Atmosphere 14 01149 g004
Figure 5. Comparison of circulation anomaly features among the “21.7” event ((a,b); 14:00 BJT on 20 July; “+” denotes the location of Zhengzhou station), the “75.8” event ((c,d); 14:00 BJT on 7 August; “+” denotes the location of Shangcai station), and the “63.8” event ((e,f); 14:00 BJT on 2 August; “+” denotes the location of Linying station). (a,c,e) are the 500 hPa wind field (wind bar), the height field (contours), and the standardized anomalies (filled colors), respectively. (b,d,f) are the same as (a,c,e), except for 200 hPa.
Atmosphere 14 01149 g005aAtmosphere 14 01149 g005b
Figure 6. The wind field (wind bar), water vapor flux (contours, unit: g cm−1 hPa−1 s−1), and its normalized anomaly (shaded) at 850 hPa at (a) 17:00 BJT on 20 July 2021, (c) 22:00 BJT on 7 August 1975, and (e) 17:00 BJT on 2 August 1963. (b,d,f) are the same as (a,c,e) except for 950 hPa.
Atmosphere 14 01149 g006
Figure 7. The wind field (wind bar), whole-layer water vapor content (contours, unit: mm), and its normalized anomaly (shaded) at 925 hPa at (a) 17:00 BJT on 20 July 2021, (c) 22:00 BJT on 7 August 1975, and (e) 17:00 BJT on 2 August 1963. The wind field (wind bar), water vapor flux divergence (contours, unit: g cm−2 hPa−1 s−1), and its normalized anomaly (shaded) at 975 hPa at (b) 17:00 BJT on 20 July 2021, (d) 22:00 BJT on 7 August 1975, and (f) 17:00 BJT on 2 August 1963.
Atmosphere 14 01149 g007aAtmosphere 14 01149 g007b
Figure 8. Temporal variations of the (a,c,e) 950 hPa water vapor flux and (b,d,f) 975 hPa water vapor flux divergence (red lines), the climatic mean values (thick black lines), and the corresponding water vapor flux and water vapor flux divergence after the climatic mean is increased or decreased by several standard deviations (gray lines) at a single station. The station locations of (a,c,e) correspond to the “○” in Figure 5b,d,f, respectively. The station locations of (b,d,f) correspond to the “○” in Figure 6b,d,f, respectively.
Atmosphere 14 01149 g008
Table 1. Basic information on the three extreme events and their maximums of daily precipitation, 4 days amount, and 7 days amount. The times of the daily precipitation maximums and the periods of amount are given in brackets.
Events“63.8”“75.8”“21.7”
Basic informationHeavy rainfall;
Hebei, Shanxi, Henan;
2–10 August 1963.
Heavy rainfall;
Henan, Hubei;
5–9 August 1975.
Heavy rainfall;
Henan;
18–23 July 2021.
Maximum of daily precipitation
(time)
518.5 mm
(4 August 1963)
755.1 mm
(7 August 1975)
552.5 mm
(20 July 2021)
4 days amount during main period
(period)
885.9 mm
(4–7 August 1963)
872.4 mm
(5–8 August 1975)
816.4 mm
(19–22 July 2021)
7 days amount during main period
(period)
1137.1 mm
(2–8 August 1963)
879.6 mm
(4–10 August 1975)
820.9 mm
(17–23 July 2021)
Disclaimer/Publisher’s Note: The statements, opinions and data contained in all publications are solely those of the individual author(s) and contributor(s) and not of MDPI and/or the editor(s). MDPI and/or the editor(s) disclaim responsibility for any injury to people or property resulting from any ideas, methods, instructions or products referred to in the content.

