Article

Research on the Emission Reduction Effect of International Technology Import in China’s Key Industries

1
School of Finance and Economics, Jiangsu University, Zhenjiang 212000, China
2
Institute of Carbon Neutrality Development, Jiangsu University, Zhenjiang 212000, China
*
Author to whom correspondence should be addressed.
Atmosphere 2023, 14(7), 1146; https://doi.org/10.3390/atmos14071146
Submission received: 30 April 2023 / Revised: 13 June 2023 / Accepted: 10 July 2023 / Published: 14 July 2023
(This article belongs to the Special Issue Air Pollution in China (2nd Edition))

Abstract

:
In the context of carbon neutralization and carbon peak, carbon reduction in key industries has become a central topic in our country. As an important part of technological progress, it is necessary to study the effect of technology import on carbon emission reduction in key industries. Based on the panel data of 30 provinces. from 2011 to 2020, this paper used the fixed-effect model to analyze the emission reduction effect in key industries on the development status of technology import. The spatial econometric model was used to analyze the spatial characteristics of carbon emissions of technology import and key industries. Then, the mediating effect model was used to bring industrial technological innovations into the research category to analyze the mediating role of technology imports on the carbon emissions of key industries. Finally, a robustness test proved the reliability of the model. The findings were as follows: (1) Technology import significantly promoted carbon emission reduction in key industries; (2) In terms of the spatial relationship, technology import and carbon dioxide emissions had significant spillover effects, and there were trends of high and high aggregation and low and low aggregation, with the impact of technology import on carbon dioxide emissions having a siphon effect; (3) Industrial technological innovation played an intermediary role in this path, but it was a negative role, which was not, in general, conducive to the reduction of carbon emissions of key industries. On this basis, the paper puts forward several policy suggestions.

1. Introduction

Responding to global climate change is one of the great challenges facing human societies in the 21st century, and, in the face of increasingly severe climate change, the Paris Agreement proposes limiting the global average temperature increase to 2 °C and to do its best to limit it to about 1.5 °C. In response to the call for low carbon, General Secretary Xi Jinping made a commitment, as early as the 75th session of the United Nations General Assembly, to strive to achieve carbon peak in 2030 and carbon neutrality before 2060. To achieve this vision, technological innovation is an important driver. Technological innovation can contribute to reducing carbon emissions in several ways, such as the following: improving energy efficiency [1], developing low-carbon production transformations [2], and promoting renewable energy [3]. In China, the situation of carbon emission reduction is severe, and technological innovation is a key factor in reducing carbon emissions. Some scholars have found that, in China, from 2009 to 2019, technological innovations significantly improved the environmental performance of energy firms, increasing environmental strengths by 0.056% and decreasing the intensity of carbon emissions by 0.015% [4].
To further implement the “dual carbon” policy, China’s Ministry of Industry and Information Technology, the National Development and Reform Commission and the Ministry of Ecology and Environment jointly issued the Implementation Plan for Peaking Carbon Emissions in the Industrial Sector. The plan points out that the current key tasks need to focus on energy conservation and emission reduction in four key industries: steel, building materials, non-ferrous metals, and petrochemical chemicals. While key industries are helping the economy, high-intensity carbon dioxide emissions are causing serious damage to the environment and even to the ozone layer [5]. About 70% of China’s carbon dioxide emissions come from industry and these key industries dominate industrial emissions. As typical energy-intensive industries, carbon emissions from the steel, non-ferrous metal, building material and petrochemical industries affect national development. The steel industry is one of the main carbon emission industries in China, accounting for about 15% of the country’s emissions [6]. At the same time, China is the world’s largest producer and consumer of non-ferrous metals, accounting for more than 40% of the world’s total output, and the carbon emissions of the non-ferrous metal industry accounts for 4.41% of the national emissions [7]. Building constructions consume a lot of building materials, resulting in huge carbon emissions for China, which is undergoing rapid development. The carbon emissions from China’s building materials industry account for 16% of the total national carbon emissions [8]. The petrochemical industry is also one of the most energy-intensive and high-emission industries, accounting for about 10% of the carbon emissions of the industrial sector [9]. Studies have shown that key industries, such as iron and steel, non-ferrous metals, building materials, and petrochemical chemicals. are important pillars of China’s national economic development and major factors in China’s decarbonization.
As an important way to save energy and reduce emissions [10], the importance of technological progress to key industries is self-evident. Many scholars have shown that technological progress can promote carbon emission reduction in key industries by reducing the cost of pollution control per unit [11], optimizing energy-consuming structures [12], reducing energy intensity per unit [13,14] and improving energy efficiency [15,16]. Technological progress includes independent innovation and technological imports. The importance of independent innovation as a catalyst for productivity growth was proposed by Griliches in 1964 [17]. Combined with Romer’s research, it can be seen that, as an important source of technological progress, independent research and development capabilities are largely related to supply and demand in the domestic market [18]. At present, China’s capacity for domestic innovation is weak, in comparison with the levels of developed countries, and it is difficult to achieve carbon emission reduction in key industries by relying on independent innovation alone [19]. Technological imports refer to the activities of obtaining advanced technology from abroad in a planned, focused and selective manner through international technology exchanges and transfers, which not only include the import of new products and new processes, but also of new processes and new management technologies. Scholars, such as Gerchenkron (1962) [20] and Rachel and Vân Elkan (1996) [21], demonstrated that developing countries can narrow the gap with developed countries through the absorption and use of technology. It can be found that for developing countries, importing technology is one of the more effective ways by which to achieve technological progress [22].
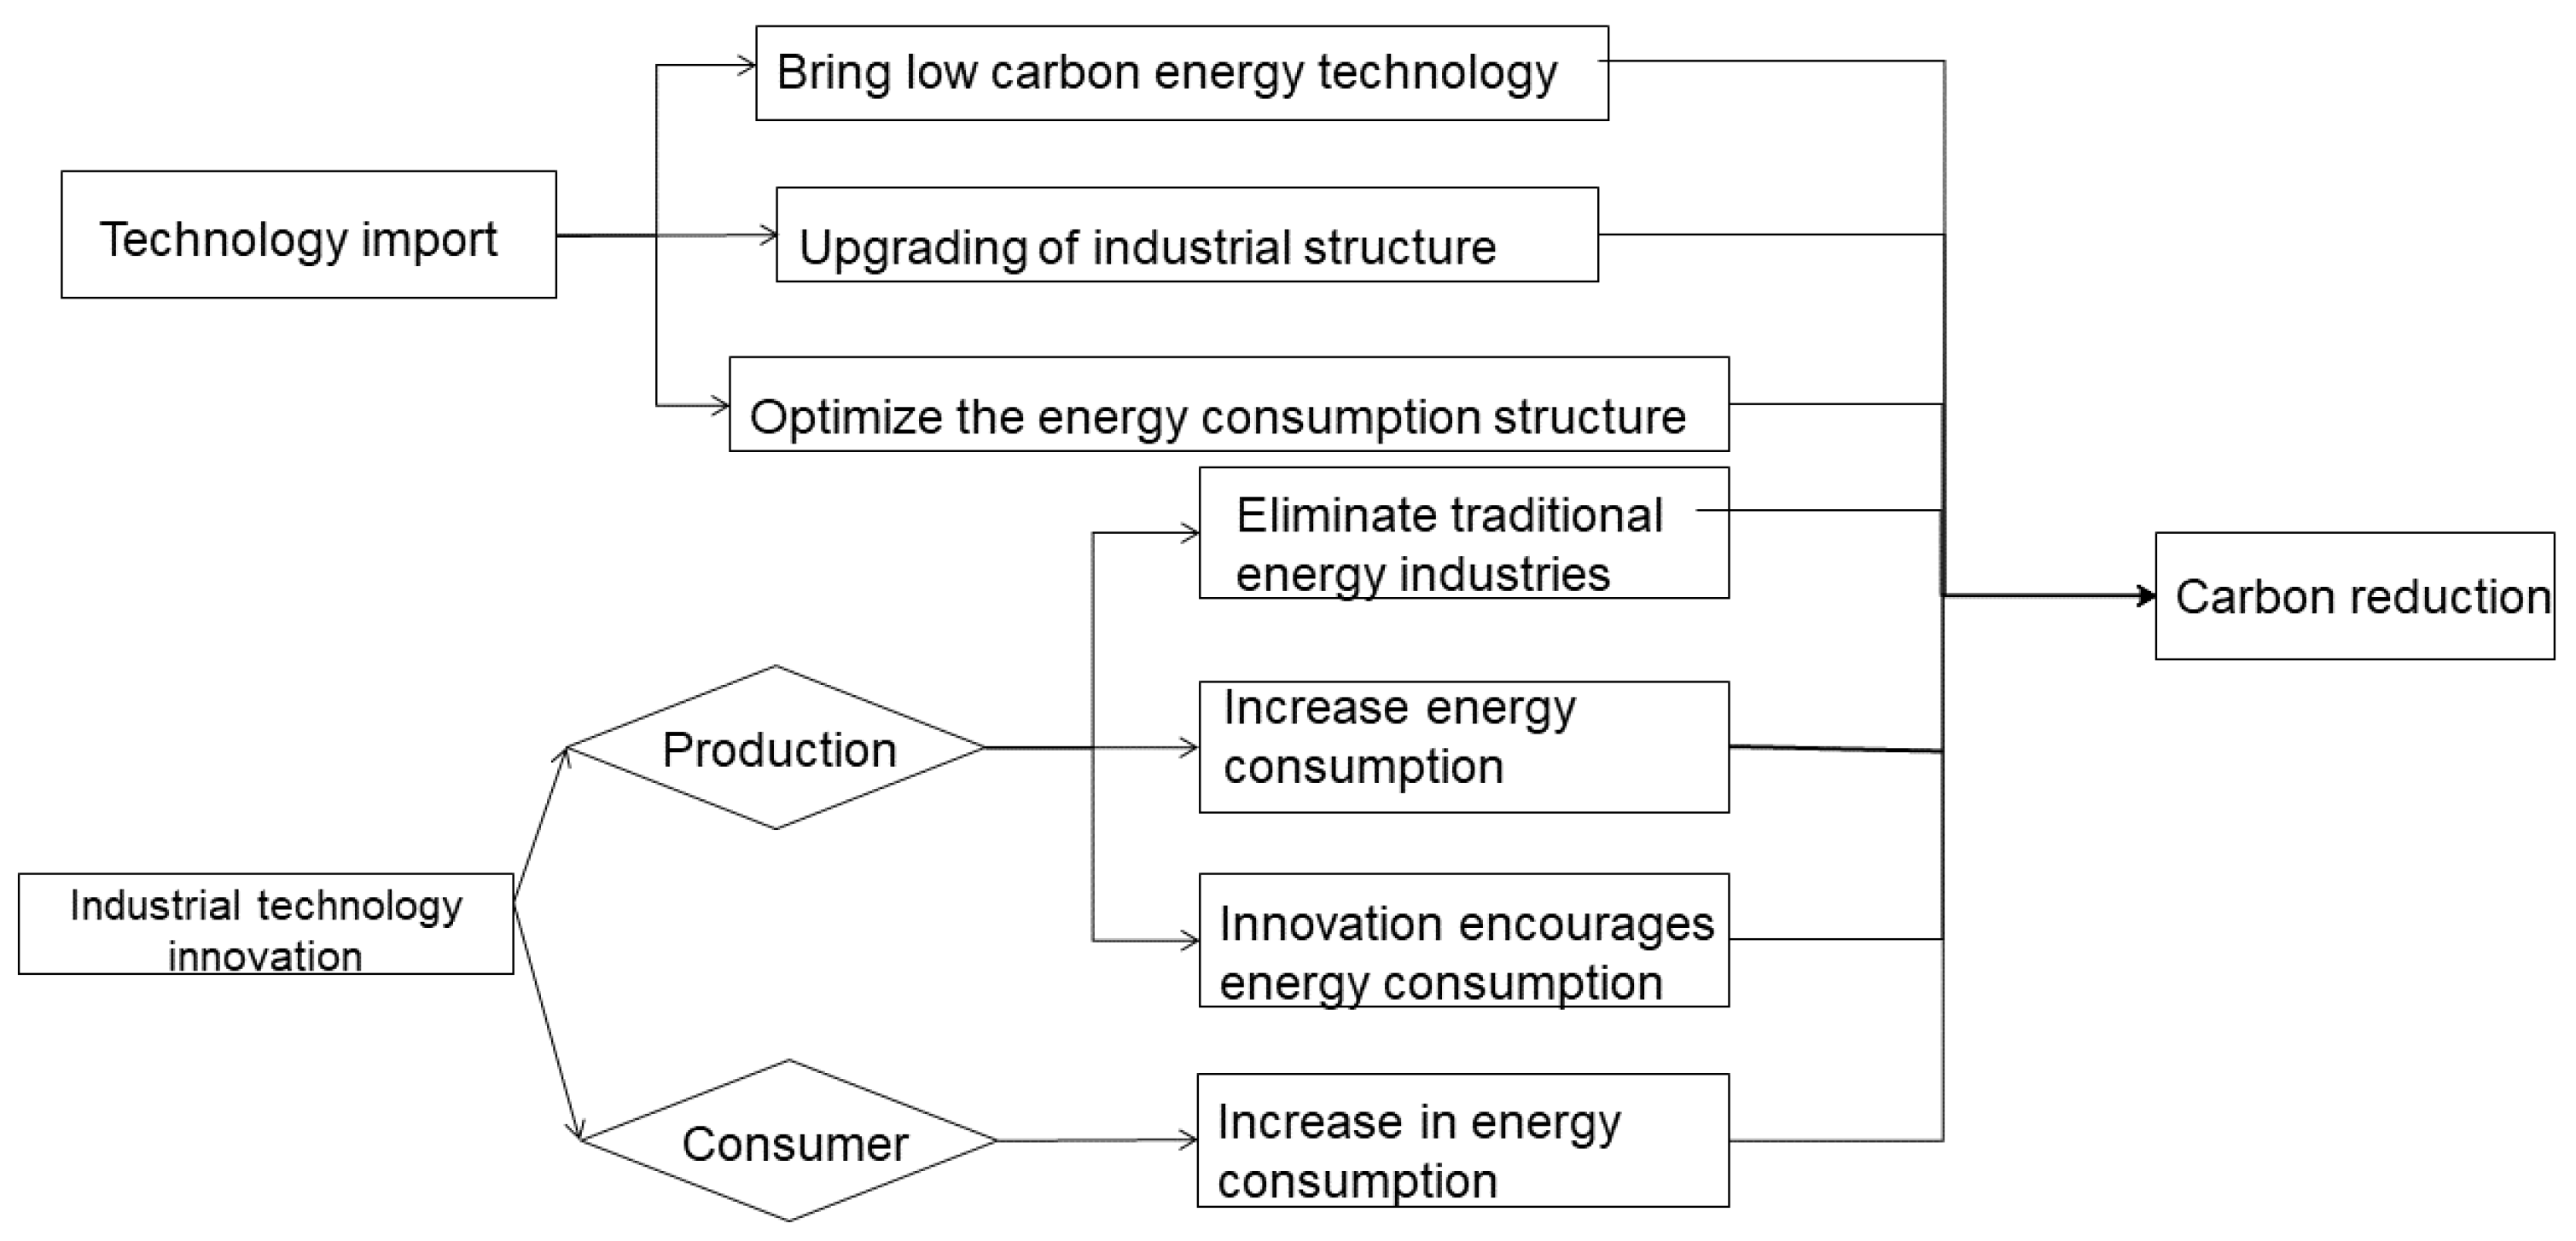
From the perspective of mechanism analysis, technological imports can add impetus to carbon emission reduction in key industries by optimizing resource allocation [23]. By bringing in more efficient technology and providing greater convenience for enterprises in key industries, technological imports can save a large amount of R&D investment and eliminate risks brought by internal R&D. On the one hand, enterprises in key industries can optimize production processes based on technological imports and can optimize resource allocation and energy use structures. They can also mine market demand and consumer demand preferences with more high-end technology, formulating production plans, continuously improving resource utilization efficiency, and then optimizing the energy structure. On the other hand, through the importing of advanced management modes, the production structures of key industries can be optimized [24], and, with the improvement of industrial structure, production factors can gradually flow from sectors with low marginal benefits to sectors with high marginal benefits, and, in this way, the industrial structure develops in the direction of environmental protection. Through the reallocation of labor, capital and other resources, enterprises in key industries promote the development of the industrial structure towards the high-end of the industrial chain, which is conducive to improving energy efficiency and resource allocation efficiency, optimizing energy structure, and promoting the development of carbon emission reduction.
However, from the perspective of the energy rebound effect of technology import, technological imports may lead to an increase in carbon emissions. The rebound effect of technology import refers to the phenomenon that the importing of high-end technology brings about an increase in energy efficiency, but, at the same time, the consumption of energy increases [25]. Technological imports can, indeed, introduce high-end technologies to improve the energy utilization efficiency of key industries, but. under the assumption of profit maximization and the concept of the “broker”, an improvement of efficiency means an expansion of production. At present, the domestic industrial foundation is weak, and the existing organizational structure and production equipment cannot bear the rapid all-round industrialization innovations brought by technological imports. Inappropriate technological matching tends to lead to “disruptive innovation” and increase the use of resources [26]. At the same time, due to the law of diminishing marginal benefits of technological imports, the carbon emission reduction that can result from relying only on technology import is limited, and enterprises are likely to switch to high-polluting technologies in pursuit of high returns, resulting in an increase in carbon emissions. The mechanism analysis diagram of technology import and industrial technology innovation is shown in Figure 1.
The difficulty of technology import is lower than that of independent innovation, but, as a developing country, most of the technologies introduced by China are mainly sub-core technologies, with the top core technologies having long been monopolized by developed countries, and China’s “stuck neck” problem is increasingly prominent. In this situation, it is debatable whether the import of technology can promote the emission reduction of key industries.
At present, the mechanism of technology import on carbon emission reduction in key domestic industries is still in the exploratory stage and has not completely risen from the theoretical level to the practical level. In addition, carbon emission reduction is an extremely long-term process and the energy consumption of China’s key industries is also dependent on paths. It is of strong practical significance to explore the carbon emissions of key industries from the perspective of technology import. Based on the above background, in order to provide feasible policy suggestions for China’s future carbon emission reduction from the perspective of “innovation”, this paper deeply discusses the mechanisms involved and takes the indicators of industrial technological innovation into consideration, so as to discuss their indirect roles in technology import and in promoting carbon emission reduction in China’s key industries.

2. Materials and Methods

2.1. Indicator Selection and Data Sources

The data of this study derived from the 2011 to 2020 China Statistical Yearbook, China Science and Technology Statistical Yearbook, China Environment Statistical Yearbook, China Industrial Statistical Yearbook, China Energy Statistical Yearbook, etc. The software involved was data processing, storage, and visualization software, such as Stata17.0, MATLAB and ArcGIS.

2.1.1. Core Variables

  • Explanatory variable: technology import
Most academic circles use the contractual amount of technology import and the expenditure of technology import funds as the measurement of technology import. In order to prevent this indicator from being affected by price fluctuations, this paper selects the actual value of the stock of foreign technology import expenditure of large- and medium-sized industrial enterprises in various provinces to characterize the technology import index, and record it as tech. The specific calculation method is as follows:
First of all, using the price index data of each province and region in the corresponding year, the nominal value of the foreign technology import expenditure of large- and medium-sized industrial enterprises in each province, and the deflation of the fixed asset investment price index of each province, are converted into the actual value, and the formula for the stock of technology import in the base period is as follows:
K 1 tech = E 1   t e c h ( 1 + g ) / ( 1 + δ )
In the Formula (1), K t e c h indicates the stock of foreign technology imports and E t e c h indicates the expenditure of foreign technology import funds. The value g is the average growth rate of technology import expenditure, which was set to 5% in this paper, by referring to existing literature. The rate δ is the depreciation rate, which was set as 15% in this paper. The values i and t represent the province and year, respectively.
Secondly, the technology import stock of each province can be obtained by using the perpetual inventory method. The calculation formula is as follows:
K t e c h = E i t t e c h + ( 1 δ ) K i , t 1 t e c h
2.
Intermediate variable: industrial technological innovation
For industrial technological innovation, the number of patent applications, the output value of new products and other indicators are generally used. Considering that the number of patent applications can more directly reflect the innovation abilities of enterprises, this study selected the number of patent applications from industrial enterprises in the provincial and municipal regulations to measure the industrial technological innovation index, which was denoted as ino.
3.
Explained variables: overall carbon emissions and carbon emissions of key industries
First, combined with the relevant energy consumption data from the China Energy Statistical Yearbook, this paper calculated the carbon emissions of China’s overall key industries. The specific calculation methods are as described below.
In this paper, direct carbon emission and indirect carbon emission were used to calculate the total carbon emission. The carbon emissions from direct energy consumption (such as coal, oil, etc.) of the provinces were calculated using the relevant conversion factors provided by IPCC2006. The carbon emissions generated by electric energy consumption in different provinces were calculated by the electric energy emission factors in the different regions. The energy carbon emissions of transportation consumption in various provinces were assumed to be proportional to the energy consumption intensity and carbon emission intensity among various modes of transportation, and energy consumption of passenger and freight traffic was used as the standard. The carbon emission of heat energy in each province was calculated by converting the amount of heat supply, thermal efficiency and raw coal into the quantity of quasi coal. These direct and indirect emissions were added together to find the total carbon emissions of each province, referred to as ce.
Secondly, the carbon emissions of China’s four key industries were measured. For the iron and steel industry, this paper referred to the principle of carbon balance, used the terminal energy consumption data of “ferrous metal smelting and calendaring industry” in the China Energy Statistical Yearbook, deducted the carbon removal amounts of products and by-products, and calculated the carbon emission factor provided by IPCC2006. Since the energy consumption data related to industry classification is only collected at the national level, this paper multiplied the ratio of industrial terminal energy consumption of ferrous metal smelting and calendar processing industries to the total energy consumption at the national level by the industrial terminal energy consumption at the provincial level, and, finally, obtained the carbon dioxide emissions of China’s steel industry at the provincial level, which was recorded as ce1.
To make the measurement consistent, the carbon emission Accounting Guide of building materials, non-ferrous metals and petrochemical and chemical industries was used for reference, and the building materials industry was classified as “non-metallic mining and selection industry and non-metallic mineral products industry”. The non-ferrous metal industry was classified as “non-ferrous metal smelting and rolling industry”. The petrochemical and chemical industry was classified as “oil and gas mining industry, oil coal and other fuel processing industry, oil coal and other fuel processing industry and organic chemical raw material manufacturing industry in chemical raw materials and chemical products manufacturing industry”, and its carbon emissions were calculated using similar methods, combined with the data of the China Energy Statistical Yearbook, all of which were, respectively, recorded as ce2, ce3 and ce4.

2.1.2. Control Variables

The following indicators were selected as control variables in this paper:
  • Level of economic development (gdp). The per capita GDP of a regionwas used as a measure of the level of economic development.
  • Industrial structure (ind). The proportion of regional tertiary industry in GDP was used to measure the industrial structure.
  • Energy intensity (ei). The ratio of energy consumption to GDP within a region was used as an indicator of energy intensity.
  • Trade openness (tra). The ratio of gross import and export value to GDP of each province and city was used as the index of trade openness.
  • Educational level (edu). The average number of years of schooling per capita was used to represent the level of education.
  • Financial strength (fin). The proportion of local budget expenditure to GDP was used as an indicator to measure the degree of regional government intervention.

2.2. Statistical Analysis of Data

2.2.1. Descriptive Statistics

To avoid the impact of extreme values on the regression results of the data in this paper, in the processing of variable data, this paper carried out 1% Winsor tail reduction treatment. At the same time, because the value of some data was huge and fluctuated violently, this paper performed logarithmic processing on some data to improve its stability. The specific descriptive statistical analysis is provided in Table 1:

2.2.2. Analysis of the Development Status of Technology Import in China

As can be seen from Figure 2, Figure 3 and Figure 4, from 2011 to 2016 the total amount of technology import in China showed a rising trend, and the coverage of technology import also gradually expanded. From the point of view of the speed of improvement, the rate of increase of technology import in China’s provinces, from 2011 to 2016, was much higher than that from 2016 to 2020, because, in recent years, China has implemented the “middle- and high-end talent introduction Plan” and “Young Thousand Talents Plan” to encourage overseas talents to find employment in China. At the same time, the “National Independent Innovation Demonstration Zone” and “National Intellectual Property Strategy” have been implemented to protect intellectual property rights and enhance the enthusiasm of domestic technology import. From the perspective of specific distribution, the provinces with a large amount of technology import are mostly concentrated in the eastern coastal cities, and there was no significant change in the three time periods, such as in Jiangsu, Zhejiang, Guangzhou and other places. In terms of specific values, the amount of technology import in the three periods indicates leapfrog development, and the amount of technology import in all provinces increased compared with the previous period, which indicates that China gradually started to establish a technology import system for the coordinated development of enterprises, market and government.

2.3. Model Setting

2.3.1. Panel Fixed-Effect Model

Based on the theoretical elaboration of the former and the review of relevant literature, this paper established a benchmark model between technology import and carbon emissions in general and key industries, and explores the correlation between them. To select the appropriate econometric model, the Haussmann test was used and it was concluded that the fixed-effect model was superior to the random-effects model. The specific expression of the baseline model is shown in Equations (3)–(7).
c e i t = α 0 + β 0 tech i t + α 1 g d p i t + α 2 ind i t + α 3 e i i t + α 4 t r a i t + α 5 e d u i t + α 5 f i n i t + δ i + γ t + ε i t
Among them, i represents region, t represents time, α 0 represents constant term, δ i represents individual fixed effect, γ t represents time fixed effect. ε i t represents error terms in the model and other factors that affect carbon emissions and are not factored into the model.

2.3.2. Spatial Econometric Model

In the selection of spatial econometric models, there are currently three main types, namely the spatial error model (SEM), the spatial lag model (SAR) and the spatial Dubin model (SEM). Among them, the spatial error model focuses on the spatial correlation between variables, that is, it considers the influence of unknown spatial autocorrelation error terms on the model. The spatial lag model introduces its own spatial lag variable to reflect the interaction between a variable in a region and the same variable in a neighboring area, so as to explore the spatial dependence nature of the variable. The spatial Dubin model combines the characteristics of the spatial lag model and the spatial error model and considers the influence of its own spatial lag and the spatial autocorrelation error term, for itself and its neighboring regions, on the dependent variable. In view of the relative advantages of the spatial Dubin model (SDM), this paper intended to use it as the basic model for the empirical analysis of space, and then to judge whether it was the optimal model through the LM test, the LR test and the Wald test. The spatial Dubin Model (SDM) can be expressed as in Equation (4):
c e i t = α 0 + ρ j = 1 n c e j t + β x i t + φ j = 1 n w j t x j t + ε
When ρ = 0, the spatial Dubin model can be converted to a spatial lag model (SAR). When φ = ρ β , the spatial Dubin model could be transformed into a spatial error model (SEM), such as in Formulas (5) and (6):
c e i t = α 0 + β x i t + φ j = 1 n w j t x j t + ε
c e i t = α 0 + β x i t + μ μ = λ W μ + ε

2.3.3. Mediation Effect Model

This paper drew on the practice of Baron and Kenny [27] to build a mediation effect model, based on the baseline model (3)–(7), as shown in Equations (7) and (8):
i n o i t = β 1 t e c h i t + α 0 + α 1 g d p i t + α 2 i n d i t + α 3 e i i t + α 4 t r a i t + α 5 e d u i t + α 6 f i n i t + ε i t
c e i t = β 2 t e c h i t + λ i n o i t + α 0 + α 1 g d p i t + α 2 i n d i t + α 3 e i i t + α 4 t r a i t + α 5 e d u i t + α 6 f i n i t + ε i t
In the equation, i represents region, t represents time, ε i t represents a random perturbation term. The total effect in model (3) β 0 equal to the sum of indirect effects λ β 2 and direct effects β 1 . To test whether the mediation effect exists, the first step is to test the significance of the coefficient β 0 and if the coefficient is not significant, you need to stop the mediation effect test. The second step is to test the significance of the coefficients, λ and β 2 , and if both are significant, the third step can be tested, and if one is not significant, the fourth step can be performed. The third step is to test the significance of the coefficient β 1 , and if it is significant, it is a partial mediation effect, otherwise it is a complete mediation effect; The fourth step, on the basis of the second step, is carried out by the Sobel test, and if the test is passed, the mediation effect is established, otherwise the mediation effect does not exist. Considering that, in recent years, some scholars have suggested that the Sobel test has insufficient efficacy and that its use cease, this paper tested the model according to the Bootstrap test method.

3. Results and Discussion

This section is divided by subheadings to provide concise and precise descriptions of the experimental results, and their interpretations, as well as the experimental conclusions that can be drawn.

3.1. Benchmark Model Regression Analysis

3.1.1. Normality Test of Data

The data stationarity test can avoid the occurrence of false regression, and three tests were used to detect the stationarity of the main variables: LLC, Fisher–pp and Fisher–ADF. Before the detection, the Husman test was performed on the panel data, and the results showed that the model strongly rejected the random-effects model at a significance level of 1%, so this paper used a fixed-effect model for the stationary test, and the results are shown in Table 2.
In Table 2, ce represents the total CO2 emissions of the explanatory variable (the carbon emission test results of the remaining four key industries were roughly the same as the overall carbon emissions, so they are not shown), and tech represents the introduction of the explanatory variable technology.
The results show that both the explanatory variables and the core explanatory variables strongly rejected the null hypothesis of the existence of a unit root, and the data were robust and could undergo further regression analysis.

3.1.2. Model Benchmark Regression and Heterogeneity Analysis

In this study, the fixed-effect model was used to regress the data, and it can be seen from Table 3 that, for the core explanatory variable technology import, the relationship between technology import and carbon emissions without control variables was significantly positive, which was contrary to the policy orientation, so this paper tested the multicollinearity in the model. The average VIF value was 3.29, which was much less than 10, so this paper believes that the model did not have a multicollinearity problem, and that this positive relationship was likely due to the lack of control variables and time effects, so that most provinces in the sample period had not yet formed emission reduction effects, resulting in the overall sample technology import not only not reducing emissions but actually increasing emissions. This also indicated that China may be subject to a certain energy rebound effect. With the continuous improvement of the model, the overall R side began to gradually increase, and the regression results were corrected from positive to negative, which verified the promotional effect of technology import on carbon emission reduction.
From the results of the control variables, the per capita GDP gdp was significantly positive at the level of 1% of the individual fixed-effect model, indicating that the current increase in China’s GDP mainly depends on industries with high carbon dioxide emissions, but, with the addition of the time effect, the impact coefficient was not significant but began to change from positive to negative, so it can be understood that, in the future, GDP growth will not increase carbon emissions, and China’s carbon emission reduction project may undergo benign changes From the regression results of industrial structure ind, the regression coefficient also moved from positive to negative, and it was significant at a level of 1%, indicating that the upgrading of China’s industrial structure for many years has achieved initial results, and the development of the tertiary industry has effectively curbed the carbon emissions of the overall industry in the country. The regression results of energy intensity ei were significantly positive for both individual and double fixed effects, reflecting the general law of increasing energy intensity and increasing carbon emissions. Trade openness was also significantly positive under both models, indicating that China’s trade imports and exports are still concentrated in high-carbon industries, which is the essence of the difference between developing and developed countries in trade types. The financial strength of fin in the two types of models moved from positive to negative but not significantly, indicating that, in the early stage, in order to seek more fiscal revenue, the government introduced too many backward production capacity enterprises, triggering “bottom-to-bottom competition”, and, with the implementation of the dual carbon policy, the government’s financial investment began to gradually move closer to the low-carbon industry, and may achieve real emission reduction in the future.
According to the above regression analysis, technology import does not immediately promote carbon emission reduction, but, rather, increases carbon emissions, which is related to the general energy rebound effect in China, so it requires a certain amount of time and joint efforts from all walks of life. However, in general, with reference to the individual fixed-effect and double fixed-effect model regression results, the impact of technology import on carbon dioxide emissions showed a significant negative linear relationship, so this paper argues that the carbon emission reduction effect of technology import on China as a whole is real.
Based on the benchmark regression, in order to further investigate the industry heterogeneity of carbon emissions, this paper further refined the overall carbon emissions to the carbon emissions of four key industries in the following industrial fields: iron and steel, building materials, non-ferrous metals and petrochemical chemicals. The specific regression results are provided in Table 4.
It can be seen from Table 4 that under the heterogeneity analysis of subdivided key industries, the import of technologies can significantly promote carbon emission reduction, thanks to the “market-for-technology” strategy adopted by China since the reform and opening, that is, the exchange of foreign advanced technologies through the domestic market. Although in the early stage of exchange, there are difficulties in the “grafting” of foreign technology to benefit from its technological advantages, over time, China’s absorption and digestion capacities for technology have greatly improved, so that the import of technology has achieved a real sense of carbon emission reduction. From the comparison of the size of the coefficient, the emission reduction coefficient of the building materials industry is greater than that of the petrochemical industry and that of the non-ferrous metal industry is greater than that of the steel industry. The reason may be that the building materials industry has a higher energy utilization rate in the production process and has more high-quality technology, while the other three types of key industries need to consume more energy than the building materials industry, so the emission reduction effect of technology import is weakened to a certain extent.
Further, in terms of control variables, the energy intensity ei and trade openness tra indicators under the four key industries increase significantly. The former is the inevitable result of the positive correlation between energy intensity and carbon emissions, and the latter is due to the fact that the import of technology in key industries is mostly raw material-oriented. When a country’s trade openness increases, in order to maintain their own competitiveness enterprises may take some means to reduce costs, such as the use of low-cost or even excessive raw materials, reducing the governance of the production environment and other ways to reduce costs to a minimum, which lead to an increase in carbon emissions. The impact of per capita national income level gdp and education level edu were not significant under the four types of key industries, which may be due to the fact that China’s current key industries have formed a path dependence on the production technology level and production mode. The iron and steel, building material, non-ferrous metal and petrochemical chemical industries are traditionally heavy industries, their production methods and technical foundations have been formed, the introduction of new technologies takes time and processes, and the current per capita national income and education level factors are not enough to have a significant impact. Industrial structure ind and financial strength fin only have significant negative effects on some key industries, which may be related to the policy orientation of national or regional governments, such as some local governments helping certain types of enterprises obtain policy and financial support, while restricting the development space of other enterprises. This type of intervention indirectly leads to an increase in carbon emissions of some enterprises, which, in turn, biases the forecast results of industrial structure and financial strength indicators.

3.2. Spatial Econometric Model Regression Analysis

3.2.1. Construction of Spatial Weight Matrix and Spatial Autocorrelation Test

In terms of the construction of the weight matrix, this paper first used the Arcgis software(ESRI, Redlands, CA, USA) to extract the latitude and longitude of each province in China, converted it to the distance between provinces, and constructed the reciprocal geographic distance matrix W1 and the reciprocal square matrix W2 of geographical distance. Secondly, the adjacency matrix W3 was constructed based on whether the provinces were adjacent or not, and they were imported into STATA one by one and saved as a dta File. Finally, the spw matrix was constructed using the spw matrix command in STATA, and the obtained matrix standardized for subsequent spatial econometric analysis. The expressions for the three matrices are:
W 1 = 1 / d i j   w h e n   d i j d 0   w h e n   d i j < d     W 2 = 1 / d i j 2   w h e n   d i j d 0   w h e n   d i j < d W 3 = 1   i f   d i j < d 0   i f   d i j d
Note: It indicates the distance d i j between provinces. If, then, i = j   W 1 = 0 and W 2 = 0   W 3 = 0 .
Before using a spatial econometric model, it is first necessary to examine whether there is a spatial dependence between the data, that is, a spatial autocorrelation test is necessary. In this paper, the global Moran index and the local Moran index were used to investigate the spatial autocorrelation of the main indicators. The difference between the two is that the global Moran index is calculated by analyzing the correlation of all observations for an entire geographic area. If positive, similar observations in a geographic area are clustered together and have a positive correlation. If the value is negative, similar observations are scattered across a geographic area and have a negative correlation. However, the global Moran index does not accurately indicate the specific location of deviation, which requires the local Moran index to calculate specific indicators for the correlation of each observation point in its vicinity, so as to more accurately assess the correlation near each observation point. Based on this, this paper first used the global Moran index, and then used the local Moran index to test the autocorrelation test of the spatial econometric regression model. The Moran index values for the main variables are provided in the following Table 5, Table 6 and Table 7.
According to the results of Table 5, Table 6 and Table 7, whether it was a reciprocal geographic distance matrix, a reciprocal square matrix of geographic distances, or an adjacency matrix, the global Moran index of technology import and CO2 emissions from 2011 to 2020 were significant, which meant that there was a global spatial correlation between the two and they were similar in spatial distribution. Specifically, the Moran index of technology import and carbon dioxide emissions was positive, indicating a significant spillover effect, and there was a trend of agglomeration; that is, the neighboring provinces in areas with high technology import or large carbon emissions also had the same characteristics. This was because of the unbalanced development of China’s current situation. The gap between the levels of development between regions is large, and regions with good economic development more easily receive foreign advanced technology, resulting in the level of introduction of technology also being uneven. In summary, according to the local Moran index analysis, it was found that the distribution trend of spatial autocorrelation in China’s technology import and carbon emission level made it necessary to carry out further analysis in the subsequent spatial measurement regression.

3.2.2. Spatial Model Selection and Empirical Analysis

In the selection of spatial econometric models, this paper drew on Elhorst’s research methods [28], using the LM, LR, and WALD tests to compare models. Among them, the LM test was used to test whether the spatial autocorrelation of all variables in the whole model was significant, and if the results showed that there was spatial autocorrelation, a spatial autocorrelation model was required. The LR test was used to compare the goodness-of-fit between different spatial econometric models, in which case the LR statistics of the models could be compared to determine which model better explained the spatial autocorrelation in the data. WALD was also used to test the existence of spatial autocorrelation and to explore the strength and direction of spatial autocorrelation, which was complementary to the first two types of tests. The results of the above three types of tests are provided in Table 8.
According to the results of the spatial model test in Table 8, the statistical values of all tests rejected the null hypothesis at the level of 1–5%, which indicated that the spatial effect of technology import on carbon emissions was not suitable for SEM (spatial error model) and SAR (spatial lag model), so SDM (spatial Dubin model) was finally selected for analysis. In the selection of specific fixed effects and random effects, the Hausman test was used to conclude that the spatial Dubin model, based on fixed effects, should be used. The specific regression results are provided in Table 9.
Theoretically, when the reciprocal geographic distance matrix is used, the degree of correlation between neighboring areas is stronger, indicating greater spatial proximity. When using the reciprocal square matrix of geographical distances, the connection between distant regions is emphasized, indicating that the degree of spatial correlation is more balanced. In the case of adjacency matrices, spatial proximity is calculated based on the adjacencies of administrative regions. According to the results shown in Table 9 the import of technology in all three types of matrices was reflected in significant emission reduction effect on the province, while there was a significant negative effect on the surrounding areas. This shows that technology import can reduce overall carbon emission levels by improving industrial and energy efficiencies, while, for the province, due to relatively close spatial ties with other regions, technology import formed a siphon effect in some areas, promoting its own carbon emission reduction, while hindering the carbon emission reduction of neighboring provinces. From the results of the control variables, the per capita national income level gdp had a certain inhibitory effect on the carbon emissions of the province, but, at the same time, it was not conducive to the carbon emission reduction of neighboring provinces. Due to China’s uneven development and huge differences in economic development between different provinces, high-income provinces are more likely to introduce technology and innovation than low-income provinces, forming a spatial spillover effect of carbon emissions; Energy intensity EI is the opposite, that is, it leads to a province’s increased emissions, and promotes the emission reduction of neighboring provinces. The increase in energy intensity means the province produces more economic value but it also means that more fossil energy is used and carbon dioxide emissions increase. After achieving a certain level of production efficiency and competitive advantage, similar industries in other provinces gradually decline or shift, thereby reducing their carbon dioxide emissions, and this “carbon leakage” phenomenon also proves that China’s energy production has high carbon characteristics. Fundamentally changing China’s energy production methods through technological innovation is an important path to achieve carbon emission reduction.

3.3. Analysis of the Mediating Effect of Industrial Technological Innovation

It can be seen from the above that the import of technology can effectively reduce a province’s carbon dioxide emissions, but it does not fundamentally change the province’s energy production methods. At the same time, combined with the literature review, it was found that industrial technological innovation is an important intermediate factor in reducing carbon emission intensity, which mainly improves production efficiency and reduces pollutant emissions through the introduction and application of new technologies; thereby, promoting the reduction of carbon emissions. In order to deeply study the carbon emission reduction mechanism of technology import, this paper introduces the variables of industrial technological innovation and discusses the mechanism between technology import, industrial technological innovation and carbon emissions, so as to refine the research results. The intermediary mechanism of carbon emissions at the overall level is shown in Table 10.
According to the results of Table 10, the core test coefficients all passed the significance test of 1%, indicating that there was a mediating effect of industrial technological innovation between technology import and carbon emissions. Through the test of the intermediary effect, the mediation effect of industrial technological innovation was estimated to account for about 6.19% (0.294*0.071/0.337). From the numerical point of view, the total effect of technology import on carbon emissions was −0.337, and the emission reduction effect was stronger than the direct effect −0.317. Combined with the indirect effect coefficient, it was found that there was a negative correlation between technology import and industrial technological innovation, and there was a positive correlation between industrial technological innovation and carbon emissions, which indicated that industrial technological innovation currently has an energy rebound effect that is not conducive to carbon emission reduction in China, and technology import can curb it to a certain extent. Due to the incentives for technological innovation in China, companies blindly implement innovation projects in order to obtain government subsidies. These low-quality innovations are almost useless for low-carbon development, and also occupy too many social resources, which eventually leads to an increase in carbon emissions. From the results of the control variables, the increase of energy intensity ei significantly reduces the coefficient of industrial technological innovation, which is the result of the continuous game between traditional energy production methods and low-carbon innovative technologies. Trade openness tra significantly improves the level of industrial technology innovation and the improvement of trade openness more closely links China with the international market. In order to meet the international market, it is often necessary to increase product output and improve product quality; thereby, increasing the technological innovation needs of enterprises.
According to the above analysis, it can be found that industrial technological innovation itself increases carbon emissions, which is related to the blind development of low-quality innovations by enterprises, coupled with the fact that, as scholars [29] have demonstrated, there is an “inverted U-shaped” relationship between technological innovation and carbon emissions. It can be seen that the current level of China’s overall industrial technological innovation is still at the left end of the “inverted U-shaped” inflection point, and the carbon emission reduction effect is not obvious. In previous studies, industrial technological innovation has been regarded as one of the most important driving factors for emission reduction, but this study found that its emission reduction effect is not ideal, and even leads to an increase in carbon emissions. On the one hand, China’s internal self-innovation ability is weak, and breakthrough innovation is difficult to achieve. On the other hand, technological innovation is a high-risk emission reduction path, which is highly difficult, has a long cycle and has uncertain returns. However, it is gratifying that the rational introduction of foreign advanced technology can curb domestic technological innovation to a certain extent, so as to achieve indirect emission reduction effects.
In order to further observe the impact mechanism of technology import and industrial carbon dioxide emissions, this paper measured the carbon emissions of four key industries, namely, iron and steel, building materials, non-ferrous metals and petrochemical chemicals, and analyzed the intermediary mechanism of industry heterogeneity, as shown in Table 11
Table 11 shows that the four types of key industries had partial intermediary effects in regard to industrial technological innovation [30], and the intermediary effects accounted for 5.24% (0.294*0.077/0.432) in the steel industry, 4.62% (0.294*) in the building materials industry 0.100/0.637), 7.96% (0.294*0.137/0.506) non-ferrous metal industry, and 8.4% (0.294*0.18/0.630) petrochemical industry. It is worth noting that the above four types of key industries in China have the same energy rebound effects of reverse emission reduction of industrial technological innovation as at the national level, but technology import can effectively suppress these, so as to achieve indirect emission reduction. This is because, compared with other industries, under the dual pressure of implementing national environmental protection policies and ensuring the production efficiency of enterprises, key industries rely more on high-end technological innovation and equipment in the production process, so relevant enterprises are more willing to research and invest in industrial technological innovation. It is undeniable that some innovative technologies can indeed significantly reduce carbon emissions, but, due to the existence of energy rebound effects and blind innovation under the incentives of Chinese policies, industrial technological innovation has directly increased many unnecessary carbon emissions. Further, in terms of the sensitivity of the four types of industries to the intermediate variable of industrial technological innovation, the empirical results show that the indirect emission reduction coefficient of industrial technological innovation in the iron and steel industry < the building materials industry < non-ferrous metal industry < the petrochemical industry. The import of technology had the strongest emission reduction effect by curbing industrial technological innovation in the petrochemical industry. This was due to the fact that the petrochemical industry, in the production process, needs to use a large number of technologies and equipment for raw material processing, reaction control, separation and purification, such as computer simulation to adjust reaction conditions to optimize product performance, and the use of polymer materials to improve product performance, etc., and these lead to an increase in emissions. However, if advanced production equipment and technology are introduced directly through technology import, energy consumption and raw material waste can be greatly reduced, and environmental pollution can be reduced [31].

3.4. Basic Test

Robustness testing is a necessary step in empirical research and an important means to ensure the quality and reliability of research. In this paper, the following methods were used to test the robustness of the article’s model:
  • Replace the explanatory variables: To study the carbon reduction effects of technology imports, the measurement of overall carbon emissions is narrowed down to a single industrial sector.
  • Add a first-order lag term to the explanatory variable: Considering the possible lag of technology import, and in order to alleviate the possible endogenous problems in this paper, this variable was lagged by one stage and regressed.
  • Delete some provincial capitals: Provincial capitals are often political, economic, cultural, and transportation centers, with more policy resources and public service input. These special statuses and resources may make them significantly different from other cities, interfering with the normal extrapolation of the regression equation.
The results of the regression, based on the above three basic robustness tests, are shown in Table 12:
It can be seen from the test results in Table 12 that the positive and negative signs of the test coefficients of the three basic test methods were consistent with the original regression results and were strongly significant, indicating that the fixed-effect model used in this paper was not sensitive to the influence of abnormal data points, and the regression results are true and reliable.

3.5. Mediation Effect Model Test—Boostrap Test

Although the traditional stepwise regression test method can deal with the multicollinearity problem of large-scale variables, it ignores the complex relationship between variables. The bootstrap method can simulate the entire overall data set by combining different sample data sets, avoid the bias problem caused by insufficient sample data, and more accurately evaluate the effect value and significance level of mediating effects [32].The principle is as follows: random sampling is carried out from the sample data, a large number of sampling data sets obeying the central limit theorem are generated, and the confidence interval is estimated more accurately by calculating the random error of the mediating effect obtained by different sample data sets. In this paper, a Bootstrap test with a dataset of 500 was performed for five mediating effect models of industrial technological innovation, technology import to promote overall carbon emission reduction and carbon emission reduction in key industries, and the test results are provided in Table 13.
In Table 13, the confidence interval for bs_1 represents the direct effect and bs_2 represents the confidence interval for the indirect effect, and if, and only if, the confidence interval of the two does not contain 0, the Bootstrap test passes. It can be seen that among the five mediation models, whether it was a direct effect or an indirect effect, the confidence interval did not contain 0 and was strongly significant, so it can be inferred that the mediation effect model in this paper is accurate and reliable.

3.6. Discussion

As an important part of technological progress, there is little literature on the mechanism of technology import on carbon emission. Based on panel data from 30 provinces, from 2011 to 2020, this paper calculated the impact of technology import on carbon emissions in four key industries and found that the building materials industry is most affected by technology import, followed by the petrochemical chemical industry, and the non-ferrous metal industry, with the steel industry being the least affected. The horizontal relationship between industrial technological innovation and carbon emissions of the key industries improves the theory of technological progress. In terms of spatial econometric analysis, the spatial analysis of the impact of China’s provincial-level technology import on key industries was carried out, not only on the carbon emissions of key industries in the region, but also on the surrounding areas from a spatial perspective. It is not difficult to find from the above research that technology import plays a significant role in promoting carbon emission reduction in developing countries. In most of China’s provinces, technology import can be seen as a powerful tool for achieving a low-carbon transition. This shows that it is feasible to lead China’s key industries towards reducing carbon emissions through the import of technology. In the industrial field, the import of technology can also promote industrial enterprises to reduce unit energy consumption, while improving production efficiency and achieving carbon emission reduction. However, although the importance of industrial technological innovation as a means of internal spontaneous innovation is beyond doubt, the research results show that the promotion of industrial technological innovation only leads to an increase of carbon emissions in key industries. This is due to China’s weak internal innovation capacity and insufficient innovation drivers, and many low-quality and inefficient technological innovations not only failing to promote carbon emission reduction in key industries, but also bringing research and development costs and additional carbon emissions. However, technological innovation reduces carbon emissions by inhibiting industrial technological innovation, which is one of the important factors for the energy rebound effect in China’s industrial sector. Its emission reduction effect needs to be further optimized.

4. Conclusions

Based on the empirical results above, the specific conclusions of the study are as follows.
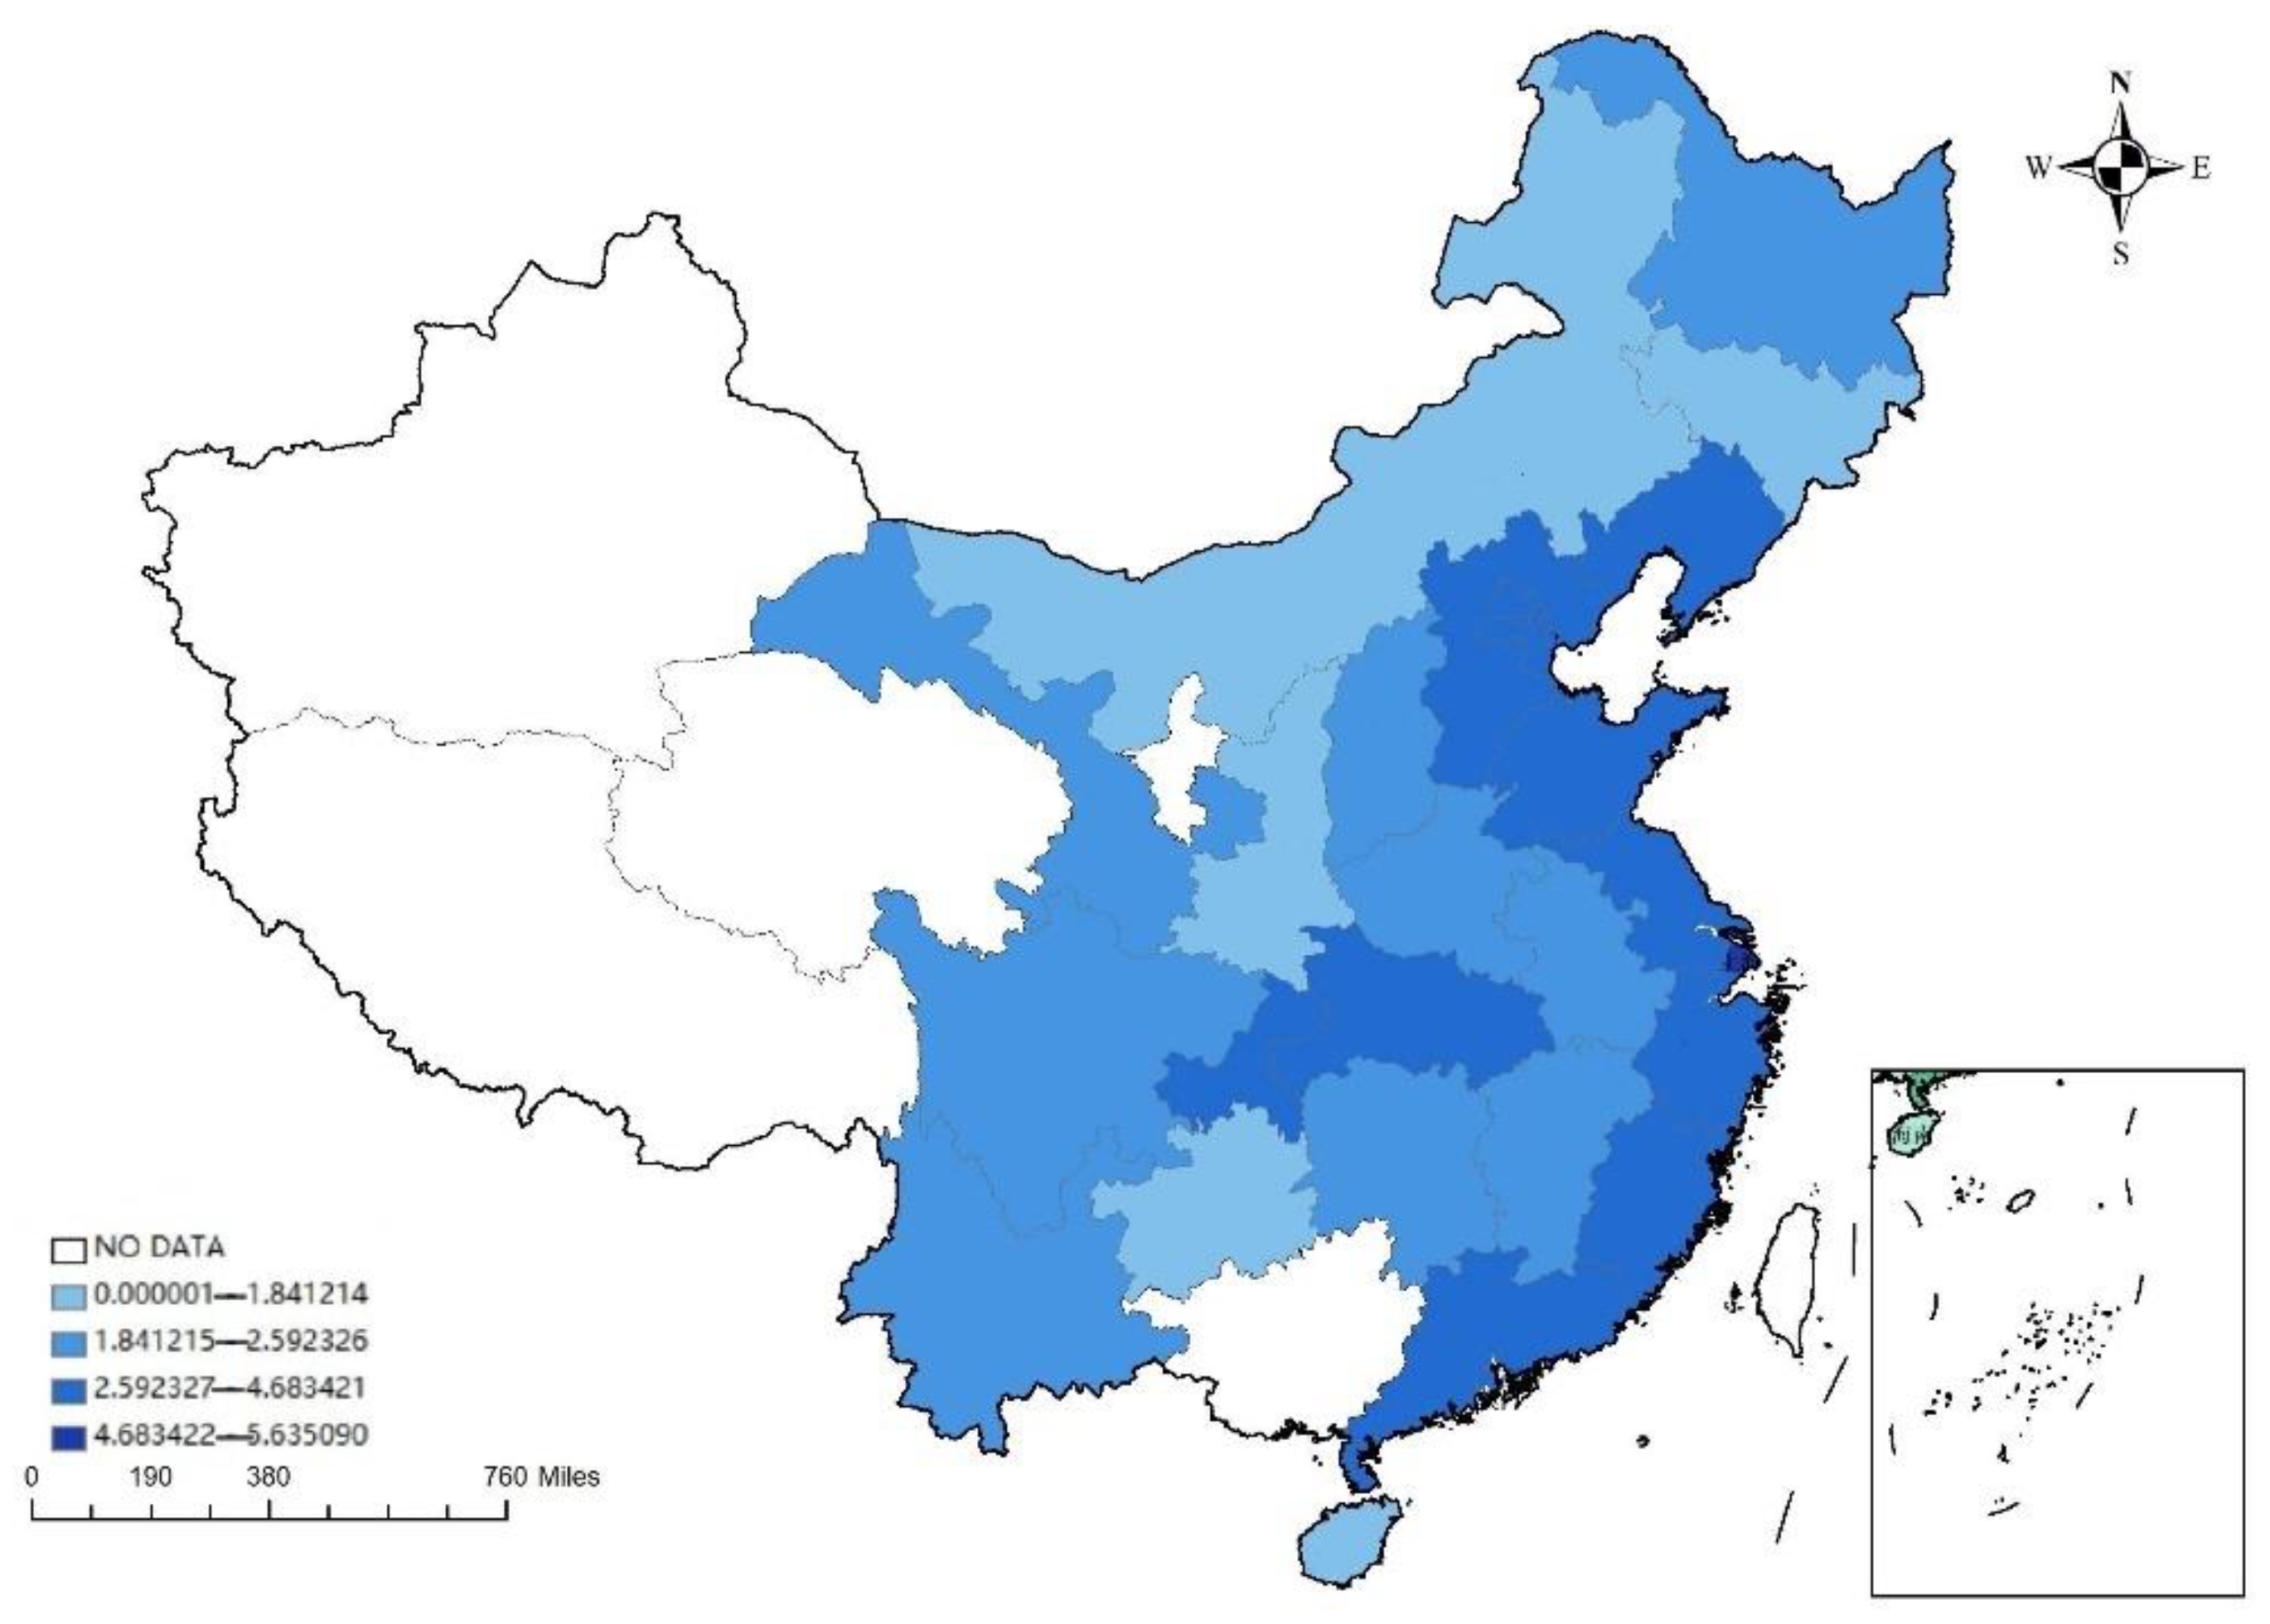
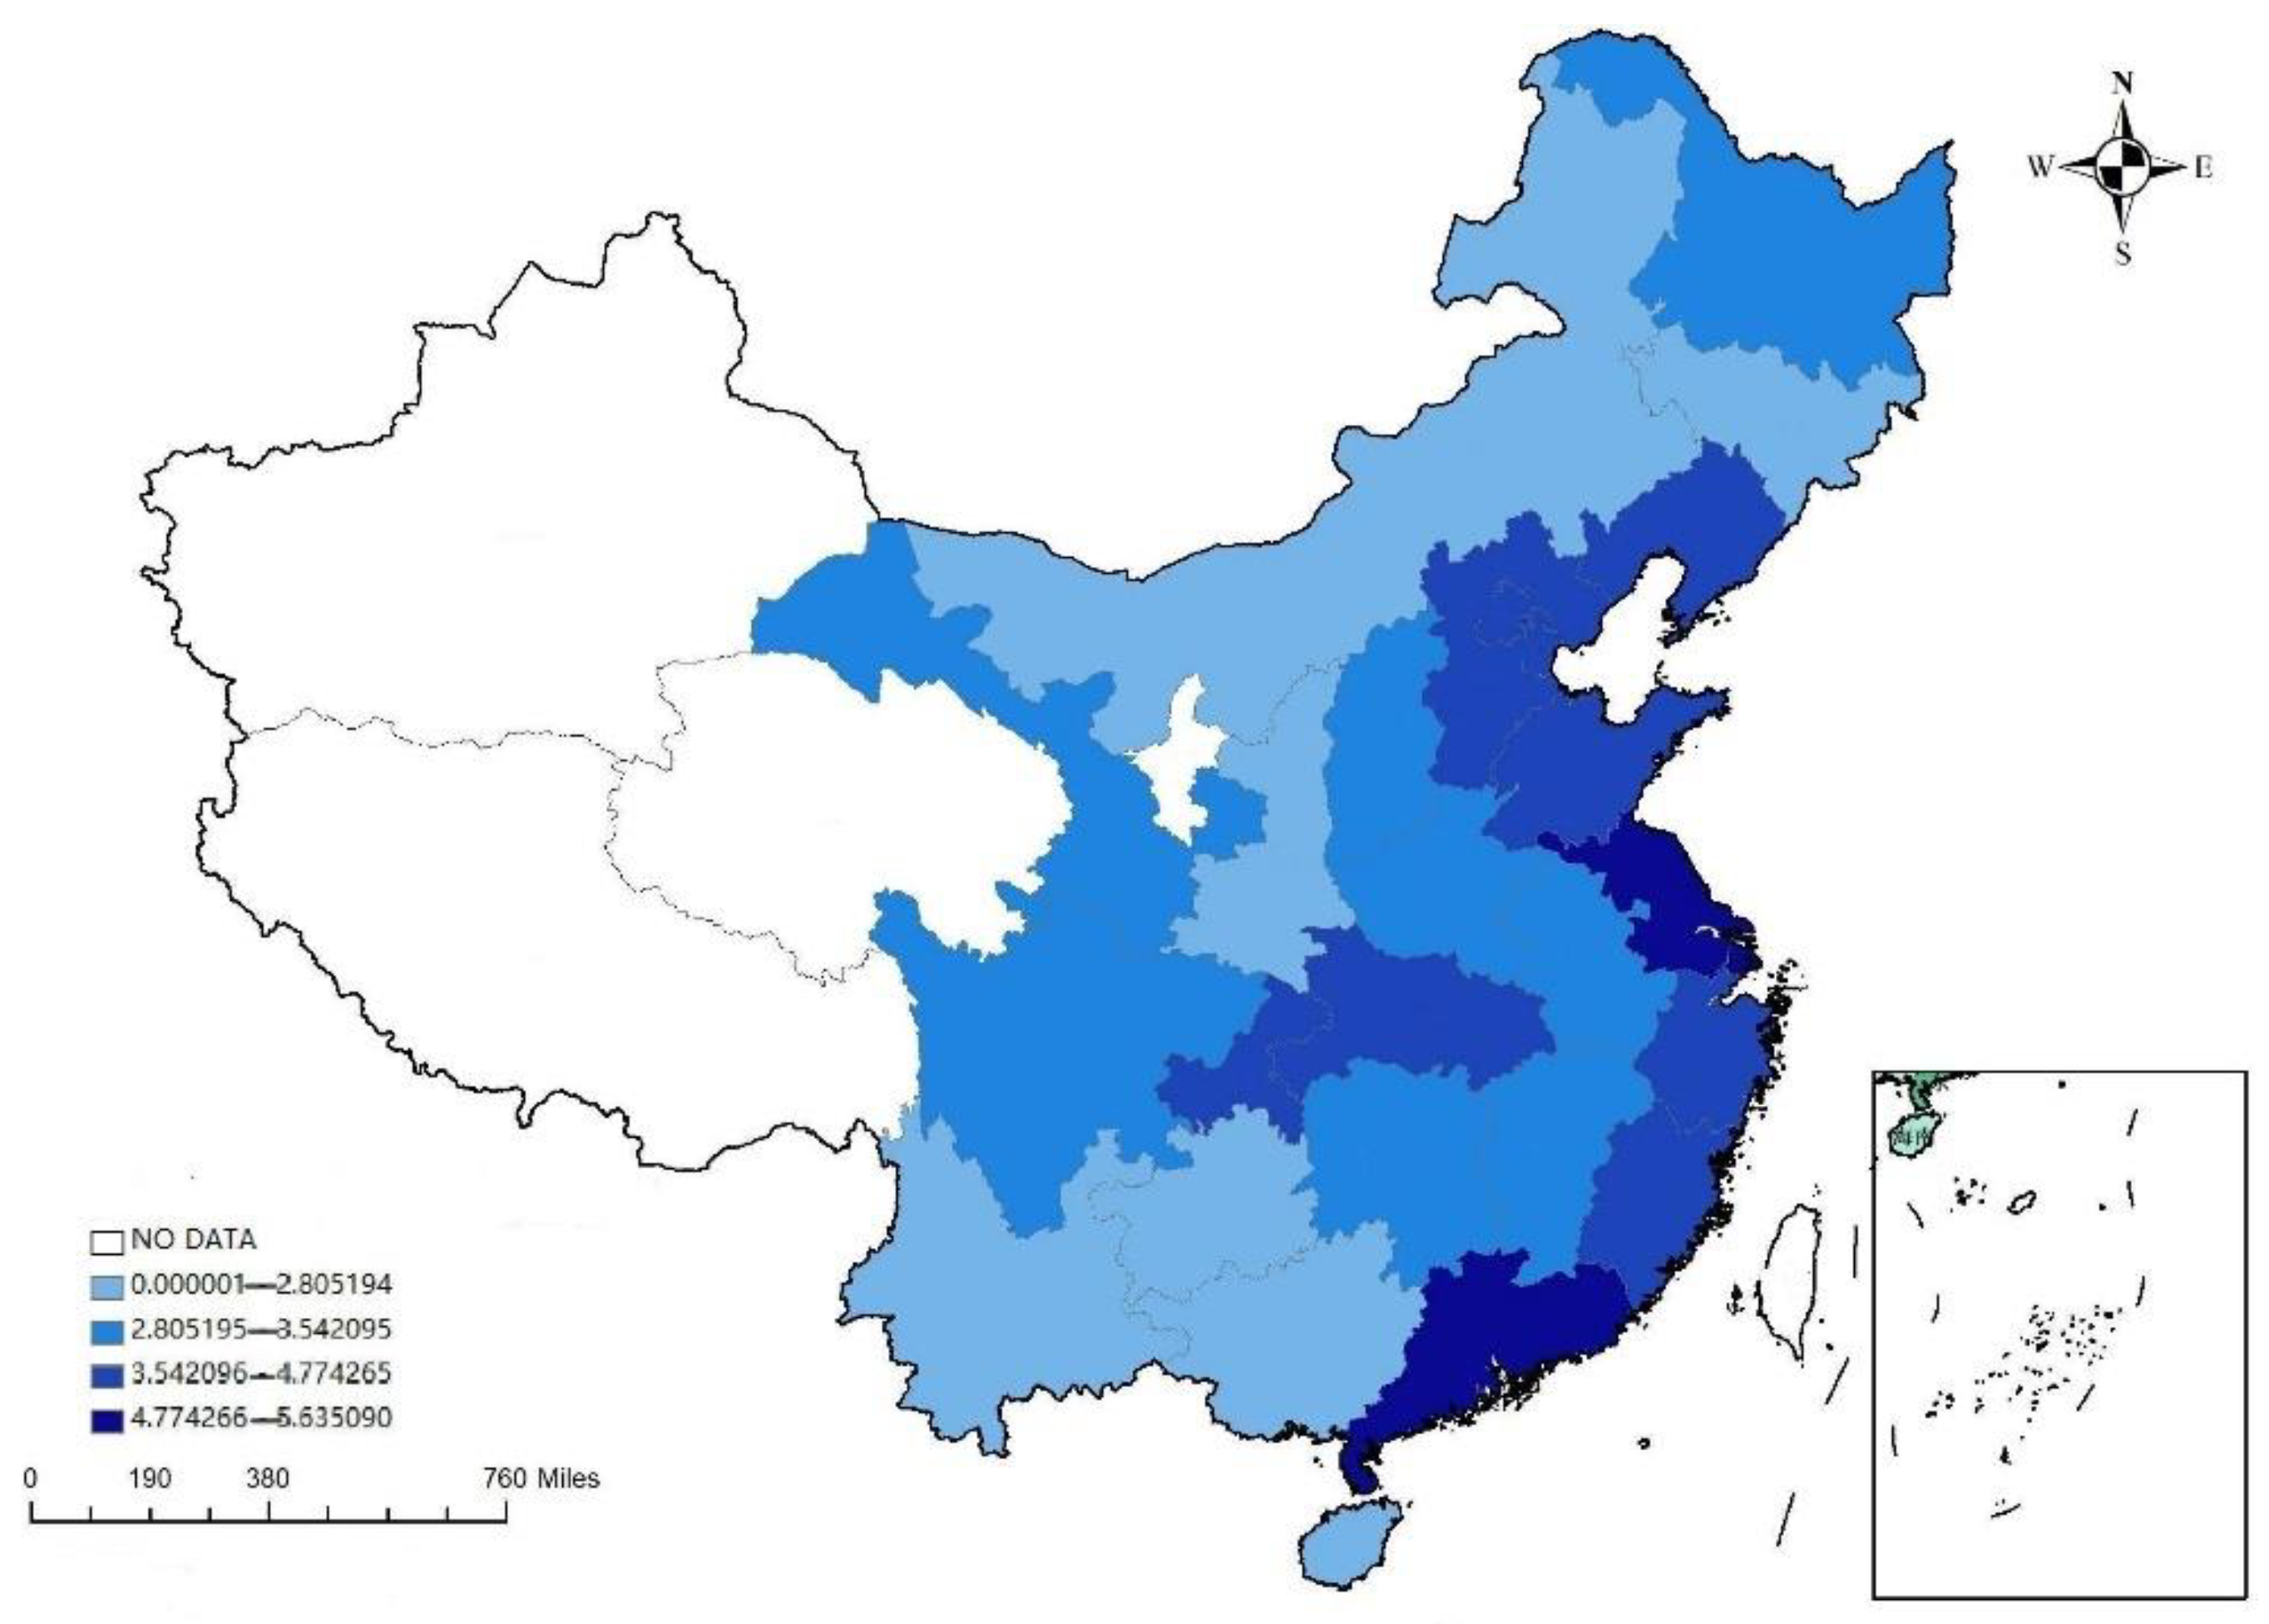
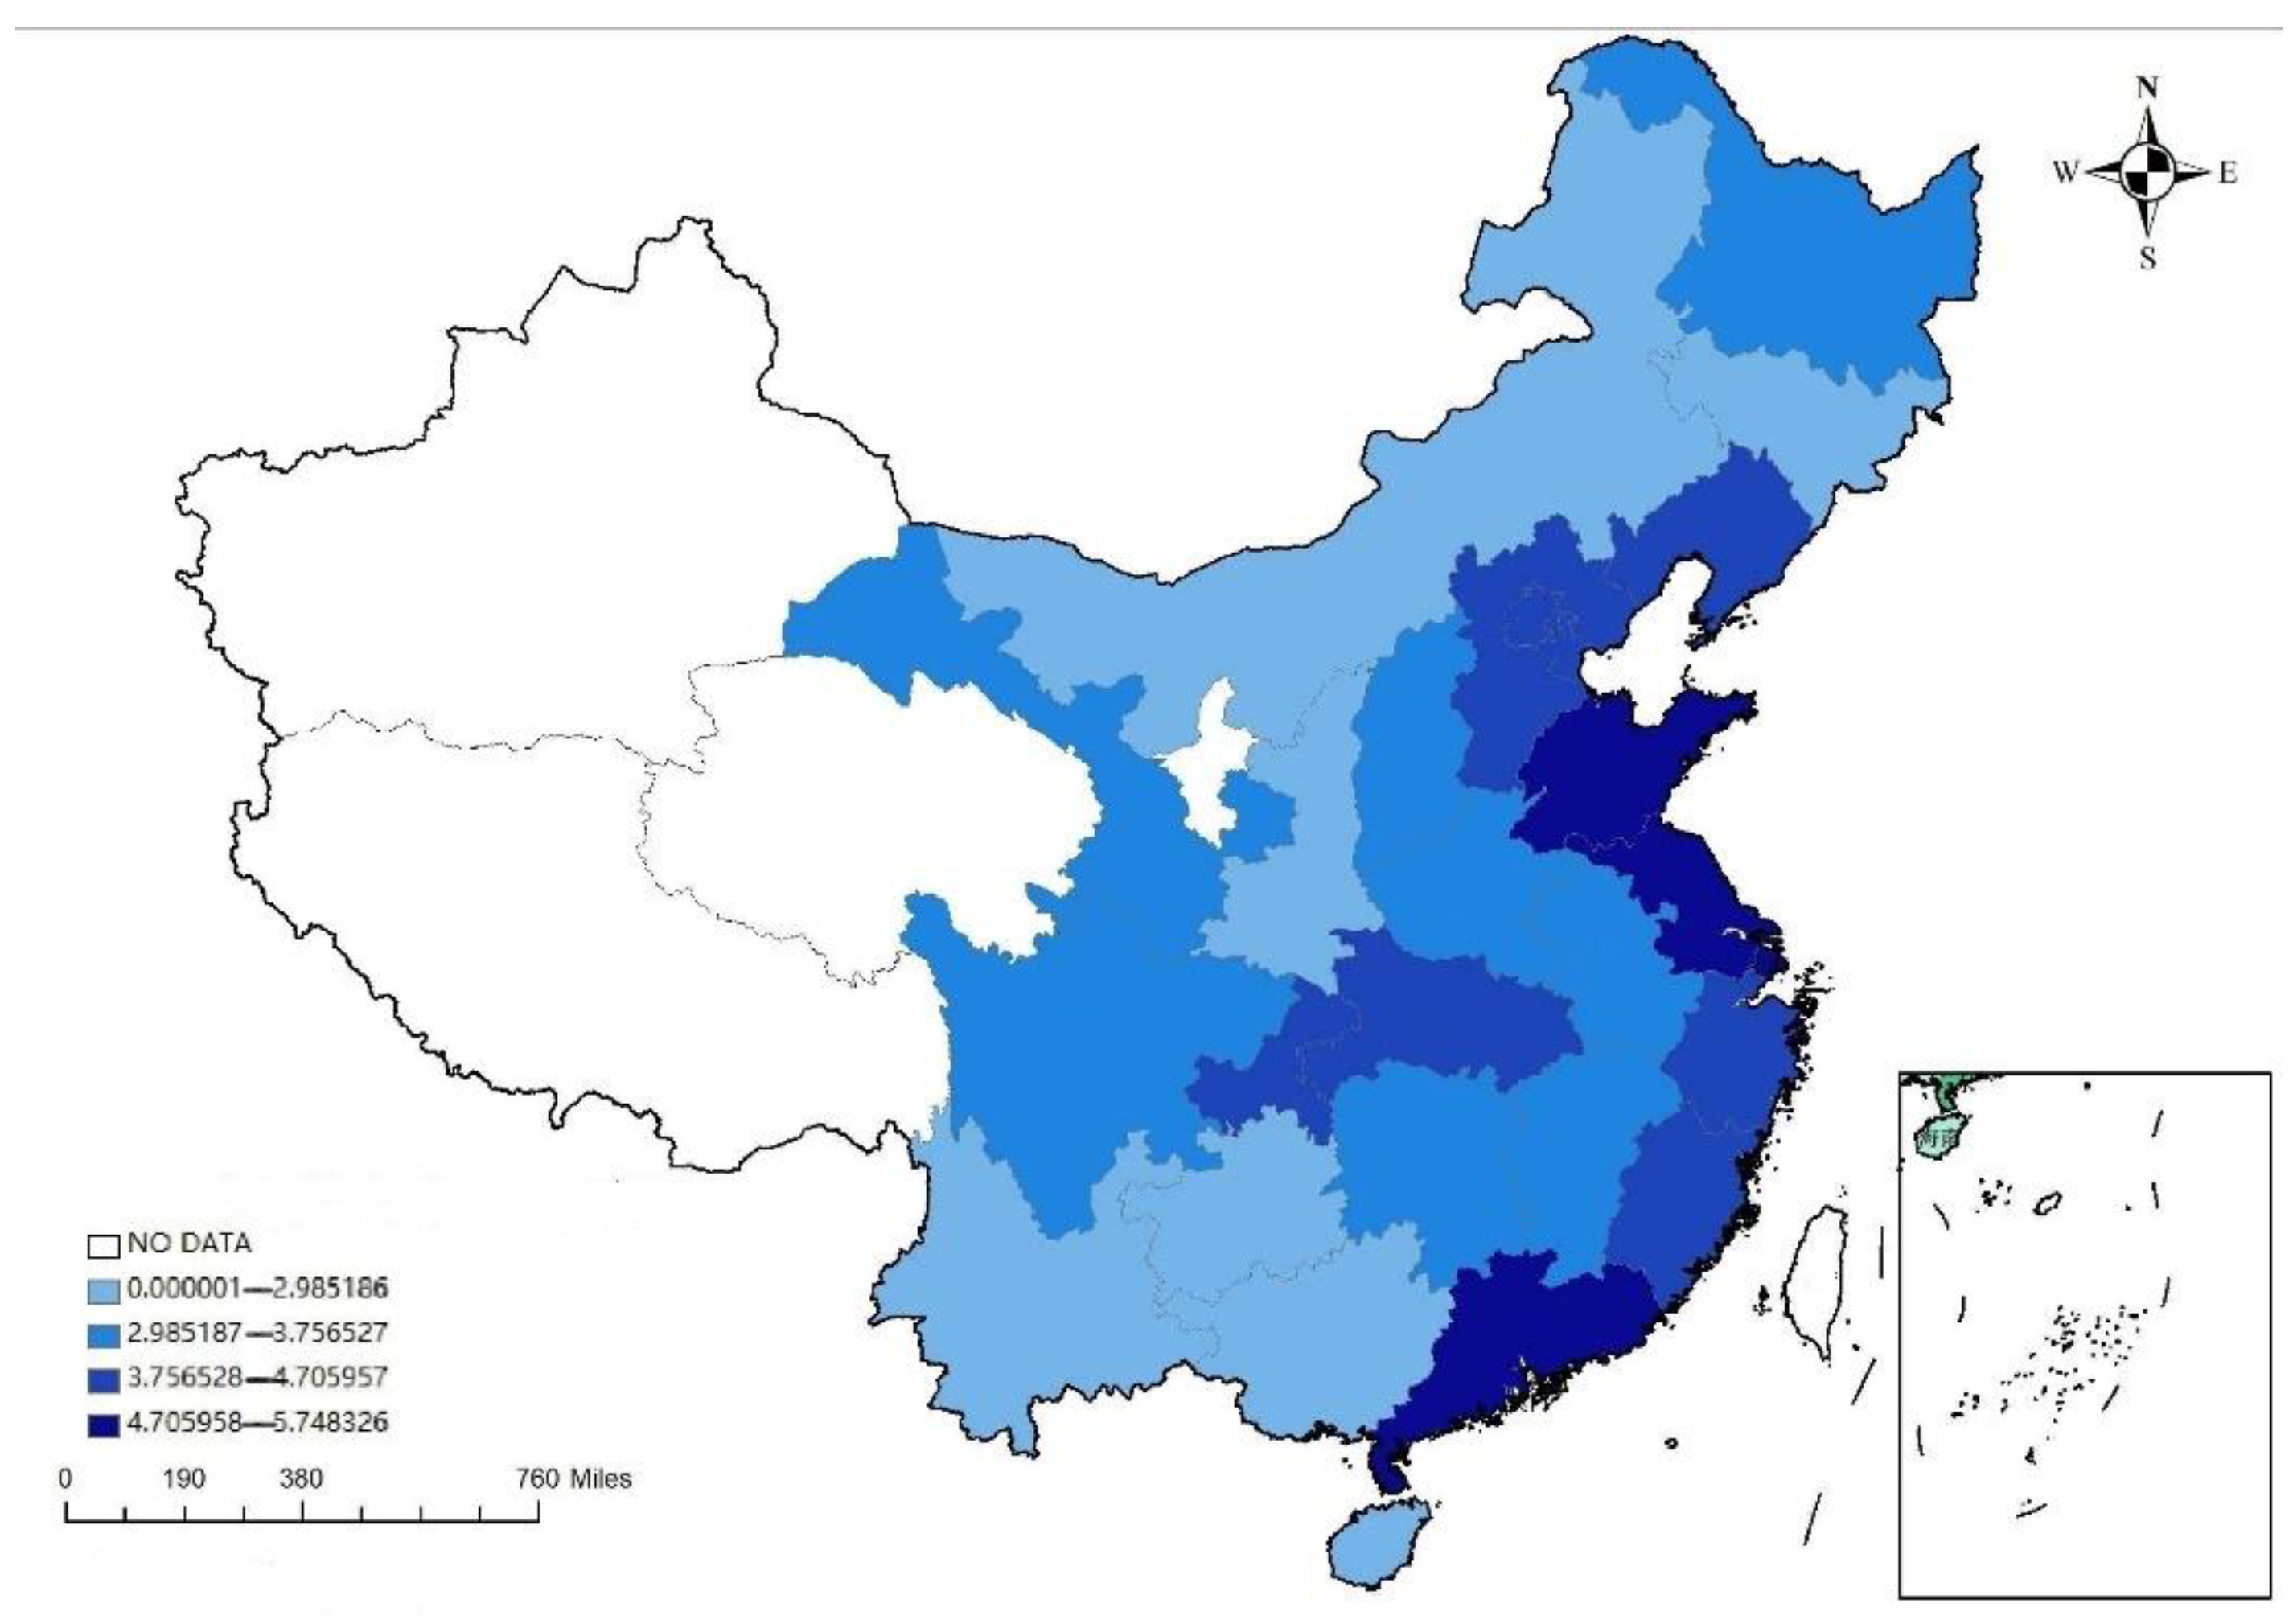
First, we calculated the total carbon emissions by calculating the total amount of direct carbon emissions and indirect carbon emissions and analyzing the development status of China’s technology import and carbon emission levels. The analysis shows that China’s technology imports are intensively distributed in the eastern coastal areas, carbon emissions are mainly concentrated in the central and eastern regions, and the development level is positively correlated. From the perspective of emission reduction effects, due to the lagging policy, the emission reduction effects of relevant provinces in 2020 is relatively obvious, with the central and eastern provinces of China having the most obvious effects. Some provinces in southern and western China also cut emissions. This shows that China’s relevant emission reduction policies have achieved initial results through the introduction of foreign advanced technology to promote technological progress in industry, eliminate backward technology, and improve energy efficiency.
Secondly, in order to explore the relationship between technology imports and carbon emissions of key industries, this paper conducted an empirical analysis based on the panel fixed effect model and spatial econometric model and found that the influence coefficients of technology imports were building materials industry > petrochemical industry > non-ferrous metal industry > iron and steel industry. This shows that the carbon emissions of the building materials industry are the most sensitive to changes in the import of technology, which may be because foreign advanced technology is more prominent in the building materials industry, and can greatly reduce the carbon emissions of China’s building materials industry. The coefficient of the steel industry is lower than that of other industries because the relevant technology in China’s steel industry is relatively mature, and the gap with international advanced technology is not large. The results of the spatial economization model show that technology import and CO2 emission have significant spillover effects, and there are high and high agglomeration and low and low agglomeration trends; that is, provinces with high technology import level and high CO2 emission level have high technology import level and high CO2 emission level in the neighboring provinces. The results of the spatial Dubin model show that technology import can reduce the overall carbon emission level by improving industrial and energy efficiency, and the impact of technology import on carbon emission has a siphon effect. In the provinces where technology is introduced, due to the introduction of high-end and advanced technology, production efficiency has improved and the competitiveness of local enterprises has enhanced, while backward and eliminated enterprises only develop in the surrounding areas. Higher profits bring more technology, which promotes carbon reduction and impedes that of neighboring provinces.
Finally, considering that industrial technological innovation may play an intermediary role in the impact of technology import on carbon emissions in key industries, this paper constructed a mediating effect model to verify this path, and the results showed that industrial technological innovation can indirectly promote technology import to achieve carbon emission reduction, but its emission reduction path is deformed, manifested in the energy rebound effect of industrial technology innovation, and increasing its value would increase total carbon emissions. Technology import mainly achieves carbon emission reduction by curbing an increase in the amount of industrial technological innovation. In the subdivision of key industries, the indirect impact coefficient of industrial technological innovation in the petrochemical industry > non-ferrous metal industry> building materials industry > steel industry. Technology import works best by curbing the emission reduction of industrial technological innovation in the petrochemical industry.

5. Policy Recommendations

Technology import is an important part of technological progress, and an important driver for promoting technological progress and leading economic development. The results show that technology import is conducive to promoting carbon emission reduction in key industries, and industrial technological innovation plays a negative intermediary role in this path. Based on the research results, this paper puts forward the following policy recommendations:
First, we should give full play to the role of technology import in reducing emissions in key industries. Local governments should attach importance to the promotion of technology import. Due to the possible energy rebound effect of technology import, the government should firmly implement and apply any introduced advanced technology, and strictly monitor the change of carbon emissions after the import of technology. Full play should be given to the adjustment ability of the industrial structure of technology import, optimizing the industrial structure of key industries through technology import, building the linkage mechanism, and improving the efficiency of digestion, absorption and re-innovation of introduced technology. The government should actively build the relevant introduction coordination mechanism and set up the relevant information platform. Enterprises in key industries should upload the technical information they need to introduce and should gather a group of enterprises that need the same or similar technologies for joint introduction, reduce the cost of technology imports, and strengthen the absorption capacity of key industries for technology import. To make full use of the leading role of technology import, at present, our country’s domestic innovation ability is insufficient, relying on technology import to a great extent, so the government should actively guide key industries to promote their own innovation ability by introducing advanced technology. They should not be too heavy on either. To avoid a passive situation of “introduction–imitation–re-introduction–re-imitation”, technology import should feed domestic technology innovation. The two should develop together to lead the technological progress of key industries. At the same time, due to the siphon effect of technology import, the central government should make moderate policy preferences and system innovations and give certain financial subsidies and tax exemptions to provinces with low levels of technology import which reduce local carbon emissions and hinder carbon emission reduction in the surrounding areas. We can adopt one-to-one and one-to-many assistance policies to guide the implementation of technology import and promote carbon emission reduction in local key industries.
Second, attach importance to the mediating role of industrial technological innovation. From the empirical results, industrial technological innovation is a high-risk activity with a long-term time span, unpredictable process, high failure rate and high uncertainty of input–output. At present, industrial technological innovation cannot play a positive role in carbon emission reduction in key industries and may still be on the left side of the inflection point of the inverted “U” shaped curve. However, industrial technological innovation is an important way to promote carbon emission reduction in key industries, and emerging and groundbreaking new technologies greatly promote carbon emission reduction in key industries. The government should vigorously promote technological innovation in key industries, speed up technological breakthroughs in smelting technology, purification technology and industrial digitization, and step over the inflection point as soon as possible to help key industries reduce carbon emissions.
Third, appropriate emission reduction policies need to be formulated by industry. The four key industries of iron and steel, non-ferrous metals, building materials and petrochemical chemicals have different characteristics, different development levels, and different status quos of technology import, and the government should evaluate the characteristics of different industries and formulate differentiated policies. For the building materials industry, green buildings are an important way to reduce carbon emissions. The government should vigorously promote the popularity of green buildings, attach importance to cultivating residents’ green concept, encourage residents to choose green building materials, adopt modern energy standards for some types of new buildings, use green building evaluation standards, and review the green buildings that have passed the audit. Developers and builders should be encouraged to design and construct green buildings to promote carbon reduction in the building materials industry. For the iron and steel industry, non-ferrous metal industry and petrochemical and chemical industry, carbon dioxide emissions mainly come from calcination and smelting processes, and the existing process flow need to be improved to reduce waste. Material utilization should be improved and energy efficiency increased by deploying breakthrough technologies and innovative solutions. Expanding the electrification of industry and transitioning to low-carbon and carbon-free fuels is also advocated. Advance pilot demonstrations of transformative technologies, such as hydrogen steel production, iron ore electrolysis, carbon capture, storage and utilization to drive carbon reduction across key industries are all advisable.

Author Contributions

Conceptualization, W.L. and S.J.; methodology, Z.W.; software, L.X.; validation, Z.W., L.X. and W.L.; formal analysis, W.L.; investigation, S.J.; resources, W.L.; data curation, Z.W.; writing—original draft preparation, W.L.; writing—review and editing, Z.W.; visualization, L.X.; supervision, S.J.; project administration, W.L.; funding acquisition, S.J. All authors have read and agreed to the published version of the manuscript.

Funding

This research was funded by [National Natural Science Foundation of China] grant number [71974078].

Institutional Review Board Statement

Not applicable.

Informed Consent Statement

Not applicable.

Data Availability Statement

The data used in paper come from the China Statistical Yearbook, China Science and Technology Statistical Yearbook, China Environment Statistical Yearbook, China Industrial Statistical Yearbook, China Energy Statistical Yearbook, etc.

Conflicts of Interest

The authors declare no conflict of interest.

References

  1. Sun, H.P.; Edziah, B.K.; Kporsu, A.K.; Sarkodie, S.A.; Taghizadeh-Hesary, F. Energy efficiency: The role of technological innovation and knowledge spillover. Technol. Forecast. Soc. 2021, 167, 120659. [Google Scholar] [CrossRef]
  2. McMeekin, A.; Geels, F.W.; Hodson, M. Mapping the winds of whole system reconfiguration: Analysing low-carbon transformations across production, distribution and consumption in the UK electricity system (1990–2016). Res. Policy 2019, 48, 1216–1231. [Google Scholar] [CrossRef]
  3. Lin, B.Q.; Zhu, J.P. Determinants of renewable energy technological innovation in China under CO2 emissions constraint. Environ. Manag. 2019, 247, 662–671. [Google Scholar] [CrossRef] [PubMed]
  4. Liang, T.; Zhang, Y.J.; Qiang, W. Does technological innovation benefit energy firms’ environmental performance? The moderating effect of government subsidies and media coverage. Technol. Forecast. Soc. Chang. 2022, 180, 121728. [Google Scholar] [CrossRef]
  5. Wang, X.Y.; Zhao, W.H.; Zhang, T.Y.; Qiu, Y.; Ma, P.F.; Li, L.J.; Wang, L.L.; Wang, M.; Zheng, D.Y.; Zhao, W.J. Analysis of the Characteristics of Ozone Pollution in the North China Plain from 2016 to 2020. Atmosphere 2022, 13, 715. [Google Scholar] [CrossRef]
  6. Tian, S.; Jiang, J.; Zhang, Z. Inherent potential of steelmaking to contribute to decarbonization targets via industrial carbon capture and storage. Nat. Commun. 2018, 9, 4422. [Google Scholar] [CrossRef] [Green Version]
  7. Lin, B.; Chen, X. Evaluating the CO2 performance of China’s non-ferrous metals Industry: A total factor meta-frontier Malmquist index perspective. J. Clean. Prod. 2019, 209, 1061–1077. [Google Scholar] [CrossRef]
  8. Zhang, Y.; Hu, S.; Guo, F.; Mastrucci, A.; Zhang, S.; Yang, Z.; Yan, D. Assessing the potential of decarbonizing China’s building construction by 2060 and synergy with industry sector. J. Clean. Prod. 2022, 359, 132086. [Google Scholar] [CrossRef]
  9. Pang, L.; Weng, H.; Chang, J.; Li, Y.; Cai, B.; Lei, Y.; Yan, G.; Lu, C.; Zhang, L.; Qi, Z.; et al. Pathway of Carbon Emission Peak for China’s Petrochemical and Chemical Industries. Res. Environ. Sci. 2022, 35, 356–367. [Google Scholar]
  10. Wang, X.-T.; Luo, Y. Has technological innovation capability addressed environmental pollution from the dual perspective of FDI quantity and quality? Evidence from China. J. Clean. Prod. 2020, 258, 120941. [Google Scholar] [CrossRef]
  11. Zhang, S.; Worrell, E.; Crijns-Graus, W.; Wagner, F.; Cofala, J. Co-benefits of energy efficiency improvement and air pollution abatement in the Chinese iron and steel industry. Energy 2014, 78, 333. [Google Scholar] [CrossRef]
  12. Wen, Z.; Li, H. Analysis of potential energy conservation and CO2 emissions reduction in China’s non-ferrous metals industry from a technology perspective. Int. J. Greenh. Gas Control 2014, 28, 45–56. [Google Scholar] [CrossRef]
  13. Lausselet, C.; Urrego, F.; Resch, E. Temporal analysis of the material flows and embodied greenhouse gas emissions of a neighborhood building stock. J. Ind. Ecol. 2021, 25, 435–447. [Google Scholar] [CrossRef]
  14. Ren, L.; Zhou, S.; Peng, T. A review of CO2 emissions reduction technologies and low-carbon development in the iron and steel industry focusing on China. Renew. Sustain. Energy Rev. 2021, 143, 110846. [Google Scholar] [CrossRef]
  15. Neelis, M.; Patel, M.; Blok, K.; Haije, W.; Bach, P. Approximation of theoretical energy-saving potentials for the petrochemical industry using energy balances for 68 key processes. Energy 2006, 45, 464–473. [Google Scholar] [CrossRef] [Green Version]
  16. Pauliuk, S.; Heeren, N.; Berrill, P. Global scenarios of resource and emission savings from material efficiency in residential buildings and cars. Nat. Commun. 2021, 12, 5097. [Google Scholar] [CrossRef]
  17. Griliches, Z. Research Expenditures, Education, and the Aggregate Agricultural Production Function. Am. Econ. Rev. 1964, 54, 961–974. [Google Scholar]
  18. Romer, P.M. Endogenous Technological Change. J. Polit. Econ. 1990, 98, 71–102. [Google Scholar] [CrossRef] [Green Version]
  19. Zhang, L.; Guo, H. Do Imports of Technology Facilitate Technological Progress? Evidence from China. Procedia Eng. 2012, 29, 2826–2831. [Google Scholar] [CrossRef] [Green Version]
  20. Alexander, G. Economic Backwardness in Historical Perspectives; Harvard University Press: Cambridge, MA, USA, 1962. [Google Scholar]
  21. Rachel, V.E. Catching up and Slowing Down:Learning and Growth Patterns in an Open Economy. J. Int. Econ. 1996, 41, 95–111. [Google Scholar]
  22. Rachelle, C.; Sampson, R.D. Alliance and Firm Performance: The Impact of Technological Diversity and Alliance Organization on Innovation. Acad. Manag. J. 2007, 50, 364–386. [Google Scholar]
  23. Zheng, X.; Yu, H.; Yang, L. Technology imports, independent innovation, and China’s green economic efficiency: An analysis based on spatial and mediating effect. Environ. Sci. Pollut. Res. 2022, 29, 36170–36188. [Google Scholar] [CrossRef] [PubMed]
  24. Liao, H.W.; Yang, L.P.; Ma, H.N.; Zheng, J.J. Technology import, secondary innovation, and industrial structure optimization: A potential innovation strategy for China. Pac. Econ. Rev. 2020, 25, 145–160. [Google Scholar] [CrossRef]
  25. Wu, R.X.; Lin, B.Q. Does Energy Efficiency Realize Energy Conservation in the Iron and Steel Industry? A Perspective of Energy Rebound Effect. Int. J. Environ. Res. Public Health 2022, 19, 11767. [Google Scholar] [CrossRef]
  26. Yang, L.; Li, Z. Technology advance and the carbon dioxide emission in China—Empirical research based on the rebound effect. Energy Policy 2017, 101, 150–161. [Google Scholar] [CrossRef]
  27. Baron, R.M.; Kenny, D.A. The moderator-mediator variable distinction in social psychological research: Conceptual, strategic, and statistical considerations. J. Personal. Soc. Psychol. 1986, 6, 1173–1182. [Google Scholar] [CrossRef]
  28. Paul, J. Elhorst. Matlab Software for spatial Panels. Int. Reg. Sci. Rev. 2014, 68, 401–420. [Google Scholar]
  29. Liu, Z.; Wang, Z.L.; Yuan, C.J. Impact of independent technological innovation on industrial carbon emissions and trend prediction from the perspective of structure. China Popul. Resour. Environ. 2022, 32, 12–21. [Google Scholar]
  30. Preacher, K.J.; Hayes, A.F. Asymptotic and resampling strategies for assessing and comparing indirect effects in multiple mediator models. Behav. Res. Methods 2008, 40, 879–891. [Google Scholar] [CrossRef]
  31. Yan, Y.; Sun, L.; Xu, Q. Carbon emissions reduction in China’s nonferrous metal industry: A critical review. J. Clean. Prod. 2020, 246, 119031. [Google Scholar]
  32. Mackinnon, D.P.; Lockwood, C.M.; Williams, J. Confidence limits for the indirect effect: Distribution of the product and resampling methods. Multivar. Behav. Res. 2004, 39, 99–128. [Google Scholar] [CrossRef] [Green Version]
Figure 1. The mechanism of technology import and industrial technology innovation.
Atmosphere 14 01146 g001
Figure 2. Figure of visualization of China’s technology import in 2011.
Atmosphere 14 01146 g002
Figure 3. Figure of visualization of China’s technology import in 2016.
Atmosphere 14 01146 g003
Figure 4. Figure of visualization of China’s technology import in 2020.
Atmosphere 14 01146 g004
Table 1. Main variable definitions and descriptive analysis.
VariableVariable MeaningObs MinMaxMeanStd.dev.
ceOverall CO2 emissions3008.49311.92610.4280.729
ce1Carbon emissions from steel industry3005.50610.2068.3770.968
ce2Carbon emissions from building materials industry3004.9358.5967.2750.791
ce3Carbon emissions from non-ferrous metal industry3005.0128.827.3060.797
ce4Carbon emissions from petrochemical and chemical industries3005.7399.3368.0350.768
techTechnology import300−0.0275.7483.0561.56
gdpLevel of economic development3002.02315.4175.3792.674
indIndustrial structure3000.3220.8070.4710.097
eiEnergy intensity3000.0350.3920.1060.072
traTrade openness3000.0071.4980.2750.291
eduEducational level3007.62612.4589.2060.881
finFinancial strength3000.120.7580.2640.114
Table 2. Unit root test for major variables.
ModelLLCFisher-PPFisher-ADF
VariableT Valuep ValueChi-Square Valuep ValueChi-Square Valuep Value
ce−5.927 0.000 2.068 0.019 3.199 0.001
tech−5.565 0.000 37.466 0.000 170.293 0.000
Smooth or notYesYesYes
Note: The values reported by the LLC test are the values of the T-test, and the values reported by the Fisher–pp test and the Fisher–ADF test are the values of the Chi-square test.
Table 3. Benchmark model regression results.
Explained VariableCO2 Emissions
tech0.062 ***−0.102 ***−0.308 ***−0.337 ***
(3.67)(−3.14)(−7.35)(−8.43)
gdp 0.041 *** −0.017
(4.17) (−1.45)
ind 0.529 *** −0.677 ***
(2.85) (−3.05)
ei 0.968 ** 2.180 ***
(2.55) (6.31)
tra 0.340 *** 0.227 ***
(3.73) (2.77)
edu 0.062 * −0.007
(1.65) (−0.22)
fin 0.133 −0.381
(0.45) (−1.45)
Constant10.237 ***9.464 ***11.098 ***11.317 ***
(196.27)(28.74)(110.42)(33.75)
Individual fixed effectYesYesYesYes
Time fixation effectNoNoYesYes
Observations300300300300
R-squared0.0480.2260.3500.477
Number of id30303030
Note: The numbers in parentheses are t values, *, **, *** indicate significant at the 10%, 5% and 1% levels, respectively, the same table below.
Table 4. Industry heterogeneity of carbon emissions.
VariableSteelBuilding MaterialsNonferrous MetalPetrochemical Chemicals
tech−0.432 ***−0.637 ***−0.506 ***−0.630 ***
(−7.18)(−10.86)(−7.36)(−9.98)
gdp−0.020−0.016−0.0140.003
(−1.14)(−0.97)(−0.70)(0.14)
ind−0.429−0.609 *−0.783 **−0.319
(−1.29)(−1.87)(−2.06)(−0.91)
ei1.738 ***3.154 ***4.431 ***2.585 ***
(3.35)(6.22)(7.47)(4.74)
tra0.439 ***0.339 ***0.457 ***0.435 ***
(3.57)(2.83)(3.25)(3.36)
edu−0.011−0.024−0.064−0.008
(−0.21)(−0.47)(−1.09)(−0.15)
fin−0.251−0.636 *−1.101 **−0.996 **
(−0.64)(−1.65)(−2.44)(−2.40)
Constant9.375 ***9.031 ***8.667 ***9.426 ***
(18.61)(18.37)(15.07)(17.81)
Observations300300300300
R-squared0.3310.4890.7790.407
Number of id30303030
Note: *; **; *** indicate significant at the 10%, 5% and 1% levels
Table 5. Global Moran index under the reciprocal matrix of geographic distances.
YearCarbon EmissionsTechnology Import
Moran ValueZ Valuep ValueMoran ValueZ Valuep Value
20110.046 2.097 0.036 0.090 3.161 0.002
20120.041 1.946 0.052 0.095 3.302 0.001
20130.039 1.893 0.058 0.095 3.315 0.001
20140.039 1.891 0.059 0.096 3.341 0.001
20150.043 1.994 0.046 0.096 3.337 0.001
20160.039 1.877 0.060 0.096 3.341 0.001
20170.038 1.868 0.062 0.095 3.319 0.001
20180.040 1.916 0.055 0.094 3.308 0.001
20190.038 1.859 0.063 0.093 3.291 0.001
20200.350 1.785 0.074 0.093 3.285 0.001
Table 6. Global Moran index under the reciprocal square matrix of geographic distances.
YearCarbon EmissionsTechnology Import
Moran ValueZ Valuep ValueMoran ValueZ Valuep Value
20110.204 1.676 0.094 0.242 1.908 0.056
20120.203 1.660 0.097 0.252 1.982 0.048
20130.204 1.671 0.095 0.248 1.954 0.051
20140.209 1.699 0.089 0.248 1.961 0.050
20150.219 1.772 0.076 0.246 1.949 0.051
20160.223 1.795 0.073 0..2451.941 0.052
20170.232 1.857 0.063 0.241 1.914 0.056
20180.231 1.850 0.064 0.239 1.900 0.057
20190.230 1.849 0.064 0.236 1.882 0.060
20200.228 1.835 0.067 0.234 1.872 0.061
Table 7. Global Moran index under adjacency matrix.
YearCarbon EmissionsTechnology Import
Moran ValueZ valuep ValueMoran ValueZ valuep Value
20110.228 2.379 0.017 0.207 2.143 0.032
20120.217 2.271 0.023 0.216 2.230 0.026
20130.207 2.178 0.029 0.217 2.246 0.025
20140.203 2.141 0.032 0.220 2.276 0.023
20150.210 2.206 0.027 0.220 2.274 0.023
20160.205 2.145 0.032 0.220 2.282 0.022
20170.202 2.127 0.033 0.219 2.268 0.023
20180.220 2.287 0.022 0.218 2.263 0.024
20190.205 2.158 0.031 0.216 2.251 0.024
20200.189 2.009 0.044 0.217 2.255 0.024
Table 8. LM, LR, WALD test results.
Type of TestTest MethodStatistical Valuesp ValueTest Results
LM testLM-lag6.3260.012 The presence of spatial hysteresis terms and spatial error terms is rejected, and the robustness test is all passed
Robust LM-lag10.3040.001
LM-error110.8210.000
Robust LM-error114.7980.000
LR testLR-lag17.390.015 Rejecting the null hypothesis, the SDM model cannot degenerate into a SAR model
LR-error16.930.018 Rejecting the null hypothesis, the SDM model cannot degenerate into an SEM model
Wald testTest for SAR17.870.013 Rejecting the null hypothesis, SAR models cannot be used
Test for SEM9.210.027 Rejecting the null hypothesis and not using the SEM model
Table 9. Empirical results of spatial Dubin model of various spatial weight matrices.
VariableW1W2W3
MainWxMainWxMainWx
rho0.084 **0.211 **0.242 ***
(0.42)(2.06)(2.87)
sigma2_e0.005 ***0.005 ***0.006 ***
(12.24)(12.19)(12.15)
lntech−0.333 ***0.185 ***−0.298 ***0.200 ***−0.206 ***0.123 **
(−8.82)(2.79)(−7.91)(3.93)(−4.57)(2.09)
gdp−0.032 ***0.140 ***−0.035 ***0.083 ***0.0050.023
(−2.75)(4.54)(−2.72)(4.60)(0.37)(1.20)
ind−0.875 ***−0.788−0.808 ***0.443−0.0420.374
(−4.31)(−1.31)(−4.17)(1.47)(−0.21)(1.29)
ei2.107 ***−4.470 **2.326 ***−3.172 ***1.566 ***−1.257 *
(6.70)(−2.42)(7.19)(−3.92)(4.20)(−1.83)
tra0.180 **0.3940.156 *0.349 **0.268 ***0.144
(2.30)(1.22)(1.90)(2.31)(2.93)(0.84)
edu0.0100.172 *0.0160.122 *0.0540.050
(0.35)(1.79)(0.55)(1.95)(1.59)(0.82)
fin−0.3893.085 ***−0.556 **2.002 ***−0.2341.386 **
(−1.63)(3.19)(−2.28)(3.67)(−0.87)(2.39)
Observations300300300300300300
R-squared0.650 0.650 0.480 0.480 0.520 0.520
Number of id303030303030
Note: *; **; *** indicate significant at the 10%, 5% and 1% levels
Table 10. The intermediary effect of carbon emission reduction in industrial technology innovation.
Explained Variableceinoce
tech−0.337 ***−0.294 ***−0.317 ***
(−8.43)(−2.83)(−7.91)
ino 0.071 ***
(2.96)
gdp−0.017−0.001−0.017
(−1.45)(−0.02)(−1.47)
ind−0.677 ***−0.506−0.641 ***
(−3.05)(−0.88)(−2.93)
ei2.180 ***−2.797 ***2.378 ***
(6.31)(−3.12)(6.85)
tra0.227 ***0.725 ***0.176 **
(2.77)(3.41)(2.13)
edu−0.007−0.1100.001
(−0.22)(−1.24)(0.01)
fin−0.381−0.515−0.344
(−1.45)(−0.75)(−1.33)
cons11.317 ***10.619 ***10.568 ***
(33.75)(12.20)(25.41)
Observations300300300
R-squared0.4770.8050.495
Number of id303030
Note: **; *** indicate significant at the 5% and 1% levels.
Table 11. Intermediary mechanism for carbon emission reduction of industrial technological innovations in different key industries.
Explained Variablece1inoce1ce2inoce2
tech−0.432 ***−0.294 ***−0.409 ***−0.637 ***−0.294 ***−0.607 ***
(−7.18)(−2.83)(−6.75)(−10.86)(−2.83)(−10.34)
ino 0.077 ** 0.100 ***
(2.14) (2.87)
Observations300300300300300300
R-squared0.3310.8050.3430.4890.8050.505
Number of id303030303030
Explained variablece3inoce3ce4inoce4
tech−0.506 ***−0.294 ***−0.465 ***−0.630 ***−0.294 ***−0.577 ***
(−7.36)(−2.83)(−6.81)(−9.98)(−2.83)(−9.40)
ino 0.137 *** 0.180 ***
(3.38) (4.92)
Observations300300300300300300
R-squared0.7790.8050.7890.4070.8050.459
Number of id303030303030
Note: **; *** indicate significant at the 5% and 1% levels. Since the regression results of the control variables are basically consistent with the overall carbon emissions, they are not shown here.
Table 12. Robustness test results.
MethodRegression CoefficientConfidenceRobustness
Replace explanatory variables−0.590 99%Yes
Add a first-order lag term−0.286 99%Yes
Delete some cities−0.340 99%Yes
Table 13. Bootstrap test results.
bs_1bs_2Confidence
ce0.0630.1360.050.20199%
ce10.1040.2120.170.32699%
ce20.0990.1970.0770.18599%
ce30.1250.2190.060.19399%
ce40.1040.2030.0820.18999%
Disclaimer/Publisher’s Note: The statements, opinions and data contained in all publications are solely those of the individual author(s) and contributor(s) and not of MDPI and/or the editor(s). MDPI and/or the editor(s) disclaim responsibility for any injury to people or property resulting from any ideas, methods, instructions or products referred to in the content.

