
Projected Future Changes in Extreme Climate Indices over Central Asia Using RegCM4.3.5

1
Department of Physics, Faculty of Engineering and Natural Sciences, Isik University, 34980 Istanbul, Turkey
2
Center for Climate Change and Policy Studies, Bogazici University, 34342 Istanbul, Turkey
Atmosphere 2023, 14(6), 939; https://doi.org/10.3390/atmos14060939
Submission received: 11 April 2023
/
Revised: 19 May 2023
/
Accepted: 24 May 2023
/
Published: 27 May 2023
(This article belongs to the Special Issue Weather and Climate Extremes: Observations, Modeling, and Impacts)
Abstract
:This work projected future extreme climate indices’ changes over Central Asia (The Coordinated Regional Climate Downscaling Experiment—CORDEX Region 8). Changes were calculated for 2071–2100 relative to 1971–2000. Climate simulations were obtained by downscaling the RegCM4.3.5 to 50 km resolution under RCP4.5 and 8.5 with HadGEM2-ES and MPI-ESM-MR. The results indicate that the Central Asian domain will experience warmer and more extreme temperatures with increasing radiative forcing. The annual lowest value of minimum daily temperature was simulated to increase remarkably, up to 8 degrees, especially in high latitudes, with a more than 12 degree increase projected over Siberia. A strong growth in the percentage of warm nights and an increase in the days of warm spells for the whole region, with a decrease in cold spell duration, are anticipated. Model results show an expected reduction of up to 30% in precipitation totals over the domain, except for the increased precipitation over Siberia, the Himalayas, and Tibetan Plateau. Extreme precipitation events are projected to have an increase of 20% over the whole domain, with an 80% increase over high topographical areas.
1. Introduction
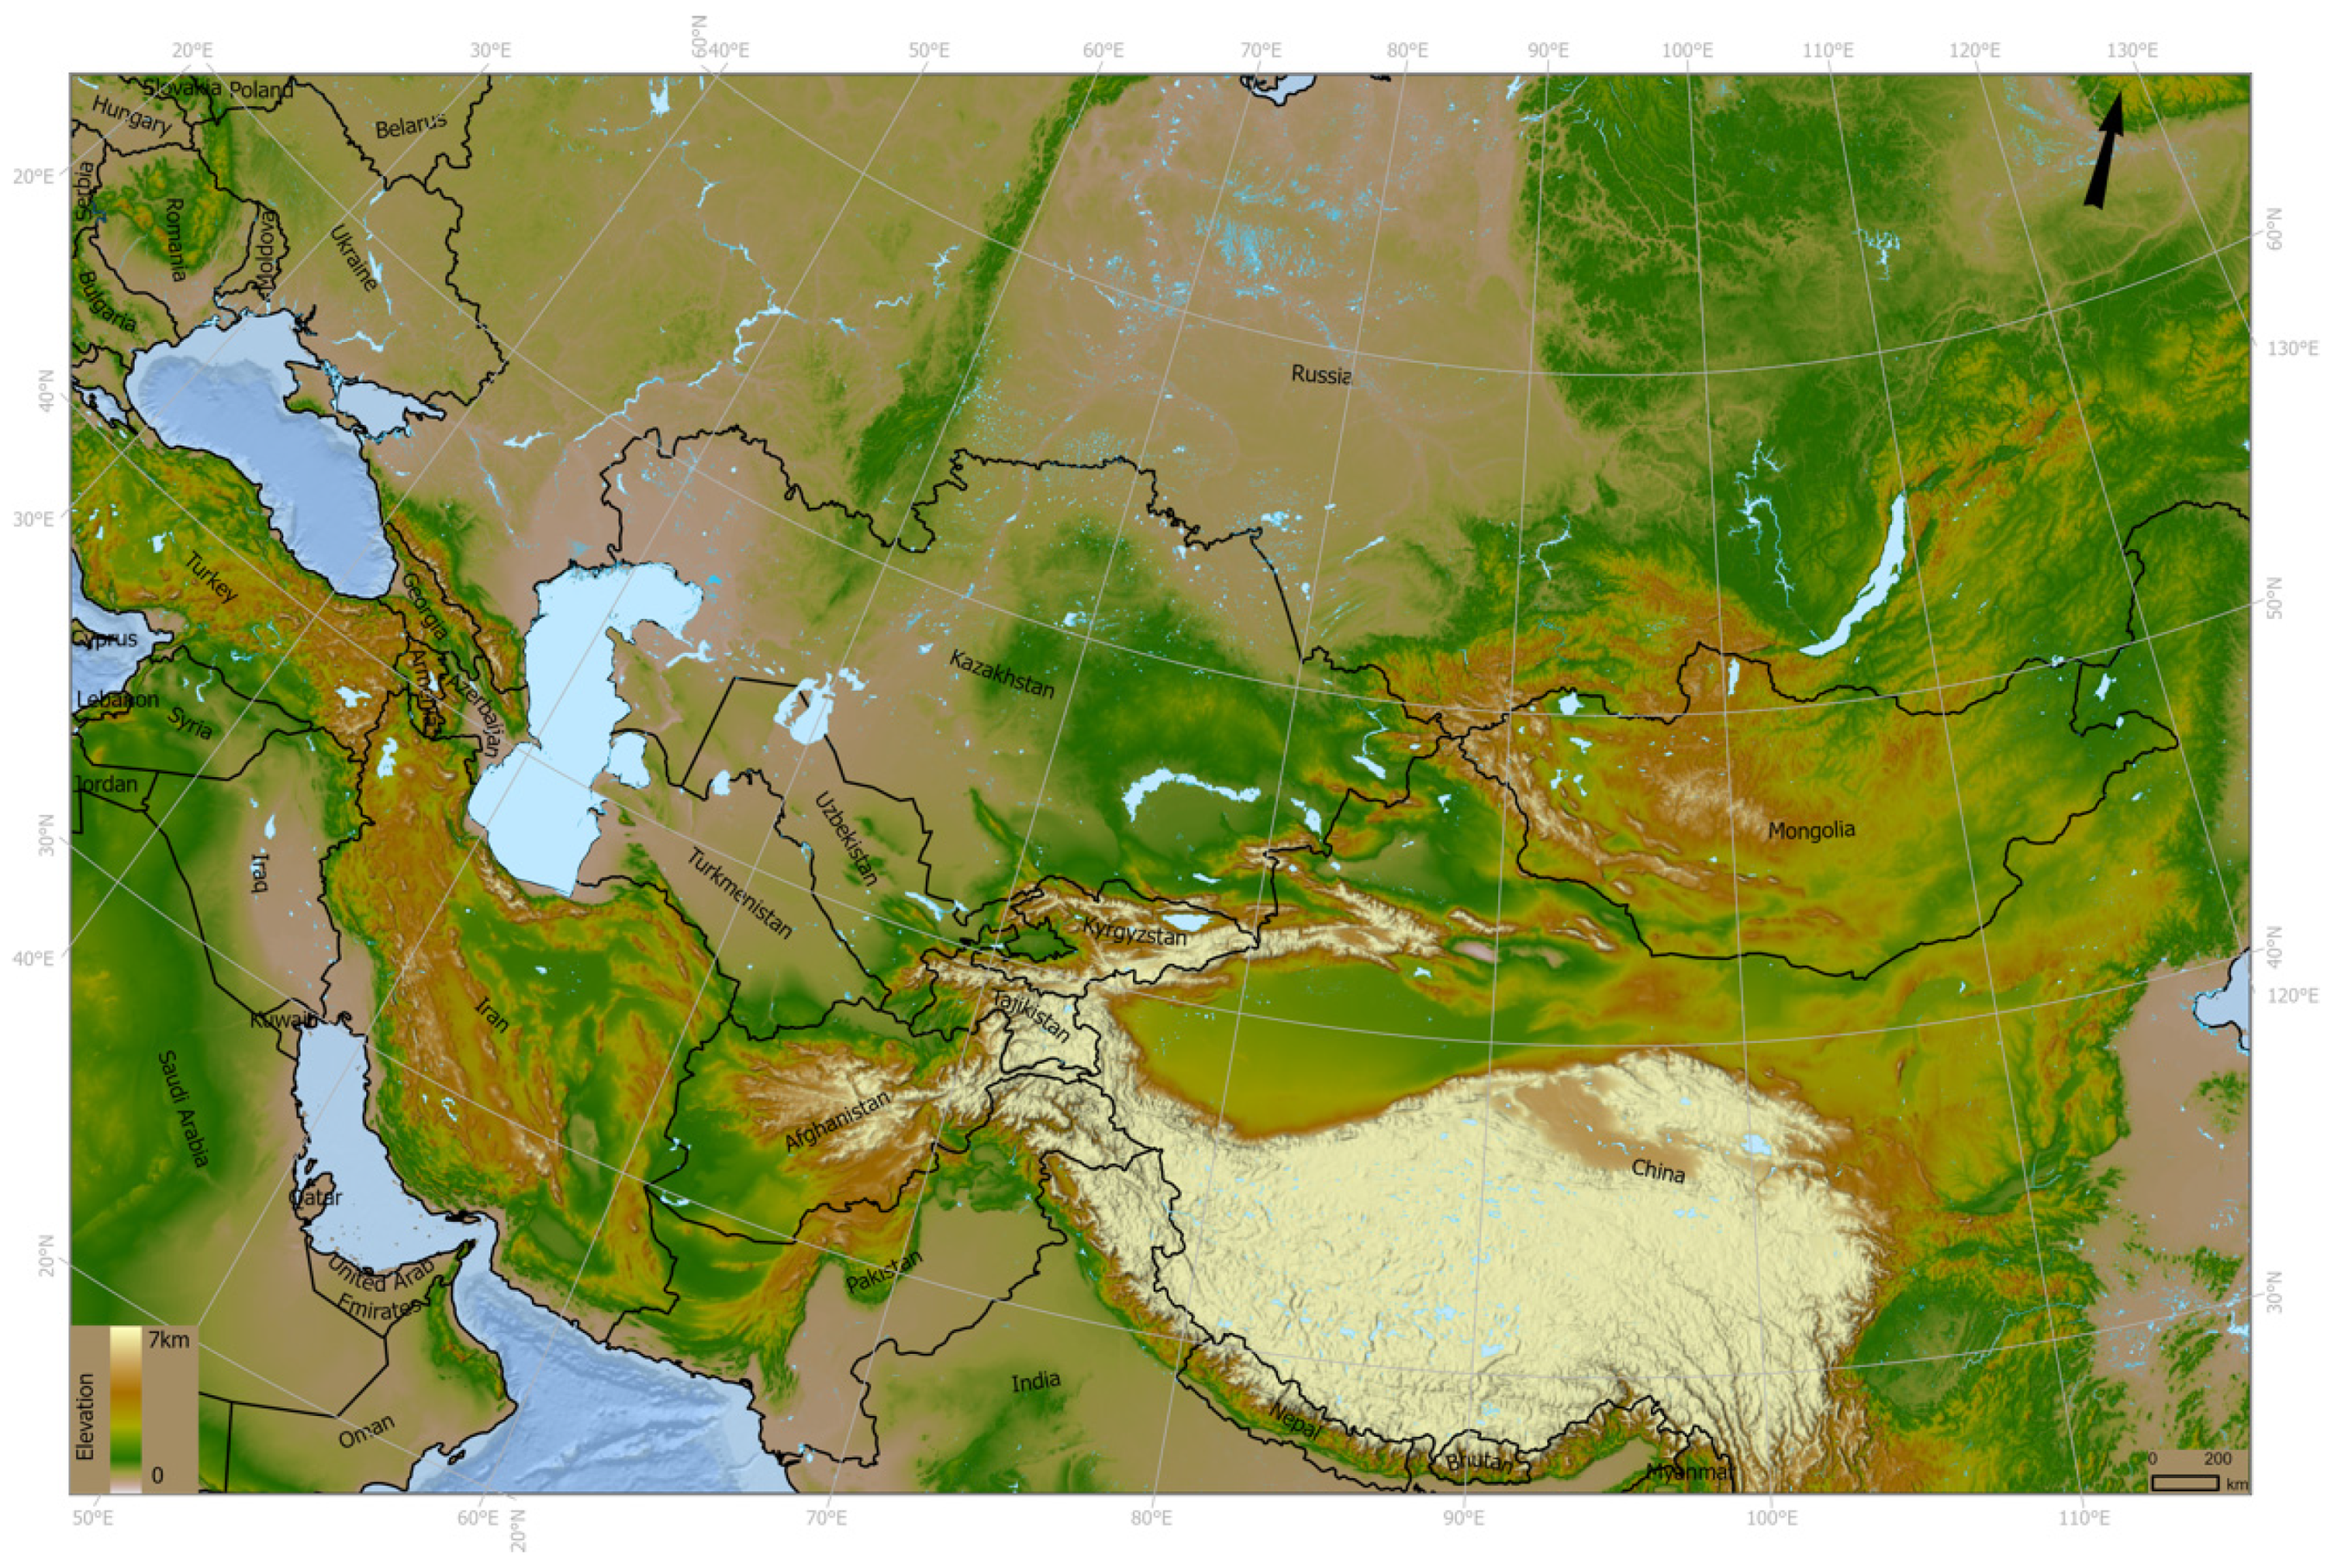
Central Asia ranges from the Caspian Sea to China and Russia to Afghanistan. It is among the regions susceptible to climate change because of its dry and continental climate characteristics. It has a diverse topography, including large deserts, high mountains, and vast grassy steppes, indicating significant differences in climate variability and change [1] (Figure 1). Even though the Central Asian region has a high glacial and snow water capacity due to the high mountains surrounding it, it has scarce water resources.
Studies based on observations from the last 60 years have shown a substantial increase in annual surface temperature over Central Asia [2]. According to observational datasets, the temperature rose by 0.16 °C per decade between 1901 and 2003 [3], 0.39 °C per decade between 1979 and 2011 [4], and 0.28 °C per decade from 1950 to 2016 [5]. A significant warming rate has happened in the more recent period, with spring being the most prominent [4]. The Global Precipitation Climatology Centre (GPCC) full data reanalysis version 7 (GPCC V7) shows a 0.66 mm increase per decade in annual precipitation in Central Asia between 1901 and 2013 [6]. Even though winter precipitation increased significantly to 1.1 mm per decade, no significant trends were found in the region from 1960 to 2013 based on the same dataset [7]. On the contrary, during 1960–2013, precipitation increased by 1.3–4.8 mm per decade in the high topographical region of Central Asia [4,7,8,9,10]. Even though studies on Central Asia are inadequate, the number of works on projections of future climate change using climate models has been increasing for the last decade [11,12,13,14,15,16,17,18,19,20]. A study based on the regional climate model (RCM)—The Weather Research and Forecasting (WRF)—results over Central Asia show that under RCP4.5, annual mean temperatures will increase from 1.63 to 2.01 °C for 2031–2050 compared to 1986–2005 [20].
Warming over Central Asia is simulated to be more than the global temperature increase [21]. Warming of boreal summer will increase by 2.5 °C relative to 1951–1980 in a 2 °C hotter world, whereas the increase is expected to be 6.5 °C in a 4 °C increase, according to the multi-model mean of GCMs. Drier conditions are anticipated over regions in the southwest part of Central Asia, whereas wet conditions will occur in the northeast. In a 4-degree warmer world, a 20% decrease in annual precipitation is obtained from a multi-model ensemble for Turkmenistan and some regions of Tajikistan and Uzbekistan. In contrast, more substantial decreases were projected for summer.
The study [17] based on a statistical downscaling technique, reported that the temperature will rise 0.37 °C per decade between 2021 and 2060 compared to between 1965 and 2004 under RCP4.5, while a 4.63 mm increase in precipitation is projected per decade. According to their results, change in rainfall has a strong spatiotemporal characteristic, with a decrease occurring in the central and southern parts of the region for summer. Based on the outputs of the five best out of 28 CMIP5 models, relatively more substantial increase rates in annual precipitation of over 3 and 6 mm per decade are projected over northern Central Asia and the northeast part of the Tibetan Plateau under RCP2.6, RCP4.5, and RCP8.5 scenarios, respectively [14]. According to a study analysing changes in drought features using six global climate models from CMIP6, over Central Asia, precipitation and potential evapotranspiration are anticipated to increase [19]. The duration, intensity, severity, and frequency of drought events are projected to be higher by more than 55%, 8%, 74%, and 125%, respectively, under all scenarios.
Heatwaves and droughts, damaging the natural environment and substantially impacting human society, are highly likely to occur in Central Asia [6,16,18,22,23]. The temperature-based extreme climate indices, including the number of summer days and the daily maximum and minimum temperatures, are anticipated to rise. In contrast, regarding regional climate model simulations, the number of frost days decreases over Central Asia [18]. Results show that under RCP8.5, days with precipitation totals above 10 mm, the intensity of precipitation on wet days, and the number of consecutive dry days (CDD) are anticipated to increase considerably. The study by Liu et al. 2020, investigating the precipitation extremes using five CMIP5 GCMs shows that with 1.5 °C global warming, heavy precipitation and the mean annual total precipitation (PRCPTOT) are expected to increase by 27% and 8%, respectively. CDD will be decreased by 1.1 days compared to the reference period of 1986–2005. On the contrary, the standardized precipitation evapotranspiration index (SPEI), which measures the monthly (or weekly) difference between precipitation and potential evapotranspiration indicates that more than 60% of Central Asia will experience significant drought conditions. An increase in PRCPTOT, R95P, and CDD will be expected to be 4%, 25%, and 0.8 days, respectively, in the 2 °C warmer world. Multi-model ensemble of the latest generation GCMs shows that an increase in extreme precipitation indices will be about as linear as global temperature change, excluding the CDD [22]. The mean of annual and maximum 1-day precipitation will increase by 12.0 and 14%, respectively, with a 3 °C global temperature change, compared to 1981–2010. Despite an increasing number of studies on the projection of future climate conditions in Central Asia, an inadequate number of studies have been done, especially on climate extremes using high-resolution regional climate model outputs.
In this work, outputs of the RegCM4.3.5 forced by two models under the RCP4.5 and RCP8.5 were used to examine the future change in extreme climate indices in Central Asia for 2071–2100. Section 2 describes climate models and extreme climate indices used in this work. Section 3 presented the results of change patterns in indices throughout the century. In the last section, results are discussed, and conclusions developed.
2. Materials and Methods
In this work, assessing the changes in extreme indices was carried out to provide information to the impacted community. With this aim, the HadGEM2-ES and MPI-ESM-MR were downscaled to 50 km for Central Asia using the RegCM4.3.5 [24]. Validation of the model and parameterizations used for the Central Asia domain were explained in detail by [12]. Future projections throughout the century were simulated compared to the 1971–2000 period under RCP4.5 and RCP8.5. Twelve of the 27 extreme climate indices developed by the Expert Team on Climate Change Detection and Indices (ETCCDI) were used [25,26,27]. Additionally, these indices were compared with the observation-based dataset. The gridded HadEX3 data set was used to evaluate the model’s performance [28]. HadEX3 indices were computed from station-based data and interpolated into a global grid. HadEX3 contains 29 indices on a 1.25° × 1.875° grid. This study used three HadEX3 indices to compare the results by interpolating them into 50 km resolution.
Indices used in this work are classified as follows: absolute, threshold, percentile-based, and duration. Absolute temperature indices of the maximum of maximum temperature (TXx) and the minimum of minimum temperatures (TNn) refer to the annual daily maximum and minimum temperatures, respectively. Those indices generally show the extreme temperature range in a given period [25,29]. Frost days (FD) and tropical nights (TR) are called threshold indices since they are used to calculate the number of days a threshold temperature is surpassed. FD calculates the number of days when TN is less than 0 °C, whereas TR calculates the number of days when TN is greater than 20 °C. They are frequently used in impact studies on human health [30] and agriculture [31]. The heavy precipitation day index (R10mm) is also a threshold index, determining the number of days when the precipitation total is above 10 mm. Percentile-based indices calculate the number of days as a percentage that surpass the thresholds computed from percentiles of the base period. Percentile-based indices used in this study are cold nights (TN10p) and warm nights (TN90p), presenting the percentage of days where TN is less than the 10th and TN is greater than the 90th percentile of the based period, respectively. The extremely wet days (R95p) index calculated the annual precipitation amount when the daily precipitation total surpassed the 95th percentile of precipitation for 1971–2000. Warm spell (WSDI) and cold spell duration (CSDI) indices, called duration indices, calculate the number of days when TX is greater than the 90th percentile, and TN is less than the 10th percentile of the base period for at least six consecutive days, respectively. CDD is also defined by the duration of the lengthiest period of dry days that occured sequentially in a year. The total wet-day precipitation index (PRCPTOT), which does not fit into these categories, was defined as the annual precipitation totals on wet days where the precipitation amount is greater than 1 mm.
3. Results
3.1. Model Performance Evaluation
Results were compared with the observational dataset to evaluate the regional climate model’s performance in representing past extreme conditions. TXx and TNn were calculated and averaged for 1971–2000 using RegCM results driven by HadGEM2-ES and MPI-ESM-MR and compared with the HadEX3 indices (Figure 2). Model results give more detailed pictures of the indices than observations because of the observational dataset’s relatively coarse resolution. Nevertheless, model results generally simulated the observed spatial pattern of TXx and TNn indices. Colder highest (Figure 2c,e) and colder lowest (Figure 2d,f) temperatures over the Tibetan plateau were simulated for both model results compared to observed temperatures. These results also align with the biases in mean climatology over the Tibetan plateau [12]. This might be related to the location of meteorological stations constructed in this region’s valleys.
Figure 3 represents the PRCPTOT values in mm/day of model results and observation for 1971–2000. Model results driven by HadGEM2-ES reproduced observed precipitation values well over the northern part of the domain, including Siberia. MPI-ESM-MR-driven regional model results overestimated observed precipitation values, especially over Eastern Europe and Western Russia. Both models simulated precipitation well over Kazakhstan, Uzbekistan, Turkmenistan, and Iran. Even though the spatial pattern of the observed precipitation totals over the Himalayas and Tibetan plateau is well simulated by the regional model driven by both global models, model results overestimated precipitation over high topographical regions, including the Caucasian mountains (Figure 3b,c).
Uncertainties in the model results were also investigated by undertaking statistical comparisons of model results and the HadEX3 dataset presented in Table 1. Statistical comparisons were performed for three indices by calculating bias, root mean square error (RMSE), and correlation. According to the results, both results of the regional model driven by different GCMs indicate cold bias in TXx and TNn, which might be related to the high topographical cold bias also seen in the map. Bias is less in HadGEM2-ES-driven results in TXn whereas it is high in TNn. RMSE results give similar values for both model outputs. On the other hand, the model results are highly correlated with the HadEX3 dataset, especially for TNn. HadGEM2-ES-driven model results have better performance in simulating total precipitation compared to MPI-ESM-MR-driven model results by means of bias and RMSE. Both have similar correlation coefficients. Even though performing a comparison on extreme indices may not be a robust measurement of uncertainty since the extreme temperatures might be happening on different days of the year, model performance can be considered reasonable.
3.2. Temperature Indices
Simulated changes in TNn and TXx by model outputs under RCP4.5 and RCP8.5 are presented in Figure 4. The spatial patterns of change are given for 2071–2100 compared to 1971–2000. Results of models and scenarios show that an increase in both indices is expected over Central Asia. The changes are more marked under the RCP8.5 scenario, as expected. The most significant increase, exceeding 12 °C, is anticipated in the annual minimum of TN in RCP8.5 for HadGEM2-driven outputs of RCM over the northern part of the region (Figure 4g). According to other scenarios and model outputs, the increase in TNn is more significant at higher latitudes, most likely due to the disappearing snow cover with increasing temperature. For the southern part of the domain, warming is simulated to be up to 4 °C in RCP4.5 (Figure 4a,c) and more than 8 °C in RCP8.5, for the HadGEM2-ES, especially over Turkey, Kazakhstan, Turkmenistan, and Uzbekistan (Figure 4g). On the contrary, the spatial change in TXx is more uniformly projected. Warming is getting stronger with increasing radiative forcing. Under the RCP4.5 scenario, warming in the annual maximum of TX is expected to be 4 °C over almost all parts of Central Asia based on both model outputs. For RCP8.5 scenario outputs, HadGEM2-ES gives more severe results with a warming of about 6 °C for the entire region.
Figure 5 and Figure 6 represent the temporal evolution of the projected change in the spatial mean of TXx and TNn, respectively, compared to 1971–2000. Results are given as the 5-year running mean of the change. Change in TXx has a smoother increasing trend compared to TNn for model results and scenario outputs. Results start to differ around 2030 (Figure 5). HadGEM2-ES-driven results have a more severe change in the highest temperature of the year compared to MPI-ESM-MR-driven results, as seen in the spatial maps. Both models’ results under RCP8.5 have similar increasing trends with different magnitudes, most likely because of the concentration pathway. The highest increase of 7.61 °C in TXx is anticipated by the HadGEM2-ES-driven regional model under RCP8.5, which is 5.71 °C for the MPI-ESM-MR-driven results under RCP8.5 for the end of the century.
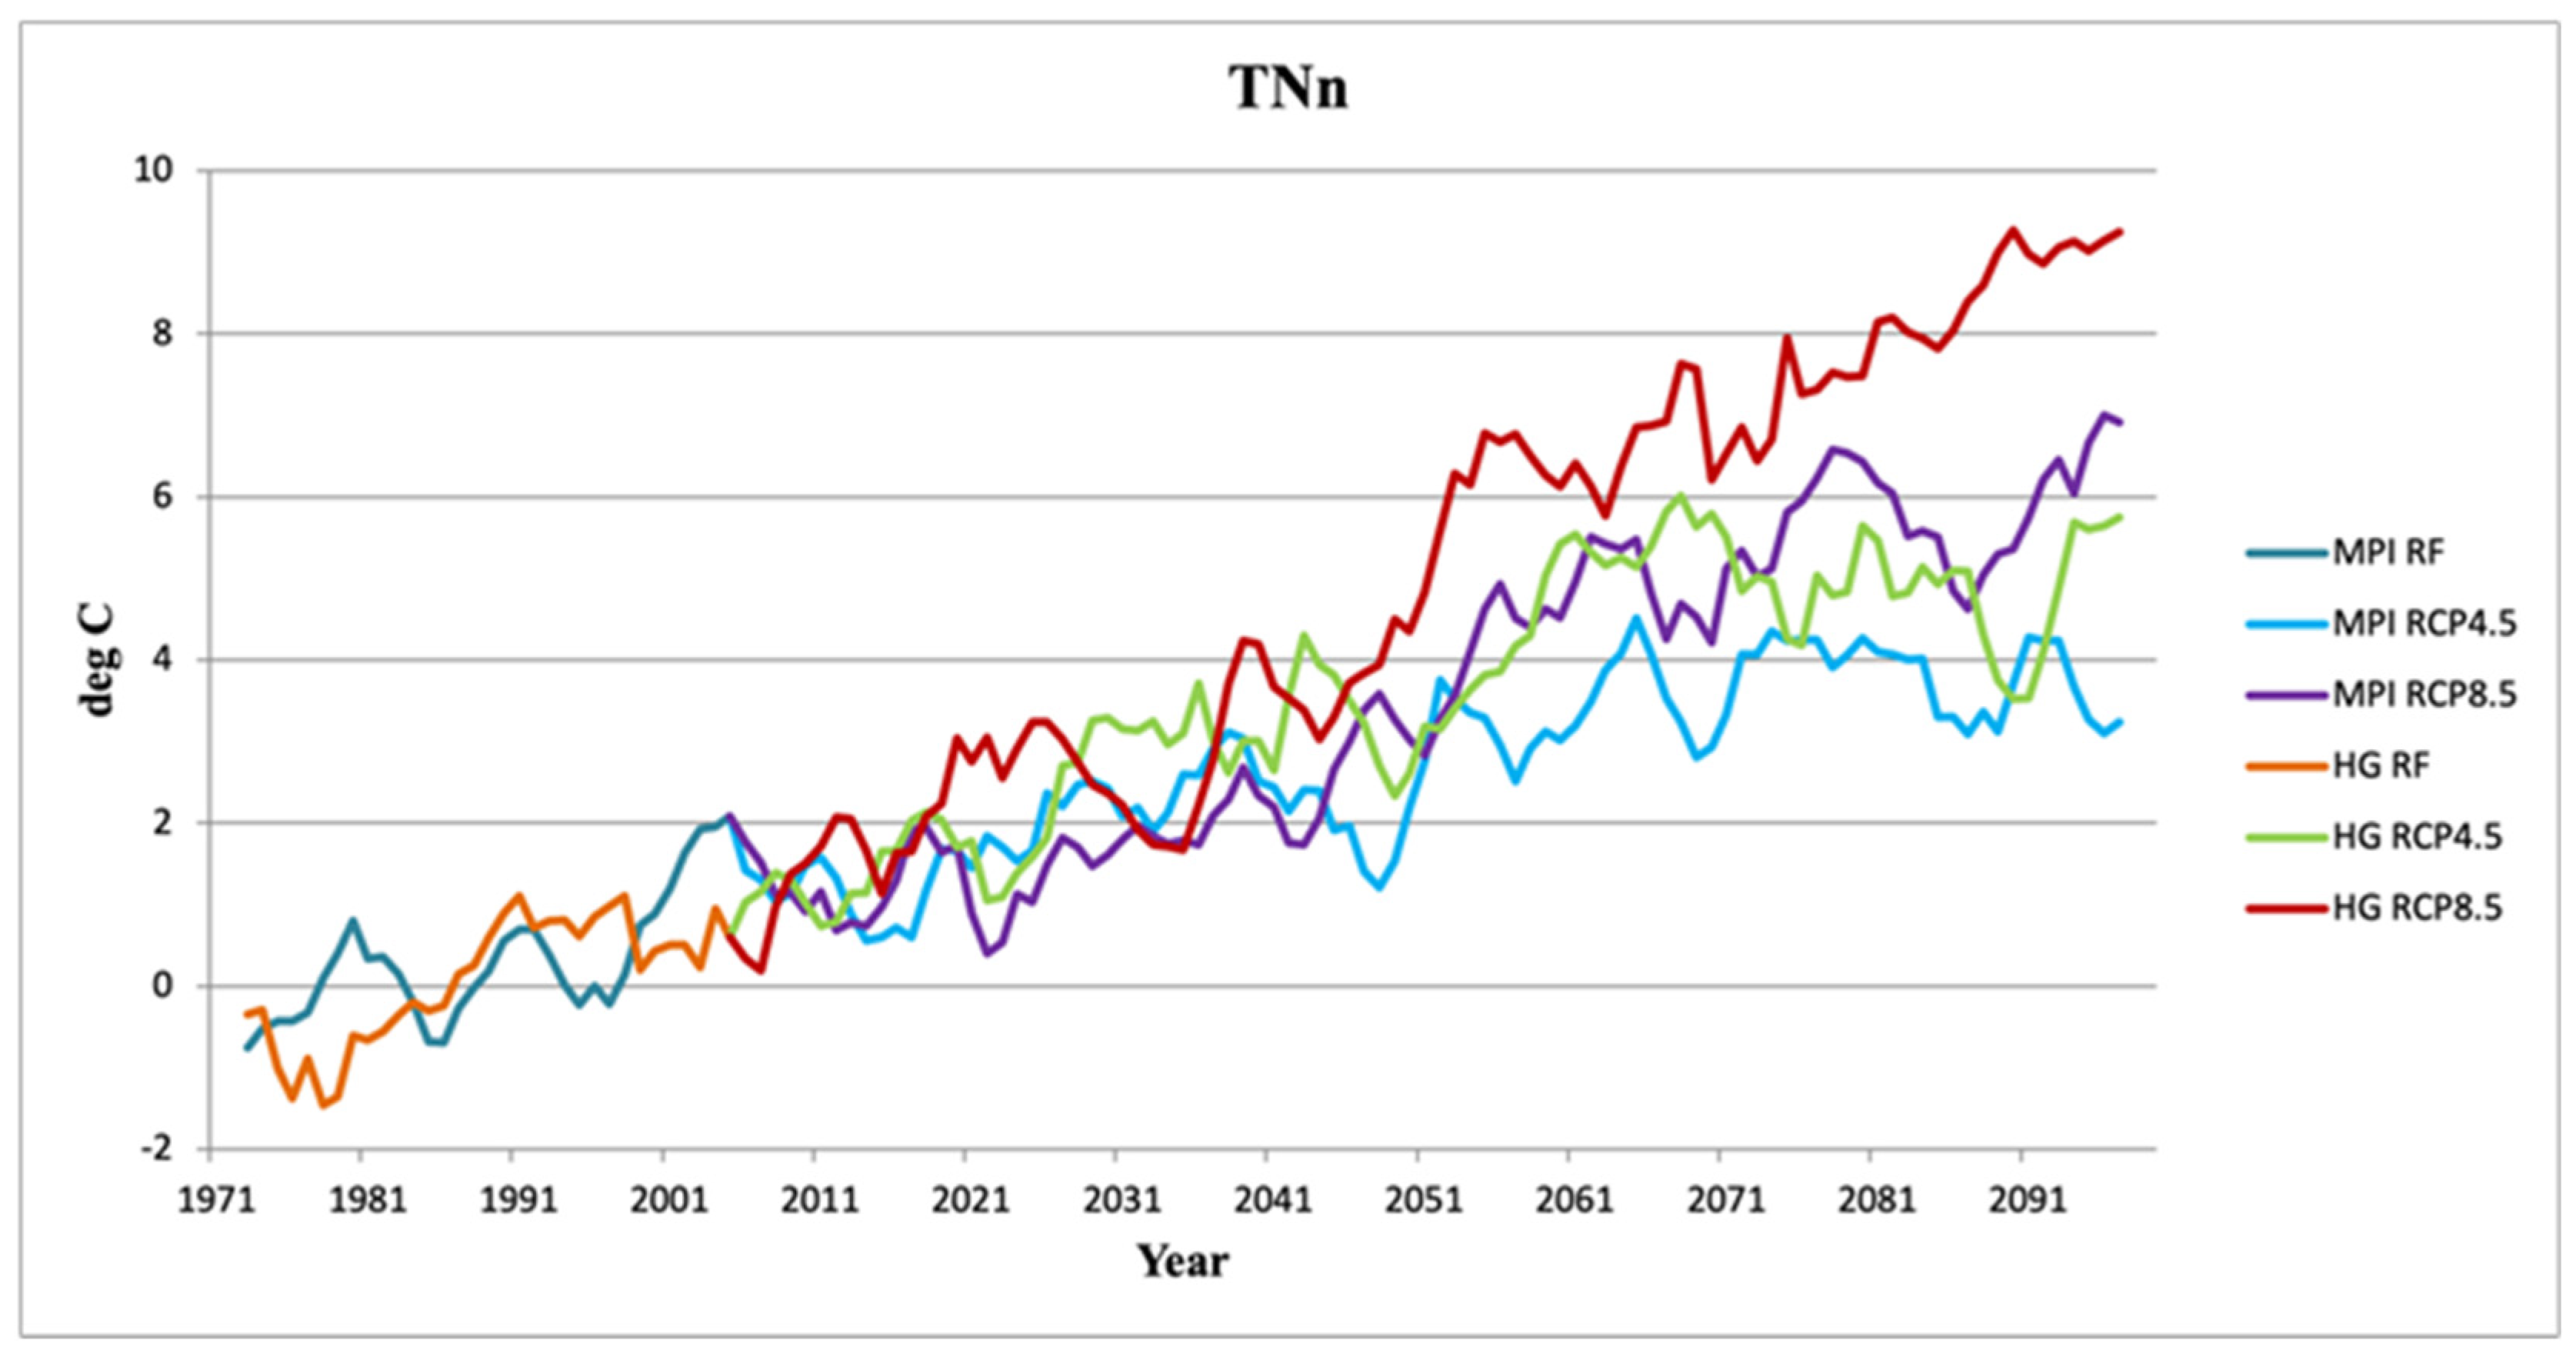
The projected change in the year’s lowest temperature is higher for both model and scenario results than the year’s highest temperature throughout the century (Figure 6). The highest increase of 9.25 °C in TNn is anticipated by HadGEM2-ES-driven results under RCP8.5 for the end of the century. It is expected to be 6.91 °C for MPI-ESM-MR-driven results under RCP8.5. The change in TNn fluctuates more than TXx, even in the reference period. HadGEM2-ES-driven results under RCP4.5 have a higher increase than the results of MPI-ESM-MR under RCP8.5 till 2047 and have a similar increasing trend until 2065.
In Figure 7, spatial changes in FD are displayed for 2071–2100 relative to 1971–2000 for both models and under two scenarios. The number of frost days decreases by around 30 days in the northern part of the domain under the RCP4.5 scenario. The most substantial decrease is anticipated in RCP8.5, with a decrease of at least 80 days in eastern Turkey, the Iranian Plateau, Afghanistan, and the Tibetan Plateau. Kazakhstan and Siberia are projected to experience 50 days of decline in frost days under RCP8.5 obtained with HadGEM2-ES (Figure 7d). MPI-ESM-MR results show a slighter decrease of around 35 days over the same region in RCP8.5 (Figure 7b).
The number of tropical nights when TN exceeds the 20 °C threshold increases more in the southern part of Central Asia, comprising Iran, Turkmenistan, and Uzbekistan. There is no remarkable change in North Asia and the Tibetan plateau (Figure 8). Changes in TR for the extra-tropical regions in Central Asia are important since night-time temperatures are presently way below the threshold. The increase is projected to be more assertive in HadGEM2-ES results under RCP8.5. At least 80 days of increase in TR in southern Central Asia indicates that almost all summer nights will have a temperature greater than 20 °C. With a severe increase in TXx, heat stress in summer will be seen over the abovementioned regions under the worst-case scenarios.
According to the results, CSDI and WSDI are expected to decrease and increase, respectively, in both scenarios (Figure 9 and Figure 10). These results are coherent with the rise in temperature for 2071–2100. A decrease in CSDI is projected to have a similar pattern, where the most remarkable change is with reductions of about 9 days over Turkmenistan and Uzbekistan under RCP8.5. Both models and scenarios show 4 days of decrease in CSDI over Mongolia and the central part of China. The MPI-ESM-MR model-driven results project a higher reduction in CSDI over Siberia under RCP8.5 than HadGEM2-ES-driven results. The increase in WSDI is expected to be more than 40 days, according to the RCP4.5 scenario results, over all parts of the domain. Under RCP8.5, an increase in WSDI is more prominent with up to 120 days over the northern part of the domain, whereas an increase is around 250 days over the southern part of the domain regarding the results of the HadGEM2-ES. It indicates that a large number of the days of the year are expected to have maximum temperature values larger than the 90th percentile of the period 1971–2000 (Figure 10d).
Results of percentile-based climate indices are presented in exceedance percentages instead of changes compared to the base period (Figure 11 and Figure 12). These indices are computed as exceedance rates (units: %) relative to 1971–2000, during which their mean value is about 10%. The annual frequency of cold nights (TN10p) is projected to decrease over all parts of the domain, and is consistent in all models and scenarios (Figure 11). HadGEM2-ES model results under RCP8.5 show the most substantial decrease in cold nights by between 1 and 0%, indicating that no cold nights will be observed anymore in Central Asia as defined for the base period (Figure 10d). RCP4.5 simulation of RCM forced by MPI-ESM-MR shows a decrease from 10% to between 4% and 3% for the central part of the domain and between 1.5% and 0.5% for the northern part of the domain (Figure 11a).
For warm nights (TN90p), at least 30% of nights are estimated to have a daily minimum temperature greater than the 90th percentile of the base period over all parts of the region (Figure 12). HadGEM2-ES driven model results under RCP8.5 show a 50% to 90% rise expected in the entire region for the end of the century from 10% in 1971–2000. More than 90% of the nights for the southern part of the domain will have a night-time temperature above the 90th percentile of the reference period. The northern latitudes are also affected by the increase in warm nights from 10% to more than 40% for both models under RCP8.5 (Figure 12b,d).
3.3. Precipitation Indices
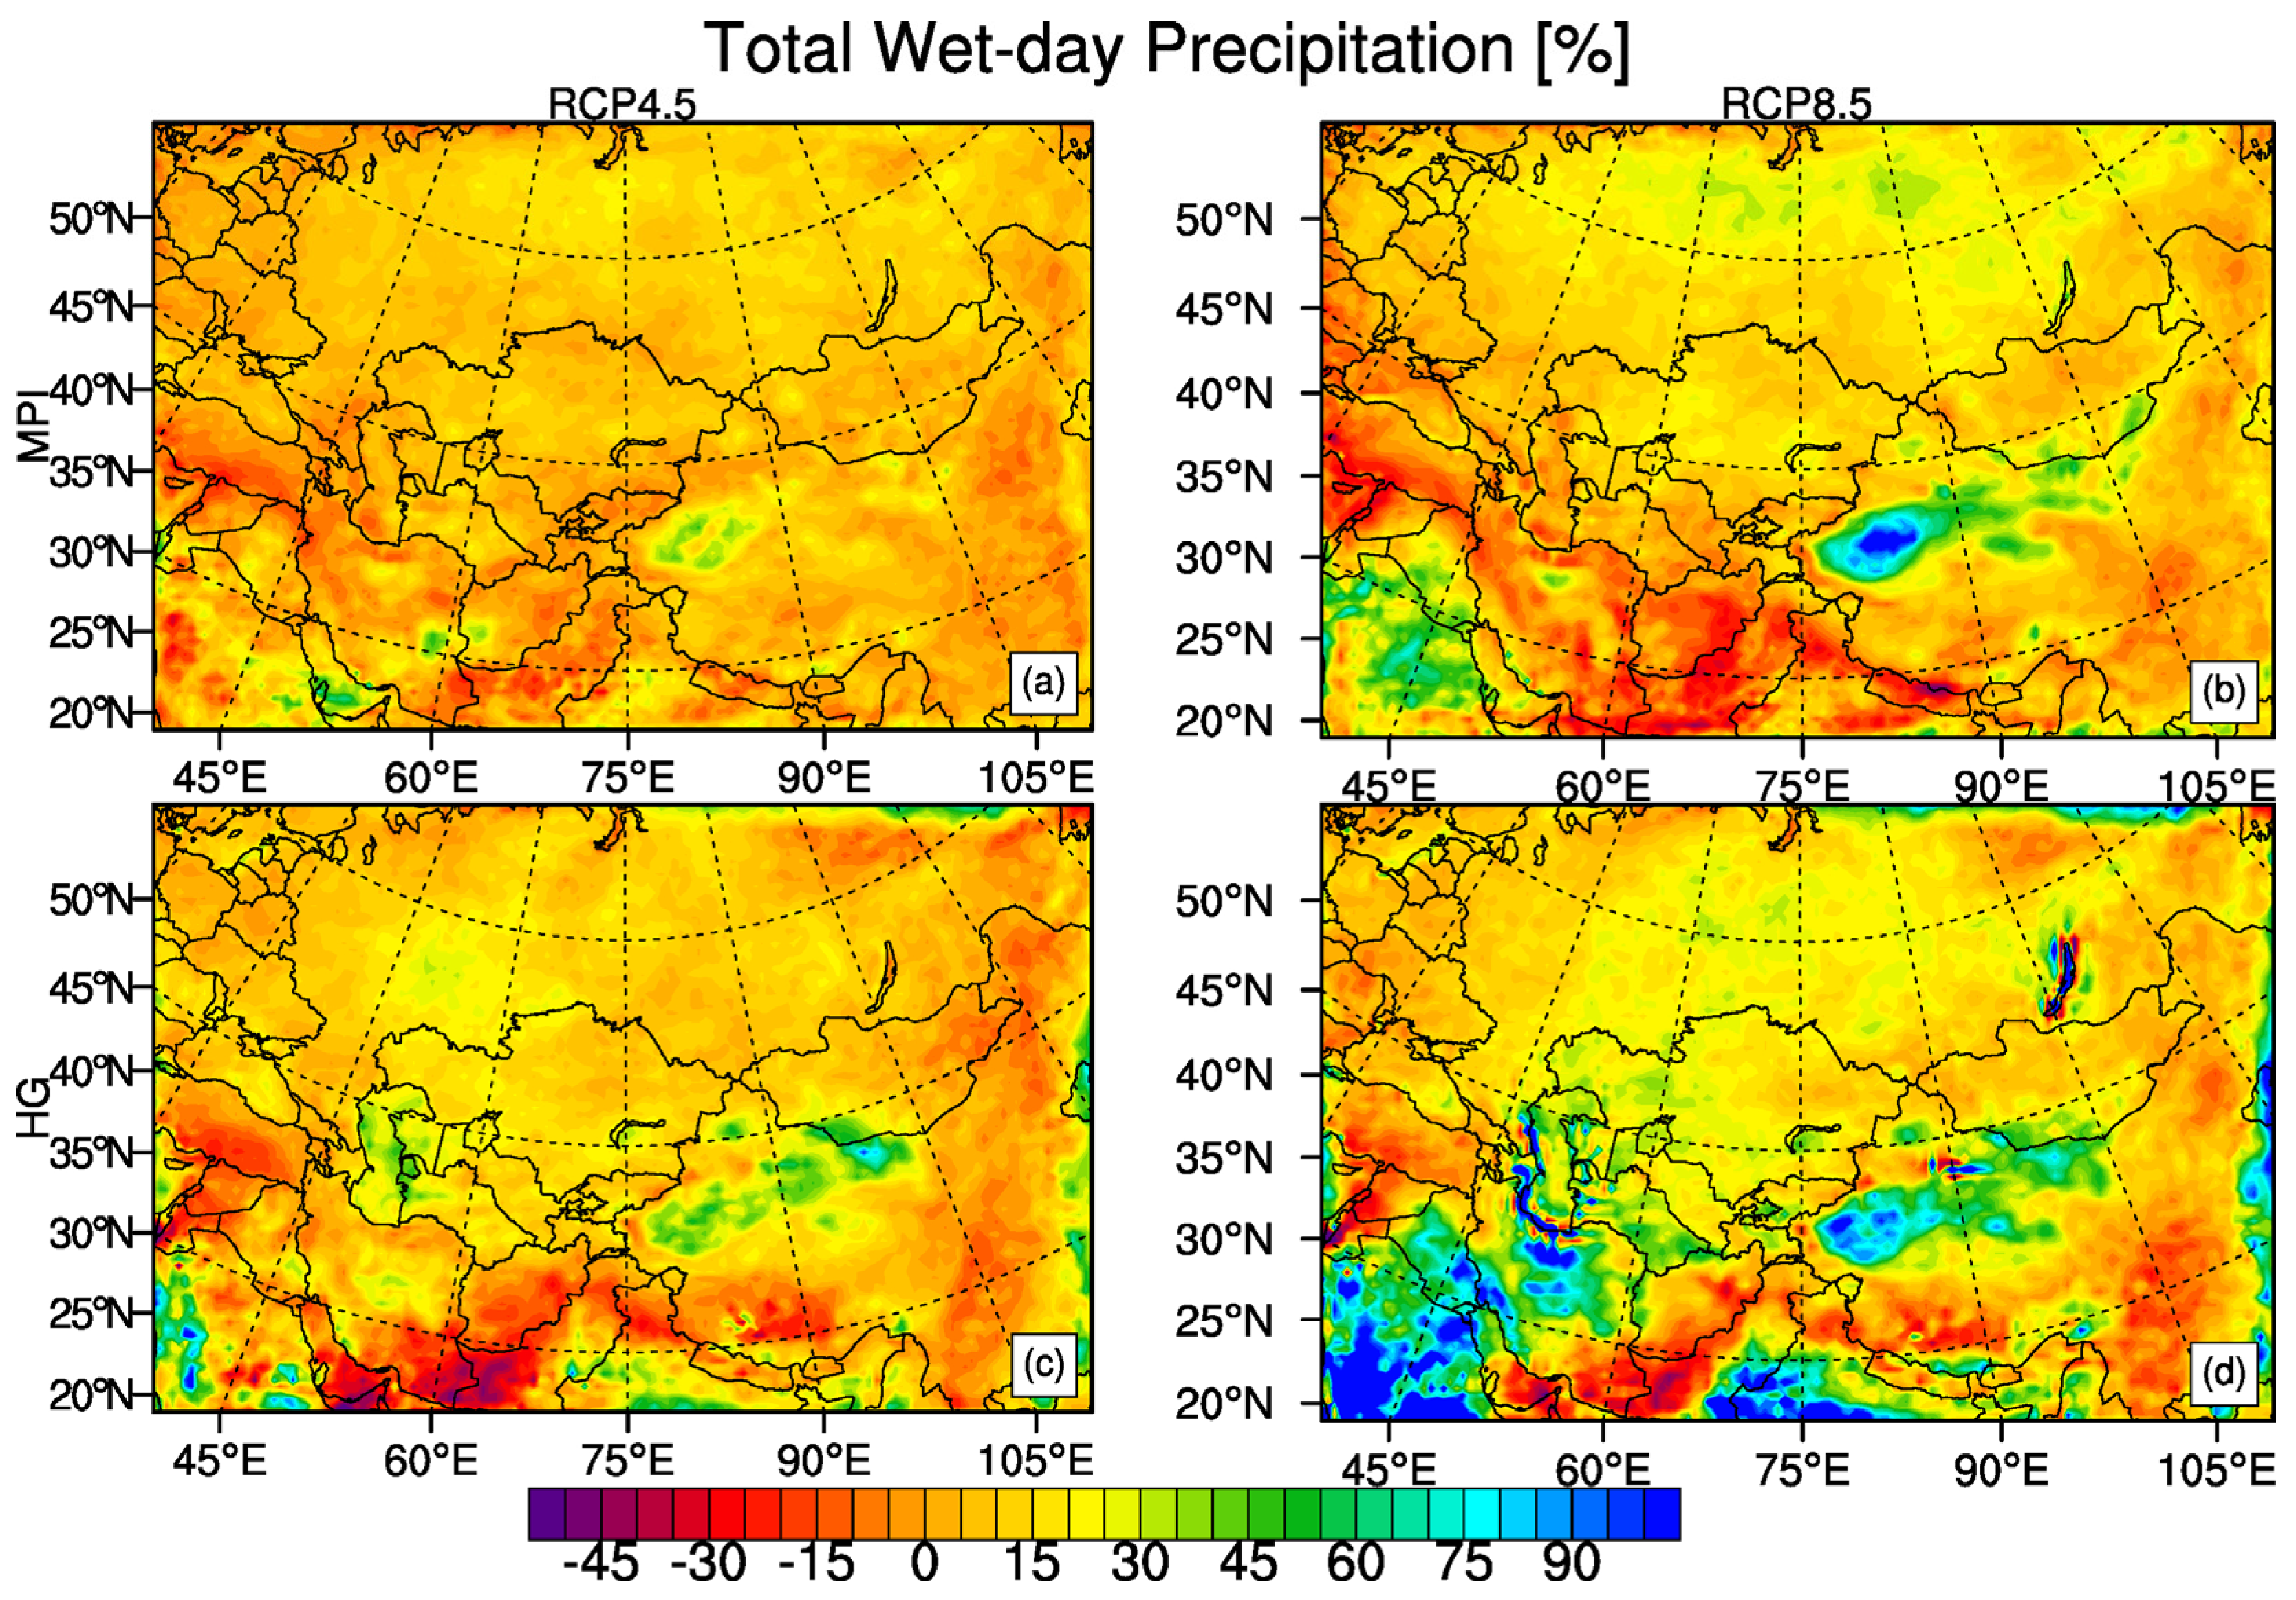
Figure 13 represents the change in PRCPTOT for 2071–2100 relative to 1971–2000 as a percentage. A reduction and a slight increase in total precipitation is anticipated for almost all parts of the domain for both model projections under both scenarios except for high topographical regions and high latitudes. Under the RCP4.5 scenario, a 30% decrease is expected for southern Turkey, Afghanistan, and the southern part of Iran, according to both model results (Figure 13a,c). On the other hand, under RCP8.5, more than a 60% rise in precipitation is anticipated over the Tibetan plateau for both models (Figure 13b,d). The HadGEM2-ES model results display a substantial increase of around 70% over the Arabian Peninsula. High increase results are probably due to strengthening the change signal, as the percentage values are calculated. The beforementioned regions already have a low precipitation amount, as seen in the spatial maps of present conditions (Figure 3b,c). There is a disagreement in model results over the Iranian Plateau as HadGEM2-ES model projects increase, whereas the MPI-ESM-MR model simulates reductions in precipitation. Along with these, severe values from HadGEM2-ES might be because of the high climate sensitivity of the model. High-latitude regions such as Siberia are anticipated to receive more precipitation in the future relative to the base period for both models under RCP8.5 (Figure 13d).
The temporal evolution of the projected change in spatially averaged PRCPTOT compared to the reference period for model results is given in Figure 14. The changes are shown as the 5-year running means. HadGEM2-ES-driven results under RCP8.5 projected different results to other model results, especially at the end of the century, seen in the spatial distribution of the changes (Figure 13d). It is anticipated that a higher than 25% spatial average increase in precipitation totals from around 2080 for HadGEM2-ES-driven results under RCP8.5. Other model and scenario results project similar changes in PRCPTOT, not higher than a 15% increase for the region. By 2076, around a 15% increase is also projected in HadGEM2-ES-driven results under RCP8.5.
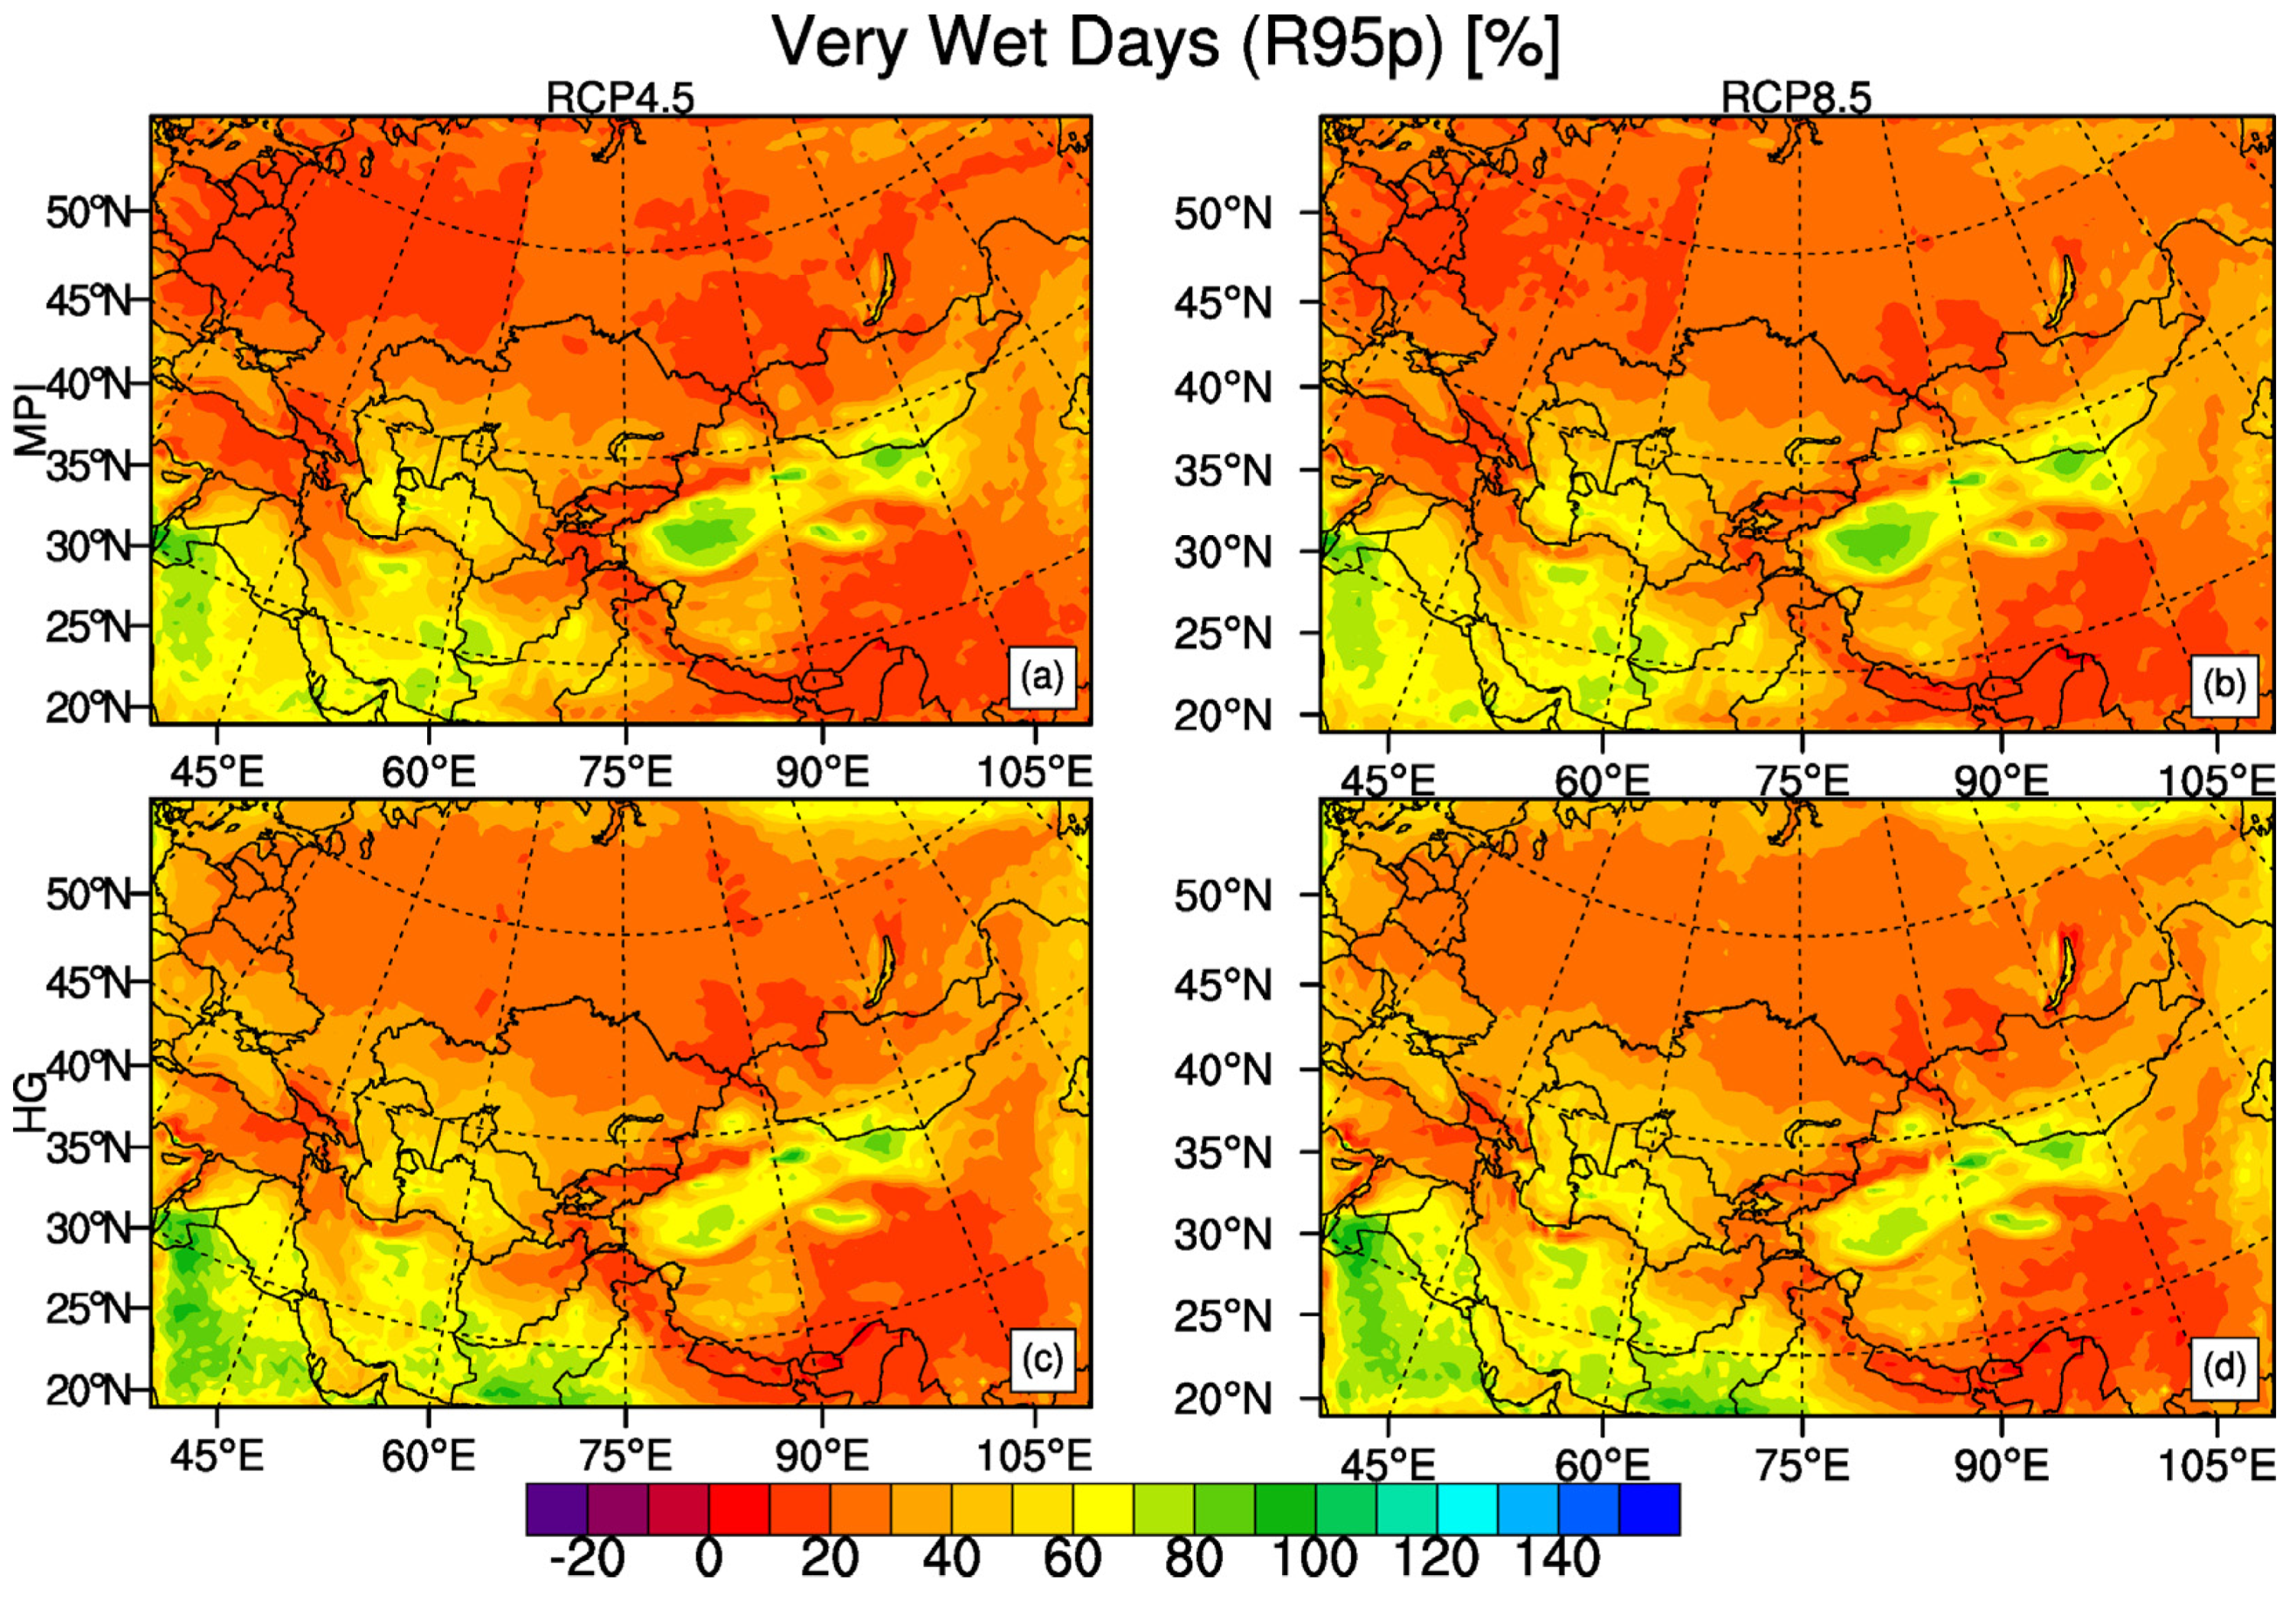
The change in the percentile-based precipitation index R95p is represented in Figure 15. According to all four projection results, R95p is expected to increase slightly by 20% over the whole domain, except for an 80% increase over high topographical regions. The projected high increase over the Arabian Peninsula is consistent with the rise in PRCPTOT. Due to the low values, even minor changes in precipitation result in high percentage numbers.
Projected changes in CDD and R10mm are represented in Figure 16 and Figure 17, respectively. As expected, changes in PRCPTOT overlap with changes in CDD. Reductions in CDD are simulated over Northeast Asia, Tibetan Plateau, and high latitudes, consistent with high increases in R10mm for these regions. Those are the regions that are simulated to be wetter in future periods. An increase in CDD is projected over Turkey, where heavy precipitation days are projected to decrease for both models and scenarios. HadGEM2-ES model results show a substantial decrease in CDD over Turkmenistan and Uzbekistan under RCP8.5. In contrast, the MPI-ESM-MR model projection shows a moderate reduction over the same regions (Figure 16b,d).
4. Discussion and Conclusions
In this work, the investigation of change in extreme climate indices developed by ETCCDI was studied using RegCM4.3.5 model results driven by two GCMs over Central Asia under RCP4.5 and RCP8.5. HadGEM2-ES and MPI-ESM-MR global models were chosen to downscale RegCM4.3.5 due to the fact that they have high (HadGEM2-ES) and medium (MPI-ESM-MR) equilibrium climate sensitivity within the CMIP5 ensemble; and on the other hand their performance over most CORDEX-CORE (Coordinated Regional Climate Downscaling Experiment–Coordinated Output for Regional Evaluation) domains is reasonably good [32,33,34]. The results of TXx, TNn, and PRCPTOT were compared with the observed conditions calculated from HadEX3 datasets. The spatial changes in the indices were calculated for 2071–2100 relative to 1971–2000. The temporal evolution of the indices concerning the reference period was also investigated throughout the century. Model results reproduced the spatial pattern of the observed conditions, whereas they gave underestimated temperature and overestimated precipitation totals over the Himalayas and Tibetan Plateau. Projected change results show that HadGEM2-ES model-driven RegCM output has a more substantial temperature increase than the MPI-ESM-MR [12]. Future changes represented in this study align with the studies by [16,18], even though the analyses could be more comparable due to different time domains.
Results indicate a general intensification of extreme climate conditions with increasing radiative forcing. The RCP8.5 scenario outputs for both model results give more severe changes compared to RCP4.5 scenario outputs, especially for the temperature-based indices. The increase in precipitation extremes and more substantial warming of TNn is anticipated, particularly in northern latitudes. A high rise in temperature over northern latitudes might be related to snow cover retreats [35,36,37]. Indices calculated from the minimum temperature, such as cold nights, warm nights, tropical nights, and frost days, show warmer temperature results throughout the region. RCP8.5 scenario results show that the percentage of warm nights is anticipated to change remarkably, up to at least 50%, with a value of 90% over the southern part of the domain, meaning that most of the nights in that period will exceed the 90th percentile of the based period [32]. WSDI is also anticipated to increase by 120 days over northern latitudes and at least 200 days over the southern part of the region. This indicates that warm spells are expected to be observed for at least half of the year. A decrease is simulated in CSDI, FD, and the surpassed rate of cold nights.
Annual total precipitation is anticipated to decrease or slightly increase, except for high topographical regions and latitudes. The Tibetan plateau is expected to increase precipitation by up to 60%. Extreme rainfall is also anticipated to increase over high topographical regions, whereas a slight increase is expected on very wet days over the other parts of the domain. CDD is anticipated to decrease over high latitudes and topographical regions, consistent with the increase in PRCPTOT. Under RCP8.5, CDD is projected to rise over Turkey, while heavy precipitation days are simulated to decrease. On the contrary, Turkmenistan and Uzbekistan are projected to experience a substantial decrease in CDD, according to HadGEM2-ES-driven model results.
Funding
This research received no external funding.
Institutional Review Board Statement
Not applicable.
Informed Consent Statement
Not applicable.
Data Availability Statement
CORDEX dataset for Central Asia-Region 8 analysed in this work can be reached at the ESGF website (https://esgf-data.dkrz.de/projects/cordex-dkrz/, accessed on 25 March 2023).
Acknowledgments
The author thanks Levent Kurnaz for providing his laboratory to run the regional climate model. The author also thanks Abdullah Akbaş for his help in plotting the geographical map.
Conflicts of Interest
The author declares no conflict of interest.
References
- Türkeş, M. Climatology and Meteorology, 1st ed.; Kriter Publisher: İstanbul, Turkey, 2010. [Google Scholar]
- Gutiérrez, J.M.; Jones, R.G.; Narisma, G.T.; Alves, L.M.; Amjad, M.; Gorodetskaya, I.V.; Grose, M.; Klutse, N.A.B.; Krakovska, S.; Li, J.; et al. Atlas. In Climate Change 2021: The Physical Science Basis. Contribution of Working Group I to the Sixth Assessment Report of the Intergovernmental Panel on Climate Change; Masson-Delmotte, V., Zhai, P., Pirani, A., Connors, S.L., Péan, C., Berger, S., Caud, N., Chen, Y., Goldfarb, L., Gomis, M.I., et al., Eds.; Cambridge University Press: Cambridge, UK; New York, NY, USA, 2021; pp. 1927–2058. [Google Scholar]
- Chen, F.; Wang, J.; Jin, L.; Zhang, Q.; Li, J.; Chen, J. Rapid warming in mid-latitude central Asia for the past 100 years. Front. Earth Sci. China. 2009, 3, 42–50. [Google Scholar] [CrossRef]
- Hu, Z.; Zhang, C.; Hu, Q.; Tian, H. Temperature changes in Central Asia from 1979 to 2011 based on multiple datasets. J. Clim. 2014, 27, 1143–1167. [Google Scholar] [CrossRef]
- Haag, I.; Jones, P.D.; Samimi, C. Central Asia’s changing climate: How temperature and precipitation have changed across time, space, and altitude. Climate 2019, 7, 123. [Google Scholar] [CrossRef]
- Hu, Z.; Zhou, Q.; Chen, X.; Qian, C.; Wang, S.; Li, J. Variations and changes of annual precipitation in Central Asia over the last century. Int. J. Climatol. 2017, 37, 157–170. [Google Scholar]
- Song, S.; Bai, J. Increasing Winter Precipitation over Arid Central Asia under Global Warming. Atmosphere. 2016, 7, 139. [Google Scholar] [CrossRef]
- Deng, H.; Chen, Y. Influences of recent climate change and human activities on water storage variations in Central Asia. J. Hydrol. 2017, 544, 46–57. [Google Scholar] [CrossRef]
- Zhang, M.; Chen, Y.; Shen, Y.; Li, Y. Changes of precipitation extremes in arid Central Asia. Quatern. Int. 2017, 436, 16–27. [Google Scholar] [CrossRef]
- Zhang, M.; Chen, Y.; Shen, Y.; Li, B. Tracking climate change in Central Asia through temperature and precipitation extremes. J. Geogr. Sci. 2019, 29, 3–28. [Google Scholar]
- Ozturk, T.; Altinsoy, H.; Türkeș, M.; Kurnaz, M.L. Simulation of temperature and precipitation climatology for the Central Asia CORDEX domain using RegCM 4.0. Clim. Res. 2012, 52, 63–76. [Google Scholar] [CrossRef]
- Ozturk, T.; Turp, M.T.; Türkeş, M.; Kurnaz, M.L. Projected changes in temperature and precipitation climatology of Central Asia CORDEX Region 8 by using RegCM4.3.5. Atmos. Res. 2017, 183, 296–307. [Google Scholar] [CrossRef]
- Mannig, B.; Müller, M.; Starke, E.; Merkenschlager, C.; Mao, W.; Zhi, X.; Podzun, R.; Jacob, D.; Paeth, H. Dynamical downscaling of climate change in Central Asia. Glob. Planet. Change 2013, 110, 26–39. [Google Scholar] [CrossRef]
- Huang, A.; Zhou, Y.; Zhang, Y.; Huang, D.; Zhao, Y.; Wu, H. Changes of the annual precipitation over Central Asia in the twenty-first century projected by multimodels of CMIP5. J. Clim. 2014, 27, 6627–6646. [Google Scholar] [CrossRef]
- Yang, J.; Fang, G.; Chen, Y.; De-Maeyer, P. Climate change in the Tianshan and northern Kunlun Mountains based on GCM simulation ensemble with Bayesian model averaging. J. Arid. Land. 2017, 9, 622–634. [Google Scholar]
- Liu, Y.; Geng, X.; Hao, Z.; Zheng, J. Changes in climate extremes in Central Asia under 1.5 and 2 °C global warming and their impacts on agricultural productions. Atmosphere. 2020, 11, 1076. [Google Scholar] [CrossRef]
- Luo, M.; Liu, T.; Meng, F.; Duan, Y.; Bao, A.; Frankl, A.; De Maeyer, P. Spatiotemporal characteristics of future changes in precipitation and temperature in Central Asia. Int. J. Climatol. 2019, 39, 1571–1588. [Google Scholar] [CrossRef]
- Zhu, X.; Wei, Z.; Dong, W.; Ji, Z.; Wen, X.; Zheng, Z.; Yan, D.; Chen, D. Dynamical downscaling simulation and projection for mean and extreme temperature and precipitation over central Asia. Clim. Dyn. 2020, 54, 3279–3306. [Google Scholar]
- Guo, H.; Bao, A.; Chen, T.; Zheng, G.; Wang, Y.; Jiang, L.; De Maeyer, P. Assessment of CMIP6 in simulating precipitation over arid Central Asia. Atmos. Res. 2021, 252, 105451. [Google Scholar] [CrossRef]
- Qiu, Y.; Feng, J.; Yan, Z.; Wang, J.; Li, Z. High-resolution dynamical downscaling for regional climate projection in Central Asia based on bias-corrected multiple GCMs. Clim. Dyn. 2022, 58, 777–791. [Google Scholar] [CrossRef]
- Reyer, C.P.O.; Otto, I.M.; Adams, S.; Albrecht, T.; Baarsch, F.; Cartsburg, M.; Coumou, D.; Eden, A.; Ludi, E.; Marcus, R.; et al. Climate change impacts in Central Asia and their implications for development. Reg. Environ. Change 2017, 17, 1639–1650. [Google Scholar]
- Zhang, J.; Wang, F. Future changes in extreme precipitation in Central Asia with 1.5–4 °C global warming based on CMIP6 simulations. Int. J. Climatol. 2022, 42, 8509–8525. [Google Scholar] [CrossRef]
- Wang, C.; Li, Z.; Chen, Y.; Li, Y.; Liu, X.; Hou, Y.; Wang, X.; Kulaixi, Z.; Sun, F. Increased compound droughts and heatwaves in a double pack in Central Asia. Remote Sens. 2022, 14, 2959. [Google Scholar] [CrossRef]
- Giorgi, F.; Coppola, E.; Solmon, F.; Mariotti, L.; Sylla, M.B.; Bi, X.; Elguindi, N.; Diro, G.T.; Nair, V.; Giuliani, G.; et al. RegCM4: Model Description and Preliminary Tests over Multiple CORDEX Domains. Clim. Res. 2012, 52, 7–29. [Google Scholar] [CrossRef]
- Alexander, L.V.; Zhang, X.; Peterson, T.C.; Caesar, J.; Gleason, B.; Tank, A.M.G.K.; Haylock, M.; Collins, D.; Trewin, B.; Rahimzadeh, F.; et al. Global observed changes in daily climate extremes of temperature and precipitation. J. Geophys. Res. 2006, 111, D05109. [Google Scholar] [CrossRef]
- Klein Tank, A.M.G.; Zwiers, F.W.; Zhang, X. Guidelines on analysis of extremes in a changing climate in support of informed decisions for adaptation. In Climate Data and Monitoring WCDMP-No. 72, WMO-TD No. 1500; World Meteorological Organization: Geneva, Switzerland, 2009; p. 56. [Google Scholar]
- Zhang, X.; Alexander, L.; Hegerl, G.C.; Jones, P.; Tank, A.K.; Peterson, T.C.; Trewin, B.; Zwiers, F.W. Indices for monitoring changes in extremes based on daily temperature and precipitation data. Wiley Interdiscip. Rev. Clim. Change 2011, 2, 851–870. [Google Scholar] [CrossRef]
- Dunn, R.J.; Alexander, L.V.; Donat, M.G.; Zhang, X.; Bador, M.; Herold, N.; Lippmann, T.; Allan, R.; Aguilar, E.; Barry, A.A.; et al. Development of an updated global land in situ-based dataset of temperature and precipitation extremes: HadEX3. J. Geophys. Res. Atmos. 2020, 125, e2019JD032263. [Google Scholar] [CrossRef]
- Tebaldi, C.; Hayhoe, K.; Arblaster, J.; Meehl, G. Going to the extremes: An intercomparison of model simulated historical and future changes in extreme events. Clim. Change 2006, 79, 185–211. [Google Scholar] [CrossRef]
- Patz, J.A.; Campbell-Lendrum, D.; Holloway, T.; Foley, J.A. Impact of regional climate change on human health. Nat. Rev. 2005, 438, 310–317. [Google Scholar] [CrossRef] [PubMed]
- Terando, A.; Keller, K.; Easterling, W.E. Probabilistic projections of agro-climate indices in North America. J. Geophys. Res. 2012, 117, D11116. [Google Scholar] [CrossRef]
- Elguindi, N.; Giorgi, F.; Turuncoglu, U.U. Assessment of CMIP5 global model simulations over the subset of CORDEX domains used in the Phase I CREMA. Clim. Change 2014, 125, 7–21. [Google Scholar] [CrossRef]
- McSweeney, C.F.; Jones, R.G.; Lee, R.W.; Rowell, D.P. Selecting CMIP5 GCMs for downscaling over multiple regions. Clim. Dyn. 2015, 44, 3237–3260. [Google Scholar] [CrossRef]
- Giorgi, F.; Coppola, E.; Jacob, D.; Teichmann, C.; Abba Omar, S.; Ashfaq, M.; Weber, T. The CORDEX-CORE EXP-I initiative: Description and highlight results from the initial analysis. Bull. Am. Meteorol. Soc. 2021, 1–52. [Google Scholar] [CrossRef]
- Sillmann, J.; Kharin, V.; Zwiers, F.; Zhang, X.; Bronaugh, D. Climate extremes indices in the CMIP5 multimodel ensemble: Part 2. Future climate projections. J. Geophys. Res. Atmos. 2013, 118, 2473–2493. [Google Scholar] [CrossRef]
- Screen, J.A.; Simmonds, I. Increasing fall-winter energy loss from the Arctic Ocean and its role in Arctic temperature amplification. Geophys. Res. Lett. 2010, 37, L16707. [Google Scholar] [CrossRef]
- Flanner, M.G.; Shell, K.M.; Barlage, M.; Perovich, D.K.; Tschudi, M.A. Radiative forcing and albedo feedback from the Northern Hemisphere cryosphere between 1979 and 2008. Nat. Geosci. 2011, 4, 151–155. [Google Scholar] [CrossRef]
Figure 1.
General physical/relief map of Central Asia CORDEX Region 8.

Figure 2.
The TXx (the first column) and TNn (the second column) indices were calculated for 1971–2000 (units: °C). The first row shows HadEX3 indices (a,b), and the second row shows results obtained from RegCM forced by HadGEM2-ES (c,d), the third row shows results obtained from RegCM forced by MPI-ESM-MR (e,f).

Figure 3.
The PRCPTOT index was calculated from 1971 to 2000 (units: mm/year). The first row shows HadEX3 indices (a), the second row shows results obtained from RegCM forced by HadGEM2-ES (b), and the third row shows results obtained from RegCM forced by MPI-ESM-MR (c).
Figure 3.
The PRCPTOT index was calculated from 1971 to 2000 (units: mm/year). The first row shows HadEX3 indices (a), the second row shows results obtained from RegCM forced by HadGEM2-ES (b), and the third row shows results obtained from RegCM forced by MPI-ESM-MR (c).

Figure 4.
The changes in TNn and TXx for 2071–2100 (units: °C) compared to 1971–2000. The first row shows results obtained from RCM forced by MPI-ESM-MR under RCP4.5 (a,b) (MPI4.5), and the second row shows results obtained from RCM forced by HadGEM2-ES under RCP4.5 (c,d) (HG4.5), the third and the fourth rows show MPI8.5 (e,f) and HG8.5 (g,h), respectively.

Figure 5.
Temporal evolution of the change in TXx projected by RegCM4.3.5 driven by MPI-ESM-MR under RCP4.5 (light blue line) and RCP8.5 (purple line), and HadGEM2-ES under RCP4.5 (light green line) and RCP8.5 (red line) throughout the century given in deg C compared to the reference period projected by RegCM4.3.5 driven by MPI-ESM-MR (dark blue line) and HadGEM2-ES (orange line).

Figure 6.
Temporal evolution of the change in TNn projected by RegCM4.3.5 driven by MPI-ESM-MR under RCP4.5 (light blue line) and RCP8.5 (purple line), and HadGEM2-ES under RCP4.5 (light green line) and RCP8.5 (red line) throughout the century given in degrees C compared to the reference period projected by RegCM4.3.5 driven by MPI-ESM-MR (dark blue line) and HadGEM2-ES (orange line).

Figure 7.
The changes in FD for 2071–2100 (units: days) compared to 1971–2000. The first and second columns show results under RCP4.5 (a,c) and 8.5 (b,d), respectively. The first and second rows show the results of the MPI-ESM-MR (a,b) and HadGEM2-ES (c,d).
Figure 7.
The changes in FD for 2071–2100 (units: days) compared to 1971–2000. The first and second columns show results under RCP4.5 (a,c) and 8.5 (b,d), respectively. The first and second rows show the results of the MPI-ESM-MR (a,b) and HadGEM2-ES (c,d).

Figure 8.
The changes in TR for 2071–2100 (units: days) compared to 1971–2000. The first and second columns show results under RCP4.5 (a,c) and 8.5 (b,d), respectively. The first and second rows show the results of the MPI-ESM-MR (a,b) and HadGEM2-ES (c,d).
Figure 8.
The changes in TR for 2071–2100 (units: days) compared to 1971–2000. The first and second columns show results under RCP4.5 (a,c) and 8.5 (b,d), respectively. The first and second rows show the results of the MPI-ESM-MR (a,b) and HadGEM2-ES (c,d).

Figure 9.
The changes in CSDI for 2071–2100 (units: days) compared to 1971–2000. The first and second columns show results under RCP4.5 (a,c) and 8.5 (b,d), respectively. The first and second rows show results for MPI-ESM-MR (a,b) and HadGEM2-ES (c,d), respectively.
Figure 9.
The changes in CSDI for 2071–2100 (units: days) compared to 1971–2000. The first and second columns show results under RCP4.5 (a,c) and 8.5 (b,d), respectively. The first and second rows show results for MPI-ESM-MR (a,b) and HadGEM2-ES (c,d), respectively.

Figure 10.
The changes in WSDI for 2071–2100 (units: days) compared to 1971–2000. The first and second columns show results under RCP4.5 (a,c) and 8.5 (b,d), respectively. The first and second rows show results for MPI-ESM-MR (a,b) and HadGEM2-ES (c,d), respectively.
Figure 10.
The changes in WSDI for 2071–2100 (units: days) compared to 1971–2000. The first and second columns show results under RCP4.5 (a,c) and 8.5 (b,d), respectively. The first and second rows show results for MPI-ESM-MR (a,b) and HadGEM2-ES (c,d), respectively.

Figure 11.
The frequency of TN10p for 2071–2100 (units: %). The first and second columns show results under RCP4.5 (a,c) and 8.5 (b,d), respectively. The first and second rows show results for MPI-ESM-MR (a,b) and HadGEM2-ES (c,d), respectively.
Figure 11.
The frequency of TN10p for 2071–2100 (units: %). The first and second columns show results under RCP4.5 (a,c) and 8.5 (b,d), respectively. The first and second rows show results for MPI-ESM-MR (a,b) and HadGEM2-ES (c,d), respectively.

Figure 12.
The frequency of TN90p for 2071–2100 (units: %). The first and second columns show results under RCP4.5 (a,c) and 8.5 (b,d), respectively. The first and second rows show results for MPI-ESM-MR (a,b) and HadGEM2-ES (c,d), respectively.
Figure 12.
The frequency of TN90p for 2071–2100 (units: %). The first and second columns show results under RCP4.5 (a,c) and 8.5 (b,d), respectively. The first and second rows show results for MPI-ESM-MR (a,b) and HadGEM2-ES (c,d), respectively.

Figure 13.
The changes in PRCPTOT (units: %) for 2071–2100 compared to 1971–2000. The first and second columns show results under RCP4.5 (a,c) and 8.5 (b,d), respectively. The first and second rows show results for MPI-ESM-MR (a,b) and HadGEM2-ES (c,d), respectively.
Figure 13.
The changes in PRCPTOT (units: %) for 2071–2100 compared to 1971–2000. The first and second columns show results under RCP4.5 (a,c) and 8.5 (b,d), respectively. The first and second rows show results for MPI-ESM-MR (a,b) and HadGEM2-ES (c,d), respectively.

Figure 14.
Temporal evolution of the change in PRCPTOT by RegCM4.3.5 driven by MPI-ESM-MR under RCP4.5 (light blue line) and RCP8.5 (purple line), and HadGEM2-ES under RCP4.5 (light green line) and RCP8.5 (red line) throughout the century given in % compared to the reference period projected by RegCM4.3.5 driven by MPI-ESM-MR (dark blue line) and HadGEM2-ES (orange line).

Figure 15.
The changes in R95p for 2071–2100 (units: %) compared to 1971–2000. The first and second columns show results under RCP4.5 (a,c) and 8.5 (b,d), respectively. The first and second rows show results for MPI-ESM-MR (a,b) and HadGEM2-ES (c,d), respectively.
Figure 15.
The changes in R95p for 2071–2100 (units: %) compared to 1971–2000. The first and second columns show results under RCP4.5 (a,c) and 8.5 (b,d), respectively. The first and second rows show results for MPI-ESM-MR (a,b) and HadGEM2-ES (c,d), respectively.

Figure 16.
The changes in CDD (units: days) for 2071–2100 compared to 1971–2000. The first and second columns show results under RCP4.5 (a,c) and 8.5 (b,d), respectively. The first and second rows show results for MPI-ESM-MR (a,b) and HadGEM2-ES (c,d), respectively.
Figure 16.
The changes in CDD (units: days) for 2071–2100 compared to 1971–2000. The first and second columns show results under RCP4.5 (a,c) and 8.5 (b,d), respectively. The first and second rows show results for MPI-ESM-MR (a,b) and HadGEM2-ES (c,d), respectively.

Figure 17.
The changes in R10mm for 2071–2100 (units: days) compared to 1971–2000. The first and second columns show results under RCP4.5 (a,c) and 8.5 (b,d), respectively. The first and second rows show results for MPI-ESM-MR (a,b) and HadGEM2-ES (c,d), respectively.
Figure 17.
The changes in R10mm for 2071–2100 (units: days) compared to 1971–2000. The first and second columns show results under RCP4.5 (a,c) and 8.5 (b,d), respectively. The first and second rows show results for MPI-ESM-MR (a,b) and HadGEM2-ES (c,d), respectively.


Table 1.
Statistical comparison of the model results and HadEX3 dataset for TXx, TNn, and PRCPTOT indices weighted over the whole domain.
Table 1.
Statistical comparison of the model results and HadEX3 dataset for TXx, TNn, and PRCPTOT indices weighted over the whole domain.
| Index | HadGEM2-ES | MPI-ESM-MR | |
|---|---|---|---|
| TXx (°C) | Bias | −1.36 | −2.11 |
| RMSE | 5.38 | 5.46 | |
| Correlation | 0.66 | 0.80 | |
| TNn (°C) | Bias | −2.45 | −0.58 |
| RMSE | 7.37 | 7.43 | |
| Correlation | 0.90 | 0.87 | |
| PRCPTOT (mm/year) | Bias | 10.68 | 194.41 |
| RMSE | 356.60 | 511.51 | |
| Correlation | 0.54 | 0.60 |
Disclaimer/Publisher’s Note: The statements, opinions and data contained in all publications are solely those of the individual author(s) and contributor(s) and not of MDPI and/or the editor(s). MDPI and/or the editor(s) disclaim responsibility for any injury to people or property resulting from any ideas, methods, instructions or products referred to in the content. |
© 2023 by the author. Licensee MDPI, Basel, Switzerland. This article is an open access article distributed under the terms and conditions of the Creative Commons Attribution (CC BY) license (https://creativecommons.org/licenses/by/4.0/).
Share and Cite
MDPI and ACS Style
Ozturk, T. Projected Future Changes in Extreme Climate Indices over Central Asia Using RegCM4.3.5. Atmosphere 2023, 14, 939. https://doi.org/10.3390/atmos14060939
AMA Style
Ozturk T. Projected Future Changes in Extreme Climate Indices over Central Asia Using RegCM4.3.5. Atmosphere. 2023; 14(6):939. https://doi.org/10.3390/atmos14060939
Chicago/Turabian StyleOzturk, Tugba. 2023. "Projected Future Changes in Extreme Climate Indices over Central Asia Using RegCM4.3.5" Atmosphere 14, no. 6: 939. https://doi.org/10.3390/atmos14060939
Note that from the first issue of 2016, this journal uses article numbers instead of page numbers. See further details here.