Article

Characterization of Volatile Organic Compounds (VOCs) from Farms Effluents: Interest of HS-SPME-GC-MS Technique for Laboratory and Field Test

1
Laboratoire de Production Animale, Agro Innovation International, Centre Mondial de l’Innovation Roullier, 35400 Saint-Malo, France
2
Laboratoire de Physico-Chimie et Bioanalytique, Agro Innovation International, Centre Mondial de l’Innovation Roullier, 35400 Saint-Malo, France
*
Authors to whom correspondence should be addressed.
These authors contributed equally to this work.
Atmosphere 2023, 14(6), 928; https://doi.org/10.3390/atmos14060928
Submission received: 14 February 2023 / Revised: 12 May 2023 / Accepted: 22 May 2023 / Published: 25 May 2023
(This article belongs to the Special Issue Observations and Management of Livestock Production Emissions)

Abstract

:
Livestock is an important source of volatile organic compounds (VOCs) that can cause odor nuisance and pollution. The main sources of these VOCs in livestock are effluents and their management system. In this study, the applicability of headspace-solid phase microextraction coupled with gas chromatography-mass spectrometry (HS-SPME-GC-MS) for VOC characterization in effluent samples in both laboratory and field tests was evaluated. In the laboratory test, the VOC profile of different farm effluents (cattle dung, slurry and chicken droppings) was measured as well as the influence of the presence of litter material on their release. In the field test, a comparison was made between the VOC profile of two manure pits that had undergone treatment or not to assist in effluent management. The results presented here show that the HS-SPME-GC-MS technique allows one to quantify a wide spectrum of VOCs responsible for olfactory nuisances (177 and 73 VOCs in total for the laboratory and field tests, respectively) in a simple, fast, and economic way. This technique could be further developed to monitor olfactory nuisance markers and predict the evolution of different effluent materials.

1. Introduction

Agriculture challenges in livestock production are environmental (pollution, fine particles, global warming etc.) and socio-economic (olfactory nuisance, animal welfare, etc.) [1]. Livestock effluents are a source of many problematic emissions such as ammonia (NH3), hydrogen sulfide (H2S), and VOCs (volatile organic compounds), which contribute to olfactory nuisance. The intensification of animal numbers and increasing urbanization have resulted in considerable attention to odorous gases produced from animal waste. Effluent-released VOCs from liquid (slurry) or solids (dung or feces), generally mixed with bedding materials (manure), alter the air quality, and may also affect the health of animals and livestock [2]. Finally, VOCs are important precursors to the production of air pollutants [3,4]. The effluent production of these VOCs is influenced by various factors: the manure rearing and management system [5,6], the animal digestion system (monogastric or ruminant) [7], the bedding material [8], and environmental hygiene additives [9,10]. As shown in the literature, studies on livestock VOCs can be carried out in many different ways. Samples can be collected in the field with direct subsequent VOC analyses. In their 2021 review [11], Wang et al. described the different techniques used to collect, store, and analyze VOCs in livestock buildings [12,13]. Kammer et al. [14] used a PTR-Qi-TOF-MS (proton transfer reaction–quadrupole ion guide–time of flight–mass spectrometry) and a TD-GC-MS (thermal desorption-gas chromatography-mass spectrometry) to measure and directly compare the production of VOCs from two farms (cattle and sheep) by bringing analytical equipment into the field. The interest in conducting the analyses directly in the field allows one to be as close as possible to the phenomena producing the VOCs (effluent storage space, animal litter, complete livestock building etc.), which are not reproducible in the laboratory. However, these samplings and analyses are dependent on uncontrollable environmental factors such as air velocity, temperature, farmer activity, and permits the processing of only a small amount of sample for analysis. In addition, it is difficult to sort between sources of VOCs, for example, an air sample in the livestock building may be contaminated with VOCs from the manure pit next door. Contrary to direct in-field-analyses, it is also possible to collect the material responsible for the production of the VOCs (effluent, bedding, etc.) and perform subsequent analyses using different techniques in the laboratory. This makes it possible to process a large volume of the sample for a better representation. This type of sampling also makes it easier to differentiate the sources of VOCs. Effluent samples collected in the field can be kept at 4 °C or −20 °C until further analysis. The feasibility of such offline analyses and comparisons between a fresh or frozen sample have been described in different studies [15,16,17,18]. Offline laboratory analyses present the advantage of being more reproducible, less time consuming, and automatized, offering the possibility of analyzing a considerably higher number of samples. It also allows access to a comprehensive range of analytical equipment that are too large to be brought into the field.
Various analytical methods are available for the analysis of effluent VOCs, both in quantification and identification. In recent studies, the most common methods are TD (thermal desorption) or SPME (solid phase microextraction) coupled with GC-FID (gas chromatography-flame ionization detector), GC-MS (gas chromatography-mass spectrometry), and the association of olfactometry (GC-MS-O) [19]. PTR-MS (proton transfer reaction-mass spectrometry) [14,20,21] and MIMS (membrane inlet mass spectrometry) [22] are also used for continuous measurement in the field. The current study used headspace solid-phase microextraction (HS-SPME) for the extraction of VOCs from solid or liquid samples, coupled with subsequent detection by GC-MS. This method uses a solvent-free sample preparation technique in which a coated fused silica fiber is introduced into the headspace above the sample closed in a glass vial. VOC extraction by HS-SPME presents the advantage of being simple and economical [23]. The extraction does not require solvents and the SPME fiber is reusable. In addition, the extracted compounds on SPME fibers can be desorbed directly in the GC inlet, allowing for subsequent analysis. Coupled with GC-MS, such analysis could allow for the profiling of a wide range of untargeted VOCs with the simultaneous semi-quantification and identification of hundreds of compounds with a low limit of detection [23]. SPME-GC-MS has already been used to characterize VOCs from several effluent sources such as pig manure [18,24], horse manure [16], and cattle effluents [25], but also within the livestock building [26] with a preheating device using fiber directly in the environment. This technique was also used in monitoring the composting process for these effluents [27] and the analysis of methanized digests [28].
In this work, the main aim was to demonstrate the interest in the HS-SPME-GC-MS technique for the VOC profiling of both laboratory and field effluent samples. In the first study, the effluent samples (chicken droppings, cattle slurry, and cow dung) were analyzed alone and in a mixture with material that could be used as litter (e.g., crushed straw). The aim was to characterize, by the HS-SPME-GC-MS technique, the main VOCs produced in the headspace of the sample and the applicability of such a technique for the laboratory analysis of effluent mixtures. In the second study, a field analysis was carried out on bovine manure by comparing samples from two pits that had undergone treatment or not to assist in effluent management. The objective of these two studies was to demonstrate that HS-SPME-GC-MS analyses of samples taken on-farm or partially reconstructed in the laboratory allow for the characterization of the main VOCs and the monitoring of their evolution.

2. Materials and Methods

2.1. Cattle Dung and Slurry for Laboratory Assays

Cattle slurry was obtained from a dairy farm (Holstein breed, diet: maize silage, located in Hénanbihen, Ille-et-Villaine, France). Slurry was collected from the lagoon with a telescopic pole. One litter (three replicates mixed) of fresh slurry was collected in 1 L plastic containers, cooled to 4 °C, and immediately brought to the laboratory (dry matter = 3% w/w). Cattle dung was collected from another dairy farm (located in Pleudihen-sur-Rance Côte d’Armor, France) in a meadow with heifers (Holstein breed). To be representative, a dozen different fresh dung samples were collected by hand and immediately cooled to −20 °C (dry matter = 18.5% w/w) [29].

2.2. Poultry Droppings for Laboratory Assays

Poultry droppings were purchased in dehydrated form (GuanoGali®, Terralba, Montjoire, France). The wet form was reconstituted by rehydrating the dehydrated form with distilled water to obtain a dry matter of 18% w/w. [30,31]. The wet form was stored at 4 °C.

2.3. Wheat Straw and Litter for Laboratory Assays

The wheat straw was sourced from a farm and ground to less than 4 mm with a cutting mill (Retsch SM300) (dry matter = 8% w/w). To reconstitute a poultry breeding litter representative at the level of the composition, texture, and dry matter, manual mixing was performed in the laboratory with a ratio of 1 part of wheat straw and 5 parts of wet poultry feces. This ratio makes it possible to approach the physico-chemical characteristics of poultry litter as described in the literature [8] (dry matter of the blend: 16% w/w). The amount of excreta in the litter increases during a grow-out period and corresponds with changes in the physical and chemical properties of the litter over time [32,33,34].
For the cattle breeding litter, a blend was made with liquid manure and fresh dung; based on 1:1 liquid manure:dung ratio. This ratio was adapted from the 2:3 urine:feces ratio produced by dairy cows [35,36]. A manual mixing similar to poultry breeding litter was performed.

2.4. Field Test: Cattle Production Facility and Effluent Treatment

A cattle dairy farm located in the Côte d’Armor, Brittany, France was used in this study and was equipped with two separate pits (each approximately 60 m long by 15 m wide by 2.5 m deep) that had slatted floors on top. The cattle (Holstein breed) were fed with a diet of silage maize, soybean meal, plus vitamins and minerals. One pit served as the control (untreated), and the other pit was treated. Each pit had an inspection hatch to collect the manure. Both pits were shaken by paddle once a week on the same day (e.g., every Wednesday in this study), by the end of the morning during one hour. At the beginning of the assays (February 2021), the two pits were almost full (about 700 m3 each) with slurry. At the surface of both pits, a floating solid crust composed of diet, straw, and dried slurry could be observed. The treated pit was treated with 700 kg of Actipost 360® (Timac Agro, Saint Malo, France), an additive based on minerals and microorganisms that helps to treat livestock manure. Another 70 kg dose was added in early March. The samples were taken in mid-March, by the visiting traps by means of a telescopic pole at a depth of 70–90 cm. Six replicates were collected from each pit. Samples were kept at 4 °C in airtight containers until analysis.

2.5. Volatile Organic Compounds Analysis by HS-SPME-GC-MS

Headspace-solid phase microextraction (HS-SPME) was performed using a multipurpose robotic autosampler (MPS, Gerstel, Mülheim, Germany). Volatile organic compounds (VOCs) were extracted from the headspace of 2.5 g of effluents (feces, slurry or mixes with straw) confined in a 20 mL glass vial (Verex headspace Vial, Phenomenex, Torrance, CA, USA). Samples were agitated at 250 rpm and pre-heated at 40 °C for 5 min, then extracted with a divinylbenzene/carboxen/polydimethylsiloxane (DVB/CAR/PDMS) SPME fiber (50/30 µm, Supelco, Millipore Sigma, Saint-Quentin-Fallavier, France) for 30 min. The agitation and the heating were maintained during the SPME. Prior to extraction, the SPME fibers were conditioned at 270 °C for 1 h.
GC-MS analyses were performed using an Agilent 7890B gas chromatograph (GC) system coupled with a 7000D triple quadrupole mass spectrometer (MS) (Agilent, Santa Clara, CA, USA). After extraction, the SPME fiber was desorbed in the GC inlet at 220 °C for 1 min. VOC separation was carried out on a DB-624 Ultra Inert column (length 60 m, ID 0.25 mm, film thickness 1.4 µm, Agilent) at a flow rate of 1.5 mL/min with helium (Purity 99.9999%) as carrier gas. The GC oven was set at 35 °C for 5 min, then increased to 100 °C at a rate of 10 °C/min and held for 1.5 min, then increased to 220 °C at a rate of 15 °C/min and held for 3 min, and increased to 230 °C at the end at the same rate and held for 10 min (total run time 34.67 min). The MS acquisition was performed in electron impact ionization (EI) mode at +70 eV in full scan, with a MS scan range of 30–400 m/z. The source temperature was set at 230 °C. Blanks were analyzed at the beginning and at the end of the run to verify contaminations from the laboratory air and the analytical system. Blanks were also analyzed between different sample matrices to prevent VOC carry-over on the SPME fiber.

2.6. Post-Acquisition GC-MS Data Processing

After acquisition, the GC-MS spectral data were processed using an open-source software, MS-DIAL [37]. The MS peaks in each sample were detected, deconvolved, identified, and aligned. The identification of VOCs was performed using the NIST17 mass spectra library with a m/z tolerance of 0.5 Da and identification score cutoff of 80%; for peak alignment, the retention time (RT) tolerance was set at 0.075 min. Samples were analyzed in triplicate for laboratory samples and in six replicates for the field samples. The heatmap was generated based on the mean VOC peak area using an online software, Morpheus (https://software.broadinstitute.org/morpheus accessed on 21 April 2021). The volcano plot was generated on the log2 value of the ratio of the treated sample versus the control and −log10 value of the p-value of the two-tailed unpaired t-test using VolcaNoseR [38].

3. Results and Discussion

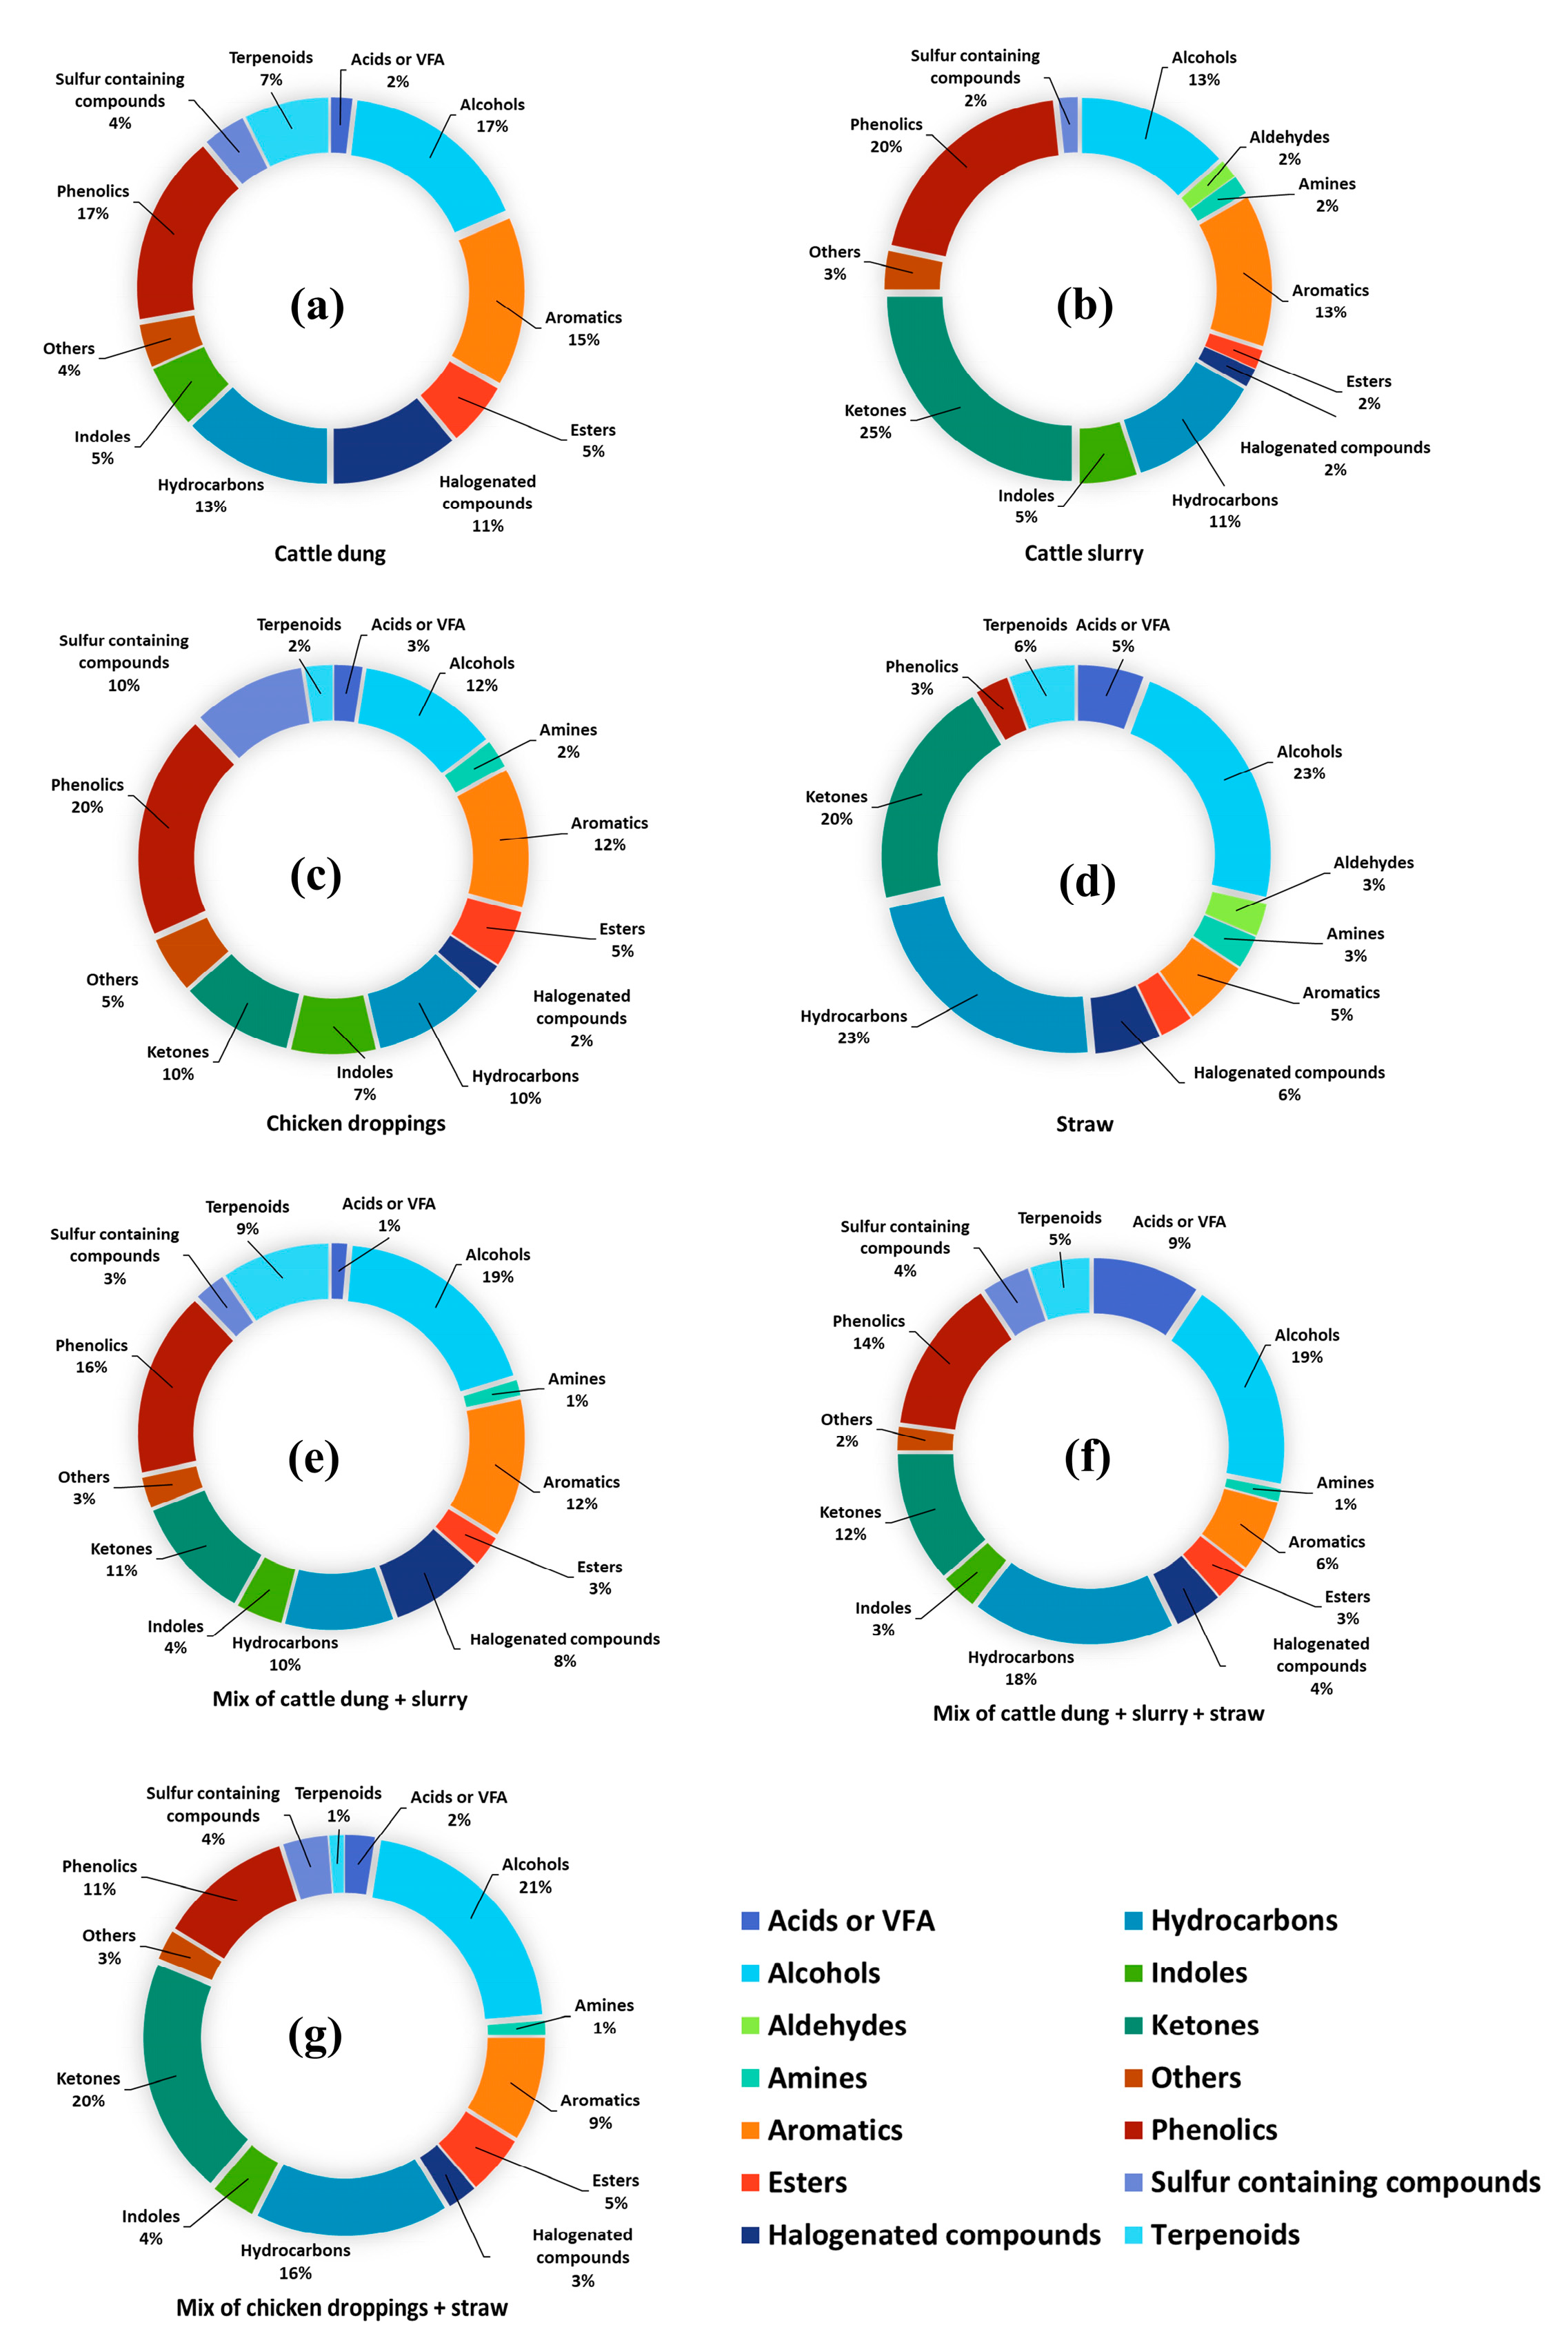
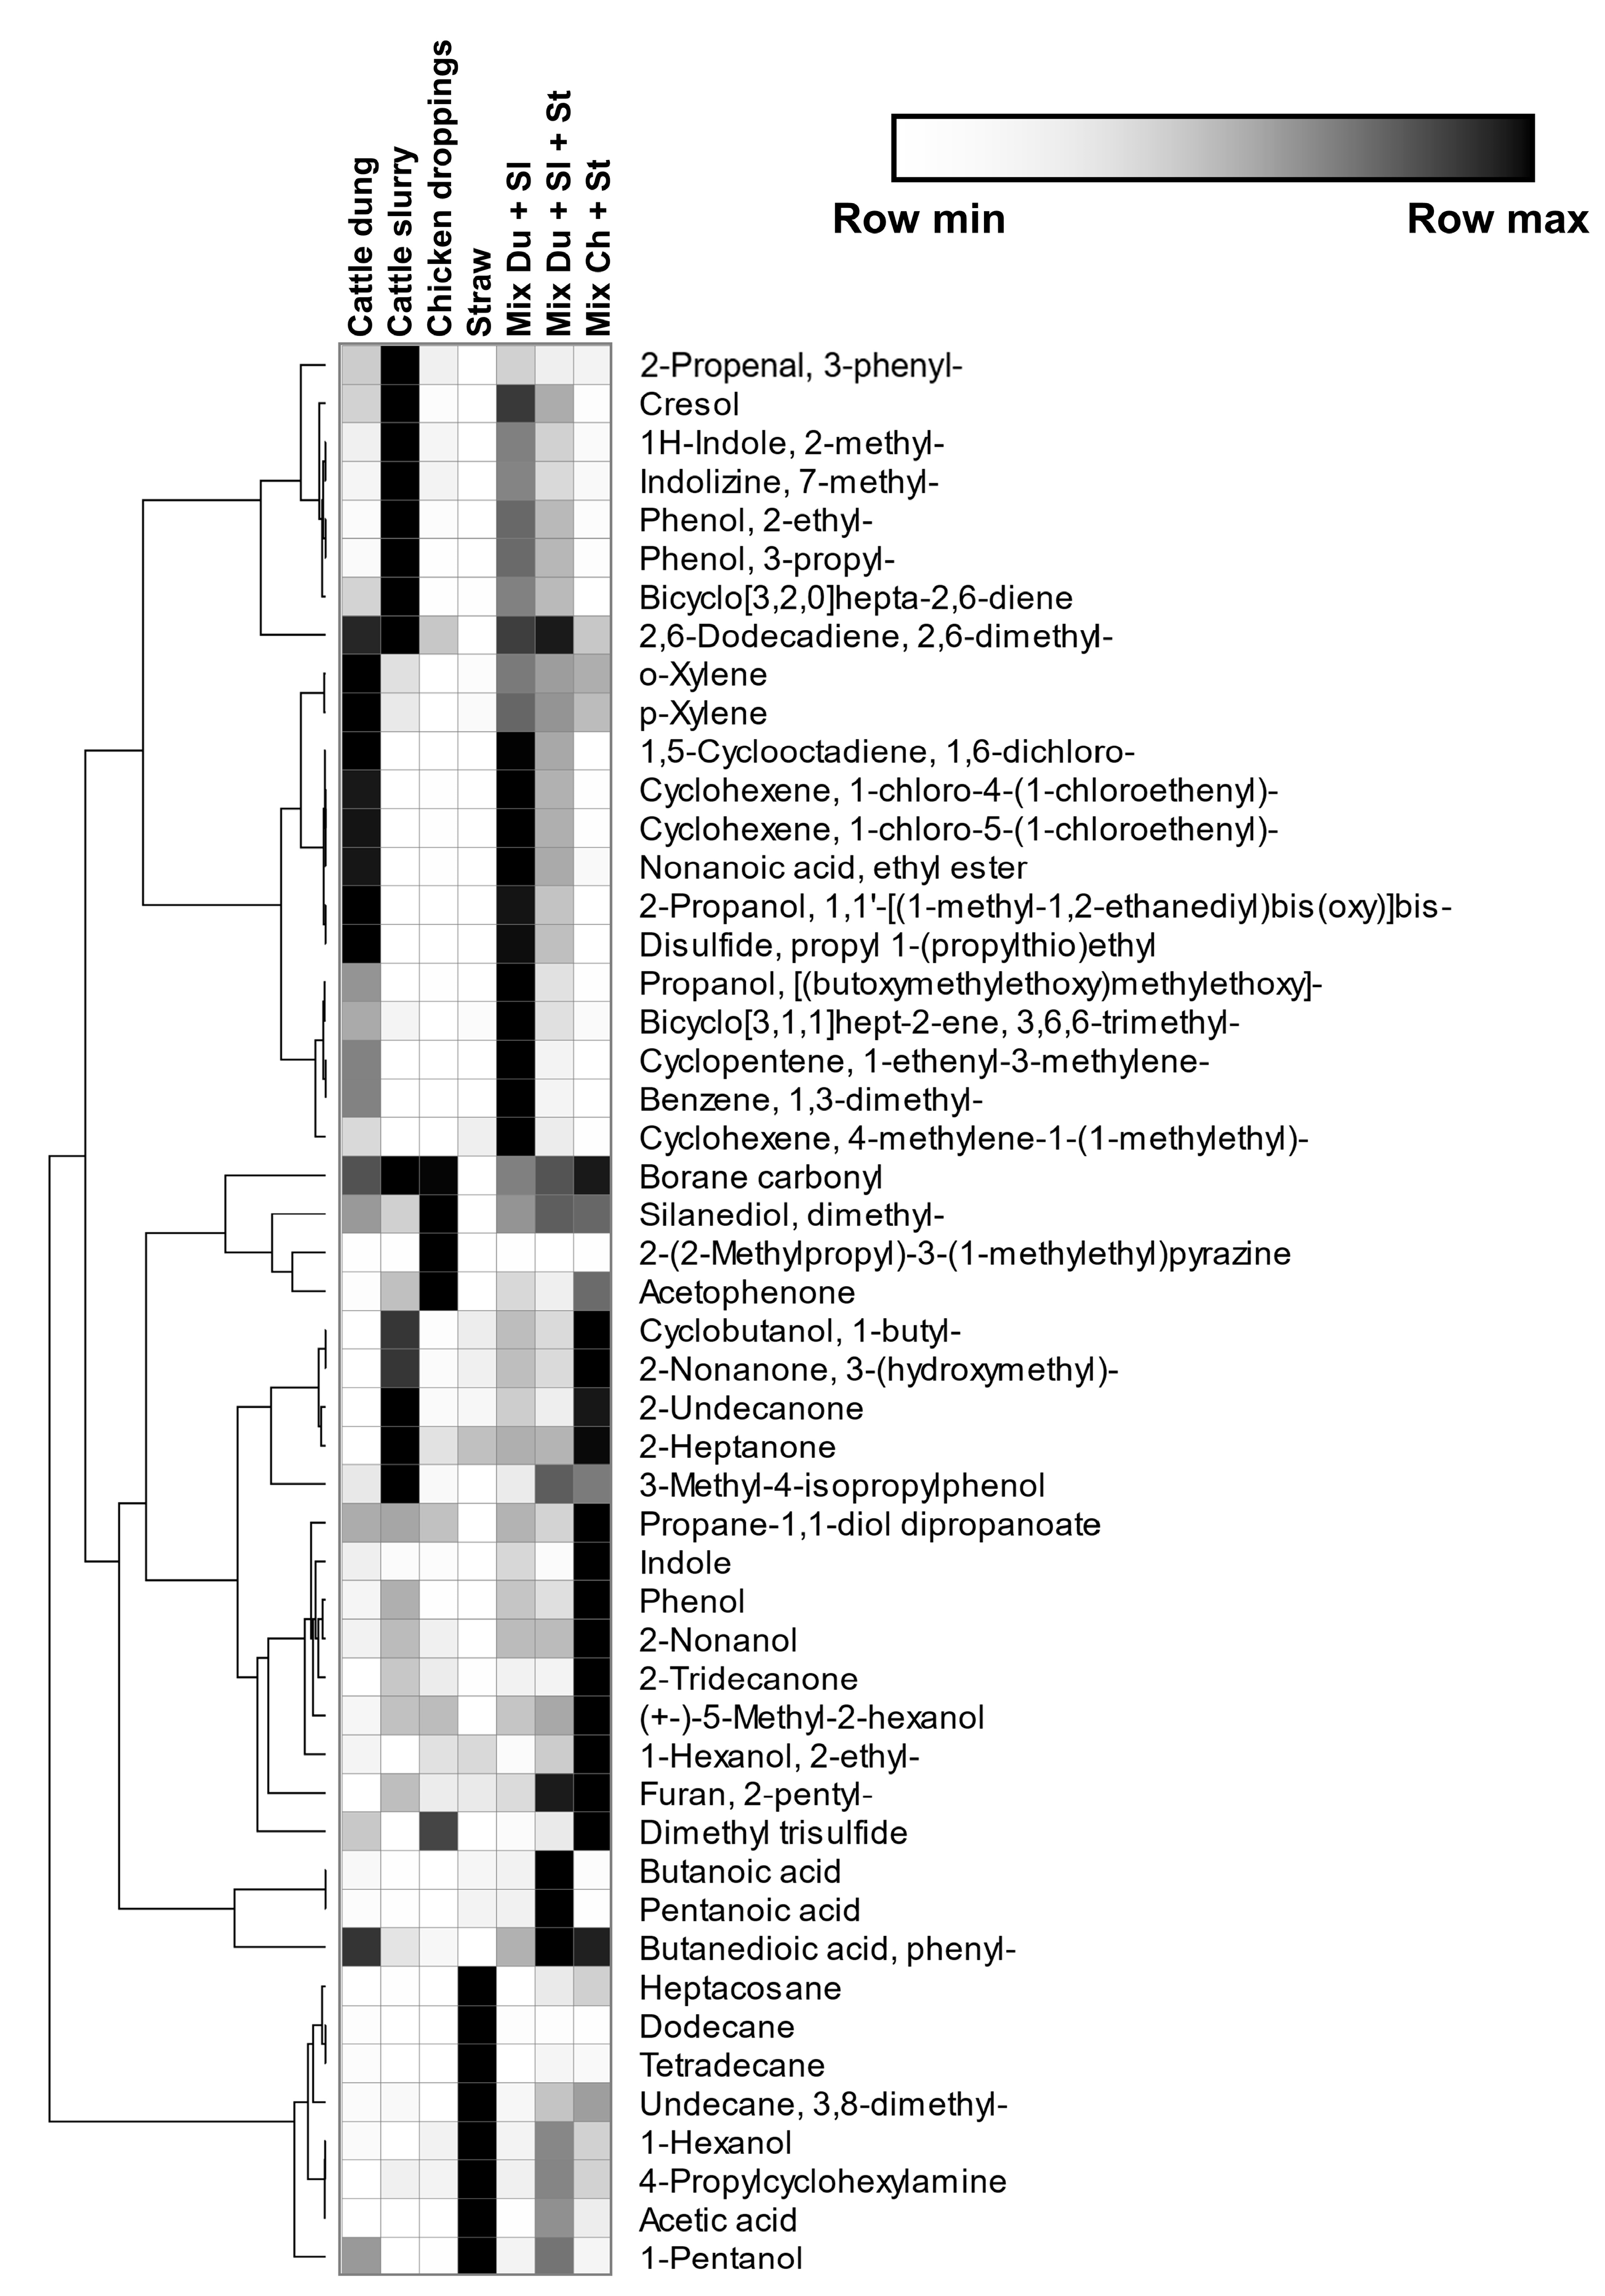
3.1. Laboratory Test: VOC Profiling in Different Effluent Mixtures

Various manure samples were collected from the field and mixed according to the protocol described in the Materials and Methods to reconstruct different effluent mixtures of livestock farms or buildings: unmixed materials, intermediate mixtures, and final mixtures. In order to compare the different volatile molecules of the mixtures, HS-SPME-GC-MS analyses were carried out on each sample. The GC-MS data were then processed by MS-DIAL to quantify and identify the volatile compounds contained in each mixture. A mid-polar column (DB-624) was chosen for GC-MS analysis with the intention of covering most of the main VOC classes. The chromatograms of the unmixed materials and intermediate or final mixtures are compared in Figure 1. The majority of the VOCs detected in these samples eluted between 16 and 29 min, and mostly belonged to oxygenated compounds. The highest peaks analyzed in the cattle mixtures were phenol, cresol, and skatole; and in the chicken mixtures, phenol and indole. The main VOCs detected here are consistent with several other studies on animal effluents, especially swine manure [39,40,41]. In Figure 1a, it is clear that for the slurry and dung mixture, it was the slurry that produced the most VOCs compared to dung. When this mixture was added to straw, to reconstitute a dirty rearing litter, the chromatographic profile remained similar (Figure 1b). On the other hand, in Figure 1c, it is clear that mixing chicken droppings with straw substantially changed the chromatographic profile, especially with regard to the intensity of certain peaks being more significant than on the sample of droppings alone, for example, phenol and indole.
In total, 177 VOCs were identified, quantified, and then classified according to Ni et al. (2012) [19] (Table S1). The molecular family distributions of the effluent samples taken separately and mixed are shown in Figure 2. VOCs have been classified into 13 classes including hydrocarbons, oxygenated compounds (acids, alcohols, aldehydes, ketones, esters, phenolics, indoles), aromatics, amines, terpenoids, sulfur containing compounds, and halogenated compounds.
For materials of bovine origin (cattle dung in Figure 2a and slurry in Figure 2b), the classes of molecules were essentially the same, with the exception of a significant proportion of ketone present in the slurry, which was absent in the cattle dung. The main molecular classes of bovine fecal matter are in agreement with the classes found in the literature, with phenols, alcohol, aromatic compounds, indoles, halogenated compounds, hydrocarbons and ketones found in Laor et al. (2008), Kaikiti et al. (2021), Kammer et al. (2020), Ciganek et Neca (2008) [14,15,17,26], and more broadly in pig effluent studies [2,41]. The same molecular families have been found for chicken fecal matter (Figure 2c), which is consistent with the literature presented by Sánchez-Monedero et al. (2019) [42] and Dunlop et al. (2016) [8]. For straw alone (in Figure 2d), the detected volatile molecules were distributed mainly in the families of alcohols (23%), hydrocarbons (23%) ketones (20%), and terpenoids (6%). The proportion of alcohols and hydrocarbons was greater than for the fecal matter. Although the work of Beck et al. [43] showed that straw is not a very important emitting source of terpenoids (compared to sawdust), these molecules are known to be characteristic of plant sources and are found in straw and the silage on farms [44]. In addition, several VOCs from the terpenoid class have been detected in cattle dung and chicken droppings. The presence of terpenoids in cow dung may be a result of sample contamination during field collection by grass. The presence of terpenoids in poultry manure may be the result of the animals’ diet or contamination. The mixture of cattle feces and slurry (presented in Figure 2e) showed no significant difference in the distribution of molecules, and even the addition of straw (in Figure 2f) did not change this distribution. In general, the mixture of different materials (fecal matter, slurry and straw) did not fundamentally change the distribution of the different volatile molecular families detected by this technique.
Litter is a porous material and odorants will be released from the surface [45] but will also diffuse through the pores [46,47]. The release of odorants from litter is therefore complex and requires the consideration of gas exchange mechanisms and the physical properties of the litter [8]. It is therefore important to measure the VOCs of the rearing effluents in mixed conditions with the different materials constituting the litter. Indeed, an animal litter on a farm is not a stable system, and different factors influence its composition. Among these factors, we can mention the type of litter, the number of animals, the way of breeding (stall straw bed, deep litter…), the addition of additives by the breeder, the behavior of the animals, the breeder cleaning habits, etc. In addition, during sampling in a farm building, the sampling area (trough, feeder, resting area), the depth, the presence of the animals, and the activity of the farm can influence the representation of the samples.
For further investigation of the influence of different mixtures on VOC volatilization, a comparison was made for the evolution of the relative abundances of the 50 most abundant VOCs identified in different mixtures (Figure 3). The results show that when the mixture of bovine slurry and bovine dung is used, such an addition indicates a coherent molecular composition of a homogeneous mixture of the two materials. The mixture has the molecular characteristics of cattle slurry (cresol, 2-ethylphenol, 3-propylphenol, for example) and cow dung (dimethyl-2,6-dodecadiene, xylene, for example). Straw shows a very specific molecular profile in comparison to other samples, with a high presence of dodecane, heptacosan, 3-8-dimethylundecane, 1-hexanol, 4-propylcyclohexylamine, and 1-pentanol. The mixture of slurry, dung, and straw seemed to retain the majority of the molecules when compared to each part analyzed alone, but with less intensity. Chicken manure also showed a major molecular composition that different to the other samples, with the presence of sulfur molecules such as dimethyl trisulfide in high abundance, an aromatic ketone derivative (acetophenone), and a pyrazine derivative. After mixing with straw, there are many more VOCs detected compared to chicken droppings or straw alone. For example, indole, phenol, and benzene derivatives were emitted more strongly in the mixture sample. Dimethyl trisulfide was also found in the dropping mixtures and to a lesser extent the fragrant molecules of the straw.
The results show that the molecules found are in agreement with those cited in the literature. This method of sample preparation and rapid analysis makes it possible to control the various factors that can influence the release of VOCs from a litter. The results here show the feasibility of reconstructing effluent mixtures in the laboratory for VOC analysis, which will allow for the study of a higher number of experimental conditions in more reproducible analytical settings.

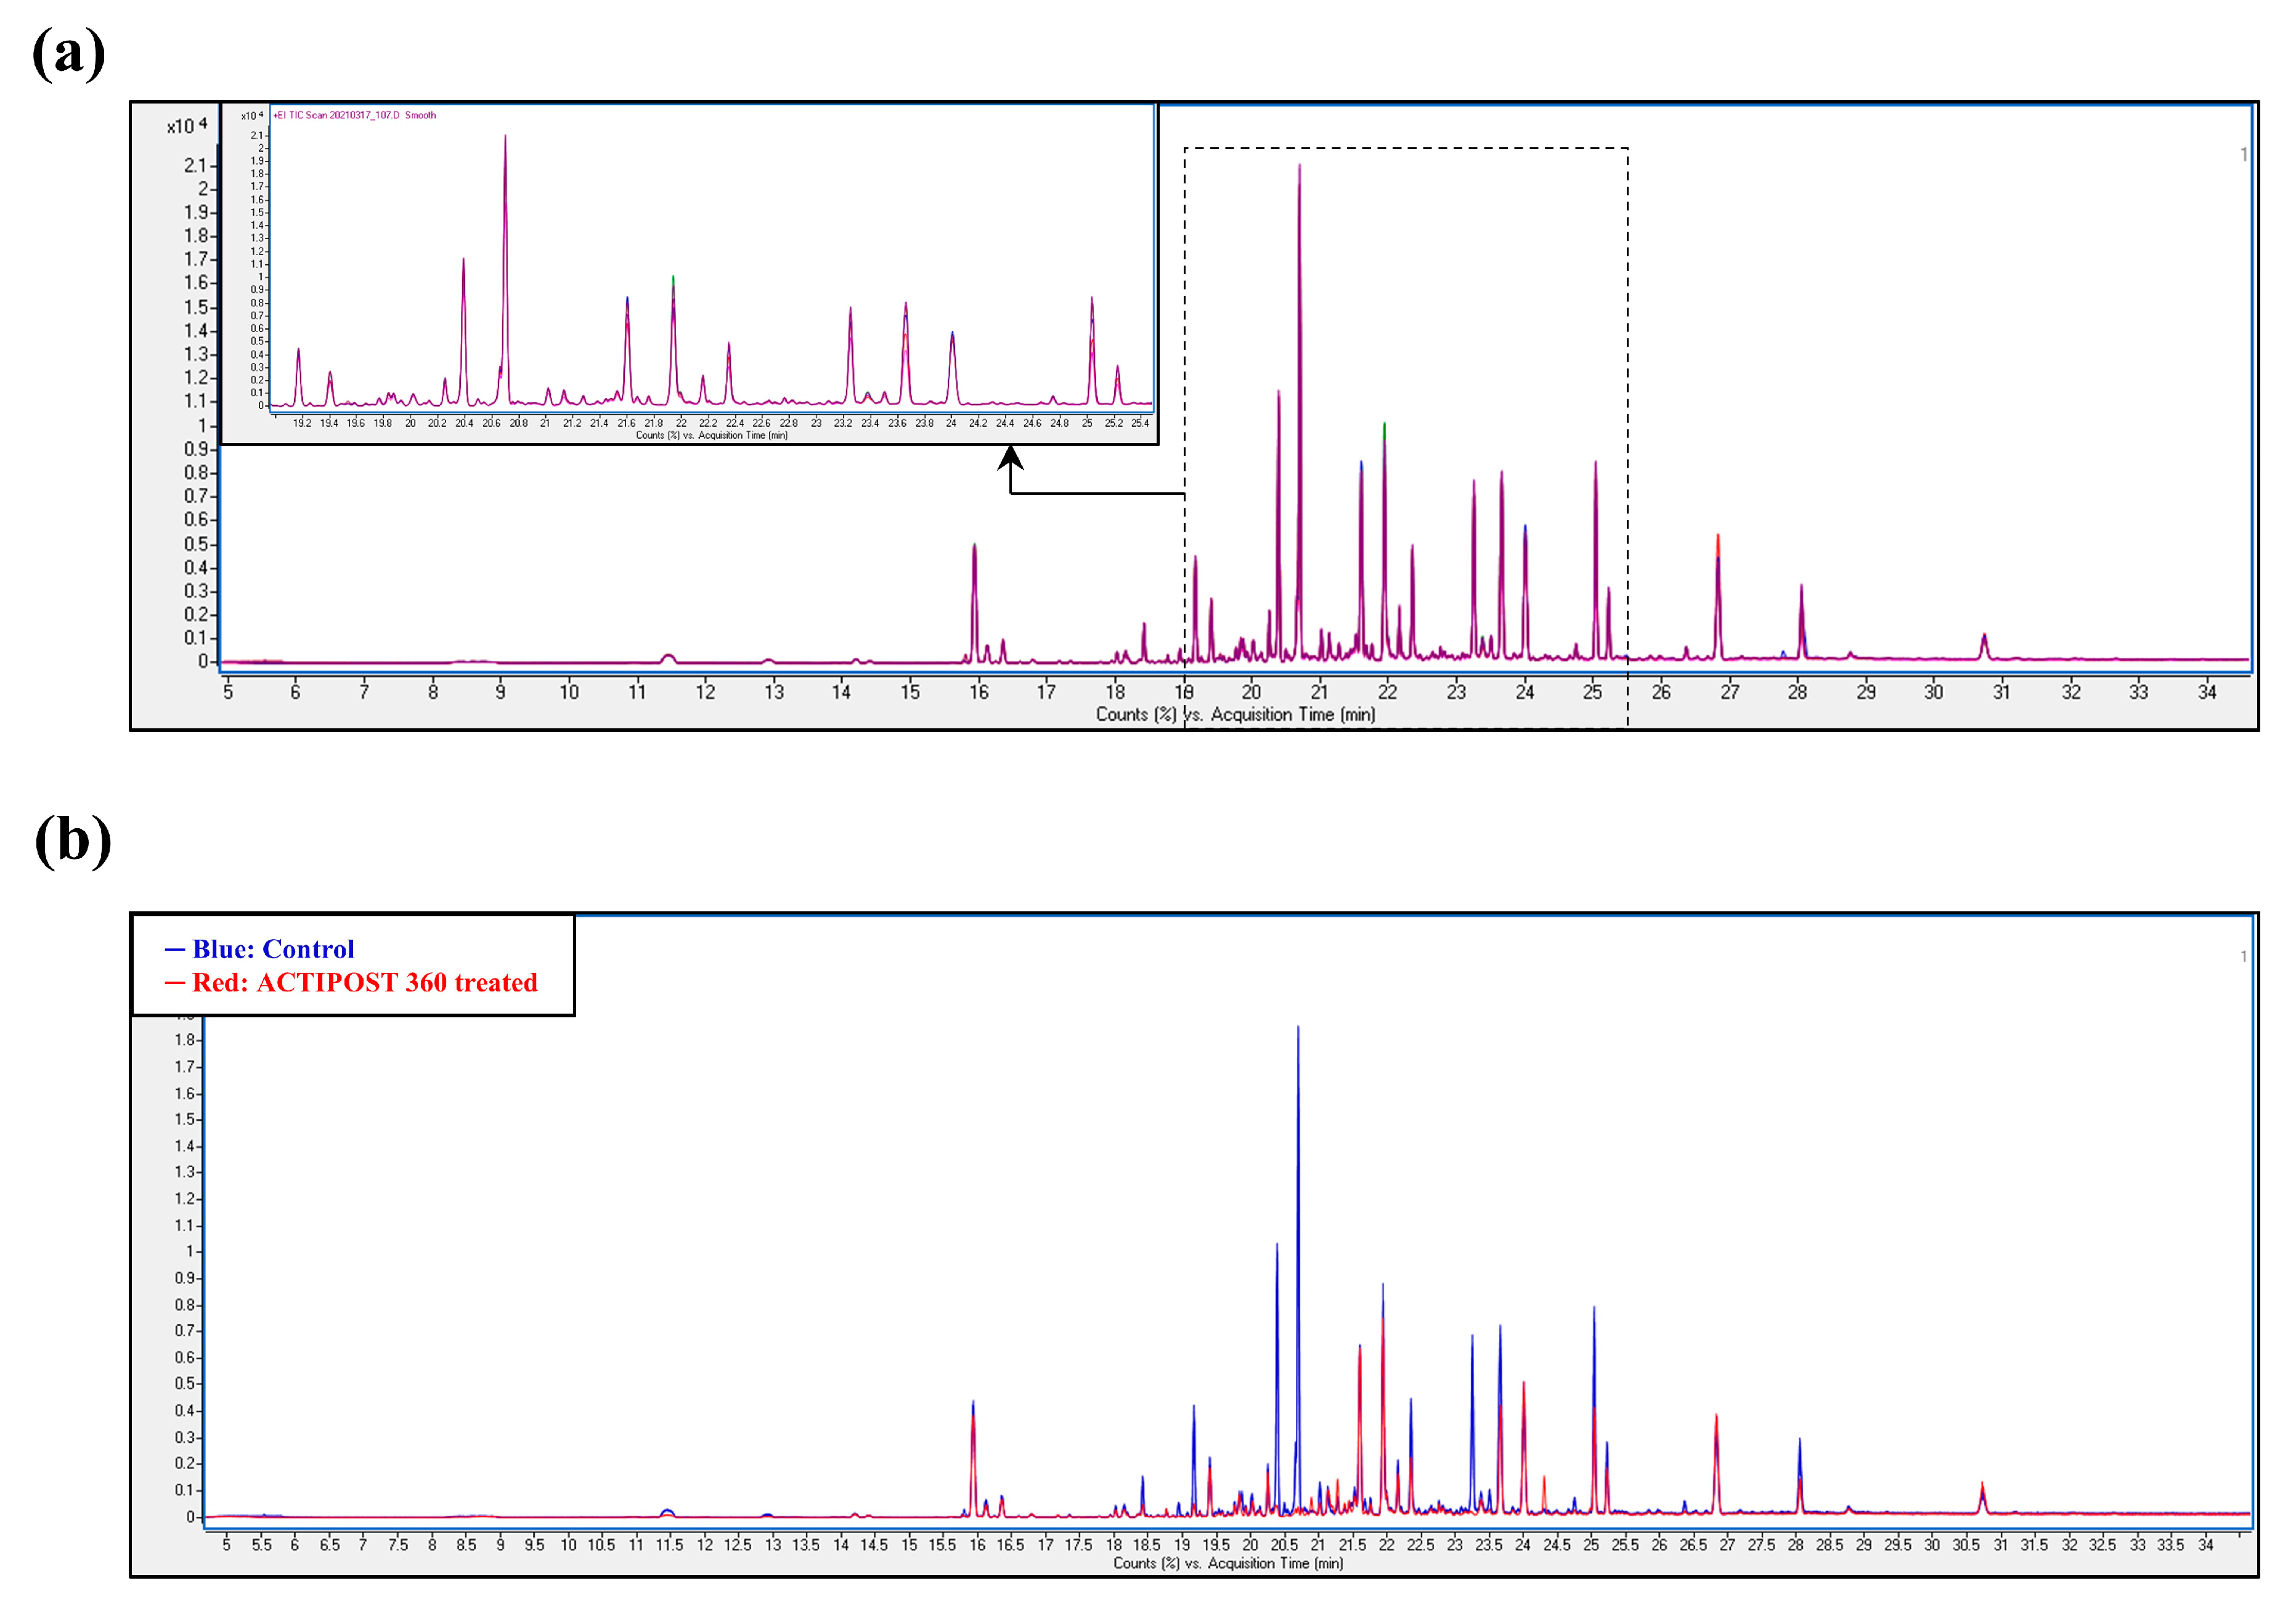
3.2. Field Test: VOC Profiling in the Treated and Untreated Dairy Slurry

To evaluate the applicability of the HS-SPME-GC-MS technique for offline VOC profiling in field tests, dairy slurry samples were collected from two pits on the same farm: one control and one treated with Actipost 360. Actipost 360 is a mineral based product combining clays with a source of marine calcium, which is further blended with a mixture of microorganisms and enzymes. The resulting combination of bacteria, enzymes, and minerals allows for better degradation of the organic matter present in the slurry, preventing the formation of a thicker crust. The lighter the crust on the surface of the pits, the better the aeration of the slurry, thus limiting the anaerobic processes that are responsible for unpleasant odors. It is also possible that the addition of exogenous bacteria and enzymes to slurry could lead to the creation of metabolic pathways that are involved in degrading specific molecules, but this is difficult to prove with the current state of knowledge.
Six samples were collected from each pit and analyzed by HS-SPME-GC-MS for their distribution of VOCs. The results of the GC analyses showed significant differences in the total VOC abundances between the treated and untreated slurry samples. An example of a chromatogram obtained with this method is presented in Figure 4. In the chromatograms shown in Figure 4a, it can be seen that the six samples taken from different areas of the same manure pit were analytically homogeneous. In the chromatograms shown in Figure 4b, the difference between the treated pit and untreated pit was visibly marked by the decreasing abundance of certain peaks.
In total, 73 VOCs were identified and quantified (Table S2). The main chemical families implicated in odorous emissions from the dairy manure or farm [48,49] were detected as follows: volatile aliphatic branched-chain fatty acids, nitrogen heterocycles (indole and scatole derivatives), and phenol. These compounds mostly stem from the catabolism of amino acids, either directly or after a series of secondary reactions. Another molecular type seemed to be highly detected: terpenoids (terpineol, limonene, cymene, etc.). These molecules are known to be found mainly in plant organs and tissue (flower, leaf, bark etc.). On a farm, they can come from silage [44], hay [50], litter and manure [25], and all this mixture can fall into the slurry pit, which is under the barn. These biomass fragments form a crust that floats on the surface of the slurry and can therefore be collected at the same time as the slurry sample.
To further investigate the type of volatile molecules varying between the untreated and treated pits, a volcano plot was generated using the two-tailed unpaired t-test (Figure 5). Significant differences were found between the treated slurry and untreated slurry. Figure 5 shows that terpenes such as cymene, limonene, terpinene, and terpineol were significantly decreased compared to the untreated pit. This difference may be due to the action of the Actipost 360 product on the degradation of the floating crust: in fact, bacteria and the oxygenation of a slurry pit can influence the production of VOCs [51]. A significant decrease was also observed for indole, phenol, and cresol. These molecules are the main VOCs responsible for odor nuisances on farms. Their threshold of odorous detection by humans is very low, and their smell reminds one of fecal matter, tar, rot… [8]. VOC analyses by HS-SPME-GC-MS can then be used as a tool to evaluate the potential production of odorous molecules from an effluent storage area. Owever, the perception of unpleasant odors in the environment is not only related to a molecule’s concentration in the air, but also to various factors such as wind, dust, the topography of places, etc. [14].

3.3. The Interest of HS-SPME-GC-MS for in Farm Effluent Analyses

The HS-SPME-GC-MS technique presents several advantages for the VOC analyses of the effluents. The extraction method is simple and economical: the SPME fiber is reusable and the extraction does not require a solvent. The sample preparation can be achieved by an automated robot coupled directly to the GC analyzer, enabling the analysis of a large number of samples. Moreover, the GC-MS analysis of volatile compounds provides high resolution and sensitivity. In this study, with 2.5 g of various effluent samples, more than a hundred volatile compounds were identified.
The current study shows that the analysis of VOCs in farm effluents, in either solid or liquid form, can be carried out using different approaches:
The first approach is to measure the VOCs from samples collected in the field and analyzed them by HS-SPME-GC-MS as they are or mixed with a substrate to reconstitute soiled bedding (for example, ground straw). This method makes it possible to measure VOCs without environmental bias and is easier and cheaper to implement. This work has also shown that laboratory pre-tests based on a specific preparation of samples (mixture of slurry and dung, mixture with straw etc.) is a good model to evaluate the production of VOCs and could lead to a predictive approach of the behavior of on-farm VOC production. Laboratory pre-tests can therefore be further developed as a model for predicting the waste effluent behavior in beddings and related VOC release in livestock production. Moreover, the laboratory pre-tests allow one to test a large number of experimental combinations (type of bedding materials, type of effluent, etc.). This analytical technique makes it possible to study the VOCs released in a faster and more targeted manner, which facilitates a better understanding of the various factors influencing this phenomenon.
The second approach presented in this study is to quickly analyze field samples that have been treated with additives. These studies sometimes require a specific material to analyze interesting parameters. The VOC extraction and analysis by HS-SPME-GC-MS allows for the specific tracking of molecules regardless of the layout of the infrastructure in the field. Therefore, HS-SPME-GC-MS analysis is an interesting method to quickly and specifically identify and compare monitoring markers for slurry pits as well as monitor the effectiveness of a treatment.

4. Conclusions

This study confirmed that farm effluents (cattle dung, cattle slurry, chicken droppings, mixtures, etc.) emitted numerous volatile organic compounds (VOCs). HS-SPME-GC-MS (headspace-solid phase microextraction-gas chromatography-mass spectrometry) has been demonstrated to be a suitable technique, which is fast and easy to manage, and can measure a broad spectrum of VOCs from samples directly taken in the field or reconstituted in the laboratory.

Supplementary Materials

The following supporting information can be downloaded at: https://www.mdpi.com/article/10.3390/atmos14060928/s1, Table S1: VOC analyses by HS-SPME-GC-MS of different effluent mixtures. Table S2: VOC analyses by HS-SPME-GC-MS of the treated and untreated dairy slurry.

Author Contributions

Conceptualization, N.J. and L.J.; Methodology, N.J. and L.J.; Formal analysis, N.J. and L.J.; Investigation, N.J. and L.J; Writing—original draft preparation, N.J. and L.J.; Writing—review and editing, N.J., L.J. and F.J.; Visualization, L.J.; Supervision, F.J. and P.D. All authors have read and agreed to the published version of the manuscript.

Funding

This research received no external funding.

Institutional Review Board Statement

Not applicable.

Informed Consent Statement

Not Applicable.

Data Availability Statement

Not Applicable.

Acknowledgments

The authors would like to thank Centina Pinier, Justine Defert, and Alexandre Brunet for their excellent technical support. The authors sincerely thank Nusrat Ali for their critical reading of the manuscript.

Conflicts of Interest

N.J., L.J., F.J. and P.D. are employees of Agro Innovation International, Centre Mondial de l’Innovation, Group Roullier. The additive Actipost 360®, used in our study as an example of treated slurry to demonstrate the interest of HS-SPME-GC-MS for volatile organic compounds analysis in field samples, is distributed by TIMAC Agro France, also a subsidiary of Group Roullier.

Abbreviations

ChChicken droppings
Ch + StMix of chicken droppings and straw
DuCattle dung
Du + SlMix of cattle dung and slurry
Du + Sl + StMix of cattle dung, slurry, and straw
DVB/CAR/PDMSDivinylbenzene/carboxen/polydimethylsiloxane
EIElectron impact ionization
GC-FIDGas chromatography-flame ionization detector
GC-MSGas chromatography-mass spectrometry
GC-MS-OGas chromatography-mass spectrometry olfactometry
HS-SPMEheadspace solid-phase microextraction
MIMSMembrane inlet mass spectrometry
PTR-Qi-TOF-MSProton transfer reaction–quadrupole ion guide–time of flight–mass spectrometry
PTR-MSProton transfer reaction-mass spectrometry
SlCattle slurry
SPMESolid phase microextraction
StStraw
TDThermal desorption
TD-GC-MSThermal desorption-gas chromatography-mass spectrometry
VOCsVolatile organic compounds

References

  1. United States Environmental Protection Agency, Overview. Sources of Greenhouse Gas Emissions. Available online: https://www.epa.gov/ghgemissions/sources-greenhouse-gas-emissions (accessed on 15 September 2022).
  2. Nie, E.; Zheng, G.; Ma, C. Characterization of Odorous Pollution and Health Risk Assessment of Volatile Organic Compound Emissions in Swine Facilities. Atmos. Environ. 2020, 223, 117233. [Google Scholar] [CrossRef]
  3. Toro, M.V.; Cremades, L.V.; Calbó, J. Relationship between VOC and NOx Emissions and Chemical Production of Tropospheric Ozone in the Aburrá Valley (Colombia). Chemosphere 2006, 65, 881–888. [Google Scholar] [CrossRef] [PubMed]
  4. Ziemann, P.J.; Atkinson, R. Kinetics, Products, and Mechanisms of Secondary Organic Aerosol Formation. Chem. Soc. Rev. 2012, 41, 6582–6605. [Google Scholar] [CrossRef] [PubMed]
  5. Chen, B.; Koziel, J.A.; Banik, C.; Ma, H.; Lee, M.; Wi, J.; Meiirkhanuly, Z.; O’Brien, S.C.; Li, P.; Andersen, D.S.; et al. Mitigation of Odor, NH3, H2S, GHG, and VOC Emissions With Current Products for Use in Deep-Pit Swine Manure Storage Structures. Front. Environ. Sci. 2020, 8, 613646. [Google Scholar] [CrossRef]
  6. Blazy, V.; de Guardia, A.; Benoist, J.C.; Daumoin, M.; Guiziou, F.; Lemasle, M.; Wolbert, D.; Barrington, S. Correlation of Chemical Composition and Odor Concentration for Emissions from Pig Slaughterhouse Sludge Composting and Storage. Chem. Eng. J. 2015, 276, 398–409. [Google Scholar] [CrossRef]
  7. Wattiaux, M.A.; Uddin, M.E.; Letelier, P.; Jackson, R.D.; Larson, R.A. Invited Review: Emission and Mitigation of Greenhouse Gases from Dairy Farms: The Cow, the Manure, and the Field. Appl. Anim. Sci. 2019, 35, 238–254. [Google Scholar] [CrossRef]
  8. Dunlop, M.W.; Blackall, P.J.; Stuetz, R.M. Odour Emissions from Poultry Litter—A Review Litter Properties, Odour Formation and Odorant Emissions from Porous Materials. J. Environ. Manag. 2016, 177, 306–319. [Google Scholar] [CrossRef]
  9. McIlroy, J.P.; McGeough, K.L.; Laughlin, R.J.; Carolan, R. Abatement of Ammonia Emissions from Dairy Cow House Concrete Floor Surfaces through Additive Application. Biosyst. Eng. 2019, 188, 320–330. [Google Scholar] [CrossRef]
  10. Nahm, K.H. Environmental Effects of Chemical Additives Used in Poultry Litter and Swine Manure. Crit. Rev. Environ. Sci. Technol. 2005, 35, 487–513. [Google Scholar] [CrossRef]
  11. Wang, Y.-C.; Han, M.-F.; Jia, T.-P.; Hu, X.-R.; Zhu, H.-Q.; Tong, Z.; Lin, Y.-T.; Wang, C.; Liu, D.-Z.; Peng, Y.-Z.; et al. Emissions, Measurement, and Control of Odor in Livestock Farms: A Review. Sci. Total Environ. 2021, 776, 145735. [Google Scholar] [CrossRef]
  12. Klenbusch, M.R. Measurement of Gaseous Emission Rates from Land Surfaces Using an Emission Isolation Flux Chamber: User’s Guide; Radian Corp.: Austin, TX, USA, 1986. [Google Scholar]
  13. Zhou, Z.; Shen, G.; Xu, C.; Song, M.; Chen, X.; Wang, Z.; Fu, K.; Qian, X. Investigation into emission characteristics of odor pollutants in typical livestock and poultry farms in Shanghai. Acta Agric. Zhejiangensis 2019, 31, 790–797. [Google Scholar] [CrossRef]
  14. Kammer, J.; Décuq, C.; Baisnée, D.; Ciuraru, R.; Lafouge, F.; Buysse, P.; Bsaibes, S.; Henderson, B.; Cristescu, S.M.; Benabdallah, R.; et al. Characterization of Particulate and Gaseous Pollutants from a French Dairy and Sheep Farm. Sci. Total Environ. 2020, 712, 135598. [Google Scholar] [CrossRef] [PubMed]
  15. Laor, Y.; Koziel, J.A.; Cai, L.; Ravid, U. Chemical-Sensory Characterization of Dairy Manure Odor Using Headspace Solid-Phase Microextraction and Multidimensional Gas Chromatography Mass Spectrometry-Olfactometry. J. Air Waste Manag. Assoc. 2008, 58, 1187–1197. [Google Scholar] [CrossRef] [PubMed]
  16. Hough, R.; Archer, D.; Probert, C. A Comparison of Sample Preparation Methods for Extracting Volatile Organic Compounds (VOCs) from Equine Faeces Using HS-SPME. Metabolomics 2018, 14, 19. [Google Scholar] [CrossRef]
  17. Kaikiti, K.; Stylianou, M.; Agapiou, A. Use of Biochar for the Sorption of Volatile Organic Compounds (VOCs) Emitted from Cattle Manure. Environ. Sci. Pollut. Res. Int. 2021, 28, 59141–59149. [Google Scholar] [CrossRef]
  18. Begnaud, F.; Pérès, C.; Berdagué, J.-L. Characterization of Volatile Effluents of Livestock Buildings by Solid-Phase Microextraction. Int. J. Environ. Anal. Chem. 2003, 83, 837–849. [Google Scholar] [CrossRef]
  19. Ni, J.-Q.; Robarge, W.P.; Xiao, C.; Heber, A.J. Volatile Organic Compounds at Swine Facilities: A Critical Review. Chemosphere 2012, 89, 769–788. [Google Scholar] [CrossRef]
  20. Feilberg, A.; Liu, D.; Adamsen, A.P.S.; Hansen, M.J.; Jonassen, K.E.N. Odorant Emissions from Intensive Pig Production Measured by Online Proton-Transfer-Reaction Mass Spectrometry. Environ. Sci. Technol. 2010, 44, 5894–5900. [Google Scholar] [CrossRef]
  21. Yuan, B.; Coggon, M.M.; Koss, A.R.; Warneke, C.; Eilerman, S.; Peischl, J.; Aikin, K.C.; Ryerson, T.B.; de Gouw, J.A. Emissions of Volatile Organic Compounds (VOCs) from Concentrated Animal Feeding Operations (CAFOs): Chemical Compositions and Separation of Sources. Atmos. Chem. Phys. 2017, 17, 4945–4956. [Google Scholar] [CrossRef]
  22. Feilberg, A.; Adamsen, A.P.S.; Lindholst, S.; Lyngbye, M.; Schäfer, A. Evaluation of Biological Air Filters for Livestock Ventilation Air by Membrane Inlet Mass Spectrometry. J. Environ. Qual. 2010, 39, 1085–1096. [Google Scholar] [CrossRef]
  23. Theodoridis, G.; Koster, E.H.M.; de Jong, G.J. Solid-Phase Microextraction for the Analysis of Biological Samples. J. Chromatogr. B Biomed. Sci. Appl. 2000, 745, 49–82. [Google Scholar] [CrossRef] [PubMed]
  24. Hwang, O.; Lee, S.-R.; Cho, S.; Ro, K.S.; Spiehs, M.; Woodbury, B.; Silva, P.J.; Han, D.-W.; Choi, H.; Kim, K.-Y.; et al. Efficacy of Different Biochars in Removing Odorous Volatile Organic Compounds (VOCs) Emitted from Swine Manure. ACS Sustain. Chem. Eng. 2018, 6, 14239–14247. [Google Scholar] [CrossRef]
  25. Laor, Y.; Shabtay, A.; Ravid, U.; Baybikov, R.; Eitam, H. Changes in VOCs Emissions from Fecal Manure throughout the Life Cycle of Beef Cattle. In Proceedings of the 2007 ASABE Annual International Meeting, Minneapolis, Minnesota, 17–20 June 2007; American Society of Agricultural and Biological Engineers: St. Joseph, MI, USA, 2007. [Google Scholar]
  26. Ciganek, M.; Neca, J. Chemical Characterization of Volatile Organic Compounds on Animal Farms. Vet. Med. 2008, 53, 641–651. [Google Scholar] [CrossRef]
  27. Zhu, F.; Pan, Z.; Hong, C.; Wang, W.; Chen, X.; Xue, Z.; Yao, Y. Analysis of Volatile Organic Compounds in Compost Samples: A Potential Tool to Determine Appropriate Composting Time. Waste Manag. 2016, 58, 98–106. [Google Scholar] [CrossRef]
  28. Zhang, Y.; Zhu, Z.; Zheng, Y.; Chen, Y.; Yin, F.; Zhang, W.; Dong, H.; Xin, H. Characterization of Volatile Organic Compound (VOC) Emissions from Swine Manure Biogas Digestate Storage. Atmosphere 2019, 10, 411. [Google Scholar] [CrossRef]
  29. Scheftelowitz, M.; Thrän, D. Unlocking the Energy Potential of Manure—An Assessment of the Biogas Production Potential at the Farm Level in Germany. Agriculture 2016, 6, 20. [Google Scholar] [CrossRef]
  30. Bhattacharya, A.N.; Taylor, J.C. Recycling Animal Waste as a Feedstuff: A Review. J. Anim. Sci. 1975, 41, 1438–1457. [Google Scholar] [CrossRef]
  31. van der Hoeven-Hangoor, E.; Rademaker, C.J.; Paton, N.D.; Verstegen, M.W.A.; Hendriks, W.H. Evaluation of Free Water and Water Activity Measurements as Functional Alternatives to Total Moisture Content in Broiler Excreta and Litter Samples. Poult. Sci. 2014, 93, 1782–1792. [Google Scholar] [CrossRef]
  32. Dunlop, M.W.; Blackall, P.J.; Stuetz, R.M. Water Addition, Evaporation and Water Holding Capacity of Poultry Litter. Sci. Total Environ. 2015, 538, 979–985. [Google Scholar] [CrossRef]
  33. Miles, D.M.; Rowe, D.E.; Cathcart, T.C. Litter Ammonia Generation: Moisture Content and Organic versus Inorganic Bedding Materials1. Poult. Sci. 2011, 90, 1162–1169. [Google Scholar] [CrossRef]
  34. Miles, D.M.; Rowe, D.E.; Owens, P.R. Winter Broiler Litter Gases and Nitrogen Compounds: Temporal and Spatial Trends. Atmos. Environ. 2008, 42, 3351–3363. [Google Scholar] [CrossRef]
  35. Morse, D.; Nordstedt, R.A.; Head, H.H.; Van Horn, H.H. Production and Characteristics of Manure from Lactating Dairy Cows in Florida. Trans. ASAE 1994, 37, 275–279. [Google Scholar] [CrossRef]
  36. Pereira, J.; Fangueiro, D.; Misselbrook, T.H.; Chadwick, D.R.; Coutinho, J.; Trindade, H. Ammonia and Greenhouse Gas Emissions from Slatted and Solid Floors in Dairy Cattle Houses: A Scale Model Study. Biosyst. Eng. 2011, 109, 148–157. [Google Scholar] [CrossRef]
  37. Tsugawa, H.; Cajka, T.; Kind, T.; Ma, Y.; Higgins, B.; Ikeda, K.; Kanazawa, M.; VanderGheynst, J.; Fiehn, O.; Arita, M. MS-DIAL: Data-Independent MS/MS Deconvolution for Comprehensive Metabolome Analysis. Nat. Methods 2015, 12, 523–526. [Google Scholar] [CrossRef] [PubMed]
  38. Goedhart, J.; Luijsterburg, M.S. VolcaNoseR Is a Web App for Creating, Exploring, Labeling and Sharing Volcano Plots. Sci. Rep. 2020, 10, 20560. [Google Scholar] [CrossRef]
  39. Meiirkhanuly, Z.; Koziel, J.A.; Chen, B.; Białowiec, A.; Lee, M.; Wi, J.; Banik, C.; Brown, R.C.; Bakshi, S. Mitigation of Gaseous Emissions from Swine Manure with the Surficial Application of Biochars. Atmosphere 2020, 11, 1179. [Google Scholar] [CrossRef]
  40. Trabue, S.; Scoggin, K.; Tyndall, J.; Sauer, T.; Hernandez-Ramirez, G.; Pfeiffer, R.; Hatfield, J. Odorous Compounds Sources and Transport from a Swine Deep-Pit Finishing Operation: A Case Study. J. Environ. Manag. 2019, 233, 12–23. [Google Scholar] [CrossRef]
  41. Hernandez, G.; Trabue, S.; Sauer, T.; Pfeiffer, R.; Tyndall, J. Odor Mitigation with Tree Buffers: Swine Production Case Study. Agric. Ecosyst. Environ. 2012, 149, 154–163. [Google Scholar] [CrossRef]
  42. Sánchez-Monedero, M.A.; Sánchez-García, M.; Alburquerque, J.A.; Cayuela, M.L. Biochar Reduces Volatile Organic Compounds Generated during Chicken Manure Composting. Bioresour. Technol. 2019, 288, 121584. [Google Scholar] [CrossRef]
  43. Beck, J.; Heutelbeck, A.; Dunkelberg, H. Volatile Organic Compounds in Dwelling Houses and Stables of Dairy and Cattle Farms in Northern Germany. Sci. Total Environ. 2007, 372, 440–454. [Google Scholar] [CrossRef]
  44. Hafner, S.D.; Howard, C.; Muck, R.E.; Franco, R.B.; Montes, F.; Green, P.G.; Mitloehner, F.; Trabue, S.L.; Rotz, C.A. Emission of Volatile Organic Compounds from Silage: Compounds, Sources, and Implications. Atmos. Environ. 2013, 77, 827–839. [Google Scholar] [CrossRef]
  45. Mackie, R.I.; Stroot, P.G.; Varel, V.H. Biochemical Identification and Biological Origin of Key Odor Components in Livestock Waste. J. Anim. Sci. 1998, 76, 1331–1342. [Google Scholar] [CrossRef] [PubMed]
  46. Thibodeaux, L.J.; Scott, H.D. (Eds.) Air/Soil Exchange Coefficients. In Environmental Exposure From Chemicals; CRC Press: Boca Raton, FL, USA, 1991; ISBN 978-1-351-07178-9. [Google Scholar]
  47. Zhang, H.; Lindberg, S.E.; Barnett, M.O.; Vette, A.F.; Gustin, M.S. Dynamic Flux Chamber Measurement of Gaseous Mercury Emission Fluxes over Soils. Part 1: Simulation of Gaseous Mercury Emissions from Soils Using a Two-Resistance Exchange Interface Model. Atmos. Environ. 2002, 36, 835–846. [Google Scholar] [CrossRef]
  48. Hales, K.E.; Parker, D.B.; Cole, N.A. Potential Odorous Volatile Organic Compound Emissions from Feces and Urine from Cattle Fed Corn-Based Diets with Wet Distillers Grains and Solubles. Atmos. Environ. 2012, 60, 292–297. [Google Scholar] [CrossRef]
  49. Hales, K.; Parker, D.B.; Cole, N.A. Volatile Organic Compound Flux from Manure of Cattle Fed Diets Differing in Grain Processing Method and Co-Product Inclusion. Atmos. Environ. 2015, 100, 20–24. [Google Scholar] [CrossRef]
  50. de Gouw, J.A.; Howard, C.J.; Custer, T.G.; Baker, B.M.; Fall, R. Proton-Transfer Chemical-Ionization Mass Spectrometry Allows Real-Time Analysis of Volatile Organic Compounds Released from Cutting and Drying of Crops. Environ. Sci. Technol. 2000, 34, 2640–2648. [Google Scholar] [CrossRef]
  51. Zhu, J. A Review of Microbiology in Swine Manure Odor Control. Agric. Ecosyst. Environ. 2000, 78, 93–106. [Google Scholar] [CrossRef]
Figure 1. Comparison of the GC-MS chromatograms of different farm effluents. (a) Mix of cattle dung and slurry. (b) Mix of cattle dung, slurry and straw. (c) Mix of chicken droppings and straw. 1. Phenol. 2. Cresol. 3. Indole. 4. Methylindole.
Atmosphere 14 00928 g001
Figure 2. Pie charts of the main VOC class distribution in different matrix. (a) Cattle dung. (b) Cattle slurry. (c) Chicken droppings. (d) Straw. (e) Mix of cattle dung and slurry. (f) Mix of cattle dung, slurry, and straw. (g) Mix of chicken droppings and straw. Only VOCs with an average peak area above 1E5 in each matrix were taken into account.
Atmosphere 14 00928 g002
Figure 3. Heatmap showing the level of the 50 most abundant VOCs in different matrices. The color scale is relative to each row: white indicates the row minimum; black indicates the row maximum. VOCs were classified by hierarchical clustering. Du: Cattle dung; Sl: Cattle slurry; Ch: Chicken droppings; St: Straw; Du + Sl: Mix of cattle dung and slurry; Du + Sl + St: Mix of cattle dung, slurry, and straw; Ch + St: Mix of chicken droppings and straw.
Atmosphere 14 00928 g003
Figure 4. Comparison of the GC-MS chromatograms of ACTIPOST 360 treatment in the manure pit. (a) Reproducibility of 6 samples collected at different spots from the same manure pit. (b) Comparison of samples from the ACTIPOST 360 untreated (control) and treated manure pits.
Atmosphere 14 00928 g004
Figure 5. Volcano plot showing the differentially expressed metabolites in samples collected from the control or Actipost-treated manure pit. The threshold was set at a minimum change of 2-fold in metabolite abundance after Actipost treatment and a maximum p-value of 0.05 using a two-tailed unpaired t-test.
Atmosphere 14 00928 g005
Disclaimer/Publisher’s Note: The statements, opinions and data contained in all publications are solely those of the individual author(s) and contributor(s) and not of MDPI and/or the editor(s). MDPI and/or the editor(s) disclaim responsibility for any injury to people or property resulting from any ideas, methods, instructions or products referred to in the content.

