Article

PM2.5 Concentration Prediction in Six Major Chinese Urban Agglomerations: A Comparative Study of Various Machine Learning Methods Based on Meteorological Data

1
College of Public Administration, Nanjing Agricultural University, Nanjing 210095, China
2
College of Information Management, Nanjing Agricultural University, Nanjing 210095, China
*
Authors to whom correspondence should be addressed.
These authors contributed equally to this work.
Atmosphere 2023, 14(5), 903; https://doi.org/10.3390/atmos14050903
Submission received: 23 April 2023 / Revised: 17 May 2023 / Accepted: 17 May 2023 / Published: 22 May 2023

Abstract

:
The escalating issue of air pollution in China’s rapidly developing urban areas has prompted increased attention to the role of meteorological conditions in PM2.5 pollution. This study examines the spatiotemporal distribution of PM2.5 concentrations and their relationship with meteorological factors in six major Chinese urban agglomerations from 2017 to 2020, using daily average data. Statistical and spatial analysis techniques are employed, alongside the construction of eight machine learning models for prediction purposes. The study also compares the feature importance of various meteorological factors impacting PM2.5 concentrations. Results reveal significant regional differences in both average PM2.5 levels and meteorological influences. The Multilayer Perceptron (MLP) model demonstrates the highest prediction accuracy for PM2.5 concentrations. According to the MLP model’s feature importance identification, temperature is the most significant factor affecting PM2.5 concentrations across all urban agglomerations, while wind speed and precipitation have the least impact. Contributions from air pressure and dew point temperature, however, vary among different urban agglomerations. This research considers the impact of urban agglomerations and meteorological conditions on PM2.5 and also offers valuable artificial intelligence-based insights into the key meteorological factors influencing PM2.5 concentrations in diverse regions, thereby informing the development of effective air pollution control policies.

1. Introduction

In the past few decades, PM2.5 pollution has become a significant environmental issue worldwide. China is one of the regions most severely affected by PM2.5 pollution. With the rapid development of China’s economy, the rapid advancement of industrialization and urbanization, a large amount of pollutants such as fossil fuel combustion, factory emissions, vehicle emissions, and construction activities are emitted into the air, causing frequent environmental pollution problems caused by fine particulate matter PM2.5 [1]. This has had severe negative impacts on ecosystems [2], food safety [3], and human health [4,5]. In recent years, under the influence of a series of environmental protection plans and laws, China’s air quality has improved, but urban areas in China still face extremely high threats from PM2.5 concentrations [6], and research on the generation, distribution, and impact of PM2.5 has gradually gained attention.
To explore the changing patterns of PM2.5 and develop good policy planning to address air pollution problems, the spatiotemporal distribution characteristics, influencing factors, and health evaluations of PM2.5 have been widely studied [7,8]. The driving factors of PM2.5 concentration can be roughly divided into natural factors and social factors. Social factors such as GDP, energy consumption, human activity, government measures [9] and urban public transportation use [10] can affect the formation of air pollutants. Natural factors often affect the transfer and digestion of PM2.5, such as forests will effectively absorb PM2.5 particles, and increasing urban vegetation coverage can reduce PM2.5 pollution [11]. Meteorological conditions are considered to be one of the essential natural factors affecting PM2.5 concentration [12]. Temperature affects atmospheric stability and chemical reaction rates, and high temperatures enhance the diffusion and decomposition of PM2.5. Temperature inversion is also one of the main reasons for the high PM2.5 pollution in autumn and winter in various parts of China [13]. Air pressure often affects wind direction changes, and high air pressure promotes air concentration, which is conducive to PM2.5 accumulation [14]. Wind speed affects the diffusion rate and dilution efficiency of PM2.5 [15]. The influence of relative humidity on PM2.5 is complex, on the one hand, promoting the dissolution of PM2.5 in the air, and on the other hand, stimulating chemical reactions, further forming secondary pollutants [16]. Precipitation has a washing and settling effect on PM2.5 [17]. Therefore, meteorological conditions affect the diffusion, settlement, and chemical reaction processes of PM2.5 through various mechanisms. Due to different climates between regions, there are also spatial differences in the impact of meteorological conditions on air pollutants [9]. Offshore areas are prone to cross-border pollution caused by atmospheric circulation.
At the same time, recent research has shown that the local spatial agglomeration effect of PM2.5 at the urban agglomeration scale is more pronounced [18,19,20]. The Beijing–Tianjin–Hebei region [21], the Yangtze River Delta [22], the Pearl River Delta [23], the Jianghan–Dongting Lake Plain (Twain–Hu Basin) [24], the Central Plains urban agglomeration [25], and the Chengdu–Chongqing Basin [26] have all experienced severe regional haze problems. In addition, due to the different meteorological conditions in each urban agglomeration, the impact of meteorological conditions on PM2.5 exhibits spatial heterogeneity, and this difference is more pronounced among different urban agglomerations [27,28]. Therefore, a comprehensive analysis of PM2.5 pollution problems needs to consider the regional distribution differences of PM2.5, and urban agglomerations are an essential spatial scale for studying the regional differences in the relationship between meteorological conditions and PM2.5.
Previous research has provided detailed evidence for the linear relationship between meteorological factors and PM2.5 concentrations [27,29]. However, because of the interaction between different meteorological factors, linear correlation coefficients cannot fully explain the impact of meteorology on PM2.5 [30]. In recent years, machine learning methods have been increasingly used to predict PM2.5 concentrations. Compared with traditional statistical models, machine learning methods have stronger non-linear fitting capabilities and higher prediction accuracy [31]. Currently, many studies have attempted to use various machine learning methods to predict PM2.5 concentrations, such as logistic regression [32], support vector machines [33], decision trees [34], random forests [35], extreme gradient boosting [36], and neural networks [37]. These studies show that machine learning methods have promising applications in PM2.5 concentration prediction.
However, there are still some shortcomings in the current research on predicting the impact of meteorological conditions on PM2.5 concentration based on machine learning methods. First, most studies focus on a single machine learning method, with little comparison and analysis of the performance and applicability of different methods [32,38]. Second, existing research is mostly concentrated in specific areas and time ranges [39,40], lacking comparative analysis from the perspective of urban agglomerations [41].
In summary, this article takes six Chinese urban agglomerations as the research object, combined with PM2.5 concentration data and meteorological data of each city, and adopts various methods such as statistical analysis, spatial analysis, and machine learning. (1) it reveals the annual and monthly variation patterns and spatial distribution patterns of PM2.5 concentrations in the six urban agglomerations; (2) it measures the impact of various meteorological factors on the changes in PM2.5 concentration; (3) it constructs eight machine learning models to predict PM2.5 concentration based on the impact of various meteorological factors and compares the prediction performance of different models; (4) furthermore, it compares the importance of different meteorological factors in predicting PM2.5 concentration in different urban agglomerations and determines the most important feature for PM2.5 prediction in each urban agglomeration, contributing to the existing PM2.5 prediction research system.

2. Research Area, Data, and Methods

2.1. Research Area

As shown in Figure 1, the research area of this paper is mainland China, and six urban agglomerations are selected, including the Beijing–Tianjin–Hebei urban agglomeration (BTH-UA), Central Plains urban agglomeration (CP-UA), Yangtze River Delta urban agglomeration (YRD-UA), middle reaches of the Yangtze River urban agglomeration (YRMR-UA), Chengdu–Chongqing urban agglomeration (CY-UA), and Pearl River Delta urban agglomeration (PRD-UA). The Beijing–Tianjin–Hebei urban agglomeration is located in northern China, including two mega-cities, Beijing and Tianjin, and cities in Hebei Province, and is an important political and cultural center in China. The Central Plains urban agglomeration mainly consists of Henan Province, as well as several cities in the northern part of Anhui Province and the western part of Shandong Province, with Zhengzhou as the central city. The Yangtze River Delta urban agglomeration is located in the lower reaches of the Yangtze River, covering Shanghai and the provinces of Jiangsu, Zhejiang, and Anhui, and includes cities such as Shanghai, Nanjing, Hangzhou, and Hefei, making it one of the most economically developed regions in China. The Pearl River Delta urban agglomeration is located in the southern coastal region and is an important economic center in South China, connecting Hong Kong and Macau, and includes two mega-cities: Guangzhou and Shenzhen. The Middle Reaches of the Yangtze River urban agglomeration covers several major cities in the provinces of Hubei, Hunan, and Jiangxi. This region includes the Jianghan–Dongting Lake Plain [29] and is a new pillar of China’s economic development. The Chengdu–Chongqing urban agglomeration is located in western China, including the Sichuan Basin, and contains two large cities: Chengdu and Chongqing. The selected urban agglomerations cover the six major urban agglomerations with relatively high economic development in China, and these areas have experienced many regional PM2.5 pollution events and have received extensive academic research attention.
The selected urban agglomerations also fully consider the differences in meteorological conditions, with BTH-UA and CP-UA being urban agglomerations located in northern China, with lower average temperatures and overall humidity. Both YRD-UA and PRD-UA have coastal urban agglomerations with complex and variable meteorological conditions. The atmospheric circulation is significantly affected by marine air pressure [14], and PRD-UA is located along the southern coast, with higher average temperature, humidity, and precipitation. YRMR-UA and CY-UA are located inland, and PM2.5 pollutants are more affected by monsoons and air mass transport [24,26]. Due to the influence of latitude, topography, and other conditions, the six major urban agglomerations have distinct meteorological differences.

2.2. Research Data and Description

The time dimension of the data samples selected in this paper is from January 2017 to December 2020. The PM2.5 concentration data comes from the hourly average PM2.5 concentration monitoring data of 342 cities in China, which is provided by the China National Environmental Monitoring Center (CNEMC). The daily average PM2.5 concentration data of each city is calculated based on these data.
Meteorological data comes from the ground meteorological data of China, which is publicly available from the National Climatic Data Center (NCDC) of the United States. The data includes the average temperature (T), pressure (P), dew point temperature (TD), wind speed (WS), and precipitation (Pre) of more than 400 meteorological monitoring stations in China every 3 h. Among them, the dew point temperature is used to indirectly measure air humidity. These meteorological indicators are consistent with those of the China National Meteorological Science Data Center and are commonly adopted in many studies [42,43,44]. The 24 h daily average meteorological data of each city is obtained by calculation, and the specific indicator information is shown in Table 1. At the same time, the altitude, longitude, and latitude of the sites are obtained through the same channel.
Since the geographical levels of the two sets of data are different, the meteorological data is matched and integrated with the city PM2.5 data based on the cities where the observation stations are located. The PM2.5 concentration data and meteorological data collection of 95 cities in the six urban agglomerations from 2017 to 2020 are obtained.

2.3. Research Methods

2.3.1. Kernel Density Estimation (KDE)

Kernel Density Estimation (KDE) is a non-parametric test method. KDE does not impose any assumptions on the data distribution and is a method to study the data distribution characteristics from the data samples themselves. The estimation formula is as follows:
f ( x ) = 1 a b i = 1 a A ( x i x b )
In this paper, KDE is used to calculate the PM2.5 density function to characterize the annual PM2.5 concentration distribution of the six urban agglomerations, and the kernel density curve is plotted. The horizontal axis of the curve represents the PM2.5 concentration value, and the vertical axis represents the density. The peak value of a curve represents the highest frequency of PM2.5 concentration in a year.

2.3.2. Standard Deviation Ellipse (SDE)

Standard Deviation Ellipse (SDE), also known as directional distribution, is widely used in geographic research. In this study, the SDE depicts the standard deviation of PM2.5 concentrations in each of the six urban agglomerations in an elliptical shape, with the major and minor axes of the ellipse used to determine the degree of dispersion and distribution of PM2.5. The average center of the ellipse represents the central location of PM2.5 concentration. The movement trajectory and range change of the ellipse each year can reveal the changes in the distribution trend of PM2.5 in urban agglomerations. The analysis is conducted using the Directional Distribution (Standard Deviation Ellipse) tool in the Spatial Statistics Tools of GIS 10.8 software.

2.3.3. Pearson Correlation Coefficient

The Pearson correlation coefficient is a statistical test method used to determine the linear correlation between two variables. The Pearson correlation coefficient between two variables is defined as the product of the covariance and standard deviation of the two variables:
ρ = i = 1 n ( X i X ) ( Y i Y ) i = 1 n ( X i X ) 2 i = 1 n ( Y i Y ) 2
In this study, the Pearson correlation coefficients between the daily average PM2.5 concentration and the five meteorological factors in each city are calculated to assess the impact of each meteorological factor on PM2.5 concentration. The coefficient ranges from −1 to 1, with values from 0 to 1 indicating a positive correlation between PM2.5 concentration and meteorological factors, which contribute to the accumulation of PM2.5; values from −1 to 0 indicate a negative correlation, with meteorological factors contributing to the removal of PM2.5, and a value of 0 indicating that the meteorological factor does not affect PM2.5.

2.3.4. Machine Learning Prediction

This study attempts to use machine learning techniques to predict the PM2.5 concentration of urban agglomerations. Eight machine learning algorithms, including XGBT, KNN, LR, RF, DT, SVM, GBDT, and MLP, are used to construct regression prediction models.
DT, GBDT, RF, and XGBT are all decision tree machine learning algorithms. DT (Decision Tree) is the most basic decision tree algorithm, which can construct a decision tree model and perform classification based on a given training dataset, essentially deducing a set of classification rules from the training set. GBDT (Gradient Boosting Decision Tree) is an iterative decision tree algorithm that builds a new decision tree based on residuals in each iteration, further improving the accuracy of prediction results through iterative enhancement. RF (Random Forest) is a supervised ensemble learning method that uses decision trees to train samples in regression models, constructing a large number of decision trees and taking the average of predicted values, which is not prone to overfitting and has a fast training speed [42]. XGBT (XGBoost) is an enhanced decision tree method that can create better learners based on model residuals and implement distributed gradient boosting, improving the algorithm compared to traditional GBDT and better controlling model complexity, which has been widely used in predicting regional PM2.5 concentrations [36,45]. KNN (K-Nearest Neighbor) is a method in which a sample has k nearest neighbors, and the weighted average value of these neighboring samples is assigned to the sample based on their features, thus generating a prediction [46]. LR (Linear Regression) is the simplest regression model, involving only one independent variable, and is widely used in PM2.5 prediction and various comparative studies of prediction methods [47]. Support Vector Machine (SVM) is a discriminative classifier technique that can use kernel functions to make the original linear algorithm “non-linearized” and is widely used in small sample set prediction [48]. MLP (Multilayer Perceptron), also known as Artificial Neural Network (ANN), is a neural network composed of multiple perceptrons, which has significant advantages in dealing with nonlinear systems [49].

2.3.5. Machine Learning Model Evaluation

In evaluating the accuracy of the model, the Root Mean Square Error (RMSE) of the machine learning prediction dataset is calculated to evaluate the model, and RMSE is one of the elements widely used to measure the performance of regression model prediction [49,50].
R M S E = 1 m i = 1 m ( y t e s t ( i ) y ^ t e s t i ) 2
Next, the Mean Cross-Validation Scores (MCVS) of the root mean square errors calculated by 10-fold cross-validation are used to further evaluate the predictive performance of the model. The eight models mentioned above use stratified random sampling to divide the dataset into 80/20 proportions for training and testing, respectively. The prediction models are then subjected to 10-fold cross-validation, dividing the dataset into 10 equal parts, using one part as the test set and the remaining nine parts as the training set, and calculating the accuracy of the root mean square error of the model multiple times to evaluate the average accuracy of the model. Both RMSE and MCVS reflect the deviation between predicted and true values, and the smaller the value, the greater the accuracy of the regression model.
The research method framework is shown in Figure 2.

3. Spatiotemporal Characteristics of PM2.5 in Six Major Urban Agglomerations

3.1. Annual Variation in PM2.5 Concentration

The kernel density estimates of PM2.5 concentration from 2017 to 2020 in six urban agglomerations are shown in Figure 3. According to the kernel density curves, the peaks of the curves for the six major urban agglomerations from 2017 to 2020 become steeper and shift to the left with the change of years, indicating that the PM2.5 concentration in the urban agglomerations continues to decrease annually, and the number of days with low PM2.5 concentration is increasing. The density curves above 40 µg/m3 decrease steadily and become lower year by year, indicating that the frequency of high PM2.5 concentration days above 40 µg/m3 is decreasing, and the air quality in urban agglomerations is getting better. The PM2.5 concentrations in all urban agglomerations in 2018 and 2020 have significant changes compared with the previous year, which may be due to the amendment of the Air Pollution Prevention and Control Law in 2018 and the implementation of the Three-Year Action Plan for Winning the Blue Sky Defense War, resulting in good results in comprehensive air pollution control [51].
From 2017 to 2020, the average PM2.5 concentrations in BTH-UA, CP-UA YRD-UA, YRMR-UA, CY-UA, and PRD-UA were 45.5, 57.3, 36.8, 43.7, 41, and 27.4 µg/m3, respectively. The annual average reduction in PM2.5 concentration in the six urban agglomerations was 5.05, 5.38, 3.84, 4.79, 4.73, and 4.22 µg/m3, respectively. Urban agglomerations with higher pollution levels had relatively higher rates of decrease in PM2.5 concentration.
PRD-UA had the lowest average PM2.5 concentration, and the PM2.5 concentration corresponding to the peak of the kernel density curve in PRD-UA from 2017 to 2020 was below 20 µg/m3, indicating that the overall PM2.5 pollution level in PRD-UA was relatively low. CP-UA had the highest average PM2.5 concentration, and the PM2.5 concentration corresponding to the peak of the kernel density curve in CP-UA in 2017 was higher than 40 µg/m3, which was more than 10 µg/m3 higher than the second place CY-UA. Although there was some improvement from 2018 to 2020, the PM2.5 concentration corresponding to the peak was still higher than 20 µg/m3, indicating that the pollution in CP was relatively the most severe.

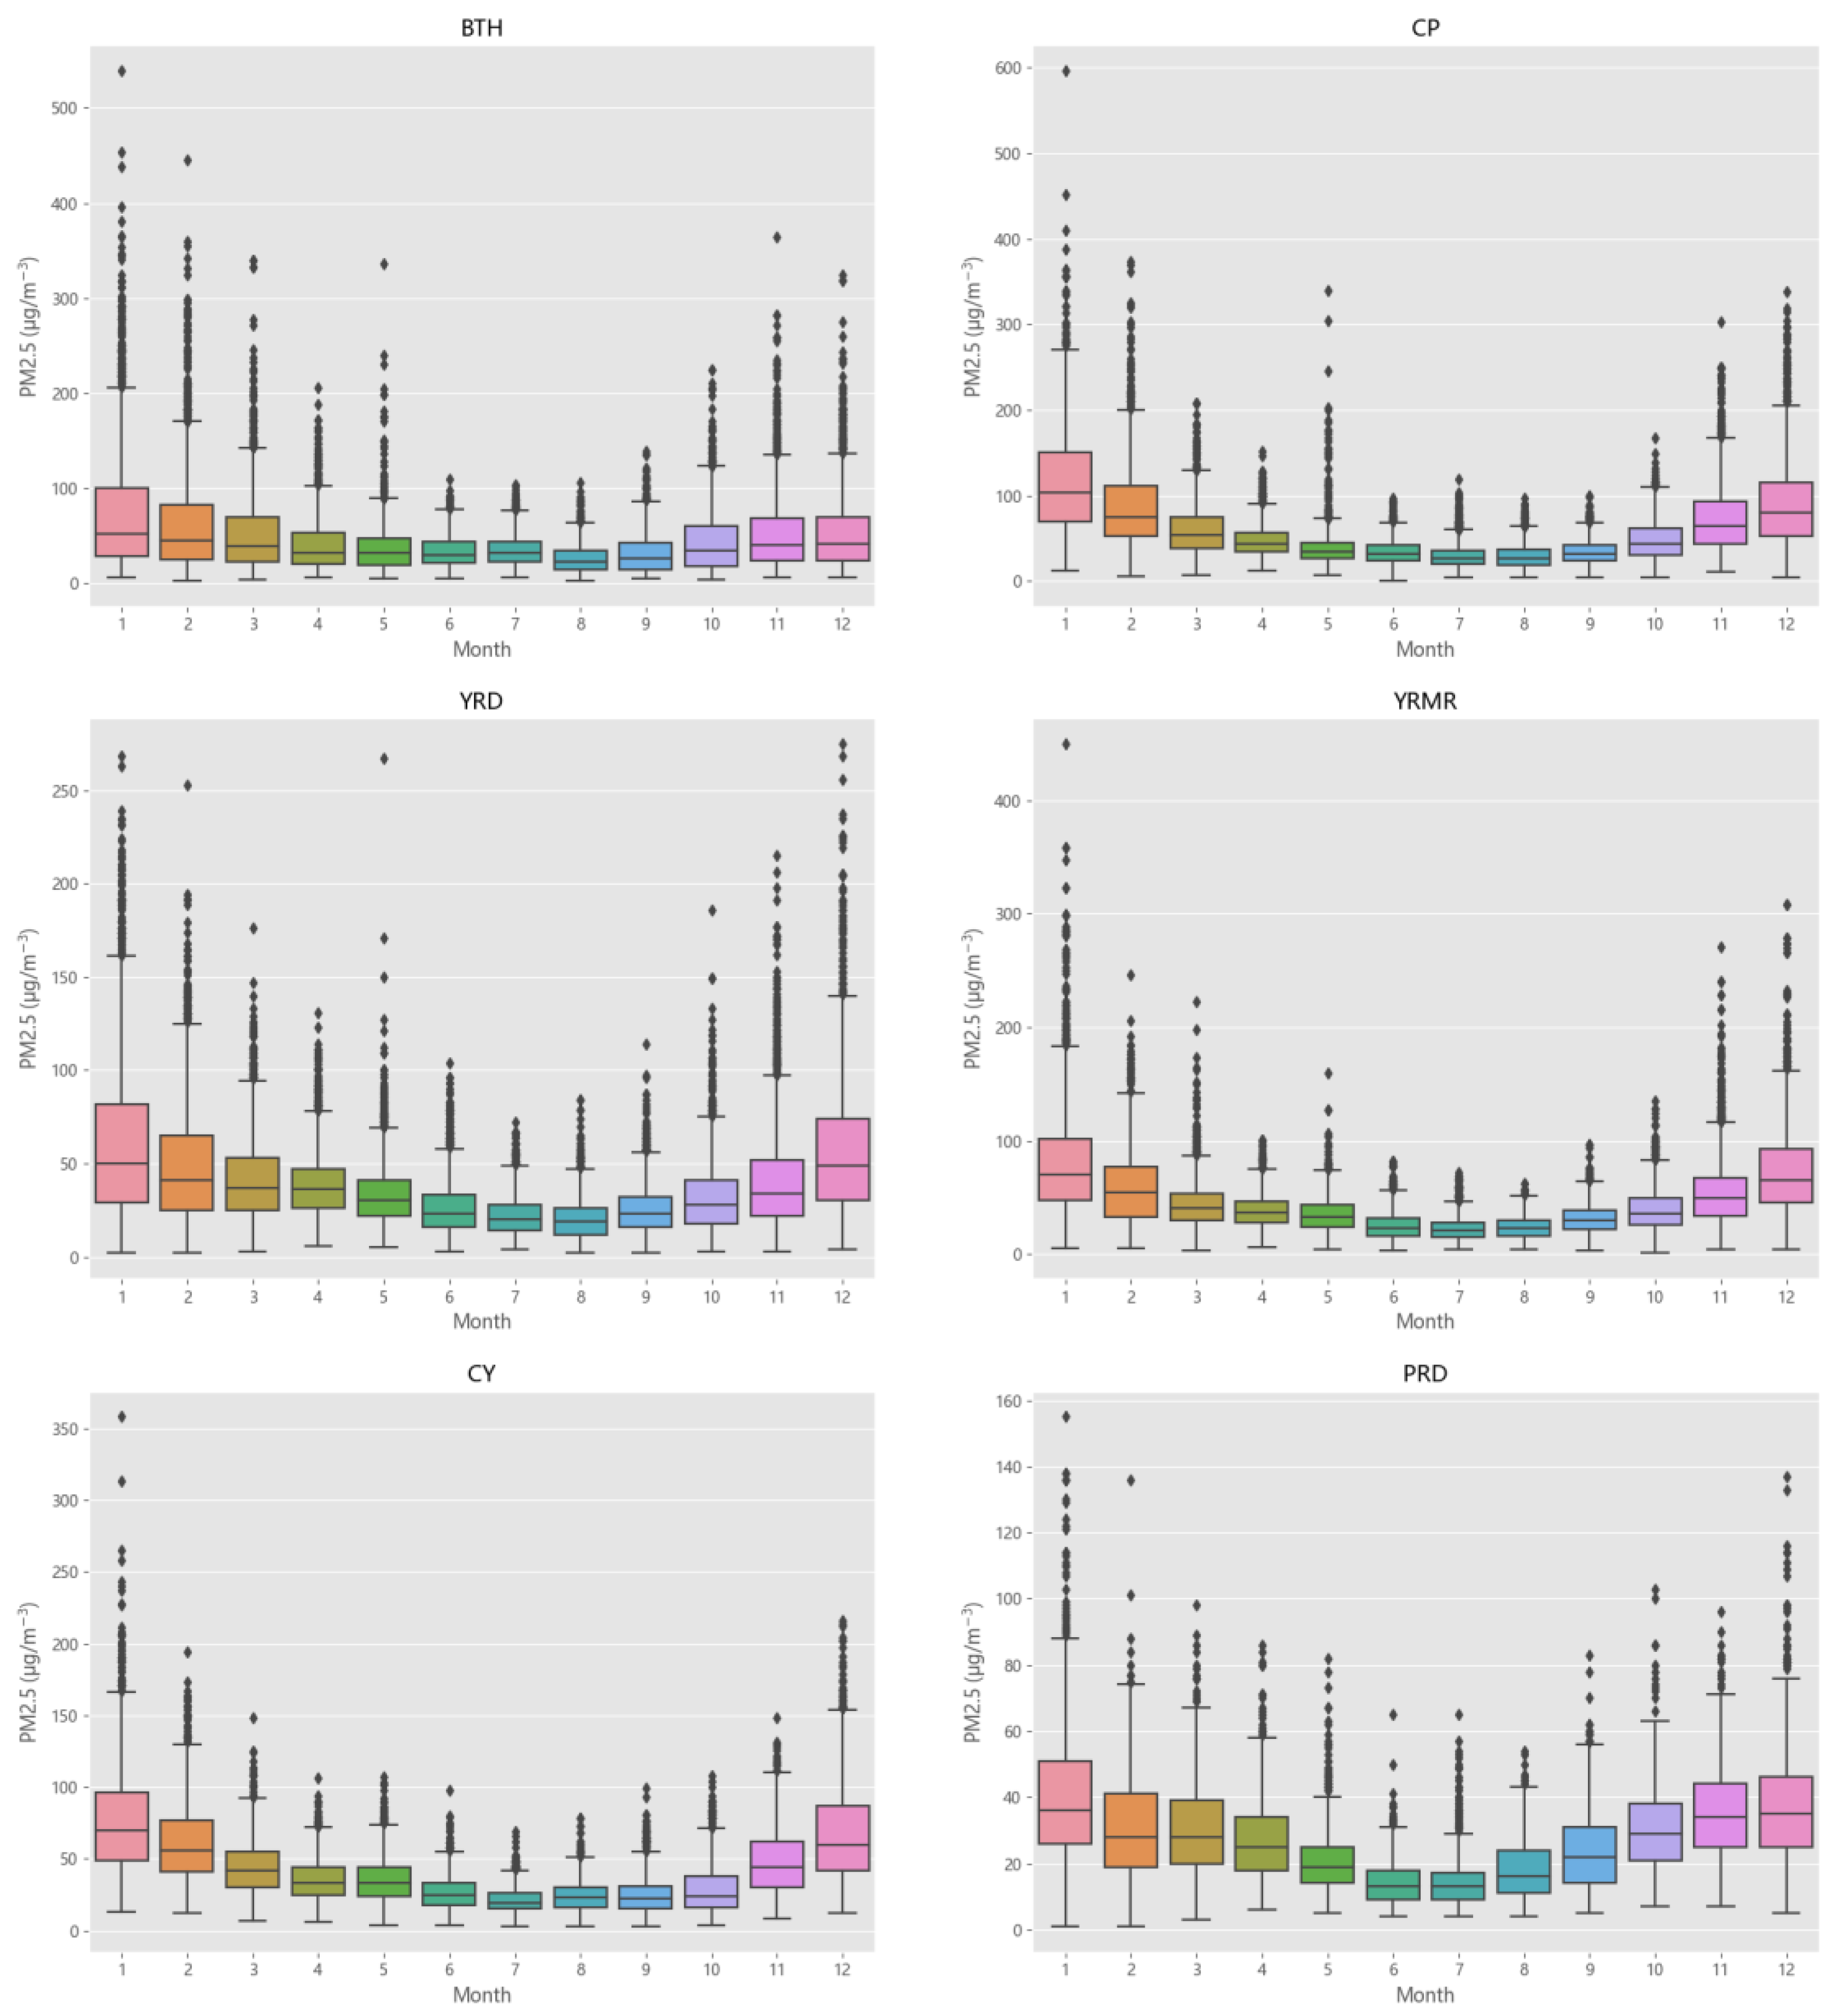
3.2. Monthly Variation in PM2.5 Concentration

The monthly Variation in PM2.5 concentration in the six major urban agglomerations from 2017 to 2020 is shown in Figure 4. PM2.5 concentrations in various regions of China show a U-shaped trend with high concentrations in autumn and winter and low concentrations in spring and summer. The average PM2.5 concentration in January is generally the highest, with the highest daily PM2.5 concentration also occurring in January. The PM2.5 concentration decreases from January to June, remains stable and has the lowest average concentration from July to September, and begins to increase from October to December. The lowest PM2.5 concentration in BTH-UA occurs in August, while the lowest PM2.5 concentration in CP-UA, YRD-UA, YRMR-UA, and CY-UA occurs in July, and the lowest PM2.5 concentration in PRD-UA occurs in June and July. The pollution levels in BTH-UA and CP-UA in autumn and winter are more severe than other urban agglomerations.

3.3. Standard Deviation Ellipse Analysis

The SDE method was used to characterize the spatial distribution characteristics of PM2.5 concentration in the six major urban agglomerations. As shown in Figure 5, the ellipse features of the six major urban agglomerations are different, indicating different spatial patterns of PM2.5. The average center of the ellipse is located in the central city of each urban agglomeration. In BTH-UA, PM2.5 is mainly distributed along the northeast-southwest direction; the ellipse azimuth angle decreases from 58.09 in 2018 to 56.43 in 2020, and the ellipse area keeps shrinking, with the overall spatial pattern shifting eastward and contracting; the average center is located between Beijing and Tianjin. CP-UA has a relatively round ellipse, with a ratio of the major axis to the minor axis smaller than that of other urban agglomerations, around 1.5, and the overall distribution is in the northwest–southeast direction. YRD-UA is mainly distributed in the northwest–southeast direction, which is more in line with the main city distribution of Hefei–Nanjing–Shanghai–Hangzhou, with the average center located in Nanjing, and the azimuth angle fluctuating around 142.3, with no obvious moving trend. YRMR-UA’s PM2.5 concentration is generally distributed in the northwest–southeast direction, with the center located in Wuhan. CY-UA is generally distributed in the northeast-southwest direction, with the ellipse azimuth angle consistently around 83, closer to the east–west distribution. The ratio of the major axis to the minor axis increases from 1.95 in 2017 to 2.01 in 2020, and the PM2.5 distribution becomes more dispersed. PRD-UA’s ellipse azimuth angle remains around 82, and the overall PM2.5 concentration is distributed in the northeast-southwest direction, close to the east–west distribution, with the center located in Guangzhou.

4. Relationship between Meteorological Conditions and PM2.5 Concentration

In order to comprehensively explore the variation rules of PM2.5 concentration in different urban agglomerations, this paper calculates the Pearson correlation coefficients between PM2.5 concentration and various meteorological factors in different cities from 2017 to 2020.
As shown in Figure 6a, the temperature in all cities of the six major urban agglomerations is negatively correlated with PM2.5 concentration, and the temperature factor has a negative impact on PM2.5 concentration as a whole. The maximum Pearson coefficient occurs in Beijing, with a value of −0.084, and the negative correlation in BTH-UA presents a “weaker north, stronger south” distribution. The minimum value occurs in Nanyang, Henan Province, with a value of −0.62. It can be seen from the figure that the negative correlation in Henan, Anhui, and Hubei provinces is stronger than in other regions.
As shown in Figure 6b, the dew point temperature in almost all cities is negatively correlated with PM2.5 concentration, except for Beijing, which has the maximum Pearson coefficient of 0.062. The minimum value occurs in Yichang, Hubei Province, with a value of −0.6. The negative correlation is stronger in the southern part of CP-UA, the western part of YRD-UA, YRMR-UA, and CY-UA. Compared with temperature, the negative correlation between dew point temperature and PM2.5 concentration shifts to the south, and the negative correlation in the southern region is more obvious. There is almost no correlation in BTH-UA.
As shown in Figure 6c, the air pressure in almost all cities is positively correlated with PM2.5 concentration. The layout of the Pearson correlation coefficients of air pressure is similar to that of dew point temperature, but the degree is opposite. The negative correlation is only in Beijing, with a Pearson coefficient of −0.023, and there is almost no correlation in the capital economic circle cities in the northern part of BTH-UA. The maximum Pearson coefficient is 0.56, which occurs in Fuyang, Anhui Province, and the correlation is stronger in Henan, Anhui, and Hubei provinces.
As shown in Figure 6d, the wind speed in most cities is negatively correlated with PM2.5 concentration, while a few cities such as Emeishan (Sichuan Province), Youyang and Changsha (Hunan Province) are positively correlated, with Pearson coefficients of 0.26, 0.053, and 0.02, respectively. The areas with higher negative correlation are concentrated in the eastern coastal areas of YRD-UA, the capital economic circle of BTH-UA, PRD-UA, and CY-UA.
As shown in Figure 6e, precipitation is negatively correlated with PM2.5 concentration, and the higher the latitude, the stronger the negative correlation. The negative correlation becomes more obvious from north to south. CY-UA, PRD-UA, and the southern part of YRMR-UA all show higher negative correlation. Precipitation is also the main meteorological influence in most coastal areas [17], and the influence in coastal cities of YRD-UA and PRD-UA is more obvious than in inland cities.
In summary, there are significant regional differences in the impact of meteorological conditions on PM2.5. In some inland cities, temperature is the main factor affecting PM2.5 concentration [12]. In some coastal cities, precipitation has a greater impact on PM2.5 concentration. As shown in Figure 6, the overall influence of meteorology on PM2.5 is stronger in the south than in the north, and stronger in the inland than in the coastal areas.

5. PM2.5 Concentration Prediction in China’s Urban Agglomerations Based on Machine Learning Methods

The RMSE and MCVS of the PM2.5 concentration and meteorological condition training dataset for the six major urban agglomerations, as shown in Table 2 and Table 3, were obtained after learning prediction and 10-fold cross-validation by each model. To compare the prediction accuracy from the perspective of the six major urban agglomerations, the mean RMSE and MCVS obtained by all models’ predictions for each urban agglomeration are calculated, represented by Mean-UA. The larger the Mean-UA, the lower the prediction accuracy of the urban agglomeration, and the smaller the relative influence of meteorological conditions on PM2.5. The average RMSE and MCVS levels of BTH-UA and CP-UA, two northern urban agglomerations, are higher than those of other urban agglomerations, with a difference of more than 10, indicating larger prediction errors. PRD-UA has the lowest average RMSE and MCVS levels, with smaller prediction errors. The ranking of urban agglomerations by prediction error size is consistent with the ranking of RMSE and MCVS mean levels, from high to low: BTH-UA, CP-UA, YRMR-UA, CY-UA, YRD-UA, PRD-UA.
To compare the prediction accuracy of the eight machine learning models, the mean RMSE and MCVS obtained by each machine learning model for all urban agglomerations are calculated, represented by Mean-ML. The larger the Mean-ML, the worse the prediction performance of the machine learning model. Comparing the Mean-ML, the MLP model achieves the lowest RMSE and MCVS, and almost the lowest RMSE and MCVS in predicting all urban agglomerations, with the best prediction performance. The performance of GBDT and XGBT models is close to that of MLP. The DT model has the highest RMSE and MCVS, with the worst prediction performance. The ranking of Mean-ML by size is consistent with the ranking of RMSE and MCVS, from good to bad prediction performance: MLP, GBDT, XGBT, KNN, RF, LR, SVM, DT.
As mentioned above, the MLP model achieves the best prediction performance. Based on the MLP model, the feature importance recognition of PM2.5 concentration affected by meteorological factors for the six major urban agglomerations is shown in Figure 7. Among the six major urban agglomerations, temperature is the most significant predictor, while wind speed and precipitation rank second to last and last, respectively. The predictive contribution capabilities of air pressure and dew point temperature are similar, but their contribution levels vary regionally. In BTH-UA, YRD-UA, YRMR-UA, and CP-UA, the predictive contribution of air pressure is higher than that of dew point temperature, while in CY-UA and PRD-UA, the predictive contribution of dew point temperature is higher than that of air pressure.

6. Discussion

Based on the above content, this study explores the spatiotemporal distribution of PM2.5 in different urban agglomerations and the impact of meteorological factors on PM2.5 from the perspective of six major urban agglomerations in China, and compares the prediction of PM2.5 in the six major urban agglomerations using eight different machine learning algorithms.
Firstly, according to the kernel density estimation and time series analysis of PM2.5 concentration monthly changes, it is found that the PM2.5 density of all urban agglomerations decreases year by year from 2017 to 2020, with the highest PM2.5 concentration in January and December in winter and the lowest in June-August in summer. CP-UA has the highest PM2.5 density and average concentration, with relatively more severe pollution, while PRD-UA has relatively lighter pollution. The mean center of the standard deviation ellipse is located in the central city of the urban agglomeration, and the PM2.5 distribution range of BTH-UA has a significant contraction. This is similar to the conclusions of most PM2.5 distribution studies, where autumn and winter are the seasons with high PM2.5 pollution [27,28], PM2.5 has a central city agglomeration trend [22,23,25], and the pollution in the northern region is more severe [52] due to the large industrial energy consumption and winter heating emissions [23], and has been subject to a large number of environmental remediation plans in recent years [51,53].
Secondly, similar to previous studies, this paper reveals the impact of meteorological conditions on PM2.5 through Pearson correlation coefficient test, and finds that temperature, dew point temperature, wind speed, and precipitation are negatively correlated with PM2.5 concentration, while air pressure is positively correlated. Among them, the influence of wind speed and precipitation is relatively small, and there are significant differences in meteorological conditions and their impact on PM2.5 in different parts of China. For example, precipitation has a greater impact on coastal areas [54], and precipitation has a dual impact on PM2.5 [55]. The frequency of strong winds in winter in North China is relatively high [17]. In BTH-UA, the impact of meteorological factors other than wind speed is almost negligible, which basically confirms that the impact of human factors on PM2.5 accumulation in BTH-UA is more significant [23].
Next, the study uses eight machine learning algorithms to predict the impact of meteorological factors on PM2.5 concentration. According to RMSE and MCVS, the urban agglomerations and machine learning models with the highest prediction accuracy are obtained. In terms of urban agglomeration prediction accuracy comparison, the ranking of prediction accuracy is similar to the ranking of the average concentration of PM2.5 in urban agglomerations. BTH-UA has the worst prediction accuracy among all urban agglomerations, while PRD-UA has the best prediction accuracy. This is consistent with previous studies showing that coastal areas are significantly affected by meteorological factors [54], and northern areas are affected by multiple factors such as meteorology and society [16].
In terms of model prediction accuracy comparison, MLP is the model with the highest prediction accuracy, which means that the overall impact of meteorology on PM2.5 is a relatively complex system, and the characteristics of nonlinear relationships are more obvious [49]. At the same time, the study found that the prediction performance of the two iterative machine learning algorithms, GBDT and XGBT, is good. The classic basic model, decision tree, has the worst prediction performance for PM2.5 among all models, indicating that complex and integrated learning models are more suitable for predicting the impact of meteorology on PM2.5.
Finally, based on the best prediction accuracy MLP model, the feature contribution of PM2.5 in the six major urban agglomerations is further compared and analyzed. It is concluded that temperature is the most significant contributing factor affecting PM2.5 in all urban agglomerations, while wind speed and precipitation are the least influential factors. Different urban agglomerations have different degrees of influence on air pressure and dew point temperature. This is consistent with the impact relationship obtained by Pearson correlation coefficient, and there are significant regional differences in precipitation and wind speed. In the study of multiple meteorological factors, it is also confirmed that temperature has the strongest and most stable impact on PM2.5 concentration in all seasons nationwide [17].
Compared to previous research, this article has some innovative points. Firstly, considering the regional differences in meteorological conditions, we adopt urban agglomerations as the research scale, which are a new model of regional economic development in modern countries. This scale is conducive to discussing the characteristics of several economically concentrated areas. Compared to traditional single city scale research, it has stronger generalizability and better illustrates the regional characteristics of meteorological conditions. Secondly, in terms of the breadth of methods, this study provides a comprehensive analysis framework for the research on meteorological conditions and PM2.5 from the perspective of urban agglomerations, by illustrating the current situation of PM2.5 concentration spatiotemporal distribution, explaining the impact relationship between meteorology and PM2.5, and predicting the feature importance of impact factors. In terms of research depth, this study applied eight widely accepted machine learning algorithms to construct prediction models and found that the MLP model achieved high accuracy. MLP was further used to determine the importance ranking of meteorological conditions in different urban agglomerations, providing artificial intelligence technology support for the analysis of key influencing factors of PM2.5 concentration in various regions, and contributing to the formulation of air pollution control policies. This study is also one of the few studies that compares various machine learning models to predict PM2.5 concentrations considering the effects of different urban agglomerations and meteorological conditions. Our results contribute to the expansion of research in this field, providing useful and comprehensive information for researchers seeking to determine the most suitable model for decision-making.
There are also many shortcomings in this study. Firstly, this study only considers the impact of meteorological conditions on PM2.5, and other factors that have been extensively studied, such as human emissions and geographical environment, have not been incorporated into the model analysis. As can be seen from this study, based on Pearson coefficient calculation, the impact of most meteorological factors on BTH area is close to 0, indicating that human emissions and other factors still play a relatively important role in causing PM2.5 pollution in the north. Secondly, this study is based on regression models to predict regional PM2.5 concentrations, and further research is needed for the prediction analysis of classification models. Thirdly, feature contribution is only based on the feature importance of the MLP model, without a more in-depth feature selection and construction of new features process. We will further overcome these shortcomings, improve the depth and breadth of machine learning, and maximize the accuracy of PM2.5 prediction to lay a more accurate scientific foundation for improving air quality in China.

Author Contributions

Determining the writing theme, review and methodology, M.D.; conceptualization, data curation, original draft writing and editing, Y.S.; data curation, review and editing; B.Z.; data curation, editing; C.C.; supervisors and directors, T.T.; supervisors and directors, Y.Z. All authors have read and agreed to the published version of the manuscript.

Funding

This work was supported by ‘111’ project (Grant No. B17024).

Institutional Review Board Statement

Not applicable.

Informed Consent Statement

Not applicable.

Data Availability Statement

The datasets generated during and/or analyzed during the current study are available from the corresponding author on reasonable request.

Acknowledgments

The authors gratefully acknowledge the anonymous reviewers for their excellent comments and efforts.

Conflicts of Interest

The authors declare no conflict of interest.

References

  1. Yue, H.; He, C.; Huang, Q.; Yin, D.; Bryan, B.A. Stronger Policy Required to Substantially Reduce Deaths from PM2.5 Pollution in China. Nat. Commun. 2020, 11, 1462. [Google Scholar] [CrossRef] [PubMed]
  2. Wu, X.; Xin, J.; Zhang, X.; Klaus, S.; Wang, Y.; Wang, L.; Wen, T.; Liu, Z.; Si, R.; Liu, G.; et al. A New Approach of the Normalization Relationship between PM2.5 and Visibility and the Theoretical Threshold, a Case in North China. Atmos. Res. 2020, 245, 105054. [Google Scholar] [CrossRef]
  3. Zhou, L.; Chen, X.; Tian, X. The Impact of Fine Particulate Matter (PM2.5) on China’s Agricultural Production from 2001 to 2010. J. Clean. Prod. 2018, 178, 133–141. [Google Scholar] [CrossRef]
  4. Burnett, R.; Chen, H.; Szyszkowicz, M.; Fann, N.; Hubbell, B.; Pope, C.A.; Apte, J.S.; Brauer, M.; Cohen, A.; Weichenthal, S.; et al. Global Estimates of Mortality Associated with Long-Term Exposure to Outdoor Fine Particulate Matter. Proc. Natl. Acad. Sci. USA 2018, 115, 9592–9597. [Google Scholar] [CrossRef] [PubMed]
  5. Shou, Y.; Huang, Y.; Zhu, X.; Liu, C.; Hu, Y.; Wang, H. A Review of the Possible Associations between Ambient PM2.5 Exposures and the Development of Alzheimer’s Disease. Ecotoxicol. Environ. Saf. 2019, 174, 344–352. [Google Scholar] [CrossRef] [PubMed]
  6. Yang, X.; Jiang, L.; Zhao, W.; Xiong, Q.; Zhao, W.; Yan, X. Comparison of Ground-Based PM2.5 and PM10 Concentrations in China, India, and the U.S. Int. J. Environ. Res. Public Health 2018, 15, 1382. [Google Scholar] [CrossRef]
  7. Geng, G.; Xiao, Q.; Liu, S.; Liu, X.; Cheng, J.; Zheng, Y.; Xue, T.; Tong, D.; Zheng, B.; Peng, Y.; et al. Tracking Air Pollution in China: Near Real-Time PM 2.5 Retrievals from Multisource Data Fusion. Environ. Sci. Technol. 2021, 55, 12106–12115. [Google Scholar] [CrossRef]
  8. Huang, C.; Hu, J.; Xue, T.; Xu, H.; Wang, M. High-Resolution Spatiotemporal Modeling for Ambient PM 2.5 Exposure Assessment in China from 2013 to 2019. Environ. Sci. Technol. 2021, 55, 2152–2162. [Google Scholar] [CrossRef]
  9. Wong, Y.J.; Yeganeh, A.; Chia, M.Y.; Shiu, H.Y.; Ooi, M.C.G.; Chang, J.H.W.; Shimizu, Y.; Ryosuke, H.; Try, S.; Elbeltagi, A. Quantification of COVID-19 Impacts on NO2 and O3: Systematic Model Selection and Hyperparameter Optimization on AI-Based Meteorological-Normalization Methods. Atmos. Environ. 2023, 301, 119677. [Google Scholar] [CrossRef]
  10. Wong, Y.J.; Shiu, H.-Y.; Chang, J.H.-H.; Ooi, M.C.G.; Li, H.-H.; Homma, R.; Shimizu, Y.; Chiueh, P.-T.; Maneechot, L.; Nik Sulaiman, N.M. Spatiotemporal Impact of COVID-19 on Taiwan Air Quality in the Absence of a Lockdown: Influence of Urban Public Transportation Use and Meteorological Conditions. J. Clean. Prod. 2022, 365, 132893. [Google Scholar] [CrossRef]
  11. Wu, W.; Zhang, M.; Ding, Y. Exploring the Effect of Economic and Environment Factors on PM2.5 Concentration: A Case Study of the Beijing-Tianjin-Hebei Region. J. Environ. Manag. 2020, 268, 110703. [Google Scholar] [CrossRef] [PubMed]
  12. Chen, Z.; Chen, D.; Zhao, C.; Kwan, M.; Cai, J.; Zhuang, Y.; Zhao, B.; Wang, X.; Chen, B.; Yang, J.; et al. Influence of Meteorological Conditions on PM2.5 Concentrations across China: A Review of Methodology and Mechanism. Environ. Int. 2020, 139, 105558. [Google Scholar] [CrossRef] [PubMed]
  13. Qi, L.; Zheng, H.; Ding, D.; Ye, D.; Wang, S. Effects of Meteorology Changes on Inter-Annual Variations of Aerosol Optical Depth and Surface PM2.5 in China—Implications for PM2.5 Remote Sensing. Remote Sens. 2022, 14, 2762. [Google Scholar] [CrossRef]
  14. Chen, Y.; Fung, J.C.H.; Chen, D.; Shen, J.; Lu, X. Source and Exposure Apportionments of Ambient PM2.5 under Different Synoptic Patterns in the Pearl River Delta Region. Chemosphere 2019, 236, 124266. [Google Scholar] [CrossRef]
  15. Liu, Y.; Shi, G.; Zhan, Y.; Zhou, L.; Yang, F. Characteristics of PM2.5 Spatial Distribution and Influencing Meteorological Conditions in Sichuan Basin, Southwestern China. Atmos. Environ. 2021, 253, 118364. [Google Scholar] [CrossRef]
  16. Cheng, Y.; He, K.; Du, Z.; Zheng, M.; Duan, F.; Ma, Y. Humidity Plays an Important Role in the PM2.5 Pollution in Beijing. Environ. Pollut. 2015, 197, 68–75. [Google Scholar] [CrossRef]
  17. Chen, Z.; Xie, X.; Cai, J.; Chen, D.; Gao, B.; He, B.; Cheng, N.; Xu, B. Understanding Meteorological Influences on PM2.5; Concentrations across China: A Temporal and Spatial Perspective. Atmos. Chem. Phys. 2018, 18, 5343–5358. [Google Scholar] [CrossRef]
  18. Ouyang, X.; Wei, X.; Li, Y.; Wang, X.-C.; Klemeš, J.J. Impacts of Urban Land Morphology on PM2.5 Concentration in the Urban Agglomerations of China. J. Environ. Manag. 2021, 283, 112000. [Google Scholar] [CrossRef]
  19. Li, G.; Fang, C.; Wang, S.; Sun, S. The Effect of Economic Growth, Urbanization, and Industrialization on Fine Particulate Matter (PM2.5) Concentrations in China. Environ. Sci. Technol. 2016, 50, 11452–11459. [Google Scholar] [CrossRef]
  20. Cheng, Z.; Li, L.; Liu, J. Identifying the Spatial Effects and Driving Factors of Urban PM2.5 Pollution in China. Ecol. Indic. 2017, 82, 61–75. [Google Scholar] [CrossRef]
  21. Yan, D.; Lei, Y.; Shi, Y.; Zhu, Q.; Li, L.; Zhang, Z. Evolution of the Spatiotemporal Pattern of PM2.5 Concentrations in China—A Case Study from the Beijing-Tianjin-Hebei Region. Atmos. Environ. 2018, 183, 225–233. [Google Scholar] [CrossRef]
  22. Xu, G.; Ren, X.; Xiong, K.; Li, L.; Bi, X.; Wu, Q. Analysis of the Driving Factors of PM2.5 Concentration in the Air: A Case Study of the Yangtze River Delta, China. Ecol. Indic. 2020, 110, 105889. [Google Scholar] [CrossRef]
  23. Pan, Y.; Zhu, Y.; Jang, J.; Wang, S.; Xing, J.; Chiang, P.-C.; Zhao, X.; You, Z.; Yuan, Y. Source and Sectoral Contribution Analysis of PM2.5 Based on Efficient Response Surface Modeling Technique over Pearl River Delta Region of China. Sci. Total Environ. 2020, 737, 139655. [Google Scholar] [CrossRef]
  24. Bai, Y.; Zhao, T.; Hu, W.; Zhou, Y.; Xiong, J.; Wang, Y.; Liu, L.; Shen, L.; Kong, S.; Meng, K.; et al. Meteorological Mechanism of Regional PM2.5 Transport Building a Receptor Region for Heavy Air Pollution over Central China. Sci. Total Environ. 2022, 808, 151951. [Google Scholar] [CrossRef] [PubMed]
  25. Liu, X.; Zhao, C.; Shen, X.; Jin, T. Spatiotemporal Variations and Sources of PM2.5 in the Central Plains Urban Agglomeration, China. Air Qual. Atmos. Health 2022, 15, 1507–1521. [Google Scholar] [CrossRef]
  26. Cai, K.; Zhang, Q.; Li, S.; Li, Y.; Ge, W. Spatial–Temporal Variations in NO2 and PM2.5 over the Chengdu–Chongqing Economic Zone in China during 2005–2015 Based on Satellite Remote Sensing. Sensors 2018, 18, 3950. [Google Scholar] [CrossRef]
  27. Li, Z.; Zhang, X.; Liu, X.; Yu, B. PM2.5 Pollution in Six Major Chinese Urban Agglomerations: Spatiotemporal Variations, Health Impacts, and the Relationships with Meteorological Conditions. Atmosphere 2022, 13, 1696. [Google Scholar] [CrossRef]
  28. Luo, H.; Han, Y.; Cheng, X.; Lu, C.; Wu, Y. Spatiotemporal Variations in Particulate Matter and Air Quality over China: National, Regional and Urban Scales. Atmosphere 2020, 12, 43. [Google Scholar] [CrossRef]
  29. Chen, L.; Zhu, J.; Liao, H.; Yang, Y.; Yue, X. Meteorological Influences on PM2.5 and O3 Trends and Associated Health Burden since China’s Clean Air Actions. Sci. Total Environ. 2020, 744, 140837. [Google Scholar] [CrossRef]
  30. Chen, Z.; Cai, J.; Gao, B.; Xu, B.; Dai, S.; He, B.; Xie, X. Detecting the Causality Influence of Individual Meteorological Factors on Local PM2.5 Concentration in the Jing-Jin-Ji Region. Sci. Rep. 2017, 7, 40735. [Google Scholar] [CrossRef]
  31. Karimian, H.; Li, Q.; Wu, C.; Qi, Y.; Mo, Y.; Chen, G.; Zhang, X.; Sachdeva, S. Evaluation of Different Machine Learning Approaches to Forecasting PM2.5 Mass Concentrations. Aerosol Air Qual. Res. 2019, 19, 1400–1410. [Google Scholar] [CrossRef]
  32. Tian, H.; Zhao, Y.; Luo, M.; He, Q.; Han, Y.; Zeng, Z. Estimating PM2.5 from Multisource Data: A Comparison of Different Machine Learning Models in the Pearl River Delta of China. Urban Clim. 2021, 35, 100740. [Google Scholar] [CrossRef]
  33. Zhou, Y.; Chang, F.-J.; Chang, L.-C.; Kao, I.-F.; Wang, Y.-S.; Kang, C.-C. Multi-Output Support Vector Machine for Regional Multi-Step-Ahead PM2.5 Forecasting. Sci. Total Environ. 2019, 651, 230–240. [Google Scholar] [CrossRef] [PubMed]
  34. He, W.; Meng, H.; Han, J.; Zhou, G.; Zheng, H.; Zhang, S. Spatiotemporal PM2.5 Estimations in China from 2015 to 2020 Using an Improved Gradient Boosting Decision Tree. Chemosphere 2022, 296, 134003. [Google Scholar] [CrossRef] [PubMed]
  35. Zhao, C.; Wang, Q.; Ban, J.; Liu, Z.; Zhang, Y.; Ma, R.; Li, S.; Li, T. Estimating the Daily PM2.5 Concentration in the Beijing-Tianjin-Hebei Region Using a Random Forest Model with a 0.01° × 0.01° Spatial Resolution. Environ. Int. 2020, 134, 105297. [Google Scholar] [CrossRef] [PubMed]
  36. Pan, B. Application of XGBoost Algorithm in Hourly PM2.5 Concentration Prediction. IOP Conf. Ser. Earth Environ. Sci. 2018, 113, 012127. [Google Scholar] [CrossRef]
  37. He, Z.; Guo, Q.; Wang, Z.; Li, X. Prediction of Monthly PM2.5 Concentration in Liaocheng in China Employing Artificial Neural Network. Atmosphere 2022, 13, 1221. [Google Scholar] [CrossRef]
  38. Chen, G.; Li, S.; Knibbs, L.D.; Hamm, N.A.S.; Cao, W.; Li, T.; Guo, J.; Ren, H.; Abramson, M.J.; Guo, Y. A Machine Learning Method to Estimate PM2.5 Concentrations across China with Remote Sensing, Meteorological and Land Use Information. Sci. Total Environ. 2018, 636, 52–60. [Google Scholar] [CrossRef]
  39. Wang, M.; Wang, Y.; Teng, F.; Li, S.; Lin, Y.; Cai, H. Estimation and Analysis of PM2.5 Concentrations with NPP-VIIRS Nighttime Light Images: A Case Study in the Chang-Zhu-Tan Urban Agglomeration of China. Int. J. Environ. Res. Public Health 2022, 19, 4306. [Google Scholar] [CrossRef]
  40. Chen, W.; Ran, H.; Cao, X.; Wang, J.; Teng, D.; Chen, J.; Zheng, X. Estimating PM2.5 with High-Resolution 1-Km AOD Data and an Improved Machine Learning Model over Shenzhen, China. Sci. Total Environ. 2020, 746, 141093. [Google Scholar] [CrossRef]
  41. Shen, Y.; Zhang, L.; Fang, X.; Ji, H.; Li, X.; Zhao, Z. Spatiotemporal Patterns of Recent PM2.5 Concentrations over Typical Urban Agglomerations in China. Sci. Total Environ. 2019, 655, 13–26. [Google Scholar] [CrossRef] [PubMed]
  42. Zamani Joharestani, M.; Cao, C.; Ni, X.; Bashir, B.; Talebiesfandarani, S. PM2.5 Prediction Based on Random Forest, XGBoost, and Deep Learning Using Multisource Remote Sensing Data. Atmosphere 2019, 10, 373. [Google Scholar] [CrossRef]
  43. Tai, A.P.K.; Mickley, L.J.; Jacob, D.J. Correlations between Fine Particulate Matter (PM2.5) and Meteorological Variables in the United States: Implications for the Sensitivity of PM2.5 to Climate Change. Atmos. Environ. 2010, 44, 3976–3984. [Google Scholar] [CrossRef]
  44. Zhao, D.; Chen, H.; Yu, E.; Luo, T. PM2.5/PM10 Ratios in Eight Economic Regions and Their Relationship with Meteorology in China. Adv. Meteorol. 2019, 2019, 1–15. [Google Scholar] [CrossRef]
  45. Ma, J.; Yu, Z.; Qu, Y.; Xu, J.; Cao, Y. Application of the XGBoost Machine Learning Method in PM2.5 Prediction: A Case Study of Shanghai. Aerosol Air Qual. Res. 2020, 20, 128–138. [Google Scholar] [CrossRef]
  46. Danesh Yazdi, M.; Kuang, Z.; Dimakopoulou, K.; Barratt, B.; Suel, E.; Amini, H.; Lyapustin, A.; Katsouyanni, K.; Schwartz, J. Predicting Fine Particulate Matter (PM2.5) in the Greater London Area: An Ensemble Approach Using Machine Learning Methods. Remote Sens. 2020, 12, 914. [Google Scholar] [CrossRef]
  47. Kumar, V.; Sahu, M. Evaluation of Nine Machine Learning Regression Algorithms for Calibration of Low-Cost PM2.5 Sensor. J. Aerosol Sci. 2021, 157, 105809. [Google Scholar] [CrossRef]
  48. Masood, A.; Ahmad, K. A Model for Particulate Matter (PM2.5) Prediction for Delhi Based on Machine Learning Approaches. Procedia Comput. Sci. 2020, 167, 2101–2110. [Google Scholar] [CrossRef]
  49. Feng, X.; Li, Q.; Zhu, Y.; Hou, J.; Jin, L.; Wang, J. Artificial Neural Networks Forecasting of PM2.5 Pollution Using Air Mass Trajectory Based Geographic Model and Wavelet Transformation. Atmos. Environ. 2015, 107, 118–128. [Google Scholar] [CrossRef]
  50. Ou, C.; Li, F.; Zhang, J.; Hu, Y.; Chen, X.; Kong, S.; Guo, J.; Zhou, Y. Multiple Driving Factors and Hierarchical Management of PM2.5: Evidence from Chinese Central Urban Agglomerations Using Machine Learning Model and GTWR. Urban Clim. 2022, 46, 101327. [Google Scholar] [CrossRef]
  51. Cai, S.; Ma, Q.; Wang, S.; Zhao, B.; Brauer, M.; Cohen, A.; Martin, R.V.; Zhang, Q.; Li, Q.; Wang, Y.; et al. Impact of Air Pollution Control Policies on Future PM2.5 Concentrations and Their Source Contributions in China. J. Environ. Manag. 2018, 227, 124–133. [Google Scholar] [CrossRef] [PubMed]
  52. Wang, S.; Sun, P.; Sun, F.; Jiang, S.; Zhang, Z.; Wei, G. The Direct and Spillover Effect of Multi-Dimensional Urbanization on PM2.5 Concentrations: A Case Study from the Chengdu-Chongqing Urban Agglomeration in China. Int. J. Environ. Res. Public Health 2021, 18, 10609. [Google Scholar] [CrossRef] [PubMed]
  53. Chen, Z.; Chen, D.; Wen, W.; Zhuang, Y.; Kwan, M.-P.; Chen, B.; Zhao, B.; Yang, L.; Gao, B.; Li, R.; et al. Evaluating the “2 + 26” Regional Strategy for Air Quality Improvement during Two Air Pollution Alerts in Beijing: Variations in PM2.5; Concentrations, Source Apportionment, and the Relative Contribution of Local Emission and Regional Transport. Atmos. Chem. Phys. 2019, 19, 6879–6891. [Google Scholar] [CrossRef]
  54. Zhao, X.; Sun, Y.; Zhao, C.; Jiang, H. Impact of Precipitation with Different Intensity on PM2.5 over Typical Regions of China. Atmosphere 2020, 11, 906. [Google Scholar] [CrossRef]
  55. Shan, Y.; Wang, X.; Wang, Z.; Liang, L.; Li, J.; Sun, J. The Pattern and Mechanism of Air Pollution in Developed Coastal Areas of China: From the Perspective of Urban Agglomeration. PLoS ONE 2020, 15, e0237863. [Google Scholar] [CrossRef]
Figure 1. Geographical Distribution of China’s Six Major Urban Agglomerations: Beijing–Tianjin–Hebei Urban Agglomeration (BTH-UA), Central Plains Urban Agglomeration (CP-UA), Yangtze River Delta Urban Agglomeration (YRD-UA), Middle Reaches of the Yangtze River Urban Agglomeration (YRMA-UA), Chengdu–Chongqing Urban Agglomeration (CY-UA), Pearl River Delta Urban Agglomeration (PRD-UA).
Atmosphere 14 00903 g001
Figure 2. The research framework.
Atmosphere 14 00903 g002
Figure 3. Kernel Density Estimation of Annual Average PM2.5 Concentration in China’s Six Major Urban Agglomerations: (a) BTH-UA, (b) CP-UA, (c) YRD-UA, (d) YRMR-UA, (e) CY-UA, (f) PRD-UA.
Atmosphere 14 00903 g003
Figure 4. Monthly Variation in PM2.5 Concentration in China’s Six Major Urban Agglomerations: Shown are the median (central horizontal line within the box), 25th and 75th percentiles (lower and upper bars within the boxes, respectively), minimum and maximum (lowest horizontal line and highest point, respectively).
Atmosphere 14 00903 g004
Figure 5. Spatial Variation in PM2.5 Standard Deviation Ellipses in China’s Six Major Urban Agglomerations.
Atmosphere 14 00903 g005
Figure 6. Pearson Coefficient Values for China’s Six Major Urban Agglomerations from 2017 to 2020: (a) Correlation between PM2.5 Concentration and Temperature (T); (b) Correlation between PM2.5 Concentration and Pressure (P); (c) Correlation between PM2.5 Concentration and Dew Point Temperature (TD); (d) Correlation between PM2.5 Concentration and Wind Speed (WS); (e) Correlation between PM2.5 Concentration and Precipitation (Pre).
Atmosphere 14 00903 g006
Figure 7. Ranking of Feature Importance for Meteorological Factors in Predicting PM2.5 Concentration in the Six Major Urban Agglomerations Based on MLP Model.
Atmosphere 14 00903 g007
Table 1. List of data information.
VariablesSymbolUnitPeriodSource
PM2.5 concentrationPM2.5µg/m−3January 2017–December 2020China National Environmental Monitoring Center
Air temperatureT°CJanuary 2017–December 2020National Climatic Data Center
Atmospheric pressurePhPa
Dew temperatureTD°C
Wind speedWSm/s
PrecipitationPremm
Table 2. Prediction Accuracy (RMSE) of PM2.5 Concentration Predictions using Eight Machine Learning Models for the Six Major Urban Agglomerations.
BTH-UACP-UAYRD-UAYRMR-UACY-UAPRD-UAMean-ML
XGBT35.335.221.925.123.114.225.8
KNN36.036.423.026.224.314.126.7
LR38.637.023.326.324.614.627.4
RF36.836.422.926.124.214.326.8
DT46.547.630.836.030.718.735.0
SVM40.438.424.127.025.215.028.4
GBDT34.534.221.824.923.013.425.3
MLP34.033.721.724.722.413.324.9
Mean-UA37.837.423.727.024.714.727.5
Table 3. Prediction Accuracy (MCVS) of PM2.5 Concentration Predictions using Eight Machine Learning Models for the Six Major Urban Agglomerations after Ten-fold Cross-Validation.
BTH-UACP-UAYRD-UAYRMR-UACY-UAPRD-UAMean-ML
XGBT34.333.822.026.323.314.625.7
KNN35.335.323.227.424.014.826.7
LR38.336.123.327.324.615.327.5
RF35.535.223.327.324.314.926.8
DT47.746.730.436.531.819.935.5
SVM40.437.424.127.925.215.728.4
GBDT33.833.121.825.722.914.125.2
MLP33.432.921.725.622.313.925.0
Mean-UA37.336.323.728.024.815.427.6
Disclaimer/Publisher’s Note: The statements, opinions and data contained in all publications are solely those of the individual author(s) and contributor(s) and not of MDPI and/or the editor(s). MDPI and/or the editor(s) disclaim responsibility for any injury to people or property resulting from any ideas, methods, instructions or products referred to in the content.

