
Exploring the Relationship between Hydroclimate and Lake Area in Source Area of the Yellow River: Implications for the Paleoclimate Studies

Abstract
:1. Introduction
2. Study Region, Data, and Method
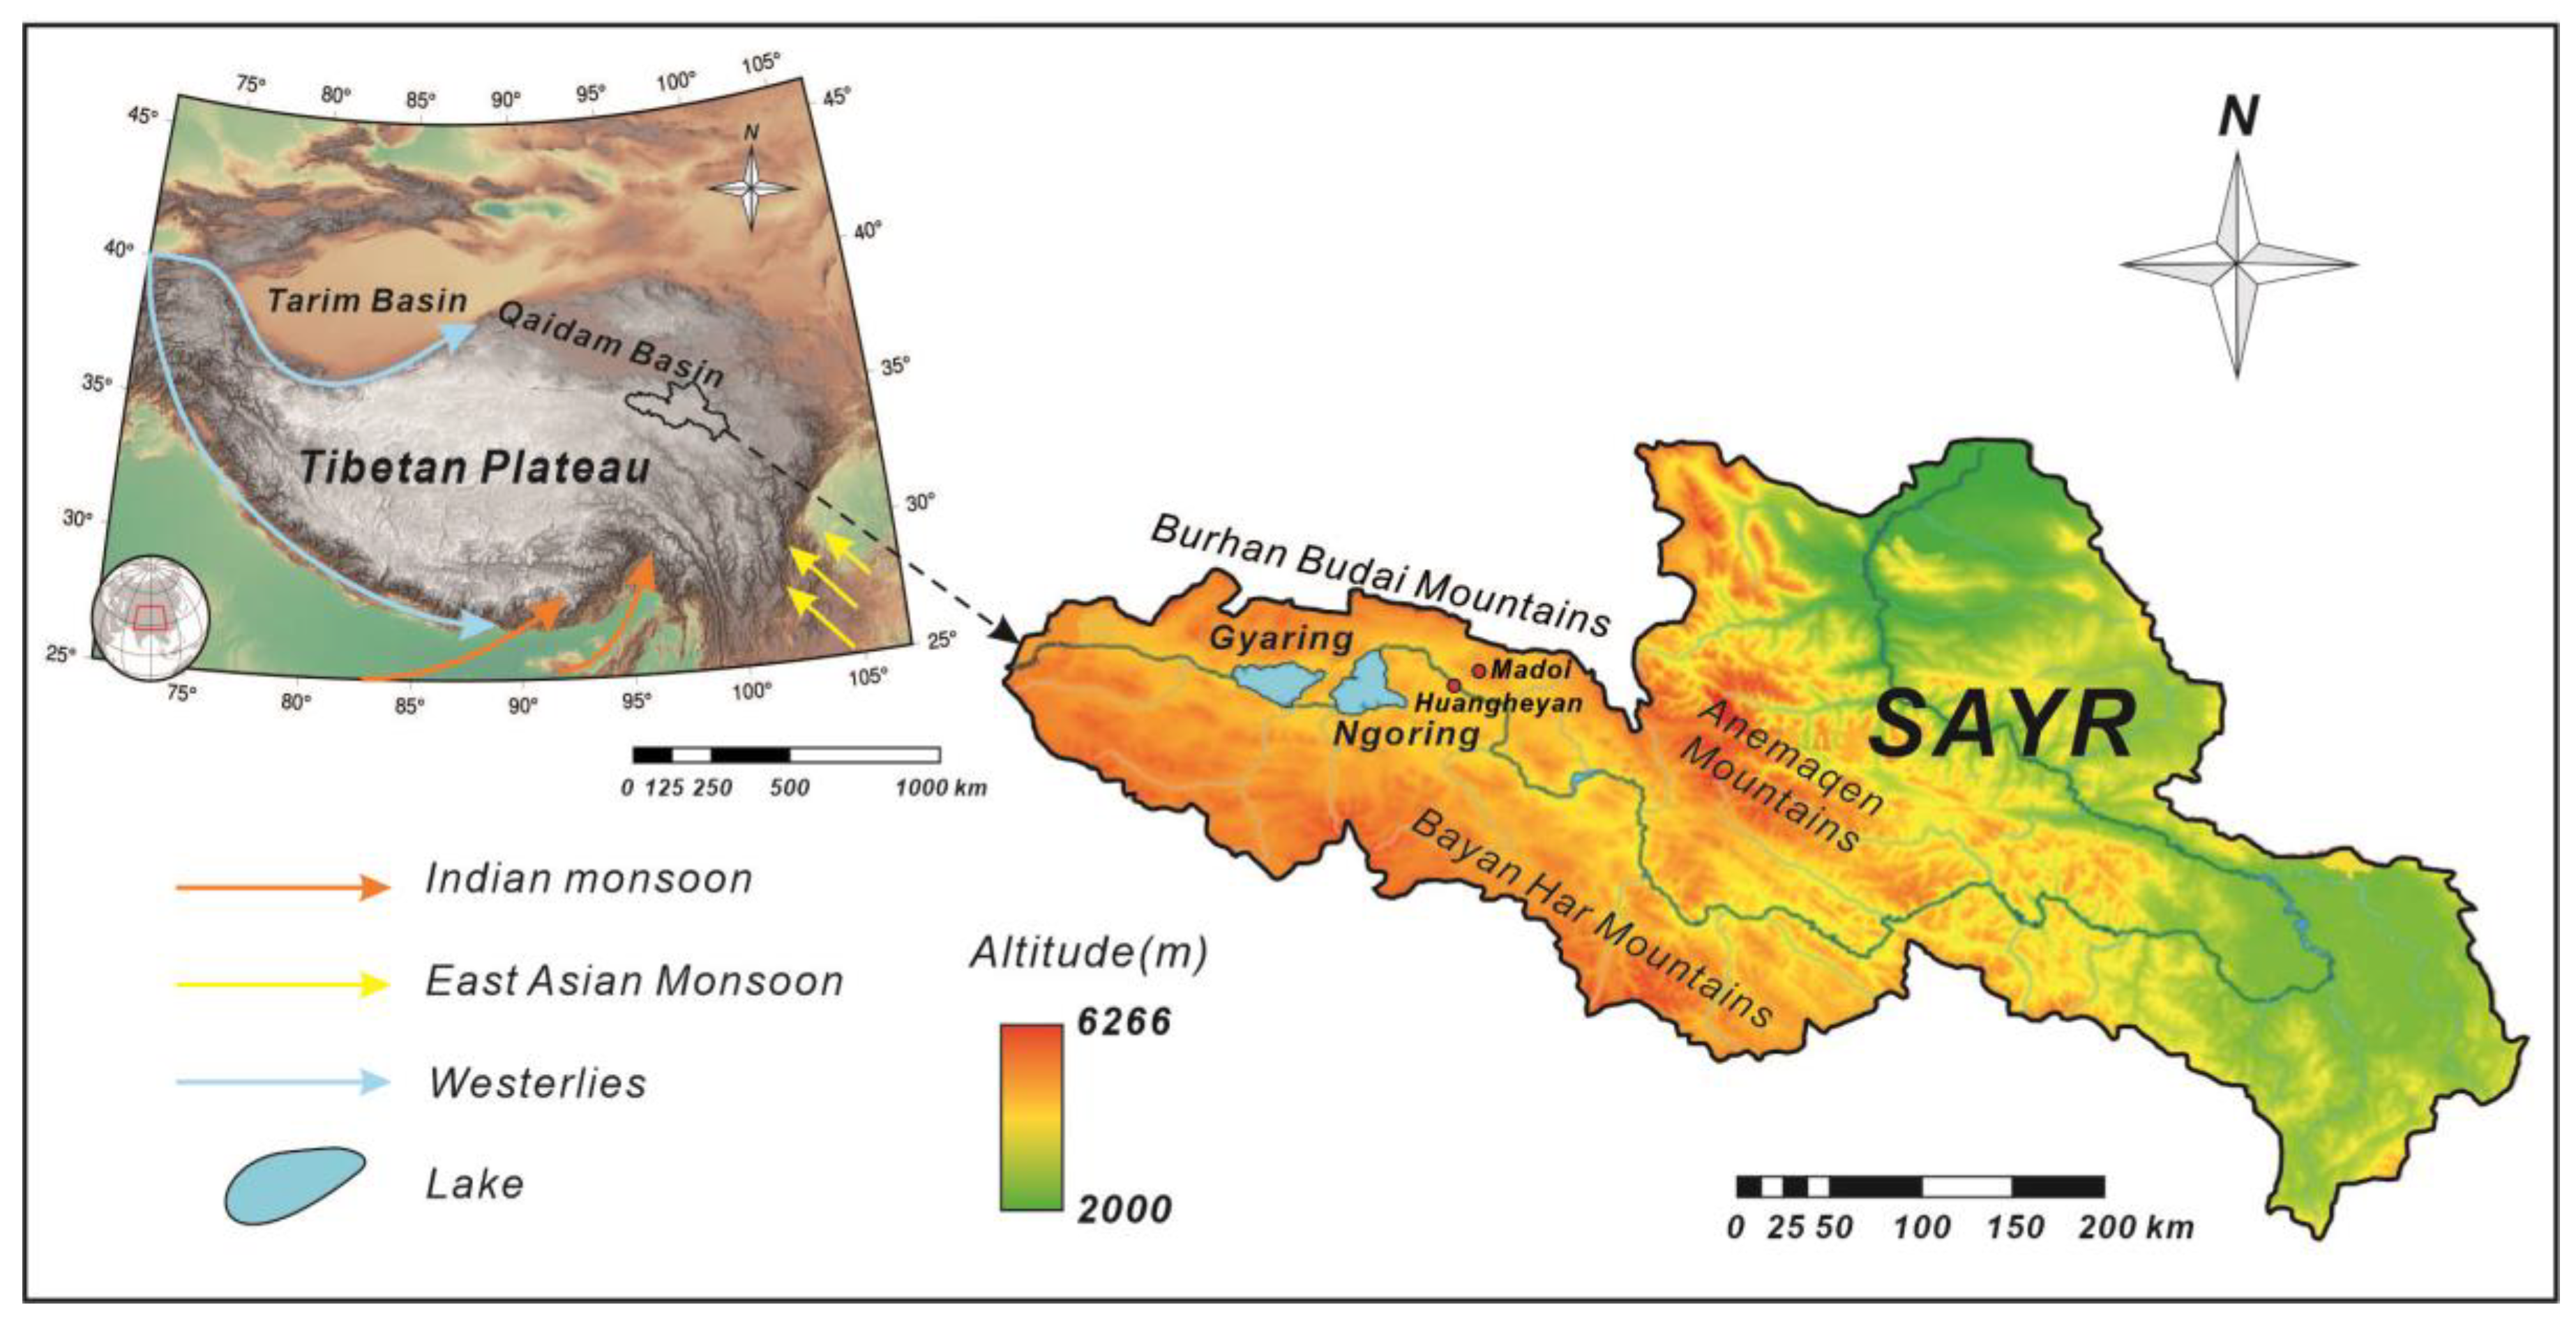
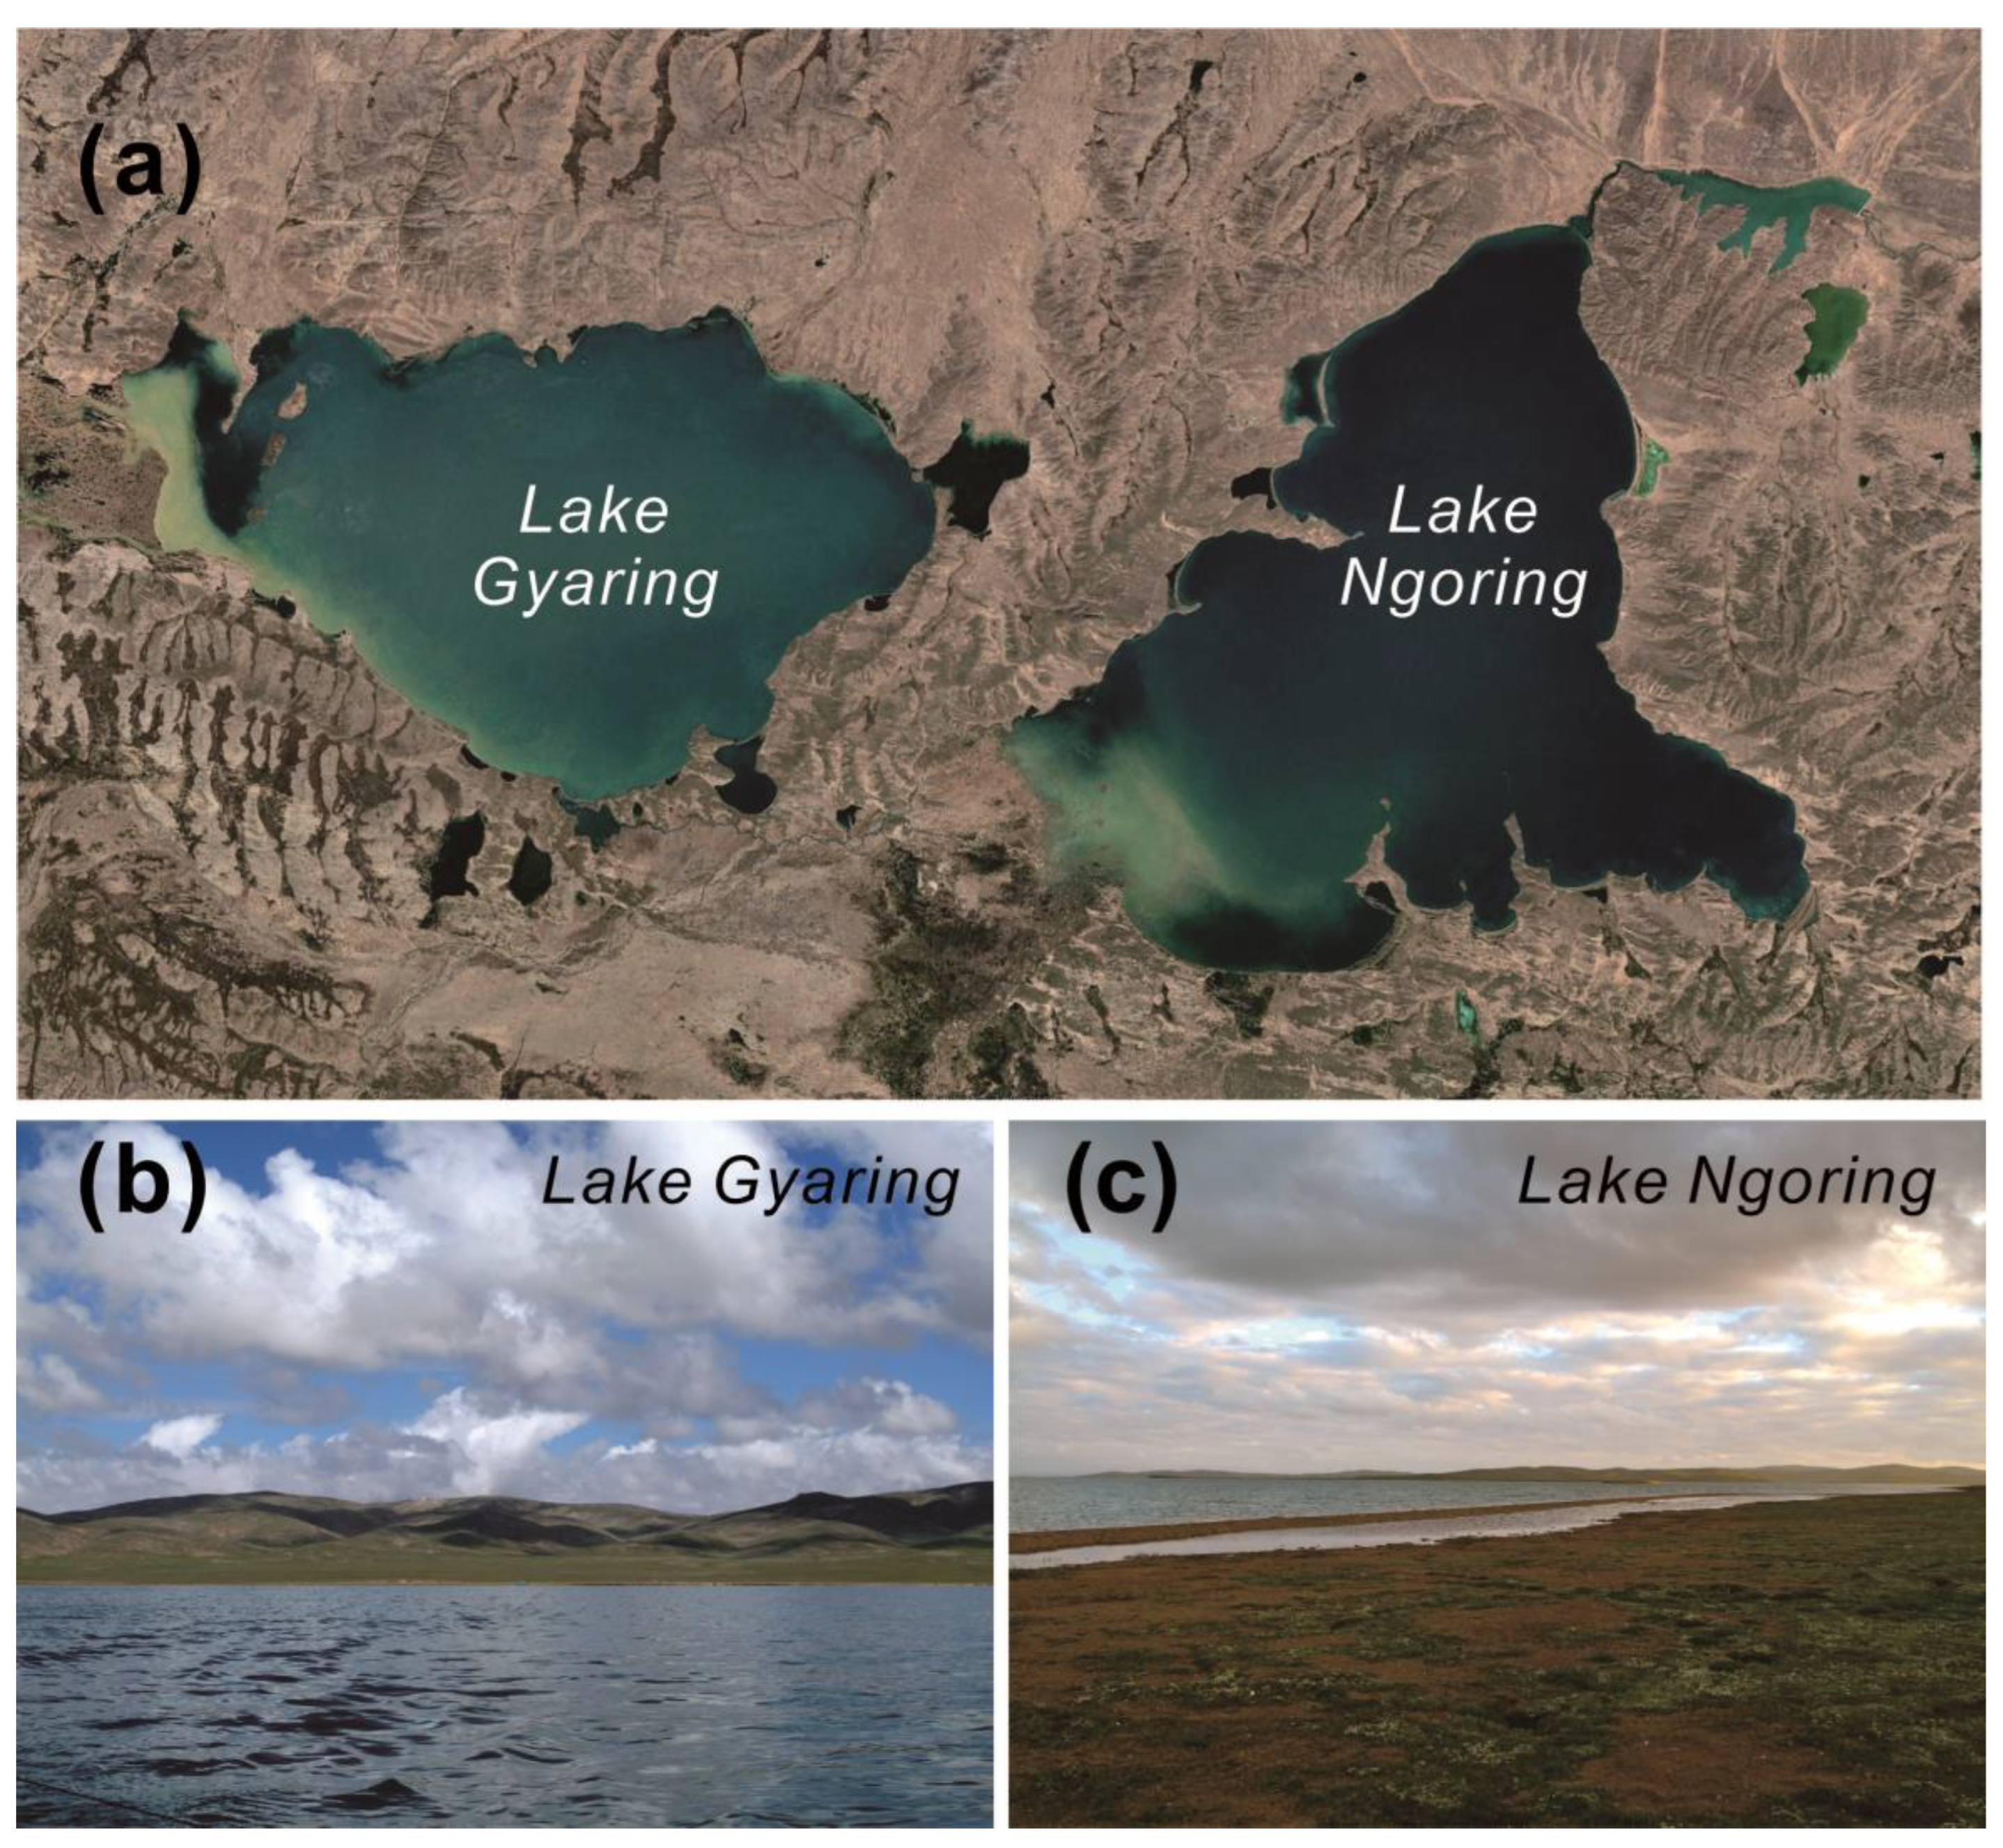
2.1. Study Area
2.2. Data Source and Methods
2.2.1. GIS and Remote Sensing Methodology
2.2.2. The Acquisition of the Meteorological, Streamflow and TSI Data
2.2.3. Mathematical Methods
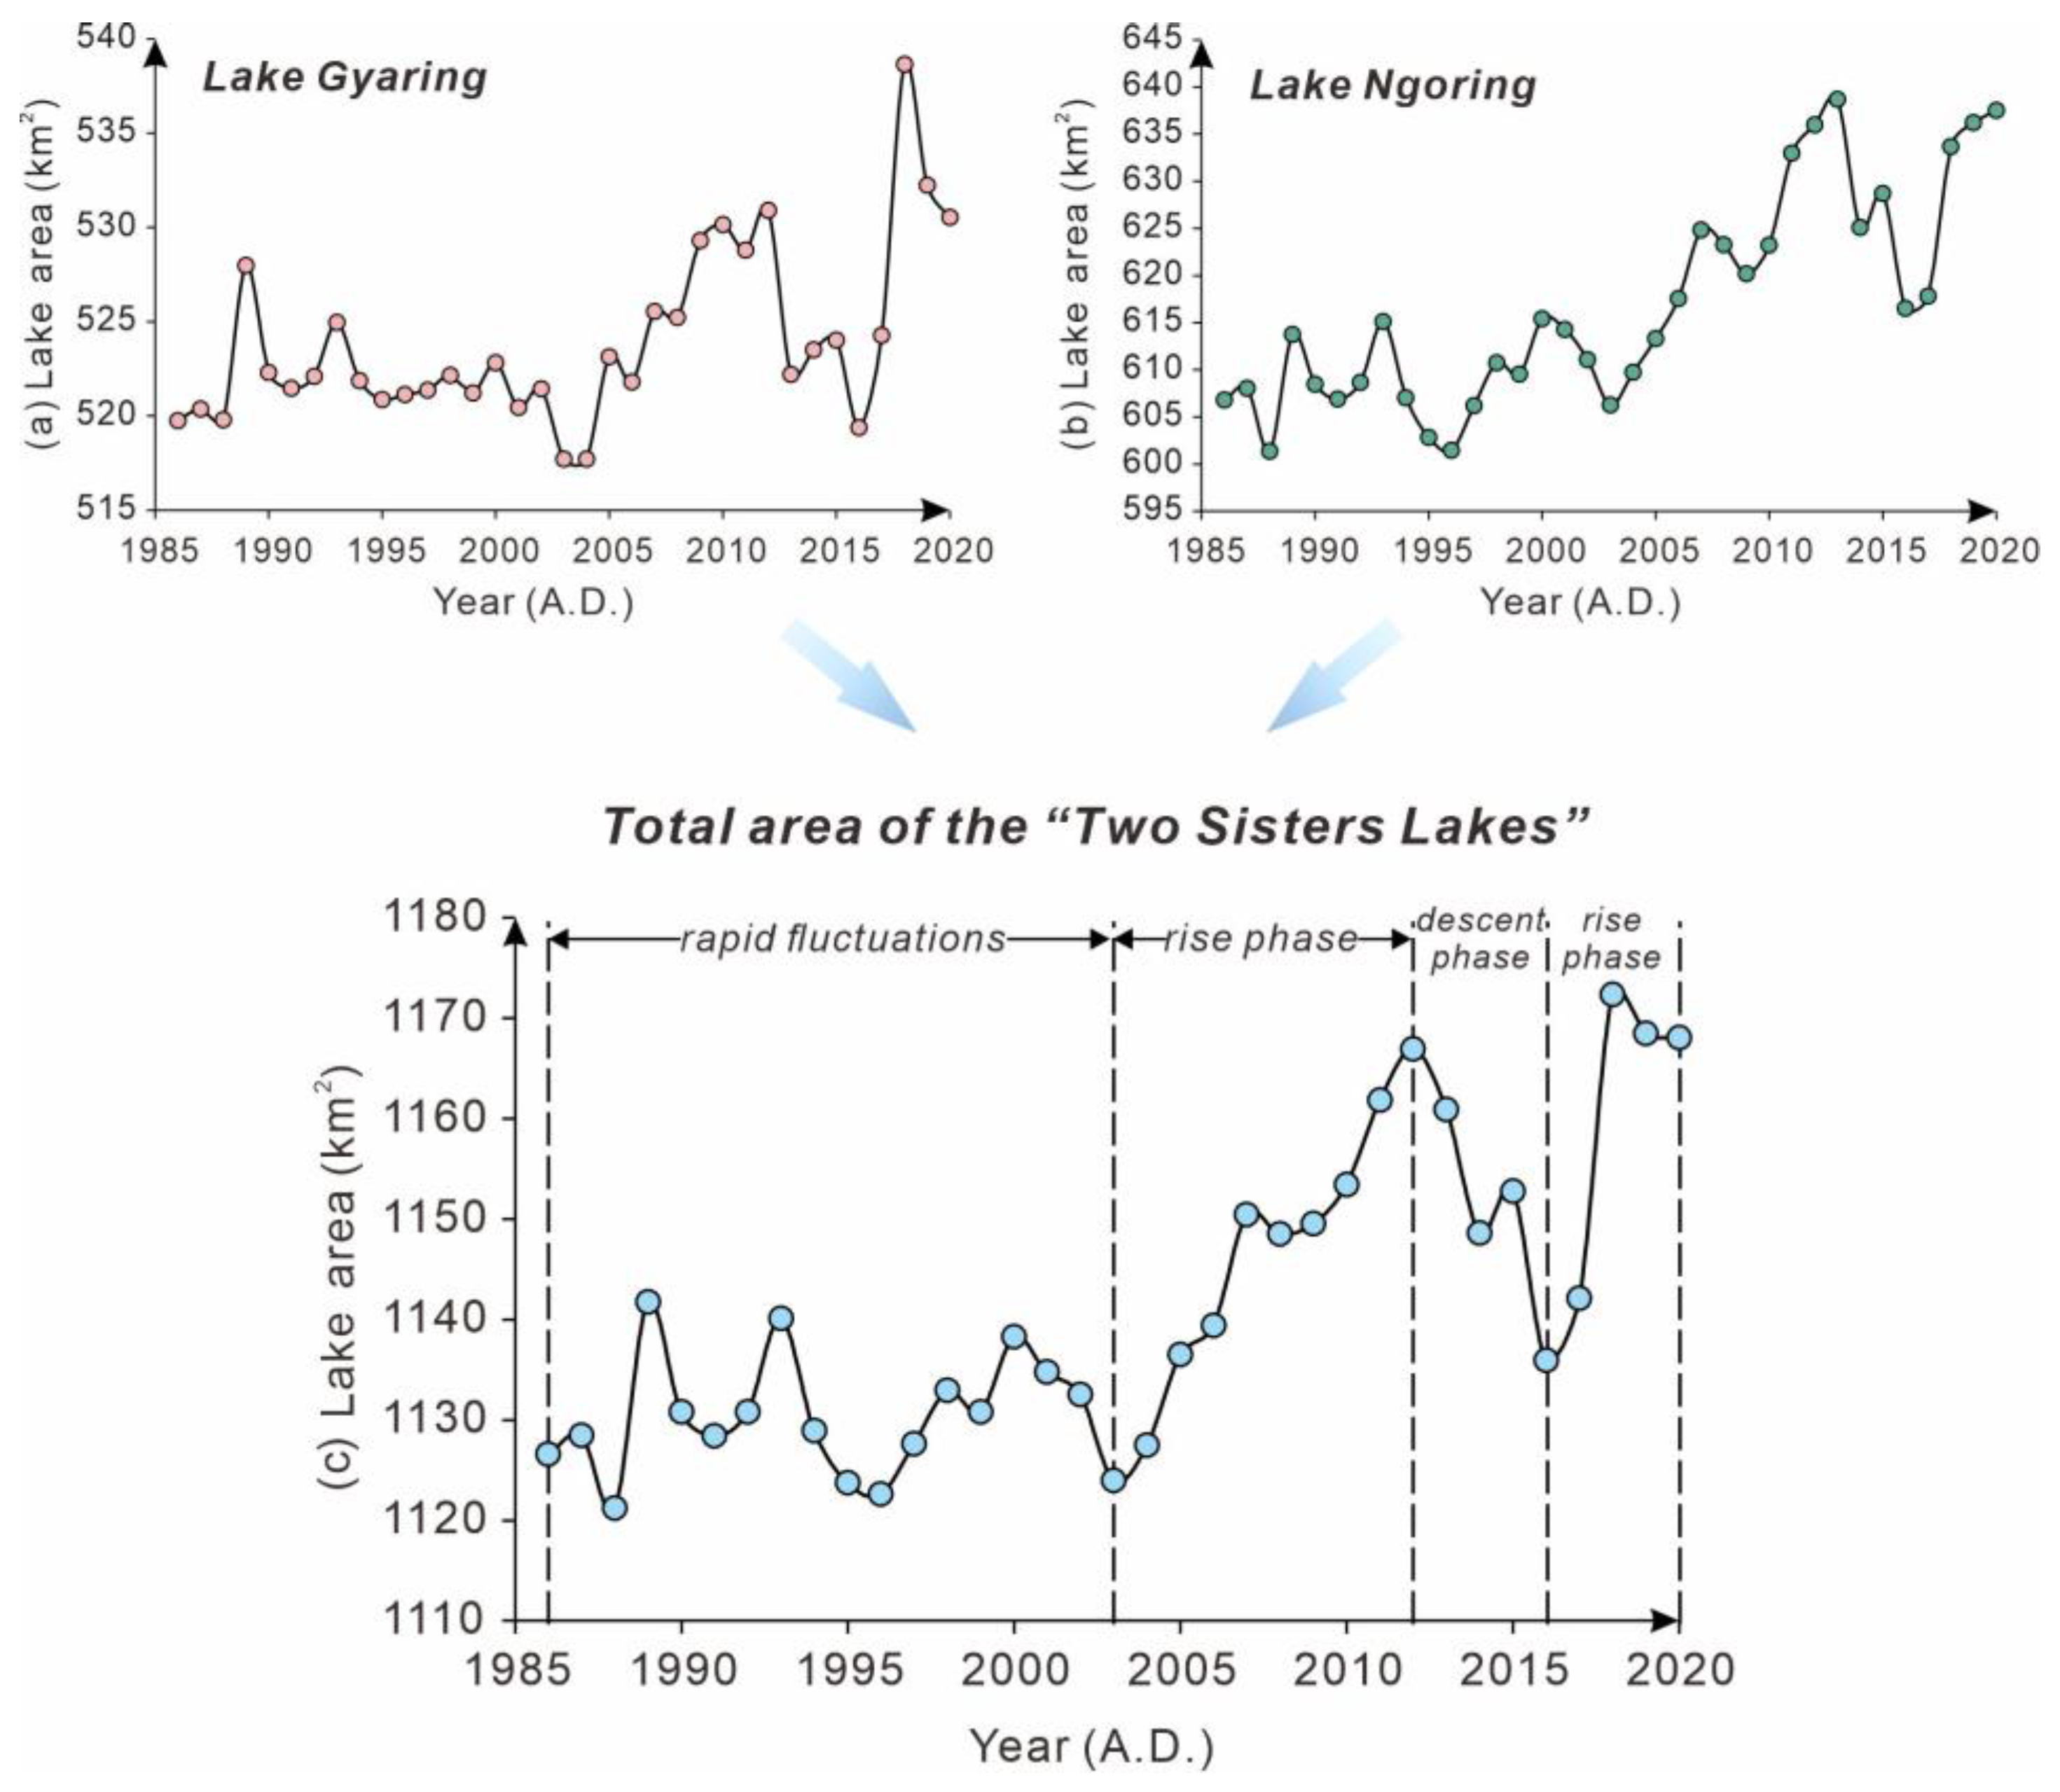
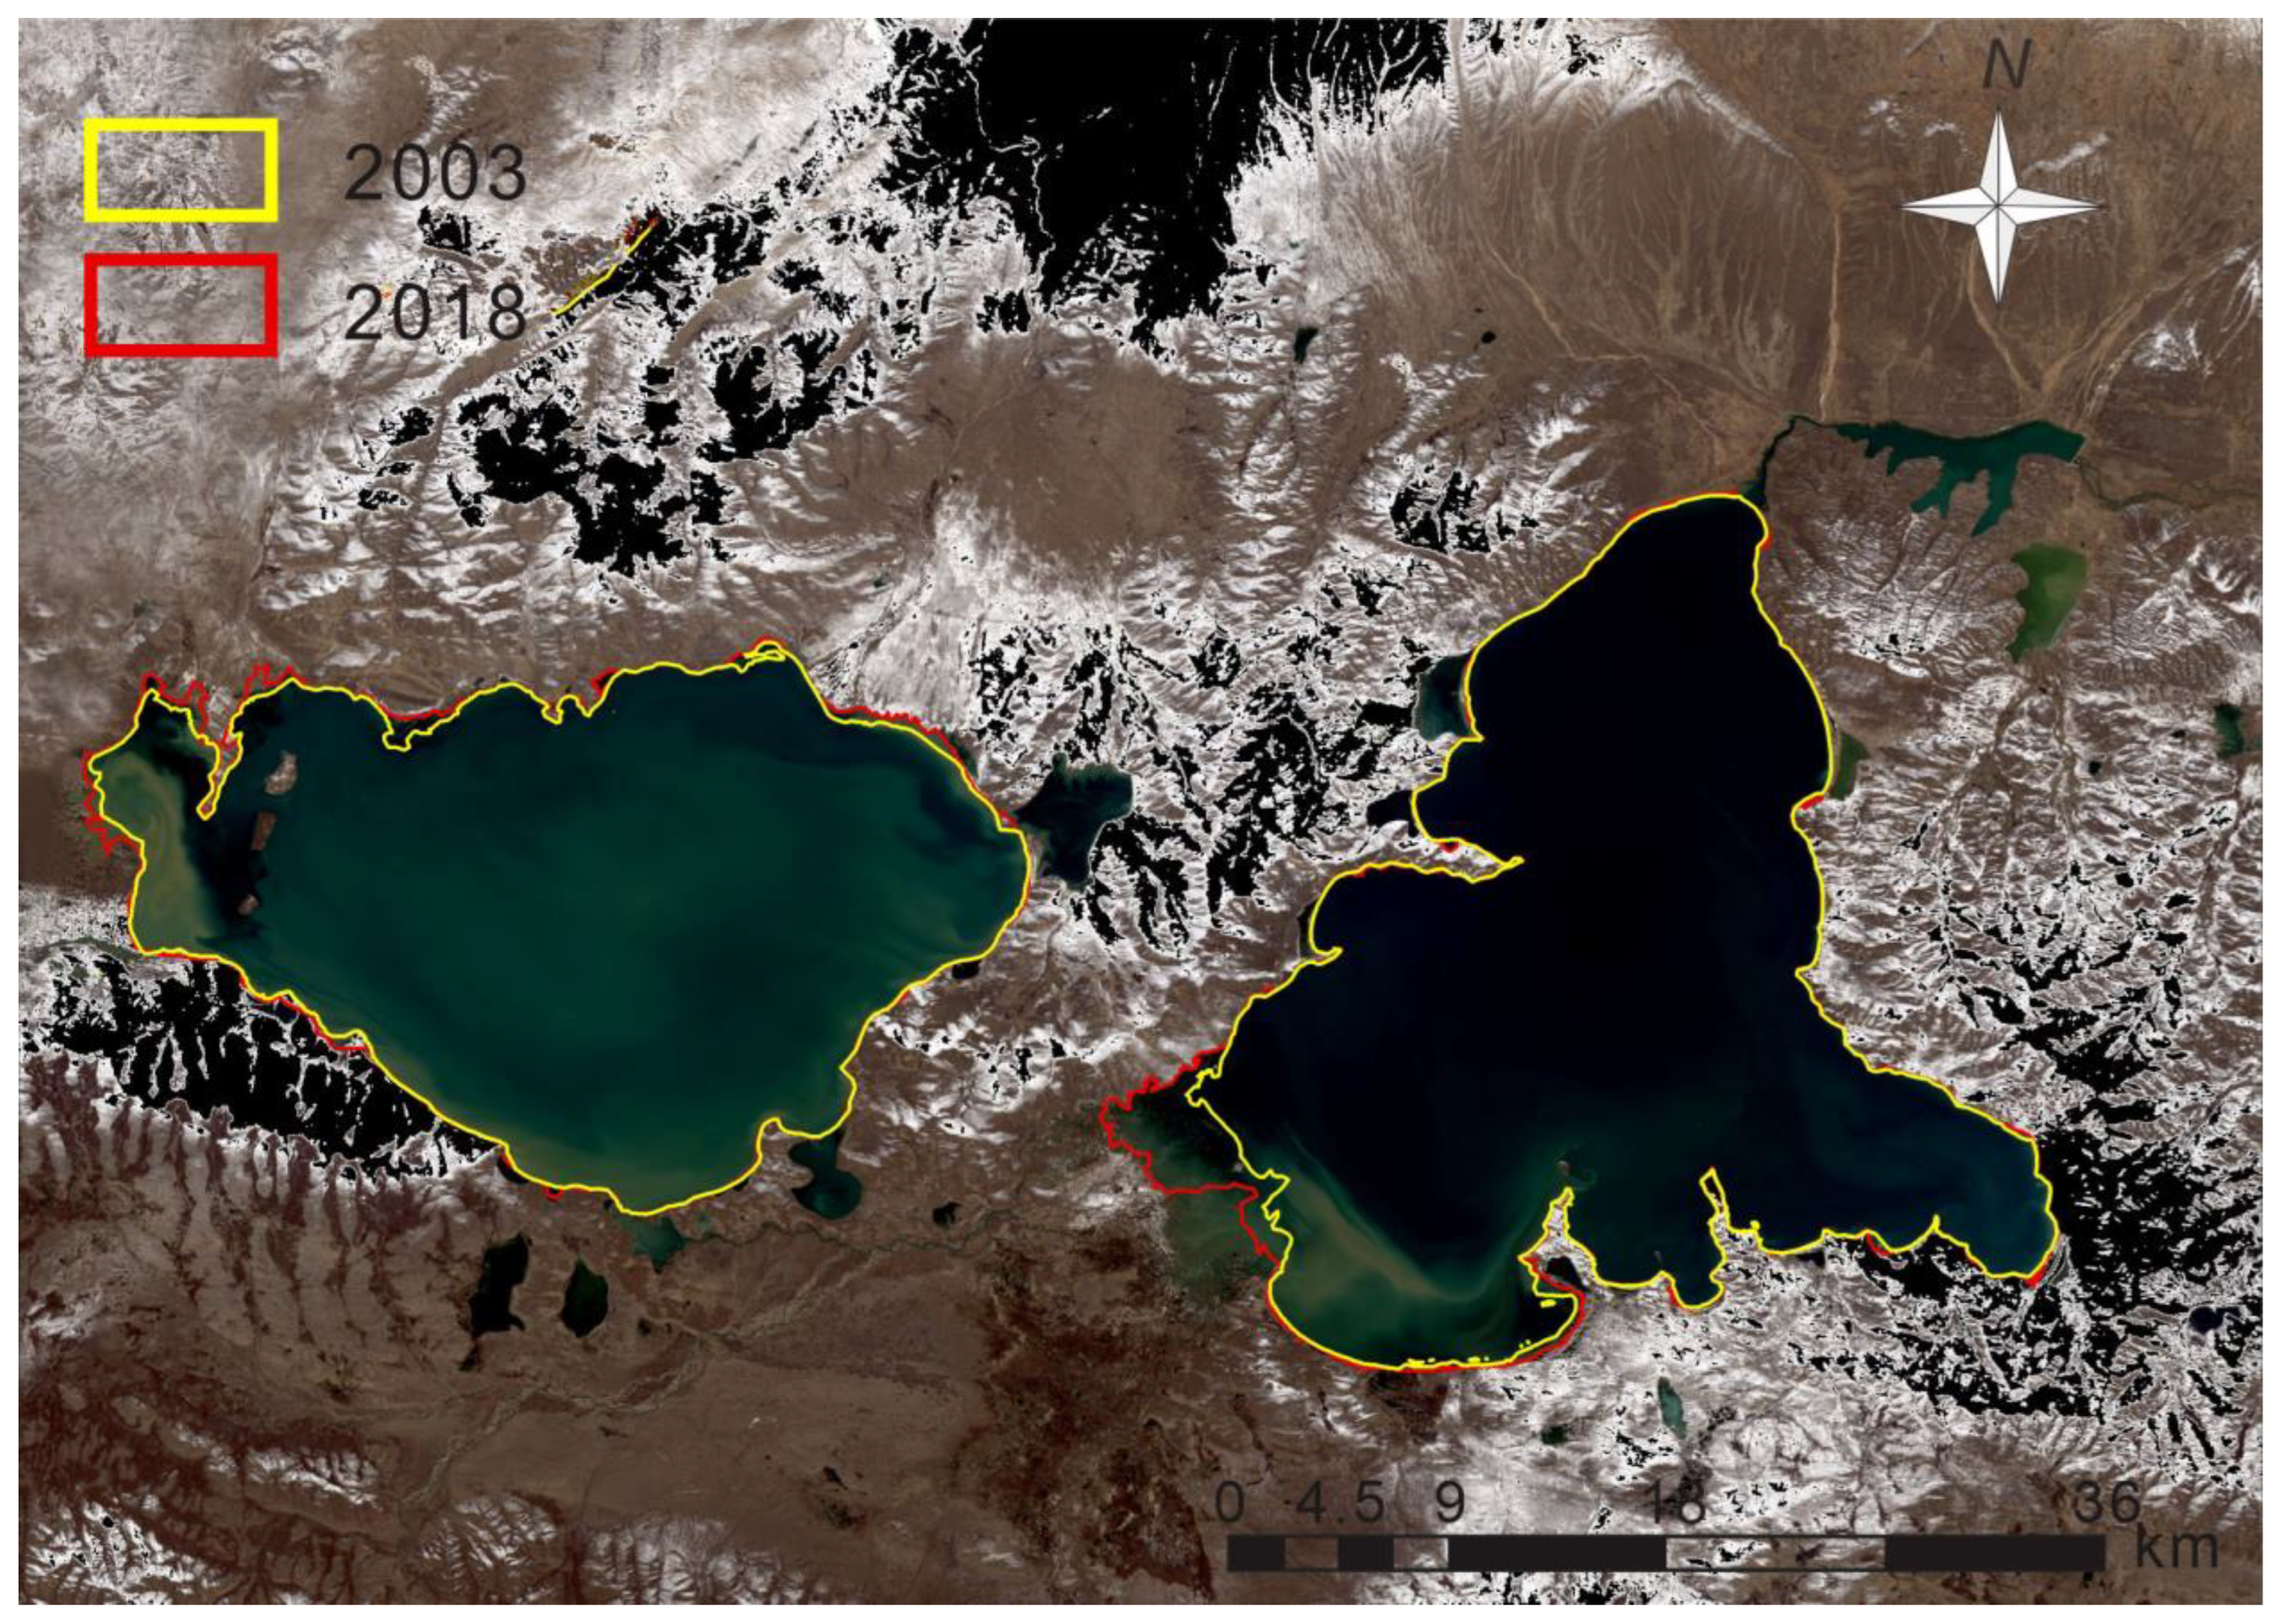
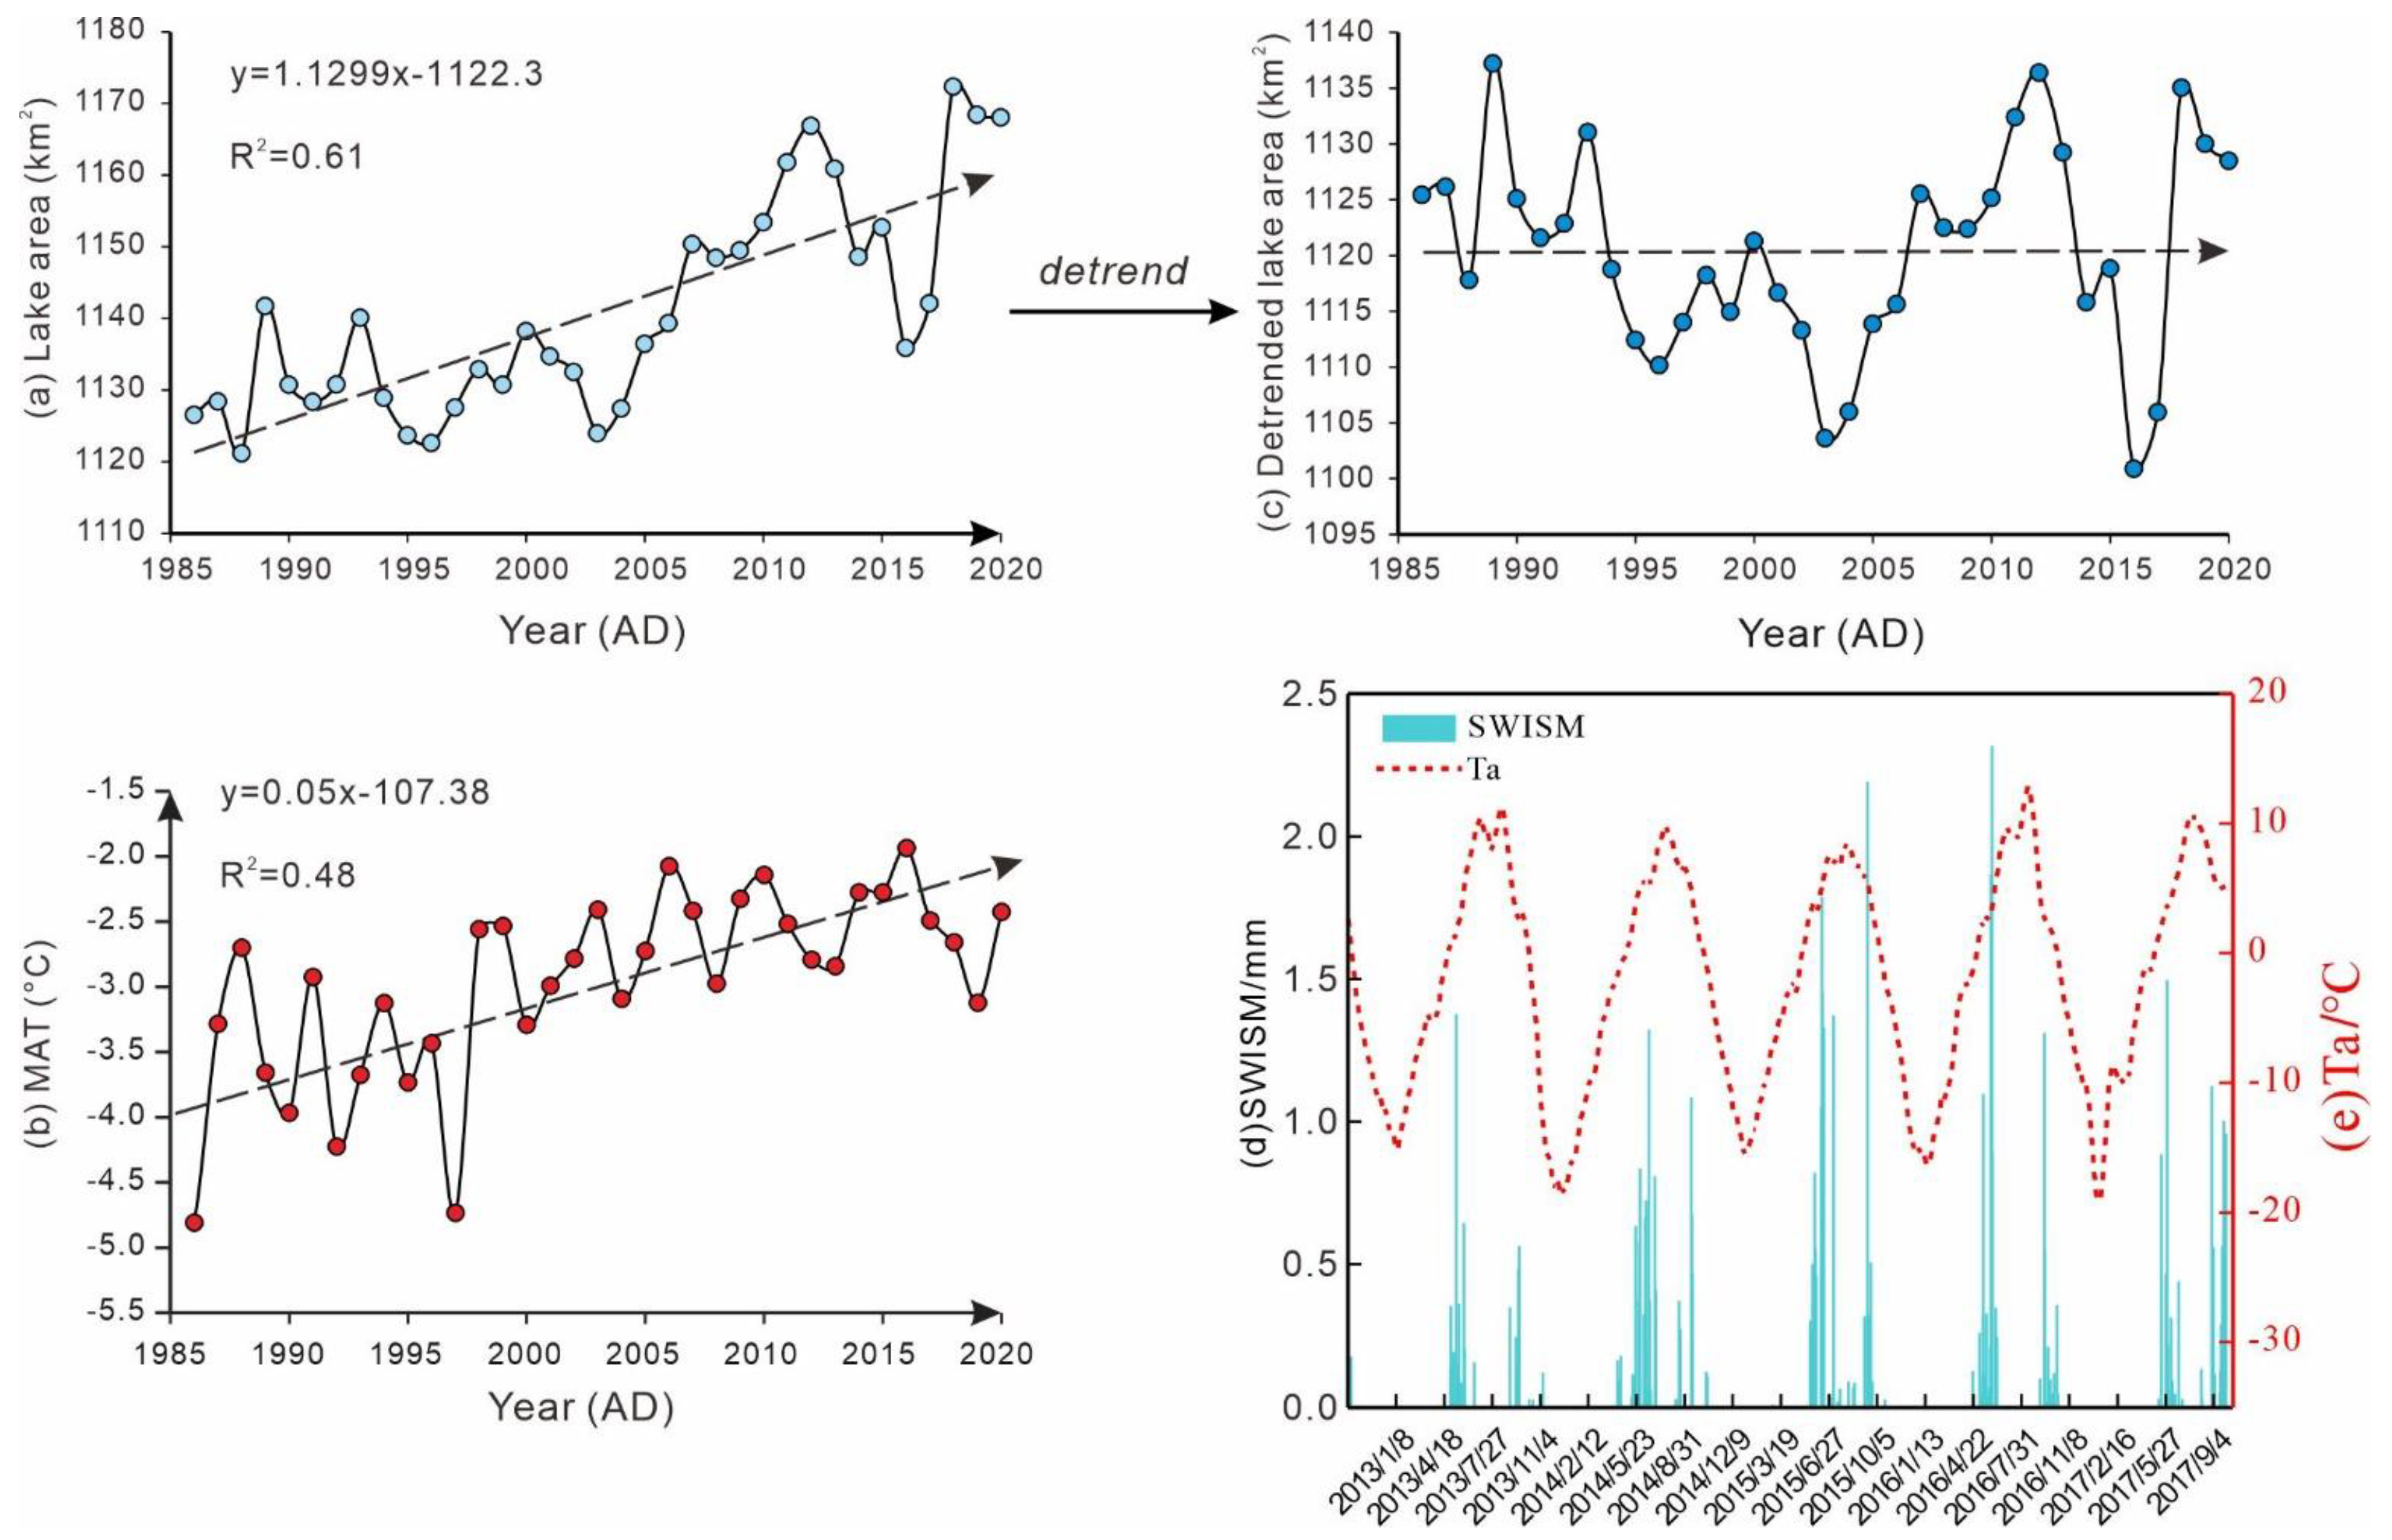
3. Results
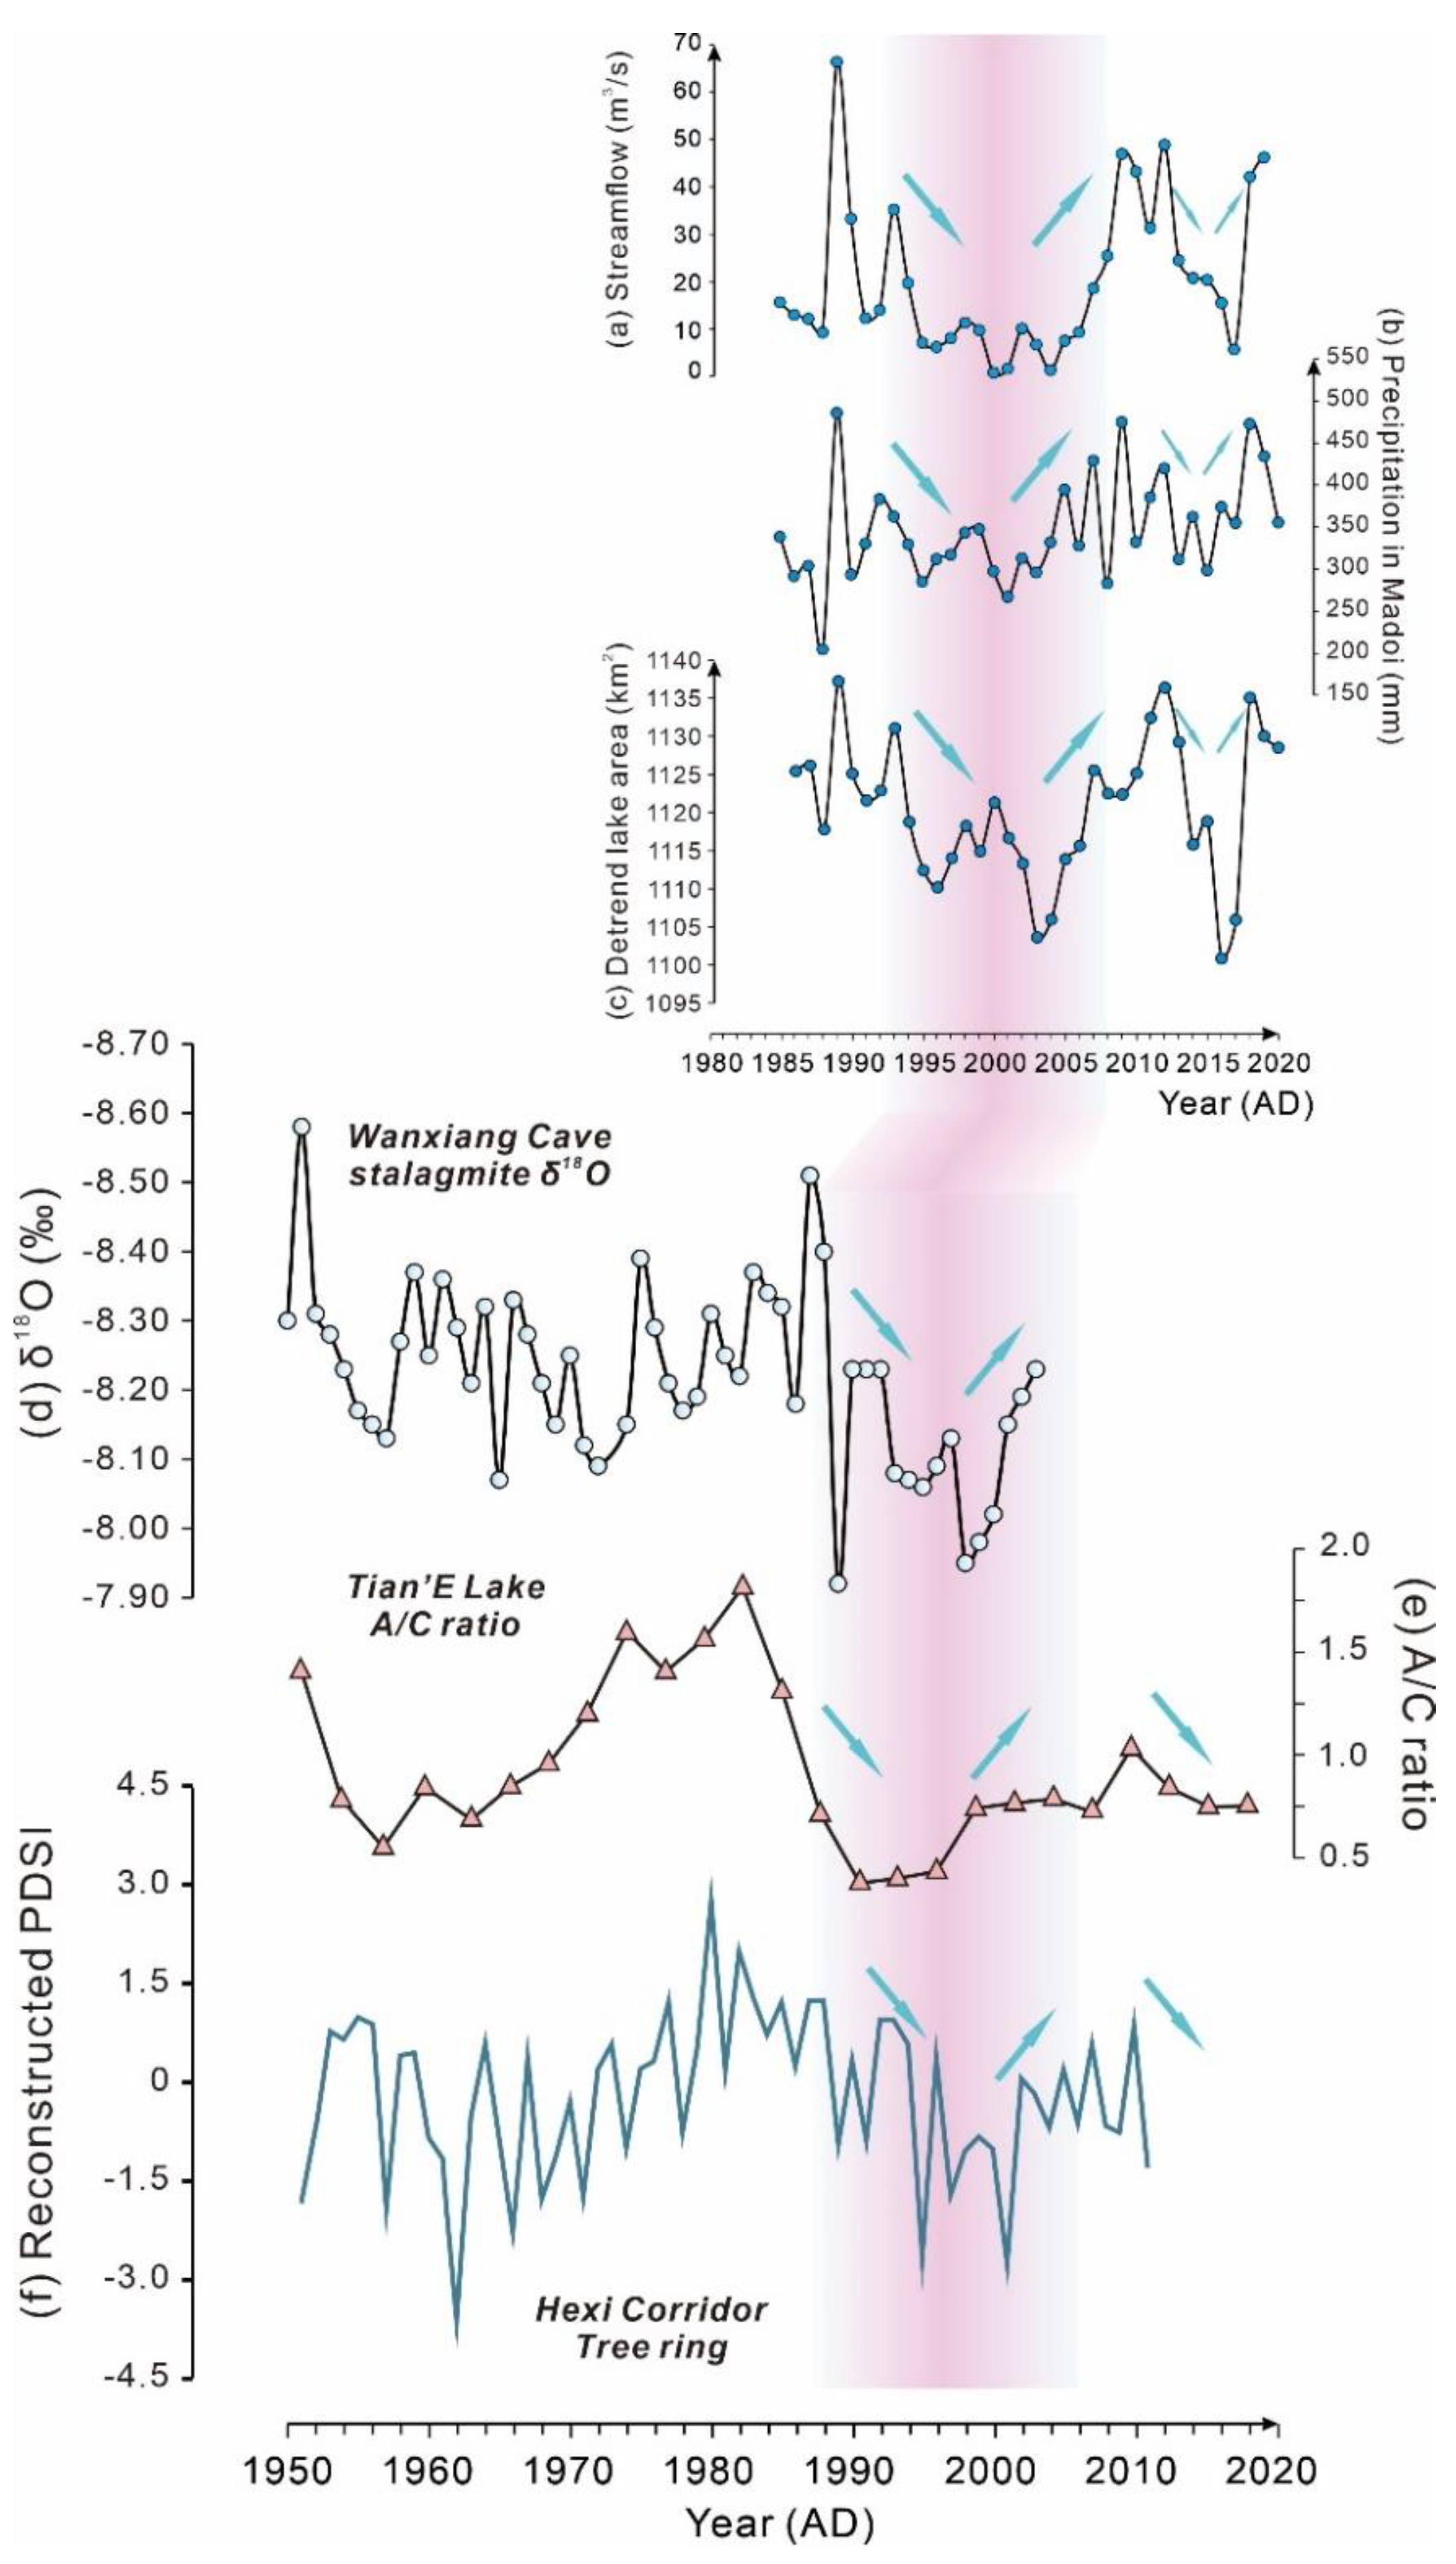
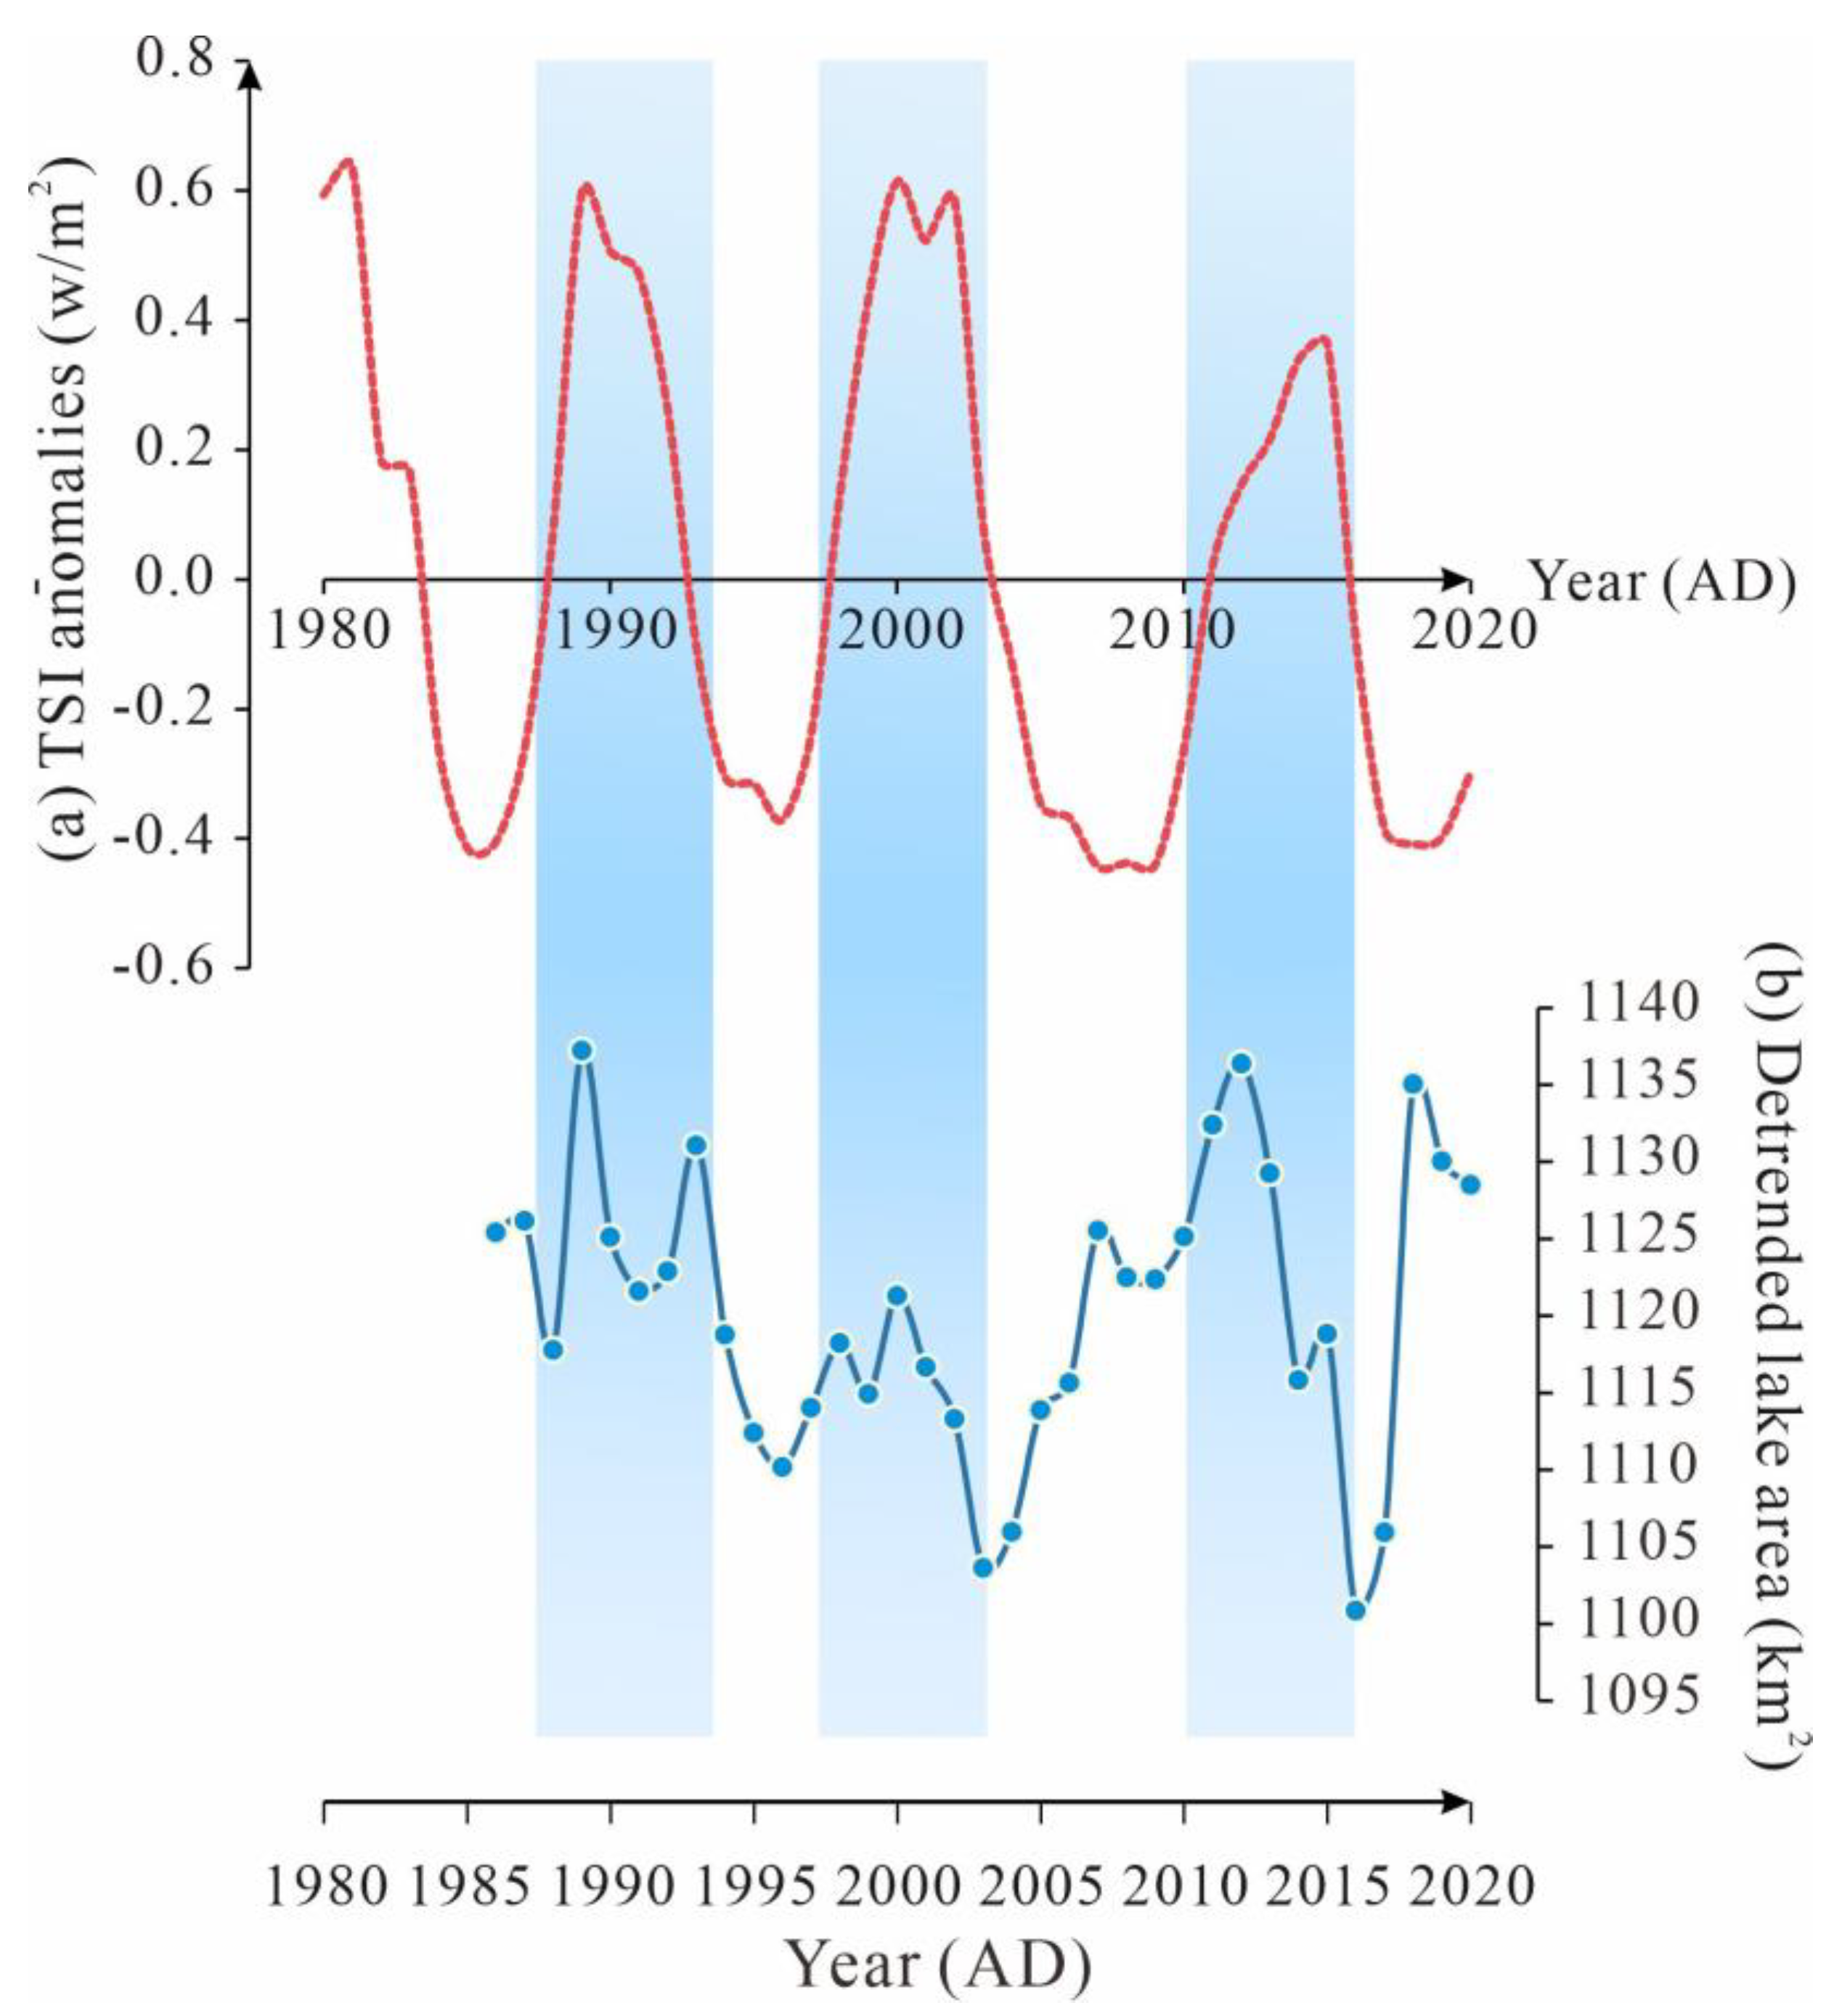
4. Discussions
4.1. Relationship between Variations in the Two Sisters Lakes’ Surface Area and Warming Changes in the SAYR
4.2. Lake Area Changes in the Two Sisters Lakes in Response to Hydroclimatic Variations in the SAYR
4.3. Mechanism of the Water Area Changes of the Two Sisters Lakes and Their Implications for the SAYR’s Hydrological Environment
5. Conclusions
Author Contributions
Funding
Institutional Review Board Statement
Informed Consent Statement
Data Availability Statement
Acknowledgments
Conflicts of Interest
References
- Yao, T.; Shi, Y.; Thompson, L.G. High resolution record of paleoclimate since the Little Ice Age from the Tibetan ice cores. Quat. Int. 1997, 37, 19–23. [Google Scholar] [CrossRef]
- Pu, Y.; Meyers, P.A. Paleoenvironmental significance of 5α-stigmastanol in surface soil and lake sediment from the Nianbaoyeze Mountains, eastern Qinghai-Tibet Plateau. J. Paleolimnol. 2022, 68, 103–118. [Google Scholar] [CrossRef]
- Zhang, G.; Yao, T.; Xie, H.; Yang, K.; Zhu, L.; Shum, C.K.; Bolch, T.; Yi, S.; Allen, S.; Jiang, L.; et al. Response of Tibetan Plateau lakes to climate change: Trends, patterns, and mechanisms. Earth Sci. Rev. 2020, 208, 103269. [Google Scholar] [CrossRef]
- Chen, F.; Zhang, J.; Liu, J.; Cao, X.; Hou, J.; Zhu, L.; Xu, X.; Liu, X.; Wang, M.; Wu, D.; et al. Climate change, vegetation history, and landscape responses on the Tibetan Plateau during the Holocene: A comprehensive review. Quat. Sci. Rev. 2020, 243, 106444. [Google Scholar] [CrossRef]
- Lei, Y.; Yao, T.; Bird, B.W.; Yang, K.; Zhai, J.; Sheng, Y. Coherent lake growth on the central Tibetan Plateau since the 1970s: Characterization and attribution. J. Hydrol. 2013, 483, 61–67. [Google Scholar] [CrossRef]
- Zhang, C.; Zhao, C.; Yu, S.-Y.; Yang, X.; Cheng, J.; Zhang, X.; Xue, B.; Shen, J.; Chen, F. Seasonal imprint of Holocene temperature reconstruction on the Tibetan Plateau. Earth Sci. Rev. 2022, 226, 103927. [Google Scholar] [CrossRef]
- Zhang, G.; Luo, W.; Chen, W.; Zheng, G. A robust but variable lake expansion on the Tibetan Plateau. Sci. Bull. 2019, 64, 1306–1309. [Google Scholar] [CrossRef] [PubMed]
- Lei, Y.; Zhu, Y.; Wang, B.; Yao, T.; Yang, K.; Zhang, X.; Zhai, J.; Ma, N. Extreme Lake Level Changes on the Tibetan Plateau Associated with the 2015/2016 El Niño. Geophys. Res. Lett. 2019, 46, 5889–5898. [Google Scholar] [CrossRef]
- Lei, Y.; Yang, K.; Wang, B.; Sheng, Y.; Bird, B.W.; Zhang, G.; Tian, L. Response of inland lake dynamics over the Tibetan Plateau to climate change. Clim. Chang. 2014, 125, 281–290. [Google Scholar] [CrossRef]
- Li, J.; Gu, Y.; Wu, L.; Guo, L.; Xu, H.; Miao, Z. Changes in Glaciers and Glacial Lakes in the Bosula Mountain Range, Southeast Tibet, over the past Two Decades. Remote Sens. 2022, 14, 3792. [Google Scholar] [CrossRef]
- Liu, P.; Jing, H.; Zhang, D.; Tang, J.; Liu, Q.; Luan, W. Contribution of the Reconstruction of the Area of Seling Co Lake Using DEM Data and Analysis of Spatio-Temporal Variations. Water 2022, 14, 3599. [Google Scholar] [CrossRef]
- Zhao, Z.; Hu, Z.; Zhou, J.; Kan, R.; Li, W. Response of Two Major Lakes in the Changtang National Nature Reserve, Tibetan Plateau to Climate and Anthropogenic Changes over the Past 50 Years. Land 2023, 12, 267. [Google Scholar] [CrossRef]
- Yang, Y.; Wu, J.; Miao, Y.; Wang, X.; Lan, X.; Zhang, Z. Lake Changes during the Past Five Decades in Central East Asia: Links with Climate Change and Climate Future Forecasting. Water 2022, 14, 3661. [Google Scholar] [CrossRef]
- Li, D.; Lu, X.; Overeem, I.; Walling, D.E.; Syvitski, J.; Kettner, A.J.; Bookhagen, B.; Zhou, Y.; Zhang, T. Exceptional increases in fluvial sediment fluxes in a warmer and wetter High Mountain Asia. Science 2021, 374, 599–603. [Google Scholar] [CrossRef] [PubMed]
- Adrian, R.; O’Reilly, C.M.; Zagarese, H.; Baines, S.B.; Hessen, D.O.; Keller, W.; Livingstone, D.M.; Sommaruga, R.; Straile, D.; Van Donk, E.; et al. Lakes as sentinels of climate change. Limnol. Oceanogr. 2009, 54, 2283–2297. [Google Scholar] [CrossRef]
- Gu, H.; Luo, J.; Li, G.; Yao, Y.; Huang, Y.; Huang, D. Spatial-Temporal Variations of Active Accumulated Temperature and Its Impact on Vegetation NDVI in the Source Region of China’s Yellow River. Water 2022, 14, 3458. [Google Scholar] [CrossRef]
- Liu, G.; He, S.; Wong, M.L.; Zou, Y.; He, H.; Chongyi, E.; Chawchai, S.; Zheng, H.; Li, X. Tropical Pacific Forcing of Hydroclimate in the Source Area of the Yellow River. Geophys. Res. Lett. 2021, 48, e2021GL095876. [Google Scholar] [CrossRef]
- Tian, H.; Lan, Y.; Wen, J.; Jin, H.; Wang, C.; Wang, X.; Kang, Y. Evidence for a recent warming and wetting in the source area of the Yellow River (SAYR) and its hydrological impacts. J. Geogr. Sci. 2015, 25, 643–668. [Google Scholar] [CrossRef]
- Meng, F.; Su, F.; Yang, D.; Tong, K.; Hao, Z. Impacts of recent climate change on the hydrology in the source region of the Yellow River basin. J. Hydrol. Reg. Stud. 2016, 6, 66–81. [Google Scholar] [CrossRef]
- Jin, H.; He, R.; Cheng, G.; Wu, Q.; Wang, S.; Lü, L.; Chang, X. Changes in frozen ground in the Source Area of the Yellow River on the Qinghai–Tibet Plateau, China, and their eco-environmental impacts. Environ. Res. Lett. 2009, 4, 045206. [Google Scholar] [CrossRef]
- Ran, Y.; Xie, J.; Li, X. Landscape and Ecosystem Diversity, Dynamics and Management in the Yellow River Source Zone; Brierley, G.J., Li, X., Cullum, C., Gao, J., Eds.; Springer International Publishing: Cham, Switzerland, 2016; pp. 331–351. [Google Scholar]
- Pu, Y.; Werne, J.P.; Meyers, P.A.; Zhang, H. Organic matter geochemical signatures of sediments of Lake Ngoring (Qinghai-Tibetan Plateau): A record of environmental and climatic changes in the source area of the Yellow River for the last 1500 years. Palaeogeogr. Palaeoclimatol. Palaeoecol. 2020, 551, 109729. [Google Scholar] [CrossRef]
- Zhao, W.; Chen, C.; Jiang, Q.; Ji, M.; Zhen, J.; Yang, Y.; Ning, D.; Li, X.; Shen, J. Holocene hydroclimate in the source region of the Yellow River: A new sediment record from Lake Gyaring, NE Tibetan Plateau. J. Asian Earth Sci. 2021, 205, 104601. [Google Scholar] [CrossRef]
- Valjarević, A.; Popovici, C.; Štilić, A.; Radojković, M. Cloudiness and water from cloud seeding in connection with plants distribution in the Republic of Moldova. Appl. Water Sci. 2022, 12, 262. [Google Scholar] [CrossRef]
- Cuo, L.; Zhang, Y.; Gao, Y.; Hao, Z.; Cairang, L. The impacts of climate change and land cover/use transition on the hydrology in the upper Yellow River Basin, China. J. Hydrol. 2013, 502, 37–52. [Google Scholar] [CrossRef]
- Al-Ghussain, L. Global warming: Review on driving forces and mitigation. Environ. Prog. Sustain. Energy 2019, 38, 13–21. [Google Scholar] [CrossRef]
- Qin, J.; Yang, K.; Liang, S.; Guo, X. The altitudinal dependence of recent rapid warming over the Tibetan Plateau. Clim. Chang. 2009, 97, 321–327. [Google Scholar] [CrossRef]
- Wang, J.; Li, M.; Wang, L.; She, J.; Zhu, L.; Li, X. Long-Term Lake Area Change and Its Relationship with Climate in the Endorheic Basins of the Tibetan Plateau. Remote Sens. 2021, 13, 5125. [Google Scholar] [CrossRef]
- Tian, M.; Zhao, J.; Wang, J.; Li, T. Runoff simulation of snowmelt in the Huangheyan-Dari district of the source region of the Yellow River based on UEB model. J. Qinghai Univ. 2021, 39, 98–104, (In Chinese with English Abstract). [Google Scholar]
- Zhang, G.; Chen, W.; Xie, H. Tibetan Plateau’s Lake Level and Volume Changes From NASA’s ICESat/ICESat-2 and Landsat Missions. Geophys. Res. Lett. 2019, 46, 13107–13118. [Google Scholar] [CrossRef]
- Ming, G.; Zhou, W.; Cheng, P.; Wang, H.; Xian, F.; Fu, Y.; Wu, S.; Du, H. Lacustrine record from the eastern Tibetan Plateau associated with Asian summer monsoon changes over the past ~ 6 ka and its links with solar and ENSO activity. Clim. Dyn. 2020, 55, 1075–1086. [Google Scholar] [CrossRef]
- Zhang, P.; Cheng, H.; Edwards, R.L.; Chen, F.; Wang, Y.; Yang, X.; Liu, J.; Tan, M.; Wang, X.; Liu, J.; et al. A Test of Climate, Sun, and Culture Relationships from an 1810-Year Chinese Cave Record. Science 2008, 322, 940–942. [Google Scholar] [CrossRef]
- Yang, B.; Wang, J.; Liu, J. A 1556 year-long early summer moisture reconstruction for the Hexi Corridor, Northwestern China. Sci. China Earth Sci. 2019, 62, 953–963. [Google Scholar] [CrossRef]
- Wang, J.; Huang, X.; Zhang, J.; Xiang, L.; Xiao, Y.; Fontana, L.; Ren, X.; Wang, Z. Pollen Record of Humidity Changes in the Arid Western Qilian Mountains over the Past 300 Years and Comparison with Tree-Ring Reconstructions. Front. Earth Sci. 2020, 8, 562426. [Google Scholar] [CrossRef]
- He, Y.; Liu, W.; Zhao, C.; Wang, Z.; Wang, H.; Liu, Y.; Qin, X.; Hu, Q.; An, Z.; Liu, Z. Solar influenced late Holocene temperature changes on the northern Tibetan Plateau. Sci. Bull. 2013, 58, 1053–1059. [Google Scholar] [CrossRef]
- Pu, Y.; Zhang, H.; Lei, G.; Chang, F.; Yang, M.; Zhang, W.; Lei, Y.; Yang, L.; Pang, Y. Climate variability recorded by n-alkanes of paleolake sediment in Qaidam Basin on the northeast Tibetan Plateau in late MIS3. Sci. China Earth Sci. 2010, 53, 863–870. [Google Scholar] [CrossRef]
- Tan, L.; Cai, Y.; Yi, L.; An, Z.; Ai, L. Precipitation variations of Longxi, northeast margin of Tibetan Plateau since AD 960 and their relationship with solar activity. Clim. Past 2008, 4, 19–28. [Google Scholar]
- Xu, J. A cave δ18O based 1800-year reconstruction of sediment load and streamflow: The Yellow River source area. Catena 2018, 161, 137–147. [Google Scholar] [CrossRef]
- Stager, J.C.; Ruzmaikin, A.; Conway, D.; Verburg, P.; Mason, P.J. Sunspots, El Niño, and the levels of Lake Victoria, East Africa. J. Geophys. Res. Atmos. 2007, 112, D15106. [Google Scholar] [CrossRef]
- van Loon, H.; Meehl, G.A.; Arblaster, J.M. A decadal solar effect in the tropics in July–August. J. Atmos. Sol. Terr. Phys. 2004, 66, 1767–1778. [Google Scholar] [CrossRef]
- Yang, B.; Qin, C.; Wang, J.; He, M.; Melvin, T.M.; Osborn, T.J.; Briffa, K.R. A 3500-year tree-ring record of annual precipitation on the northeastern Tibetan Plateau. Proc. Natl. Acad. Sci. USA 2014, 111, 2903–2908. [Google Scholar] [CrossRef]
- Lan, Y.; Zhao, G.; Zhang, Y.; Wen, J.; Liu, J.; Hu, X. Response of runoff in the source region of the Yellow River to climate warming. Quat. Int. 2010, 226, 60–65. [Google Scholar] [CrossRef]


Disclaimer/Publisher’s Note: The statements, opinions and data contained in all publications are solely those of the individual author(s) and contributor(s) and not of MDPI and/or the editor(s). MDPI and/or the editor(s) disclaim responsibility for any injury to people or property resulting from any ideas, methods, instructions or products referred to in the content. |
© 2023 by the authors. Licensee MDPI, Basel, Switzerland. This article is an open access article distributed under the terms and conditions of the Creative Commons Attribution (CC BY) license (https://creativecommons.org/licenses/by/4.0/).
Share and Cite
Bai, S.; Gao, J.; Pu, Y.; Zhi, D.; Yao, J. Exploring the Relationship between Hydroclimate and Lake Area in Source Area of the Yellow River: Implications for the Paleoclimate Studies. Atmosphere 2023, 14, 897. https://doi.org/10.3390/atmos14050897
Bai S, Gao J, Pu Y, Zhi D, Yao J. Exploring the Relationship between Hydroclimate and Lake Area in Source Area of the Yellow River: Implications for the Paleoclimate Studies. Atmosphere. 2023; 14(5):897. https://doi.org/10.3390/atmos14050897
Chicago/Turabian StyleBai, Shuying, Jixi Gao, Yang Pu, Da Zhi, and Jiaojiao Yao. 2023. "Exploring the Relationship between Hydroclimate and Lake Area in Source Area of the Yellow River: Implications for the Paleoclimate Studies" Atmosphere 14, no. 5: 897. https://doi.org/10.3390/atmos14050897