Article

Effects of Climate Change on Wheat Yield and Nitrogen Losses per Unit of Yield in the Middle and Lower Reaches of the Yangtze River in China

Jiangsu Key Laboratory of Crop Genetics and Physiology, Co-Innovation Center for Modern Production Technology of Grain Crops, Yangzhou University, Yangzhou 225009, China
*
Author to whom correspondence should be addressed.
Atmosphere 2023, 14(5), 824; https://doi.org/10.3390/atmos14050824
Submission received: 23 March 2023 / Revised: 24 April 2023 / Accepted: 30 April 2023 / Published: 3 May 2023

Abstract

:
Nitrogen fertilizer is one of the essential nutrients for wheat growth and development, and it plays an important role in increasing and stabilizing wheat yield. Future climate change will affect wheat growth, development, and yield, since climate change will also alter nitrogen cycles in farmland. Therefore, further research is needed to understand the response of wheat yield and nitrogen losses to climate change during cultivation. In this study, we investigate the wheat-producing region in the middle and lower reaches of the Yangtze River in China, one of the leading wheat-producing areas, by employing a random forest model using wheat yield records from agricultural meteorological observation stations and spatial data on wheat yield, nitrogen application rate, and nitrogen losses. The model predicts winter wheat yield and nitrogen losses in the middle and lower reaches of the Yangtze River based on CMIP6 meteorological data and related environmental variables, under SSP126 and SSP585 emission scenarios. The results show that future climate change (temperature and precipitation changes) will decrease winter wheat yield by 2~4% and reduce total nitrogen losses by 0~5%, but in other areas, the total nitrogen losses will increase by 0~5% and the N leaching losses per unit of yield will increase by 0~10%. The results of this study can provide a theoretical basis and reference for optimizing nitrogen application rates, increasing yield, and reducing nitrogen losses in wheat cultivation under climate change conditions.

1. Introduction

Clarifying the impact of climate on crop yields is crucial to ensure the resilience of agricultural production in changing environments. Currently, numerous studies have assessed the impact of climate change on crop yields from different scales (regional and global) [1,2]. The middle and lower reaches of the Yangtze River is an important grain-producing area in China, and the sown area of crops in this region is 40 million hm2. The total output has reached 160 million t, accounting for 24% of the national sown area and total output [3]. In the middle and lower reaches of the Yangtze River (1960–2019), the temperature and precipitation showed a fluctuating and rising trend, with trends of 0.22 °C per decade and 21.41 mm per decade, respectively. The temperature has been rising since 1995 and has increased significantly since 2001. The precipitation began to increase in 1989, but the trend has been insignificant [4]. Therefore, quantifying the of effect of future climate change is essential for wheat production in this region.
Currently, many studies have been reporting that an increase in temperature will reduce wheat yield. For example, Heting, et al. [5] found through statistical analysis that, between 1979 and 2014, the annual average temperature in the provinces of the Yangtze River Basin in China ranged from 14.16 to 18.96 °C, with a positive linear correlation between the annual average temperature and the year. However, the annual wheat yield showed an overall downward trend, with the most significant decline, in Sichuan Province, of 99.80 million tons per 10 years. Further analysis revealed a negative correlation between annual average temperature and wheat yield, with a significant correlation in Hunan, Jiangxi, and Sichuan provinces. Wiegand and Cuellar [6] pointed out that, within the range of 15.8–27.7 °C, for every 1 °C increase in the daily average temperature during the wheat grain filling period, the filling period would be shortened by 3.1 days and the thousand-grain weight would decrease by 2.8 mg. Challinor, et al. [7] found that under warming scenarios of 0–2 °C, 2–4 °C, and 4–6 °C, wheat yield in northeastern China would decrease by 2.4–18.6%, 6.6–30.6%, and 4.6–44.5%, respectively. Asseng, et al. [8] predicted, through a multi-crop model ensemble method, that the global wheat temperature sensitivity index would be about −5.7%. In the five provinces (regions) of Northwest China, the wheat temperature sensitivity index has been reported to be −0.023% [9]. The main reason for the decrease in wheat yield under higher temperature conditions is the significant impact of climate warming on the growth period of wheat, especially winter wheat. An increase in the average temperature throughout the growth period of winter wheat will cause delays in the sowing, overwintering, and regreening stages, while advancing the jointing, heading, and maturity stages, and shortening the growth phase, which is not conducive to dry matter accumulation and yield formation, ultimately affecting wheat production. However, some studies have pointed out that an increase in average temperature would be beneficial for increasing wheat yield. For example, Zheng, et al. [10] found that a 1 °C increase in nighttime temperature would shorten the pre-flowering growth period, extend the post-flowering growth period, and ultimately, would increase grain yield by about 10%. Zhou, et al. [11] found that, from 1957 to 2013, the temperature in the northern Shaanxi region increased at a rate of 0.22 °C per 10 years, with a 5-year temperature increment of 0.1 °C. An AquaCrop model simulation showed that when the average temperature during the crop growth period increased by 0.1 °C, the average winter wheat yield in Yulin and Yan’an increased by 1.5% and 0.5%, respectively, mainly because the increase in temperature was conducive to safe overwintering of winter wheat, and within a specific range, winter wheat yield increased with an increase in effective accumulated temperature. Different scholars have drawn different conclusions regarding an increase or decrease in wheat yield caused by temperature increase, mainly due to differences in factors such as latitude and longitude of test sites, crop variety differences, and soil texture.
Precipitation affects crop sowing dates, growth period days, and crop production. Pu, et al. [12] pointed out that precipitation during the crop growth period showed a decreasing trend, the actual yield also showed a downward trend, and there was a positive correlation between precipitation and yield during the growth period. Song, et al. [13] pointed out that precipitation in most years between 1961 and 2017 exceeded 50% of normal, which led to a sharp decline in winter wheat yield in the wetter Jiangsu and Anhui provinces in the study area. The change in winter wheat grain yield was mainly affected by May. The effect of excessive precipitation can explain 70~78% of the yield variation in humid regions.
Currently, assessing the impact of climate change on crop yields has been based on two types of model methods: statistical models [14] and process-based models [15]. Crop growth models have significant uncertainty in the relevant assessments [16], mainly due to the complexity of the relevant processes and the scarcity of the relevant datasets. Machine learning (ML) generally shows better performance compared to traditional linear regression models [17] because ML can capture the nonlinear relationship between dependent and independent variables and can handle the interactions between predictors [18]. In addition, compared to crop growth models, the ML method has higher operational efficiency in the spatial scale of regions and it can also capture the characteristics of yield fluctuations in extreme climates.
Studies on nitrogen losses at multiple scales have mainly been based on process mechanisms and empirical statistical models. Mechanistic process models are usually studied at the point scale, with more model parameters and inputs, which limits the application of mechanistic models at the regional scale. In contrast, empirical statistical models are widely used for estimating regional-scale nitrogen losses due to their simple calculations. However, such methods only take the sample mean as the result and consider fewer influencing factors, leading to their relatively low accuracy. Currently, the ML method has been used to estimate the nitrogen losses in farmland because it can capture the nonlinear relationship between the dependent and independent variables [19]. However, the lack of spatiotemporal data on yield and the environment (e.g., nitrogen fertilizer and planting dates) limits effective training models.
After strict correction and validation, a crop growth model can better simulate the impact of different nitrogen management measures on crop yield. However, the lack of sufficient validation data from actual farms leads to the limited application of crop growth simulation [20]. Even with well-calibrated simulation models, potential management schemes under different gas conditions at spatial scales are difficult to apply due to long running times and scale constraints. Although crop models can better simulate the nitrogen loss responses to different nitrogen use measures, model-based studies are only analyzed from a single-point scale. The high uncertainty in the input of the model can lead to high uncertainty in the simulation results of the model.
For analyzing wheat yield and nitrogen, the application of global circulation models (GCMs) from the Coupled Model Intercomparison Project Phase 6 (CMIP6) have received increasing attention. The CMIP6 is a collaborative project among global climate modeling teams that aims to improve climate models and to predict future climate scenarios in response to different greenhouse gas emission pathways [21]. GCMs from the CMIP6 have been successfully used to predict future climate change scenarios, including meteorological factors such as temperature and precipitation [22]. These predictions help to analyze the potential impacts of future climate change on wheat yield and nitrogen cycling. Studies have shown that climate data generated by GCMs from the CMIP6 can be combined with wheat growth models to assess the impact of climate change on wheat yield under different greenhouse gas emission scenarios [23]. This research helps to understand the potential risks of climate change on agricultural production and provides a basis for developing adaptation strategies. GCMs from the CMIP6 have been used to study how climate change affects nitrogen cycling in farmland, including nitrogen uptake, loss, and leaching [24]. This study helps to explore how agricultural ecosystems can adjust fertilization strategies to reduce nitrogen losses and environmental pollution under future climate conditions. Based on the results of wheat yield and nitrogen analysis using GCMs from the CMIP6, scientific evidence can be provided for developing agricultural climate adaptation strategies [25], which includes optimizing fertilization, adjusting crop planting structure, and improving irrigation management, to increase agricultural production efficiency and to mitigate the negative impacts of climate change on agricultural ecosystems.
In this study, based on a random forest model, the meteorological data of SSP126 and SSP585 and the middle and lower emission scenarios of the CMIP6, are used to evaluate the influence of future climate change on the temporal variation in the middle and lower reaches of the Yangtze River, and the influence of nitrogen losses and the nitrogen losses per unit of yield. On this basis, a random forest model was validated for predicting yield and nitrogen losses, to further research the effect of future climate change, in the middle and lower reaches of the Yangtze River, on winter wheat yield and the response relationship between nitrogen use and nitrogen losses, according to the yield and the response curve of nitrogen losses to nitrogen use, to establish the lower limit. Finally, the spatial distribution and temporal trend characteristics of winter wheat yield and nitrogen losses per unit of yield were analyzed at the lower and upper limits, in the middle and lower reaches of the Yangtze River.

2. Materials and Methods

2.1. Random Forest Model for Predicting Yield and Nitrogen Losses

Luo, et al. [26] created a 1 × 1 km resolution map of wheat planting distribution in China based on remote sensing observations and machine learning algorithms. Tian, et al. [27] used this planting distribution to resample the survey data of wheat yield, in 2014, to a 1 × 1 km resolution grid, achieving spatial matching. In their study, the geographical boundaries of the middle and lower reaches of the Yangtze River were used to extract the spatial data of wheat yield in the region, totaling 22,811 data points. This dataset was mainly used to establish a random forest prediction model for wheat yield and spatial wheat yield prediction. In this study, the dataset comprised agricultural meteorological station field observation yield data for the middle and lower reaches of the Yangtze River, from 2000 to 2015, and was obtained from the National Meteorological Science Data Center/China Meteorological Data Network (https://data.cma.cn accessed on 12 November 2022). This dataset provides each station’s average wheat yield and county. The dataset was mainly used to test the predictive ability of the wheat yield random forest model for interannual variability in wheat yield.
Random forest model construction and impact factor analysis were completed in R 4.0.0, mainly using the R language package ”randomForest”. Its pseudo equation is:
Y i e l d   ~   N   r a t e + M A P + M A T + p H + S O M + T N + B D + S a n d + S i l t + C l a y ,
where Yield represents wheat yield (kg hm−2); N rate represents the nitrogen application rate (kg N hm−2); MAP and MAT represent the annual precipitation (mm) and mean annual temperature (°C), respectively; pH, SOM, and TN represent the soil pH value, soil organic matter content (%), and soil total nitrogen content (%), respectively; BD, Sand, Silt, and Clay represent the soil bulk density (g cm−3), soil sand content (%), soil silt content (%), and soil clay content (%), respectively.
The nitrogen loss coefficients from different pathways were obtained by Tian et al. (2022) The dataset used in this study included wheat yield, nitrogen application rate, climatic factors (annual precipitaton and annual mean temperature), and soil physical and chemical properties (Table 1).
Tian et al. (2022) constructed a prediction model of nitrogen loss coefficients under different environmental factors based on the random forest algorithm, that provided emission factors for different nitrogen loss pathways in the national wheat grid, including nitric oxide (NO), nitrous oxide (N2O), ammonia volatilization (NH3), nitrogen leaching (NO3), and nitrogen runoff (Nr) loss coefficients for five nitrogen loss pathways. Based on the random forest algorithm, the nitrogen losses and total nitrogen losses under different paths of wheat production, in 2014, were estimated from the bottom-up N application rate data obtained from investigations of millions of farmers, and the corresponding database was established.

2.2. Future Climate Change Data

Future climate change data under the CMIP6 are the BCC-CSM 2-MR model output, average temperature, precipitation data, and data resolution of 0.25 ∗ 0.25°, including SSP126 and SSP585 emission scenarios. The data can be obtained via https://ds.nccs.nasa.gov/thredds/catalog/AMES/NEX/GDDP-CMIP6/catalog (accessed on 12 November 2022). The future weather data were resampled to 0.1° ∗ 0.1° resolution through the R language “Raster” package to keep the model data resolution consistent.
For bias correction, we adopted the method by Xu, et al. [28] of providing an error correction method based on multimodal ensembles. Based on the advantages of previous general circulation model (GCM) error correction methods, this correction method further introduces the nonlinear trend of 18 GCM sets to reduce the problem of significant uncertainty in the prediction results of a single GCM. The results show that the data’s ability to describe the multivariate climate mean state, interannual variability, and extreme events is significantly better than that of the CMIP6 model without error correction [28].

2.3. Relative Historical Changes in Yield, Nitrogen Losses, and Nitrogen Losses per Unit of Yield of Farmland

For the SSP126 and SSP585 emission scenarios, calculate the change in the two future periods (2031–2065 and 2066–2100) minus the annual average of the base year (2001–2015), divided by the annual average of the base year (2001–2015) and the change in nitrogen losses per unit of yield using the formula as follows:
Y s , f = Y mean , s , f Y mean , s , b Y mean   , s , b × 100 % ,
N L Y s , f = N L Y mean , s , f N L Y mean , s , b N L Y mean , s , b × 100 % ,
where Y s , f and N L Y s , f are the output and nitrogen losses per unit output of the emission scenario s corresponding to the future period f, respectively. Y mean , s , f is the multi-year average output of emission scenario s corresponding to future period f, kg ha−1. N L Y mean , s , f is the multi-year average of nitrogen losses per unit output corresponding to future period f under emission scenario s, kg N × 1000 kg W−1ha−1. Y mean , s , b is the multi-year average of the base annual production, kg ha−1. N L Y mean , s , b is the multi-year average of nitrogen losses per unit of yield in the base year, kg N × 1000 kg W−1ha−1.

2.4. Nitrogen Adjustment Strategy

The nitrogen adjustment strategy was achieved by adjusting the nitrogen usage based on the amount of nitrogen used in each grid, from 0.5 times less to 0.5 times more nitrogen input, to generate a spatial grid scale nitrogen management scenario [29]. Future climate change data and other environmental variables (latitude, soil, pH, sand, mucus, organic matter, powder, soil total nitrogen, and soil bulk density) were combined, driving random forest yield prediction models to simulate the SSP126 and SSP585 scenarios 2001–2100. Nitrogen losses were estimated based on the loss coefficients under different paths and different nitrogen usages at spatial grid scales. Finally, the nitrogen losses per unit of yield was estimated based on the nitrogen loss and yield under different nitrogen management measures [30].

2.5. Minimum Nitrogen Reduction Limit and Maximum Nitrogen Increase Limit

The minimum N reduction limit was determined from the intersection of the yield and N losses per unit of yield to N use on the response curve under the reduced N use measure, and the first point of the most significant change in the yield response curve under the increased N use measure determines the maximum N increase limit [31].

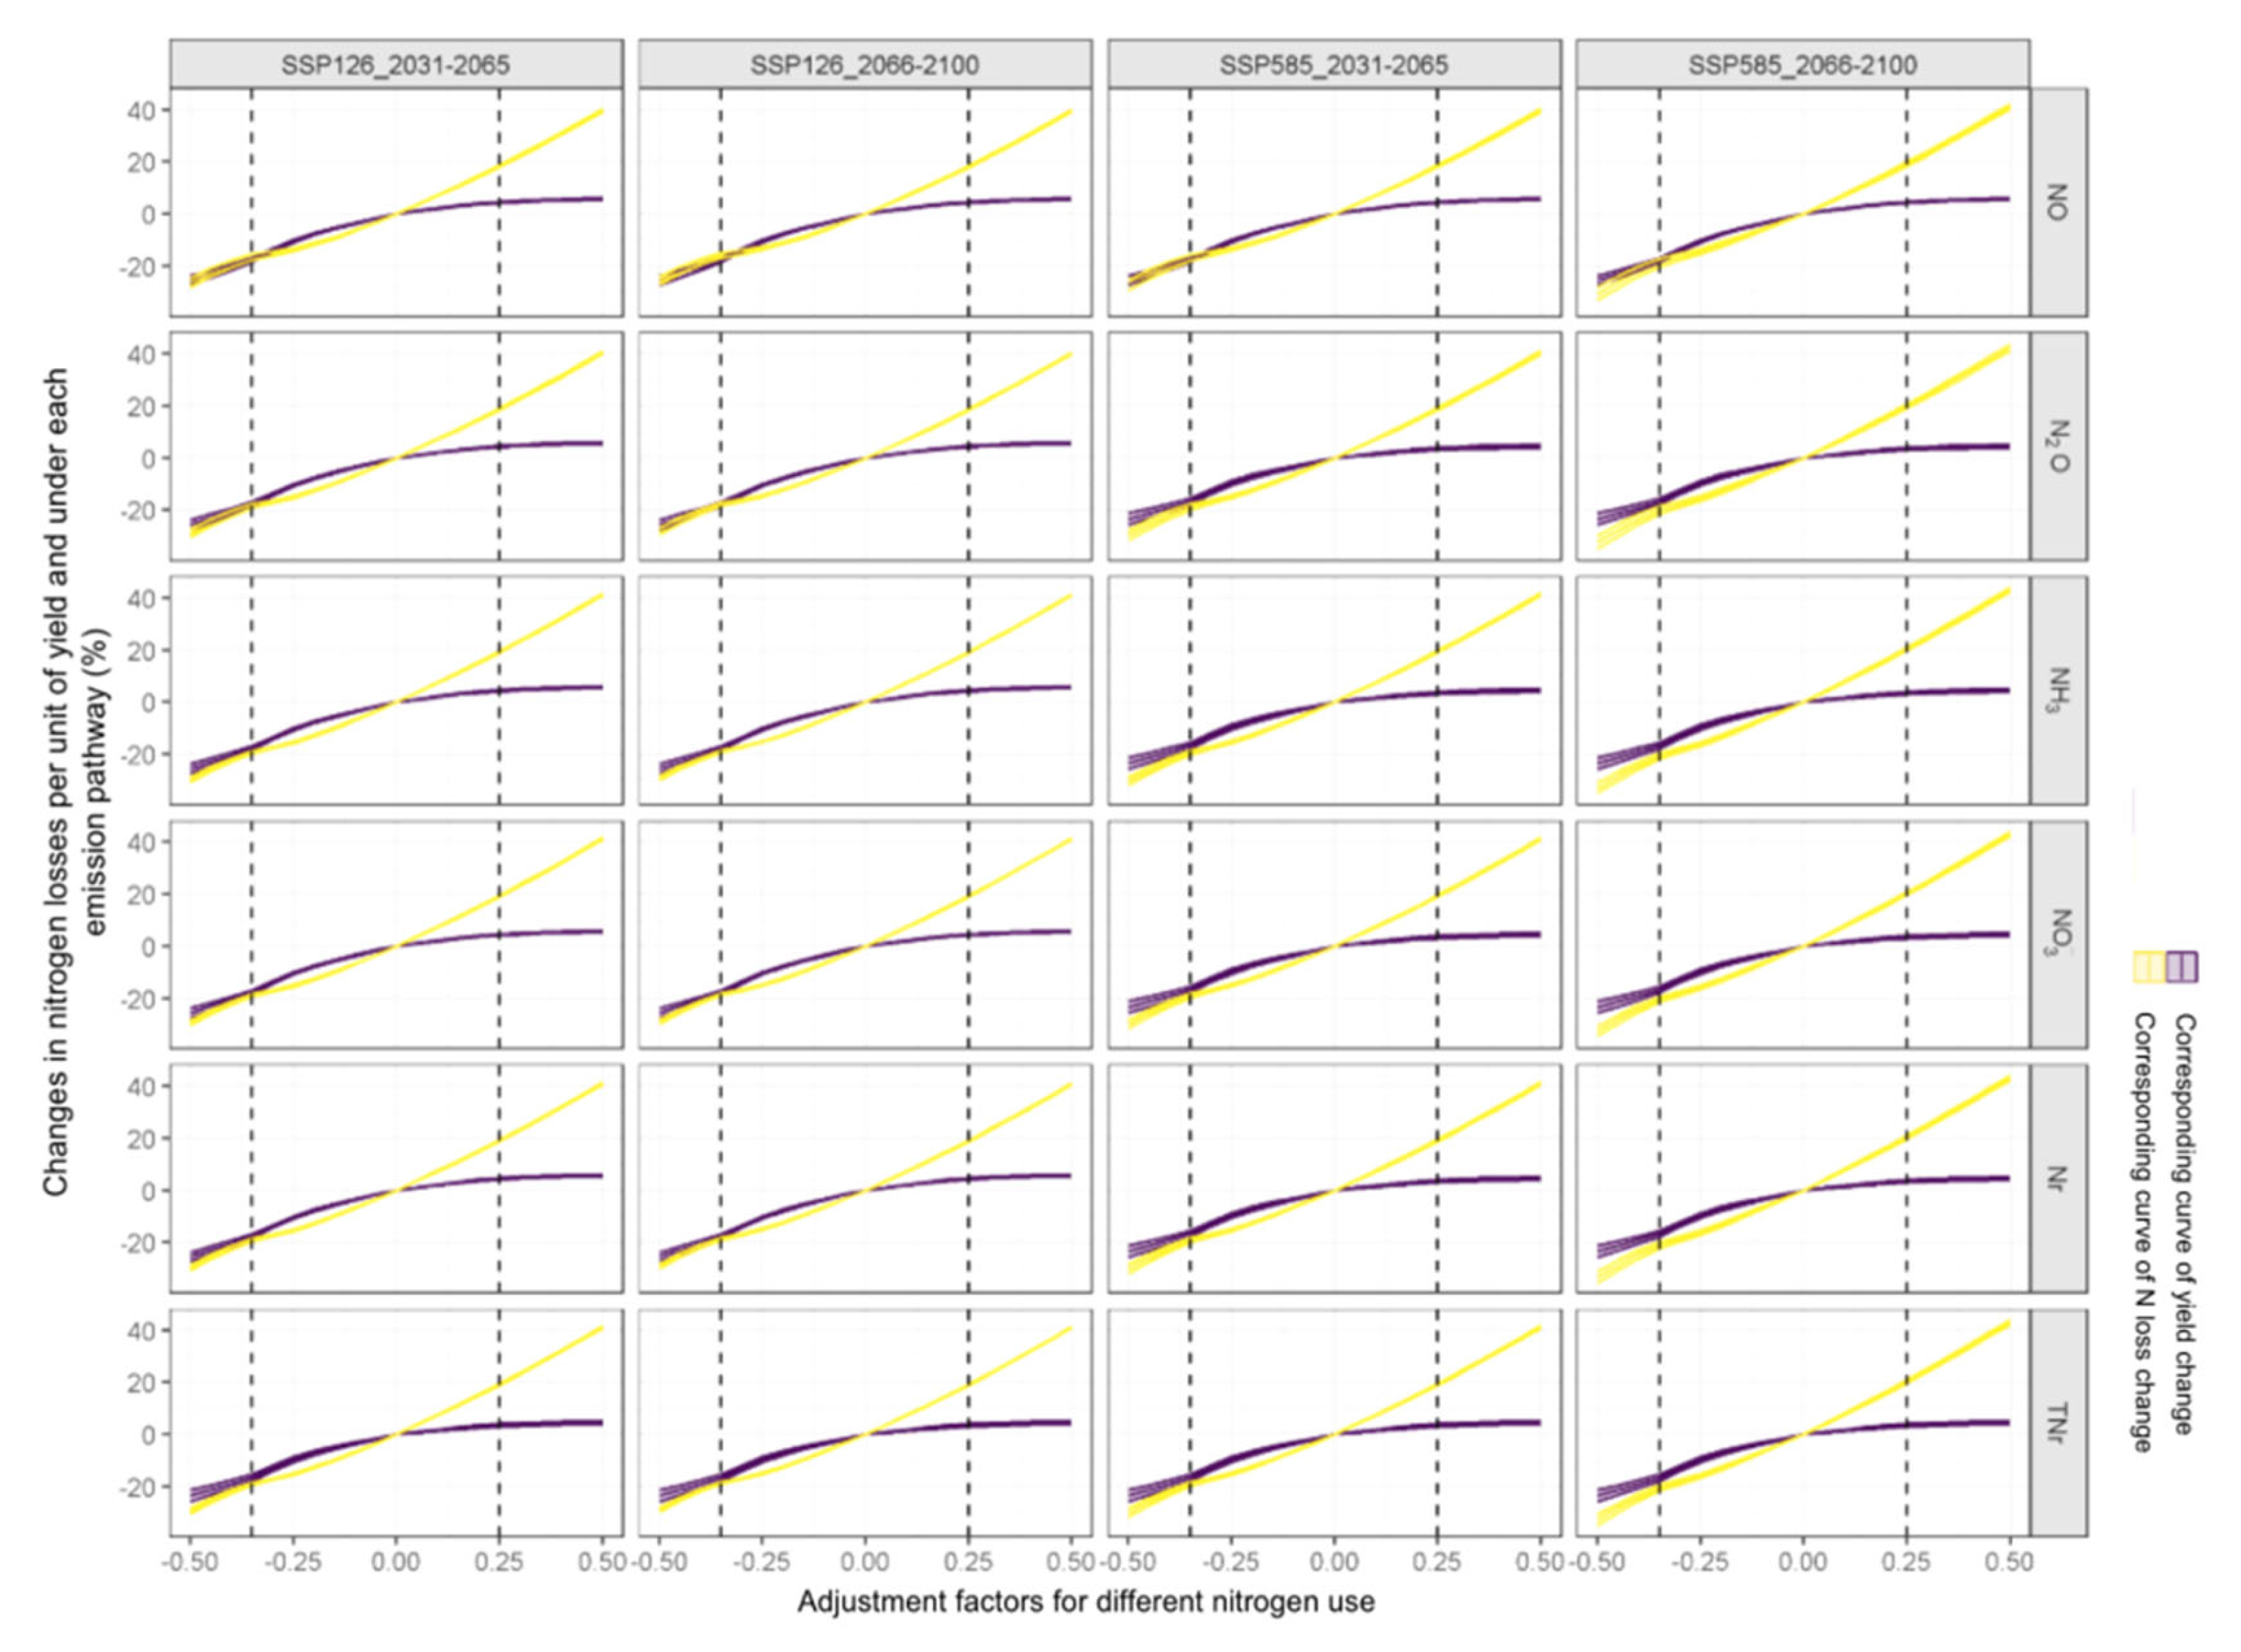
2.6. Production and Unit Yield Response Curve of Nitrogen Losses to Nitrogen Use

A dimensionality reduction analysis of the data by yield and by unit of yield can provide a more intuitive analysis of regional nitrogen management measures under future climate change and the impact on wheat yield and nitrogen losses per unit of yield in the study area. Under four future climate scenarios, divide the difference of the annual average of each nitrogen usage minus the conventional nitrogen usage by the annual average of the conventional nitrogen usage, average the average of the corresponding nitrogen usage, and find the nitrogen losses per unit of yield, see Equations (4) and (5):
Y s , n = ( ( i = 1 i = m Y mean , s , n , i - Y mean , s , i Y mean , s , i ) ÷ m ) × 100 %
N L Y s , n = ( ( i = 1 i = m N L Y mean , s , n , i - N L Y mean , s , i N L Y mean , s , i ) ÷ m ) × 100 %
where Y s , n   and N L Y s , n are the average changes in yield and nitrogen losses per unit of yield of climate change scenario s corresponding to nitrogen application rate n, respectively. Y mean , s , n , i is the multi-year average yield of grid i in climate change scenario s corresponding to nitrogen application rate n, kg ha−1; N L Y mean , s , n , i are the multi-year averages of nitrogen losses per unit of yield of grid i in climate change scenario s corresponding to nitrogen application rate n, kg N × 1000 kg W−1ha−1; Y mean , s , i is the multi-year average yield of grid i under the conventional nitrogen application rate in climate change scenario s, kg ha−1; N L Y mean , s , i are the multi-year averages of nitrogen losses per unit of output for grid i under the conventional nitrogen application rate in climate change scenario s, kg N × 1000 kg W−1ha−1; m is the total number of spatial grids.

3. Results and Analysis

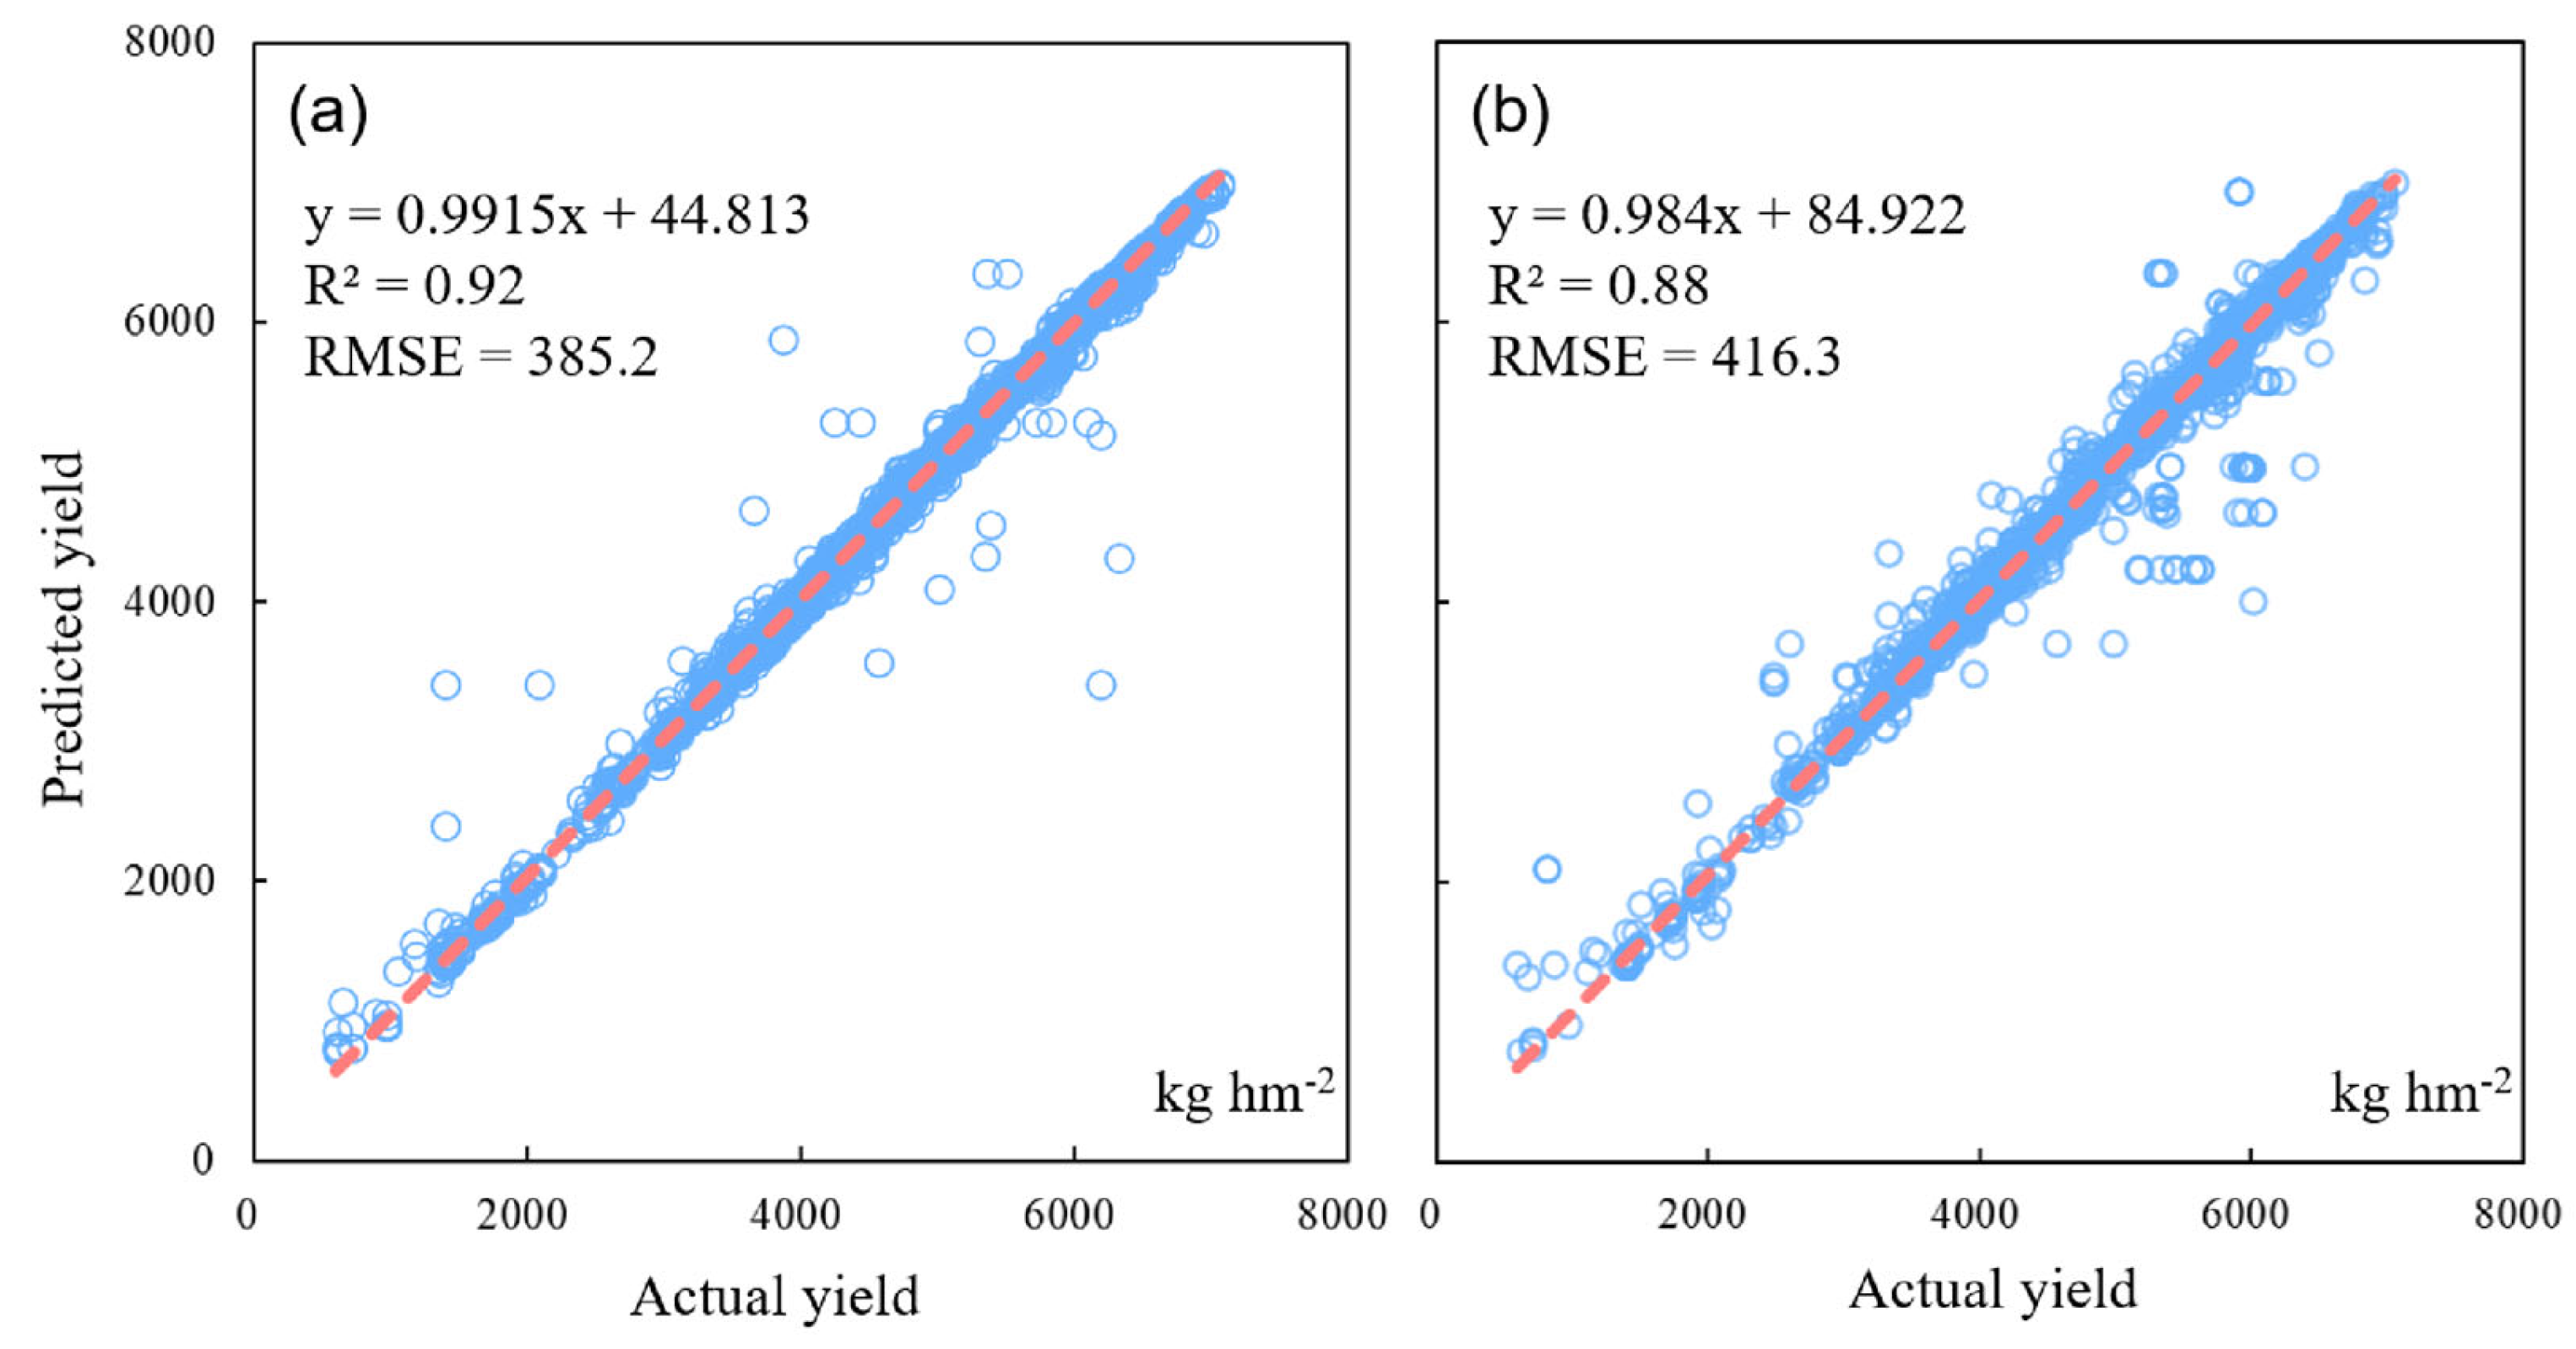
3.1. Validation of Wheat Yield Prediction Model

To establish a predictive model based on wheat yield in 2014 and corresponding spatial data, we constructed a random forest prediction model using nitrogen application rate, climate factors (annual precipitation and average annual temperature), soil physical and chemical properties (organic matter, total nitrogen, pH, bulk density, sand content, silt content, and clay content), and wheat yield. The results of 10-fold cross-validation show that the wheat yield prediction model performs well, with a training set R2 = 0.92, RMSE = 385.2 kg hm−2, and a test set R2 = 0.88, RMSE = 416.3 kg hm−2. The slopes between the measured and predicted values in the training set and test set are 0.97 and 0.93, respectively, indicating good consistency between the predicted and measured values of the established random forest model (Figure 1).

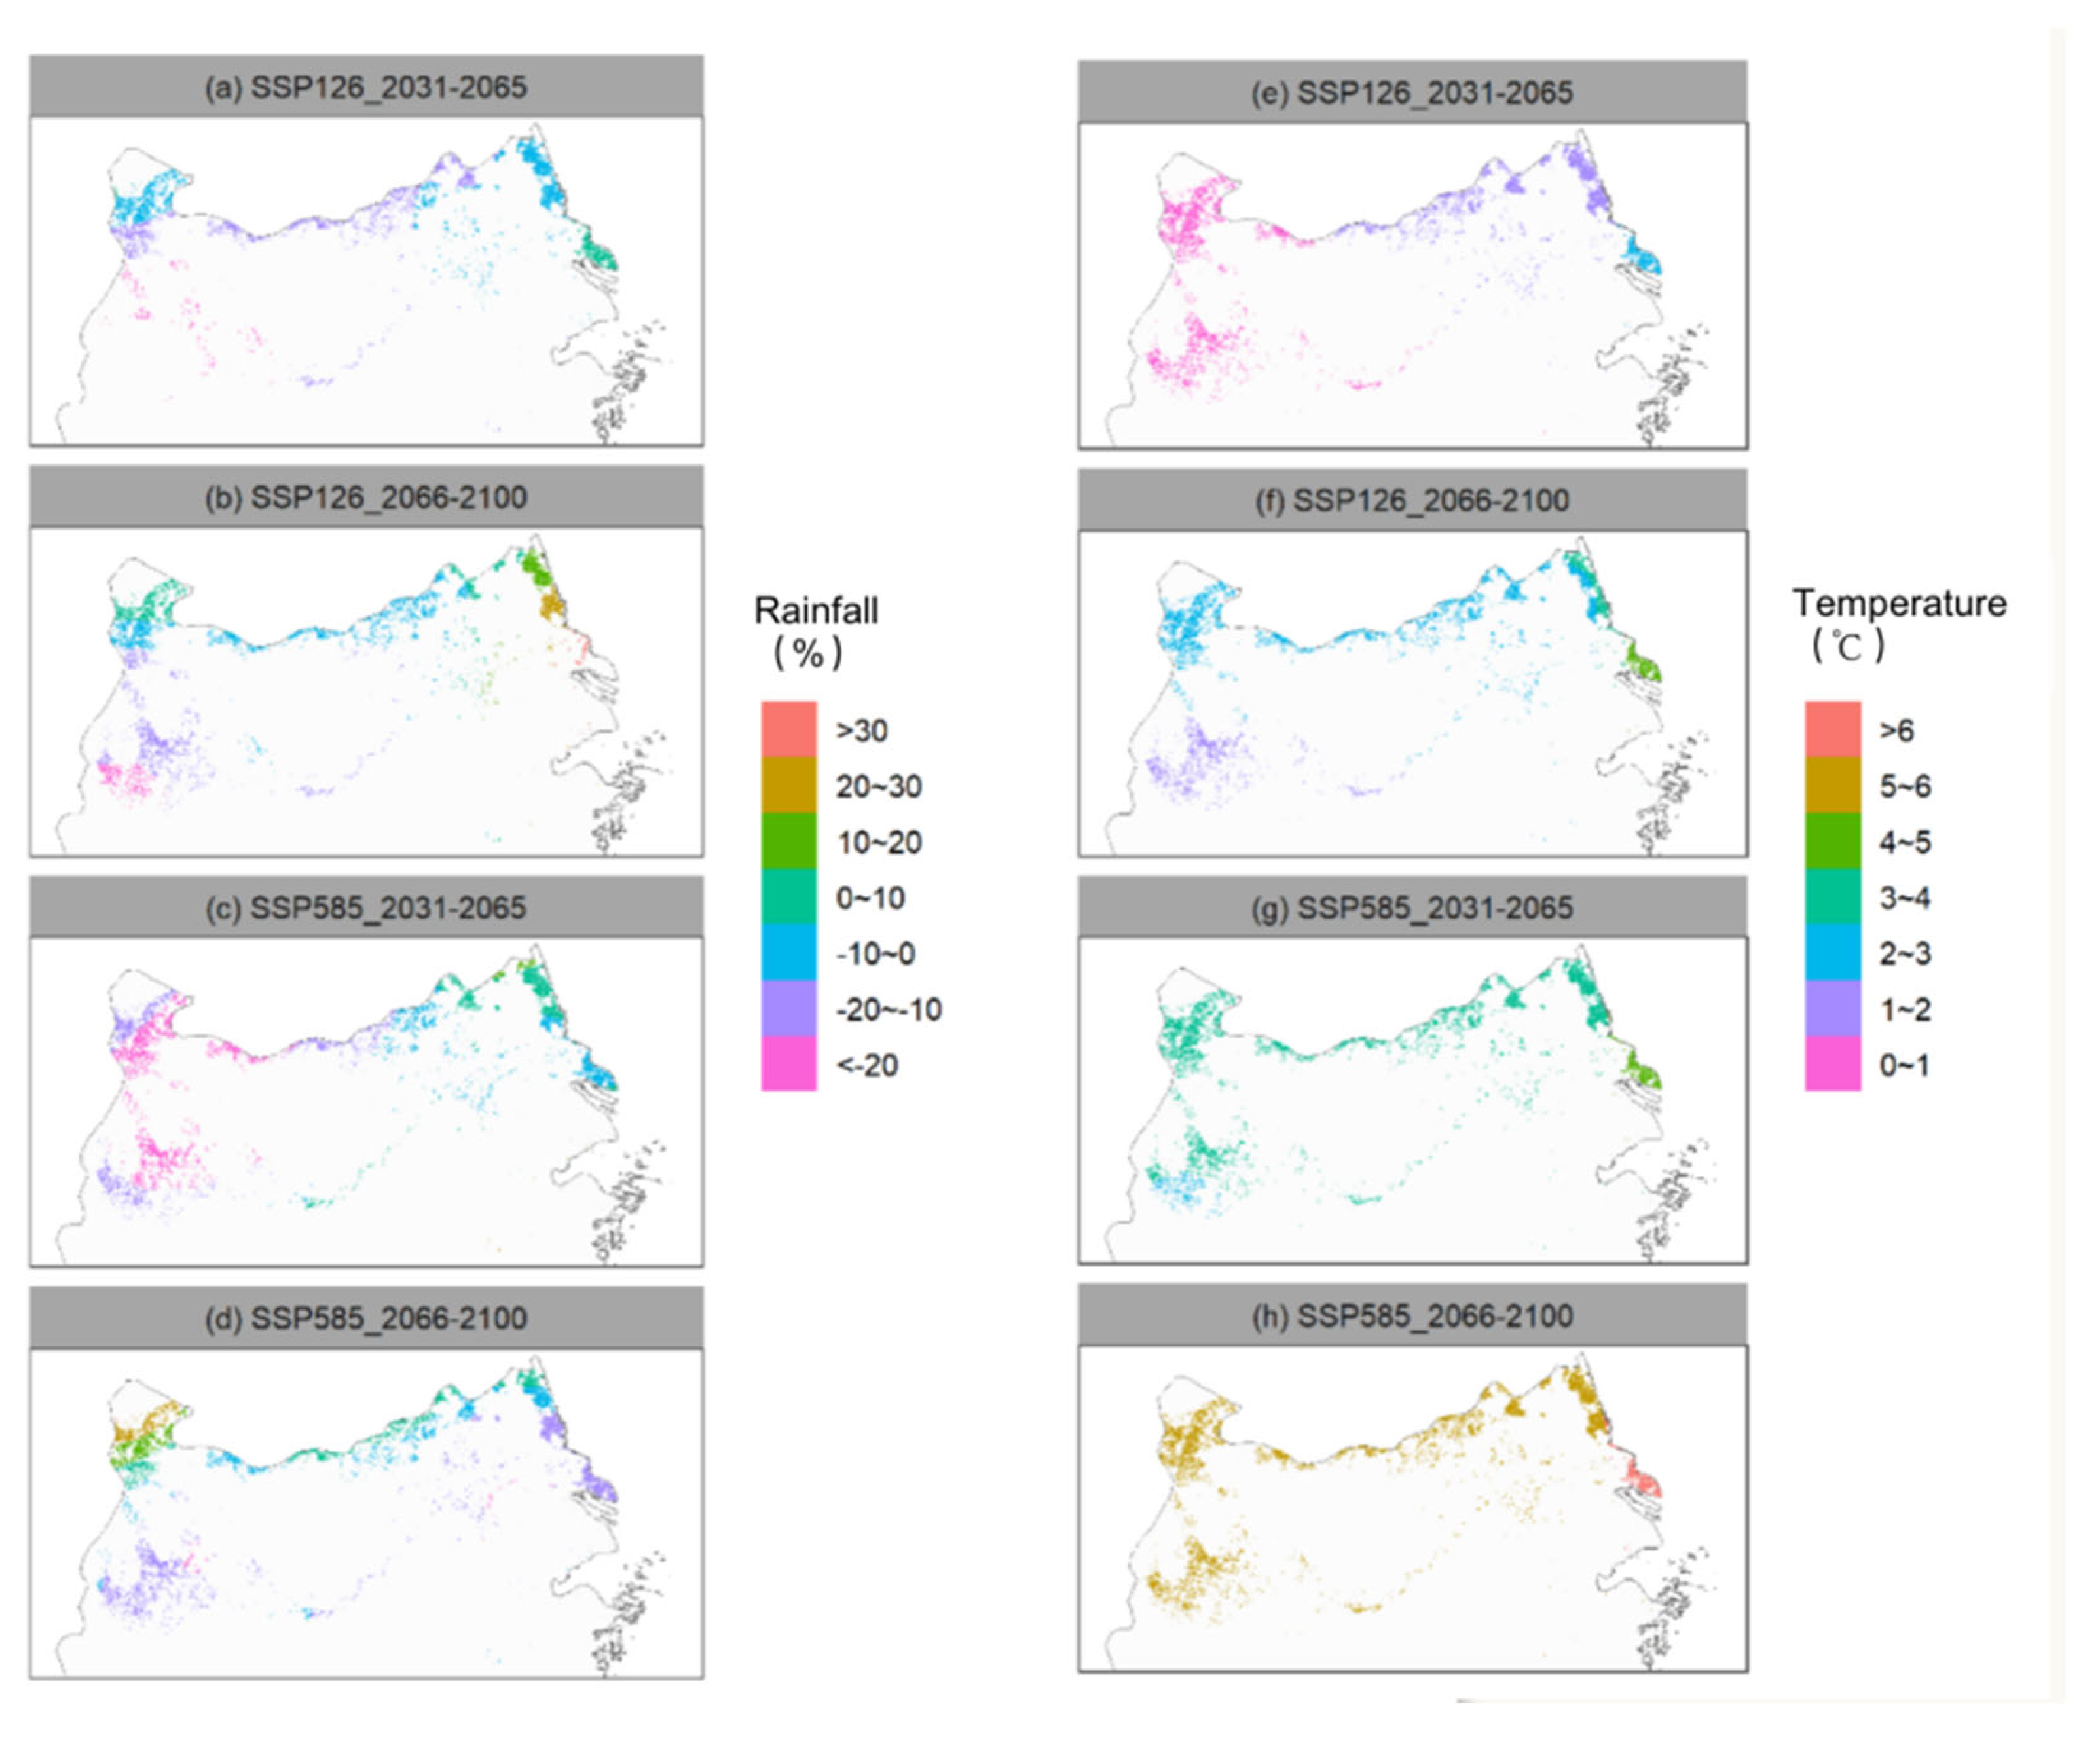
3.2. Spatial and Temporal Changes in the Temperature and Precipitation in the Middle and Lower Reaches of the Yangtze River under Future Climate Change

In the two periods under the two emission scenarios, the relative precipitation variation in the middle and lower reaches of the Yangtze River is very different. In the “SSP126_2031-2065” scenario, the relative historical change in the annual cumulative precipitation is −10%~0 for the eastern and northwest regions and −20%~−10% for the southwest, and it decreased by more than 20% (Figure 2a). In the case of the SSP126_2066-2100 scenario, the spatial distribution pattern of annual cumulative precipitation in the middle and lower reaches of the Yangtze River is similar to that of the SSP126_2031-2065 scenario. However, the change magnitude is more significant than that of the SSP126_2031-2065 scenario (Figure 2b). Under the SSP585 scenario, there is no apparent spatial gradient distribution pattern of the annual cumulative precipitation in this region, i.e., overall, there are areas with less precipitation and with more precipitation (Figure 2c,d).
Climate change will lead to an increase in the middle and lower reaches of the Yangtze River, with average increases of 0~2 and 2~3 °C between 2031 and 2065 and between 2065 and 2100 (Figure 2e–f), and the average increase is 2–5 °C in 2065 and 2065–2100 in the SSP585 scenario (Figure 2g,h). Spatially, the temperature increases in scenario SSP126_2031-2065 are more influential in the eastern region than in the western region; in the other three climate change scenarios, the northern region is more influential than the southern region. Overall, the eastern region has the most significant temperature increase under the four climate change scenarios and the smallest temperature increase in the four scenarios (Figure 2e–h).

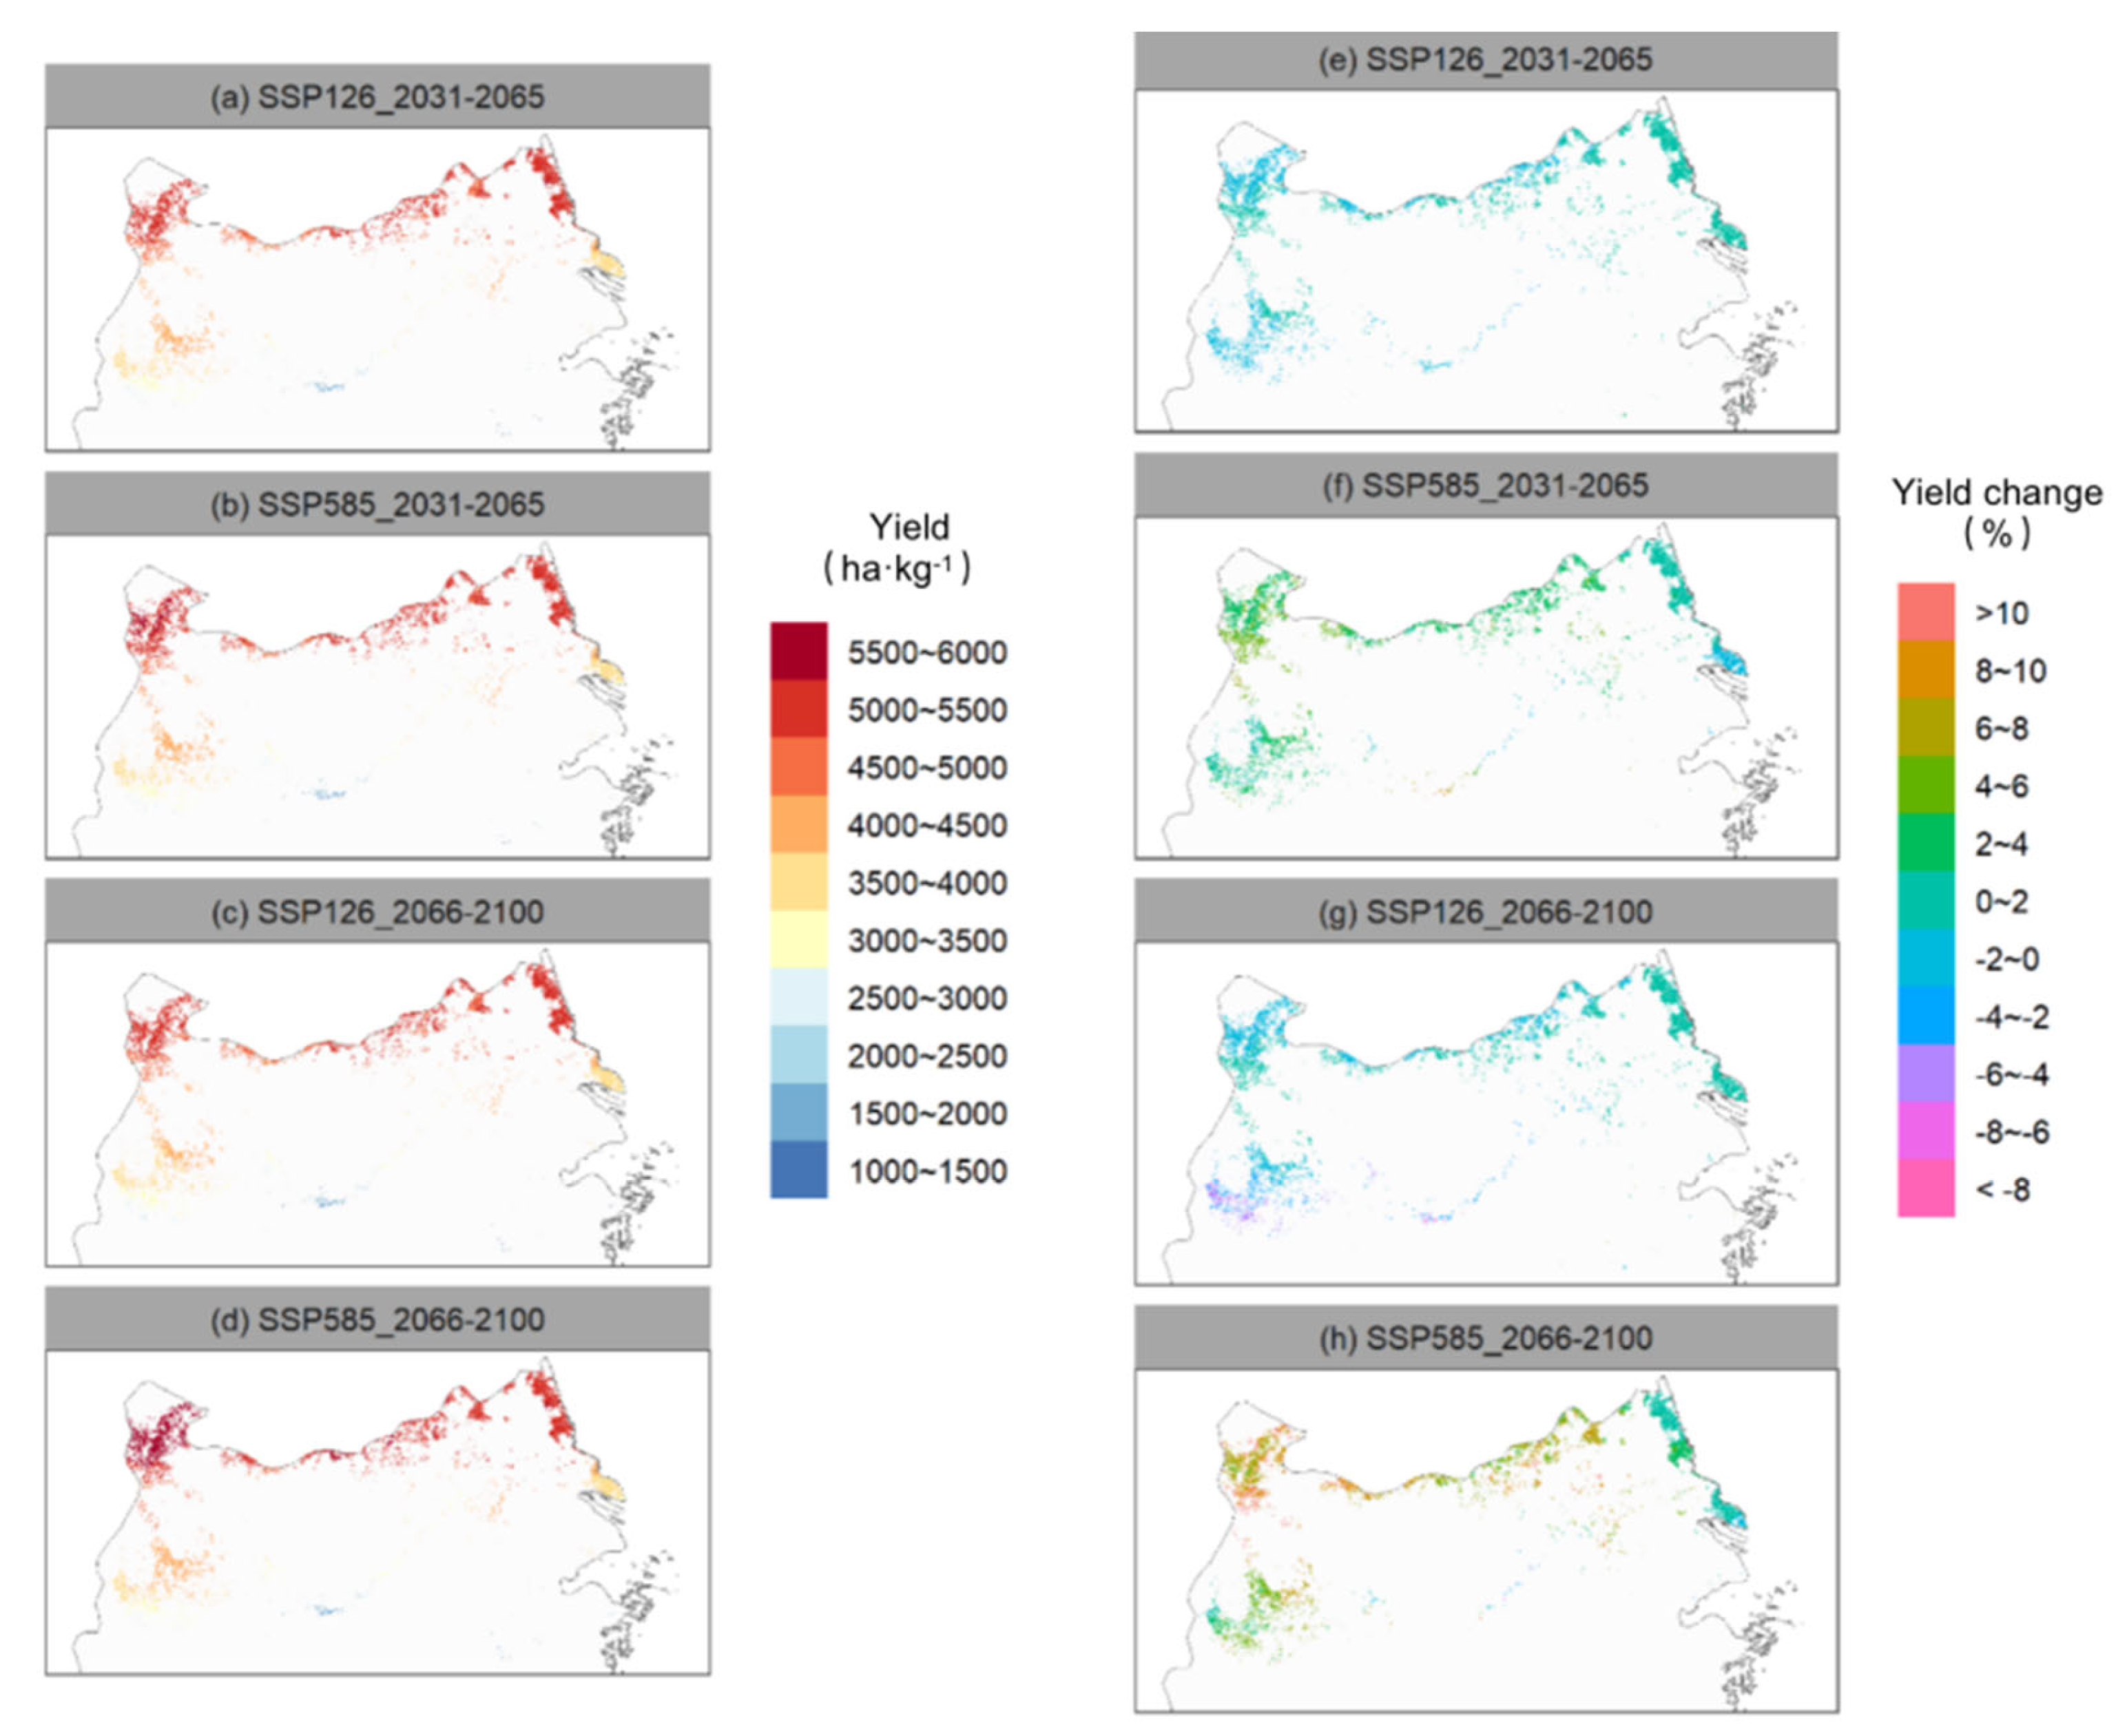
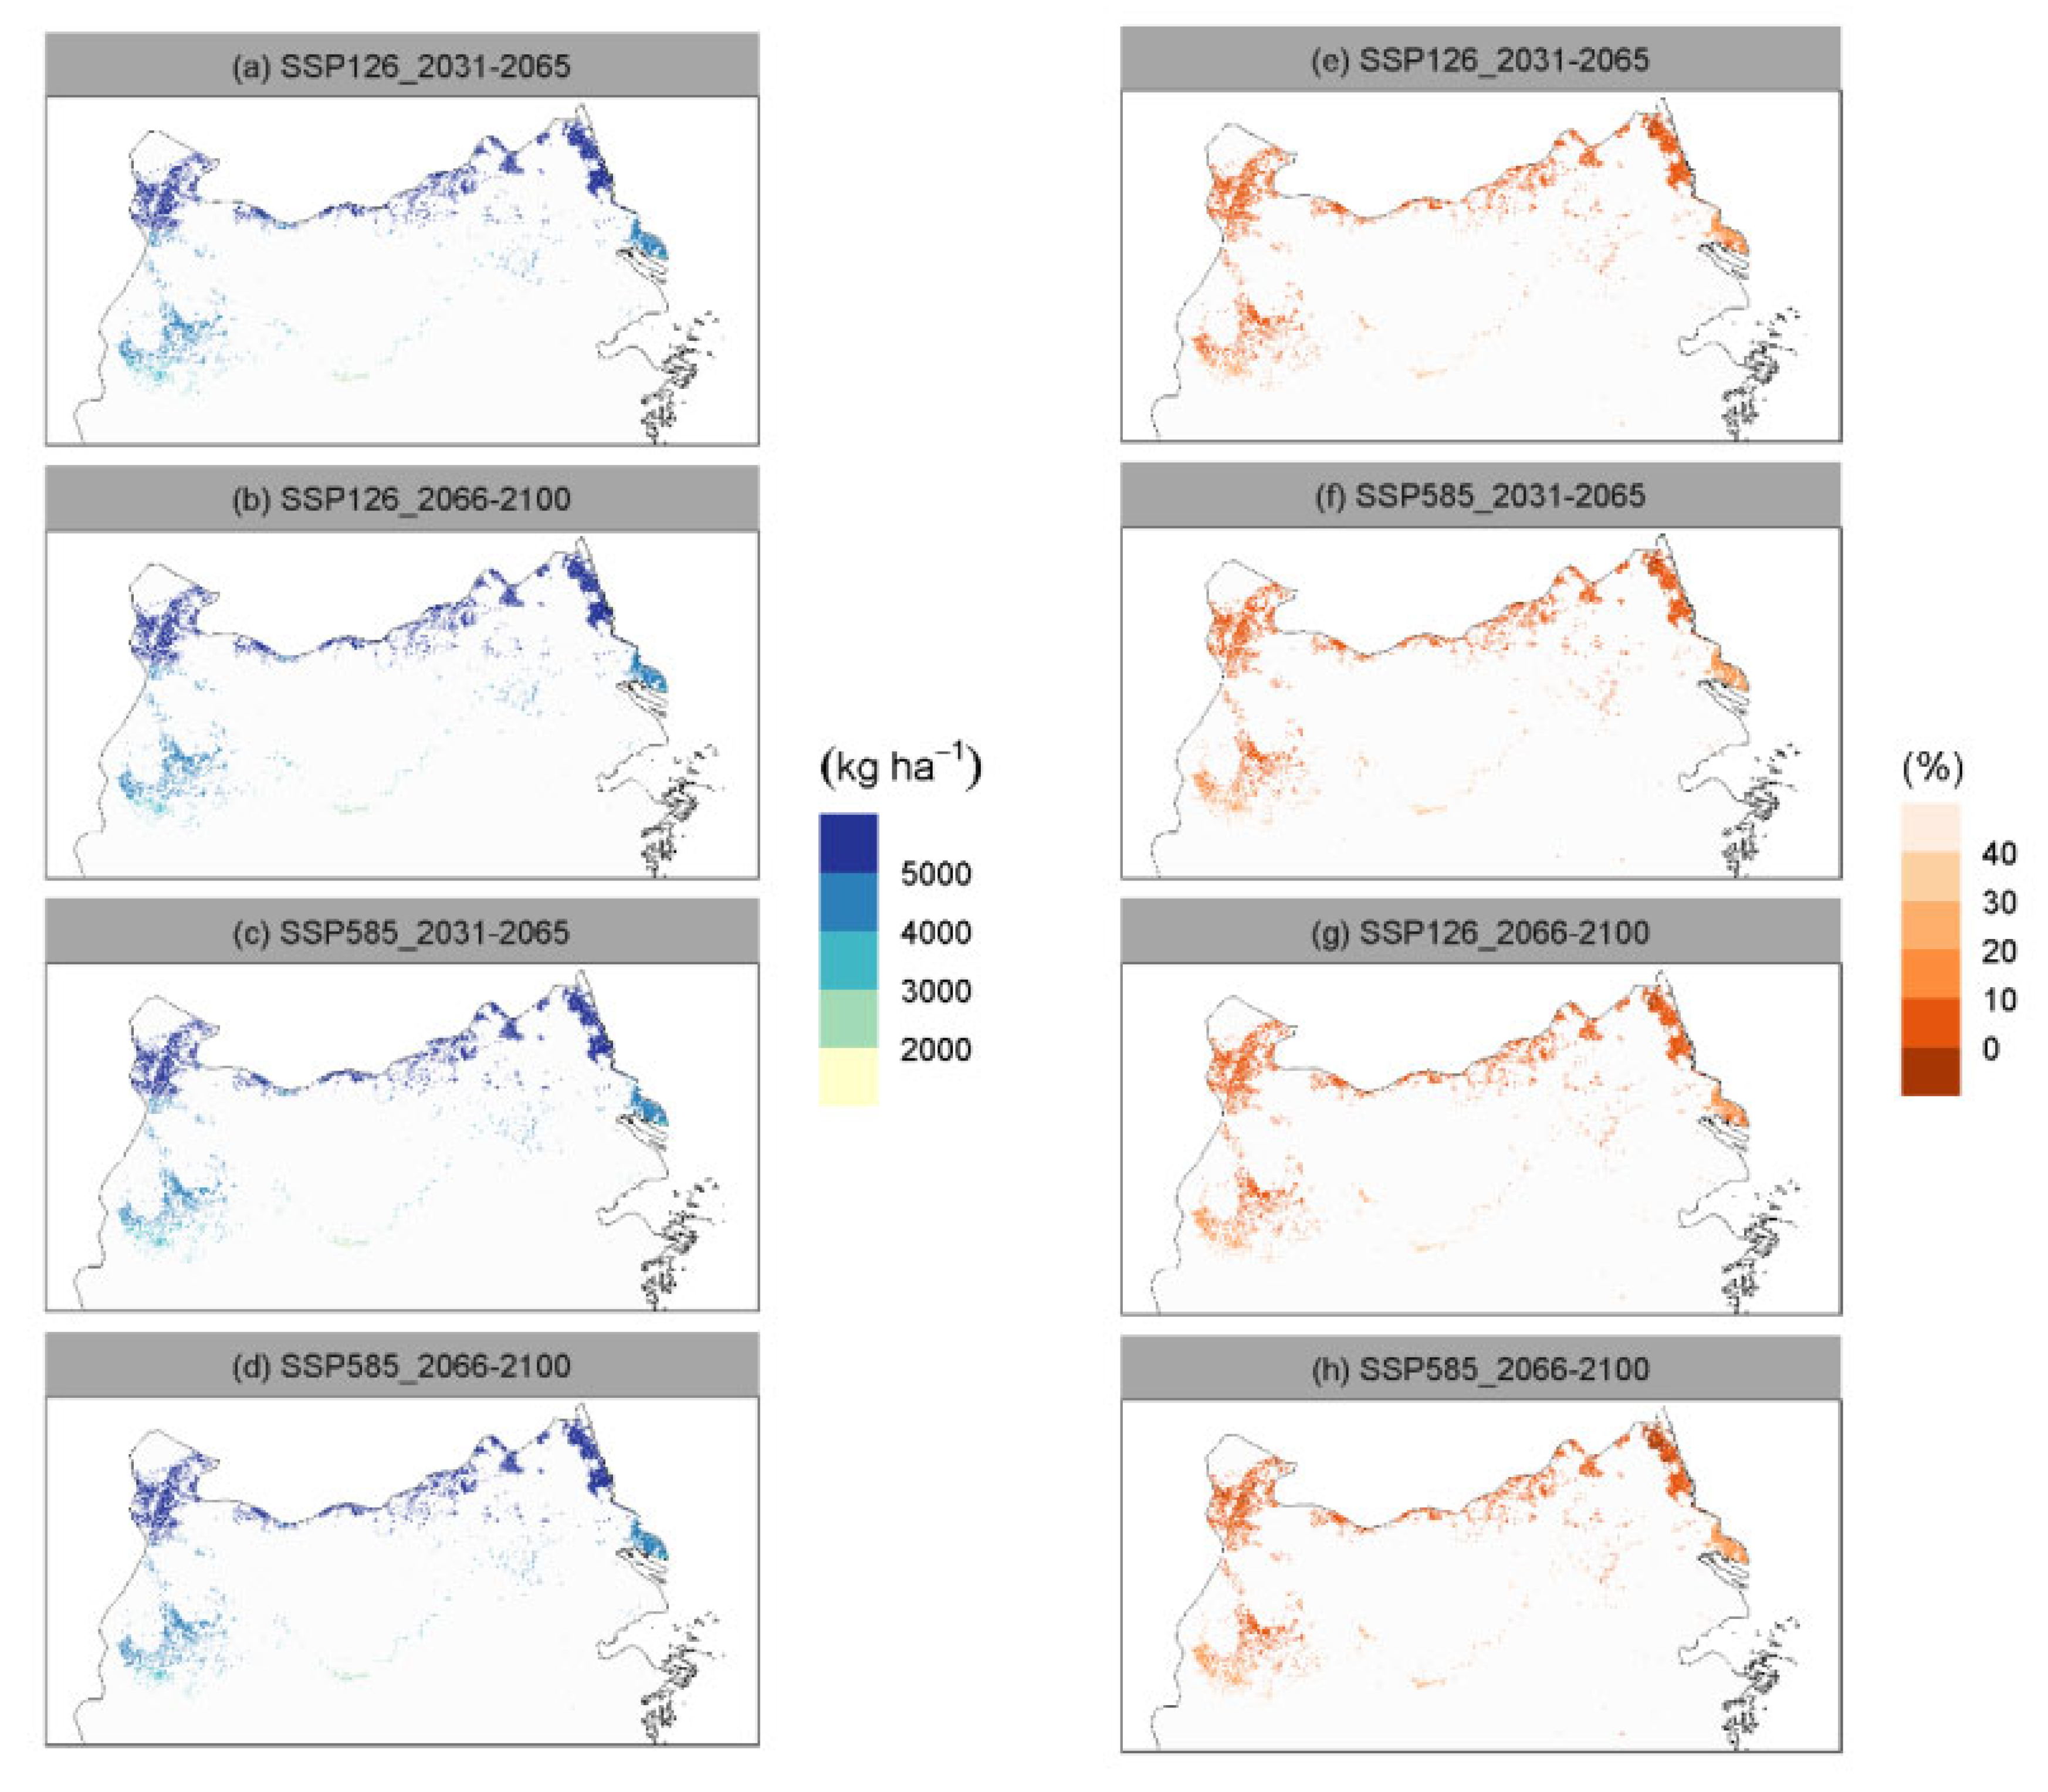
3.3. Spatial and Temporal Changes in Wheat Yield in the Middle and Lower Reaches of the Yangtze River under Future Climate Change

Based on the temperature and precipitation data under the two emission scenarios from the CMIP6, the random forest model predicted the winter wheat yield for two periods (i.e., 2031–2065 and 2066–2100). The results show that the prediction results for the spatial distribution of winter wheat yield in this region under the four climate change scenarios show the same patterns as the historical simulation distribution, i.e., high in the north and low in the south (Figure 3a–d). In the SSP126 scenario, the average yield result for 2031–2065 is about 1000–5500 kg/ha (Figure 3a), the relative historical change of output is −4%~−2% (Figure 3e); the average output range for 2066–2100 is close to that for 2031–2065, and the relative historical change of output is −8%~−2% (Figure 3g), but there are more low-value areas in the southern middle and lower reaches of the Yangtze River (Figure 3c).
Under the SSP585 scenario, the prediction results of winter wheat yield in the middle and lower reaches of the Yangtze River are more variable in the temporal and spatial dimensions. In the SSP585_2031-2065 scenario, the region yield averaged 1000–5500 kg/ha (Figure 2b), the relative historical change of output is −4%~6% (Figure 2f), and the predicted average increase of output in the middle and lower reaches of the Yangtze River is 2~6%. The relative historical decrease in other regions is about 4% (Figure 2f). In the SSP585_2066-2100 scenario, the average yield in this region is 1000–6000 kg/ha(Figure 2d), the relative historical change of the output is −4%~8% (Figure 2h), the predicted average output increase in the western region of the middle and lower reaches of the Yangtze River is 6%~8%, and the relative historical decrease in the eastern region is about 4% (Figure 2h). In terms of space, the winter wheat yield in the eastern region of the middle and lower reaches of the Yangtze River is predicted to decrease by about 4%, on average, under the four climate change scenarios. In comparison, the northwest region of the middle and lower reaches of the Yangtze River is predicted to increase under the SSP585 scenario. In terms of time, winter wheat in the middle and lower reaches of the Yangtze River will decrease in the SSP126 scenario; in SSP585 scenario, the winter wheat yield in this region will decrease in the two periods.

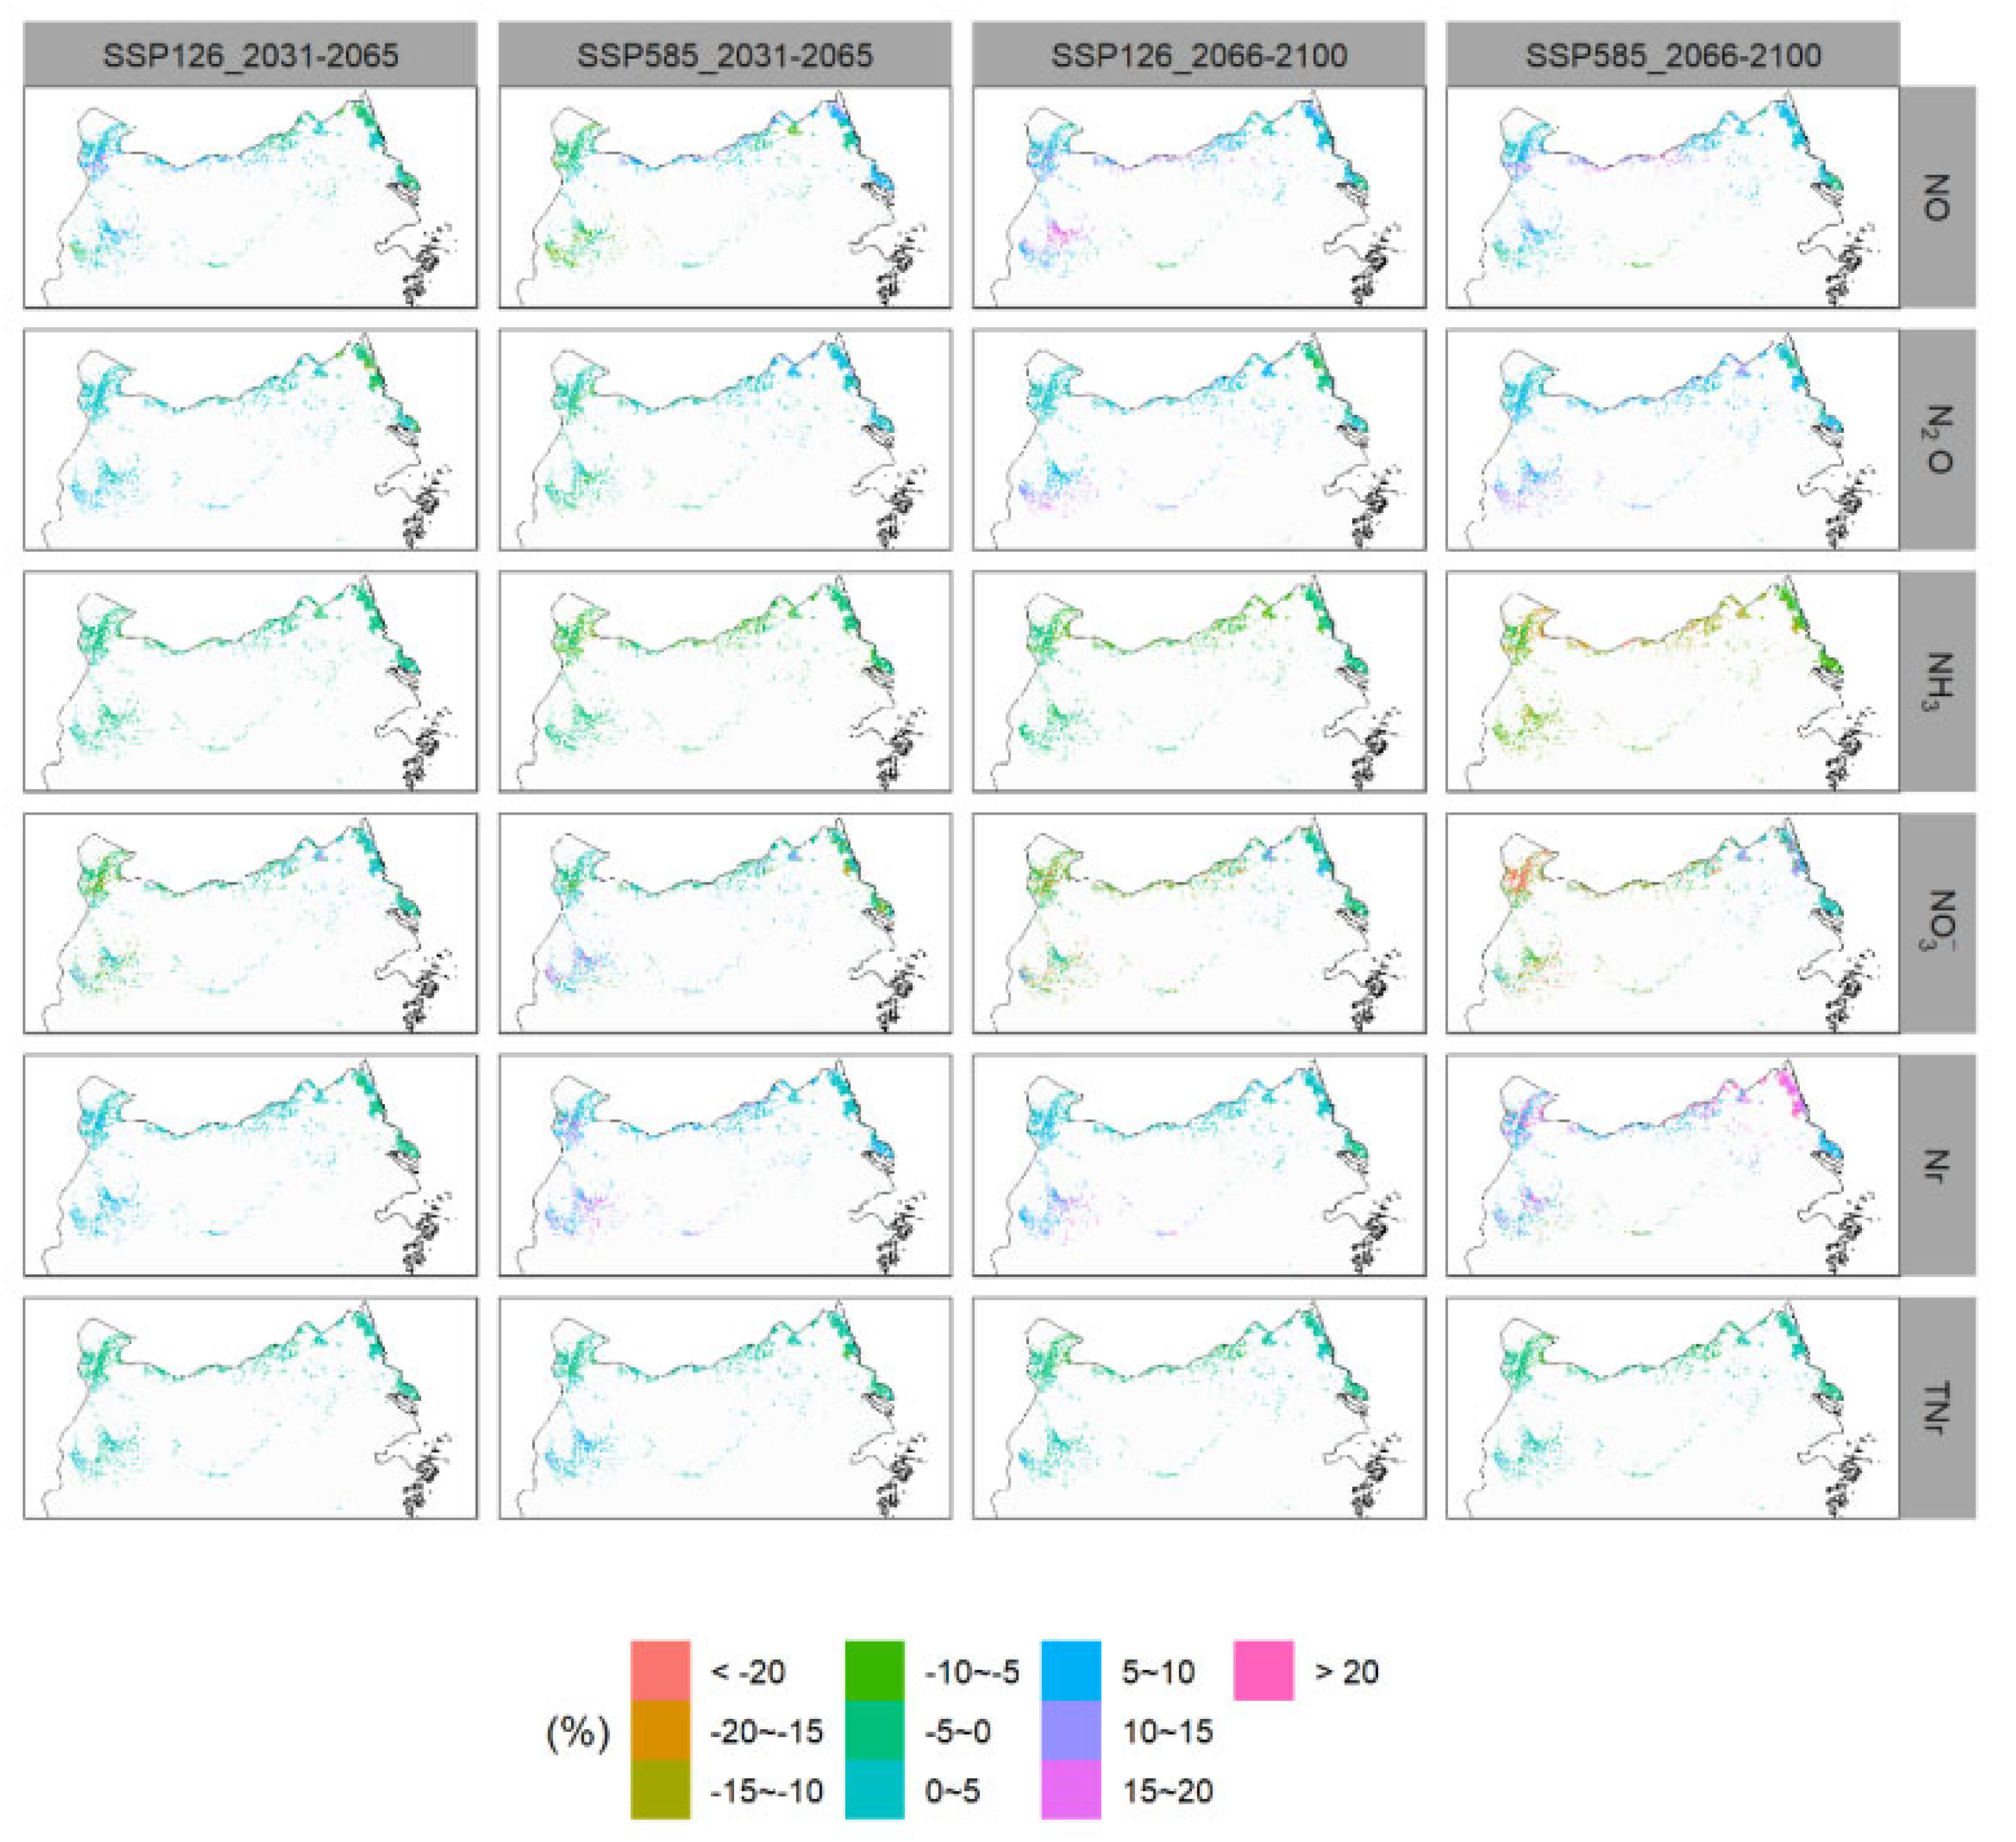
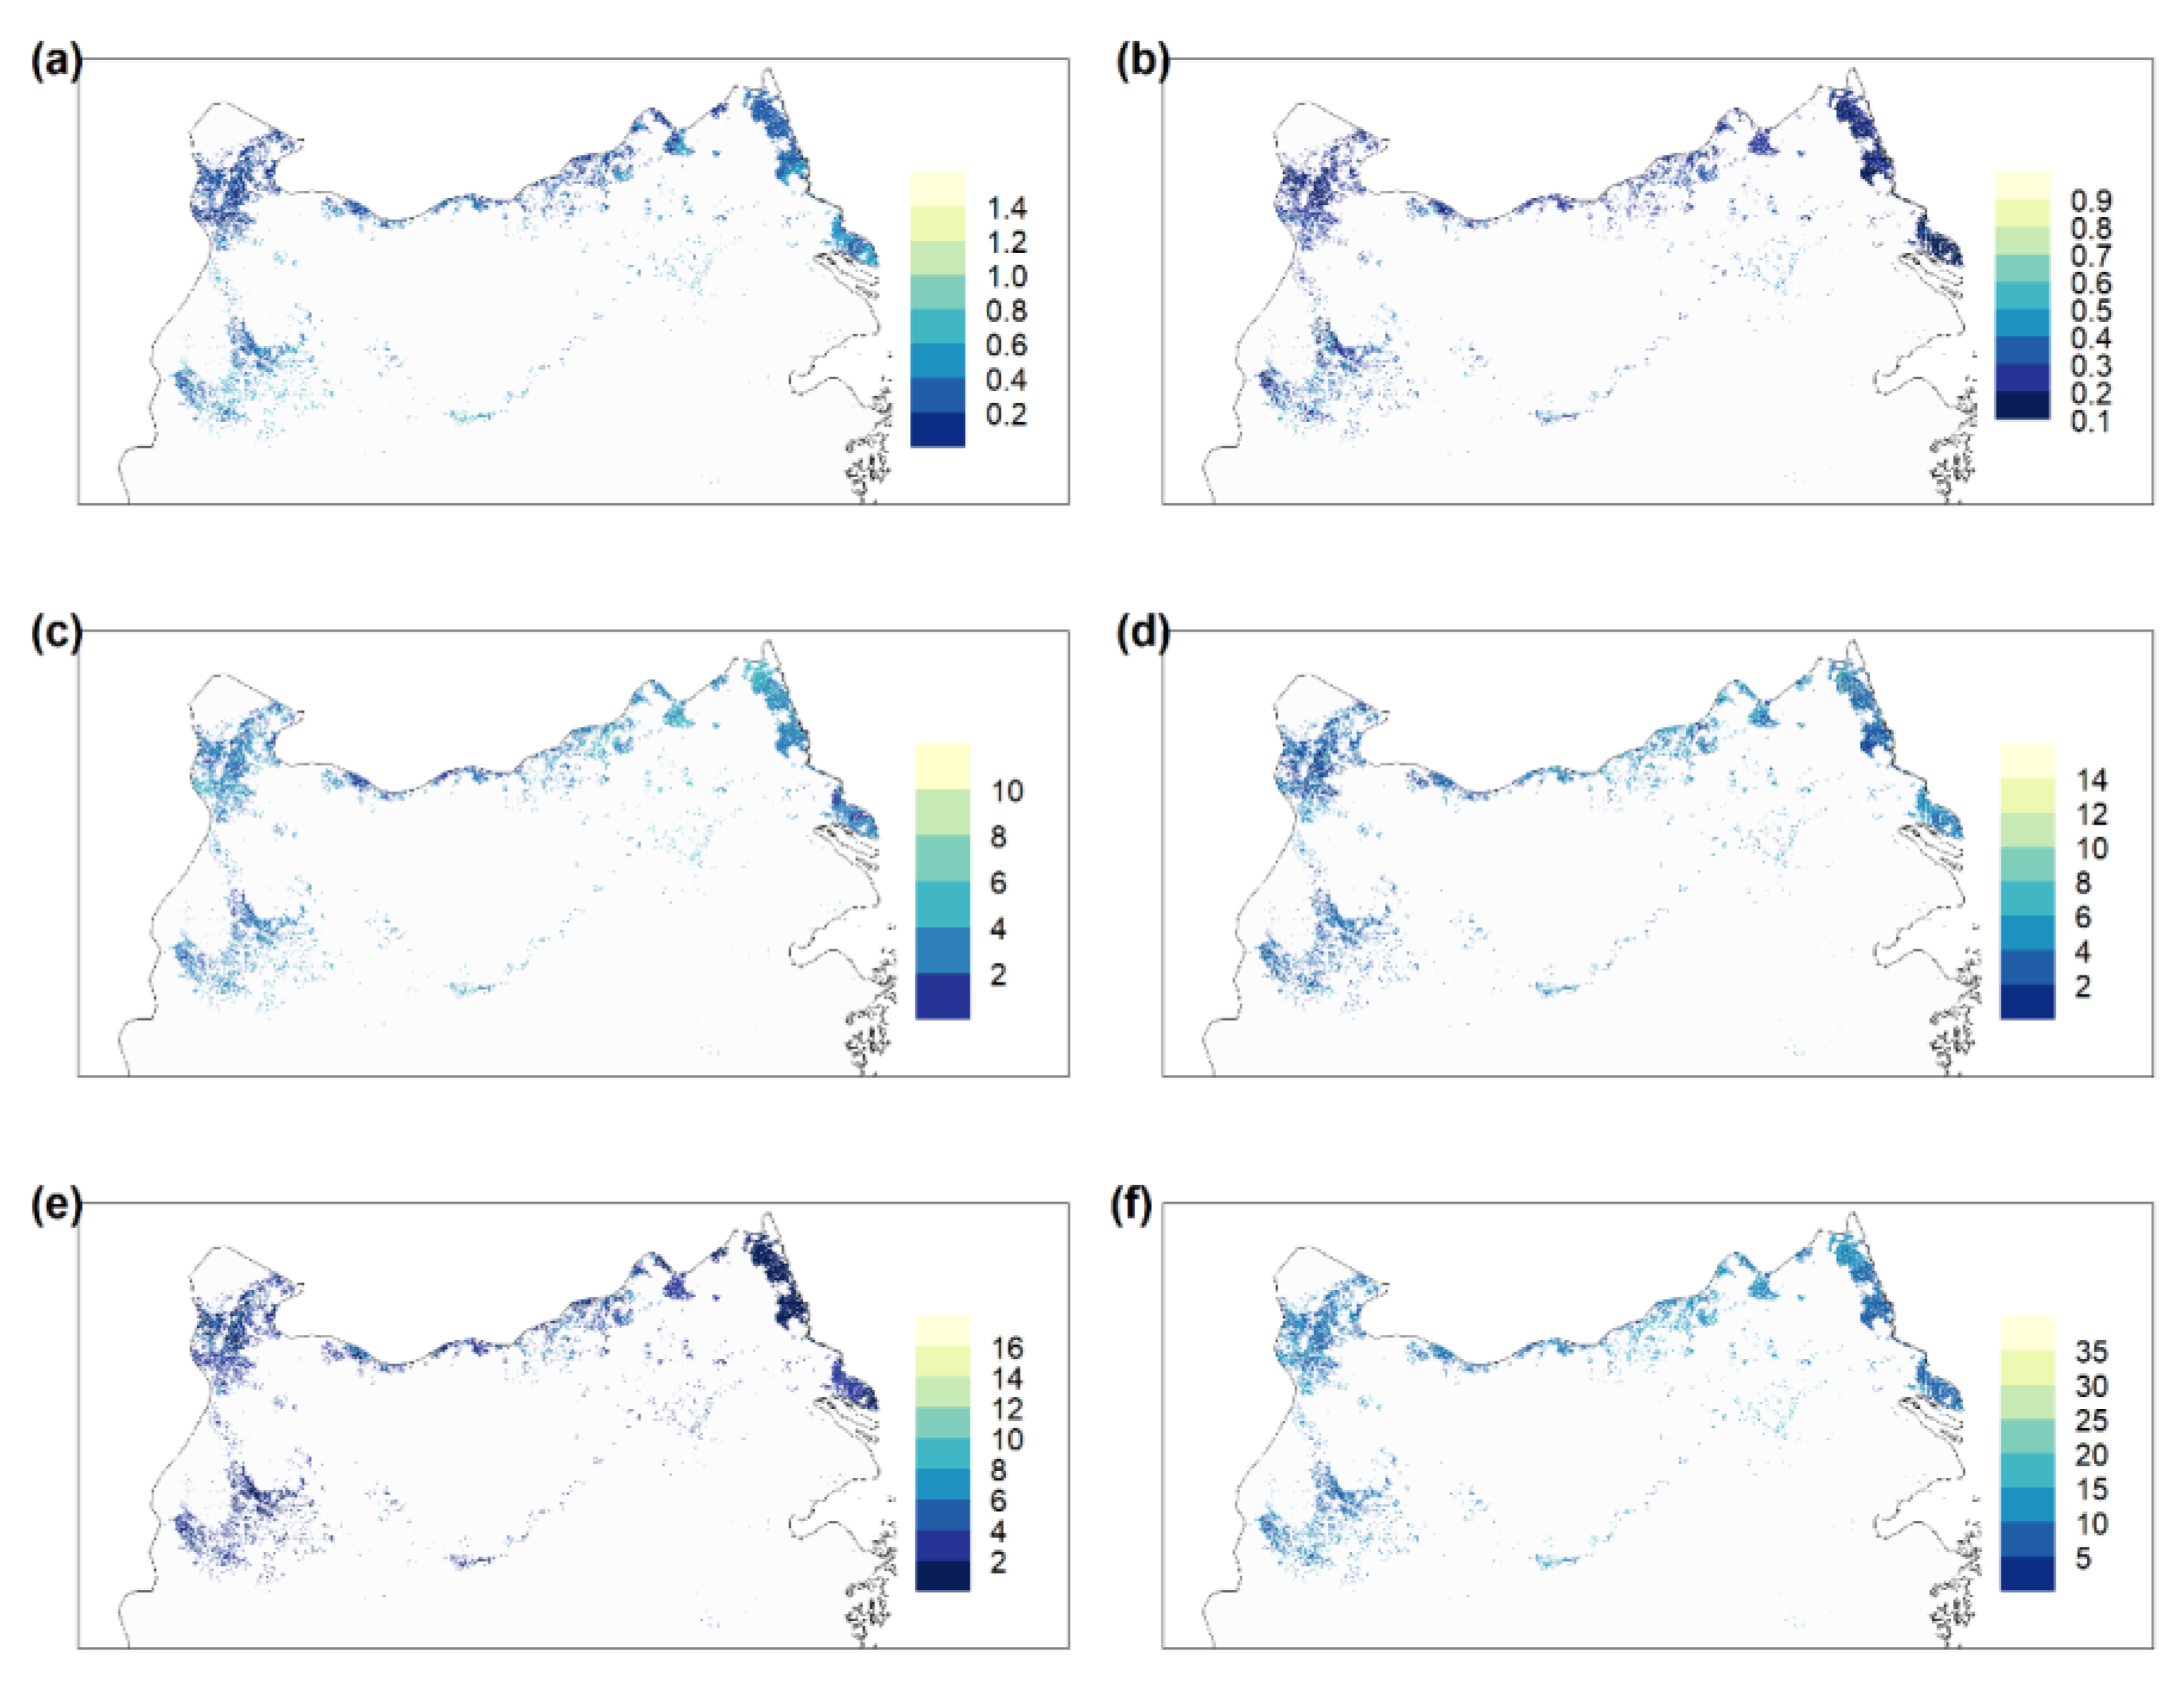
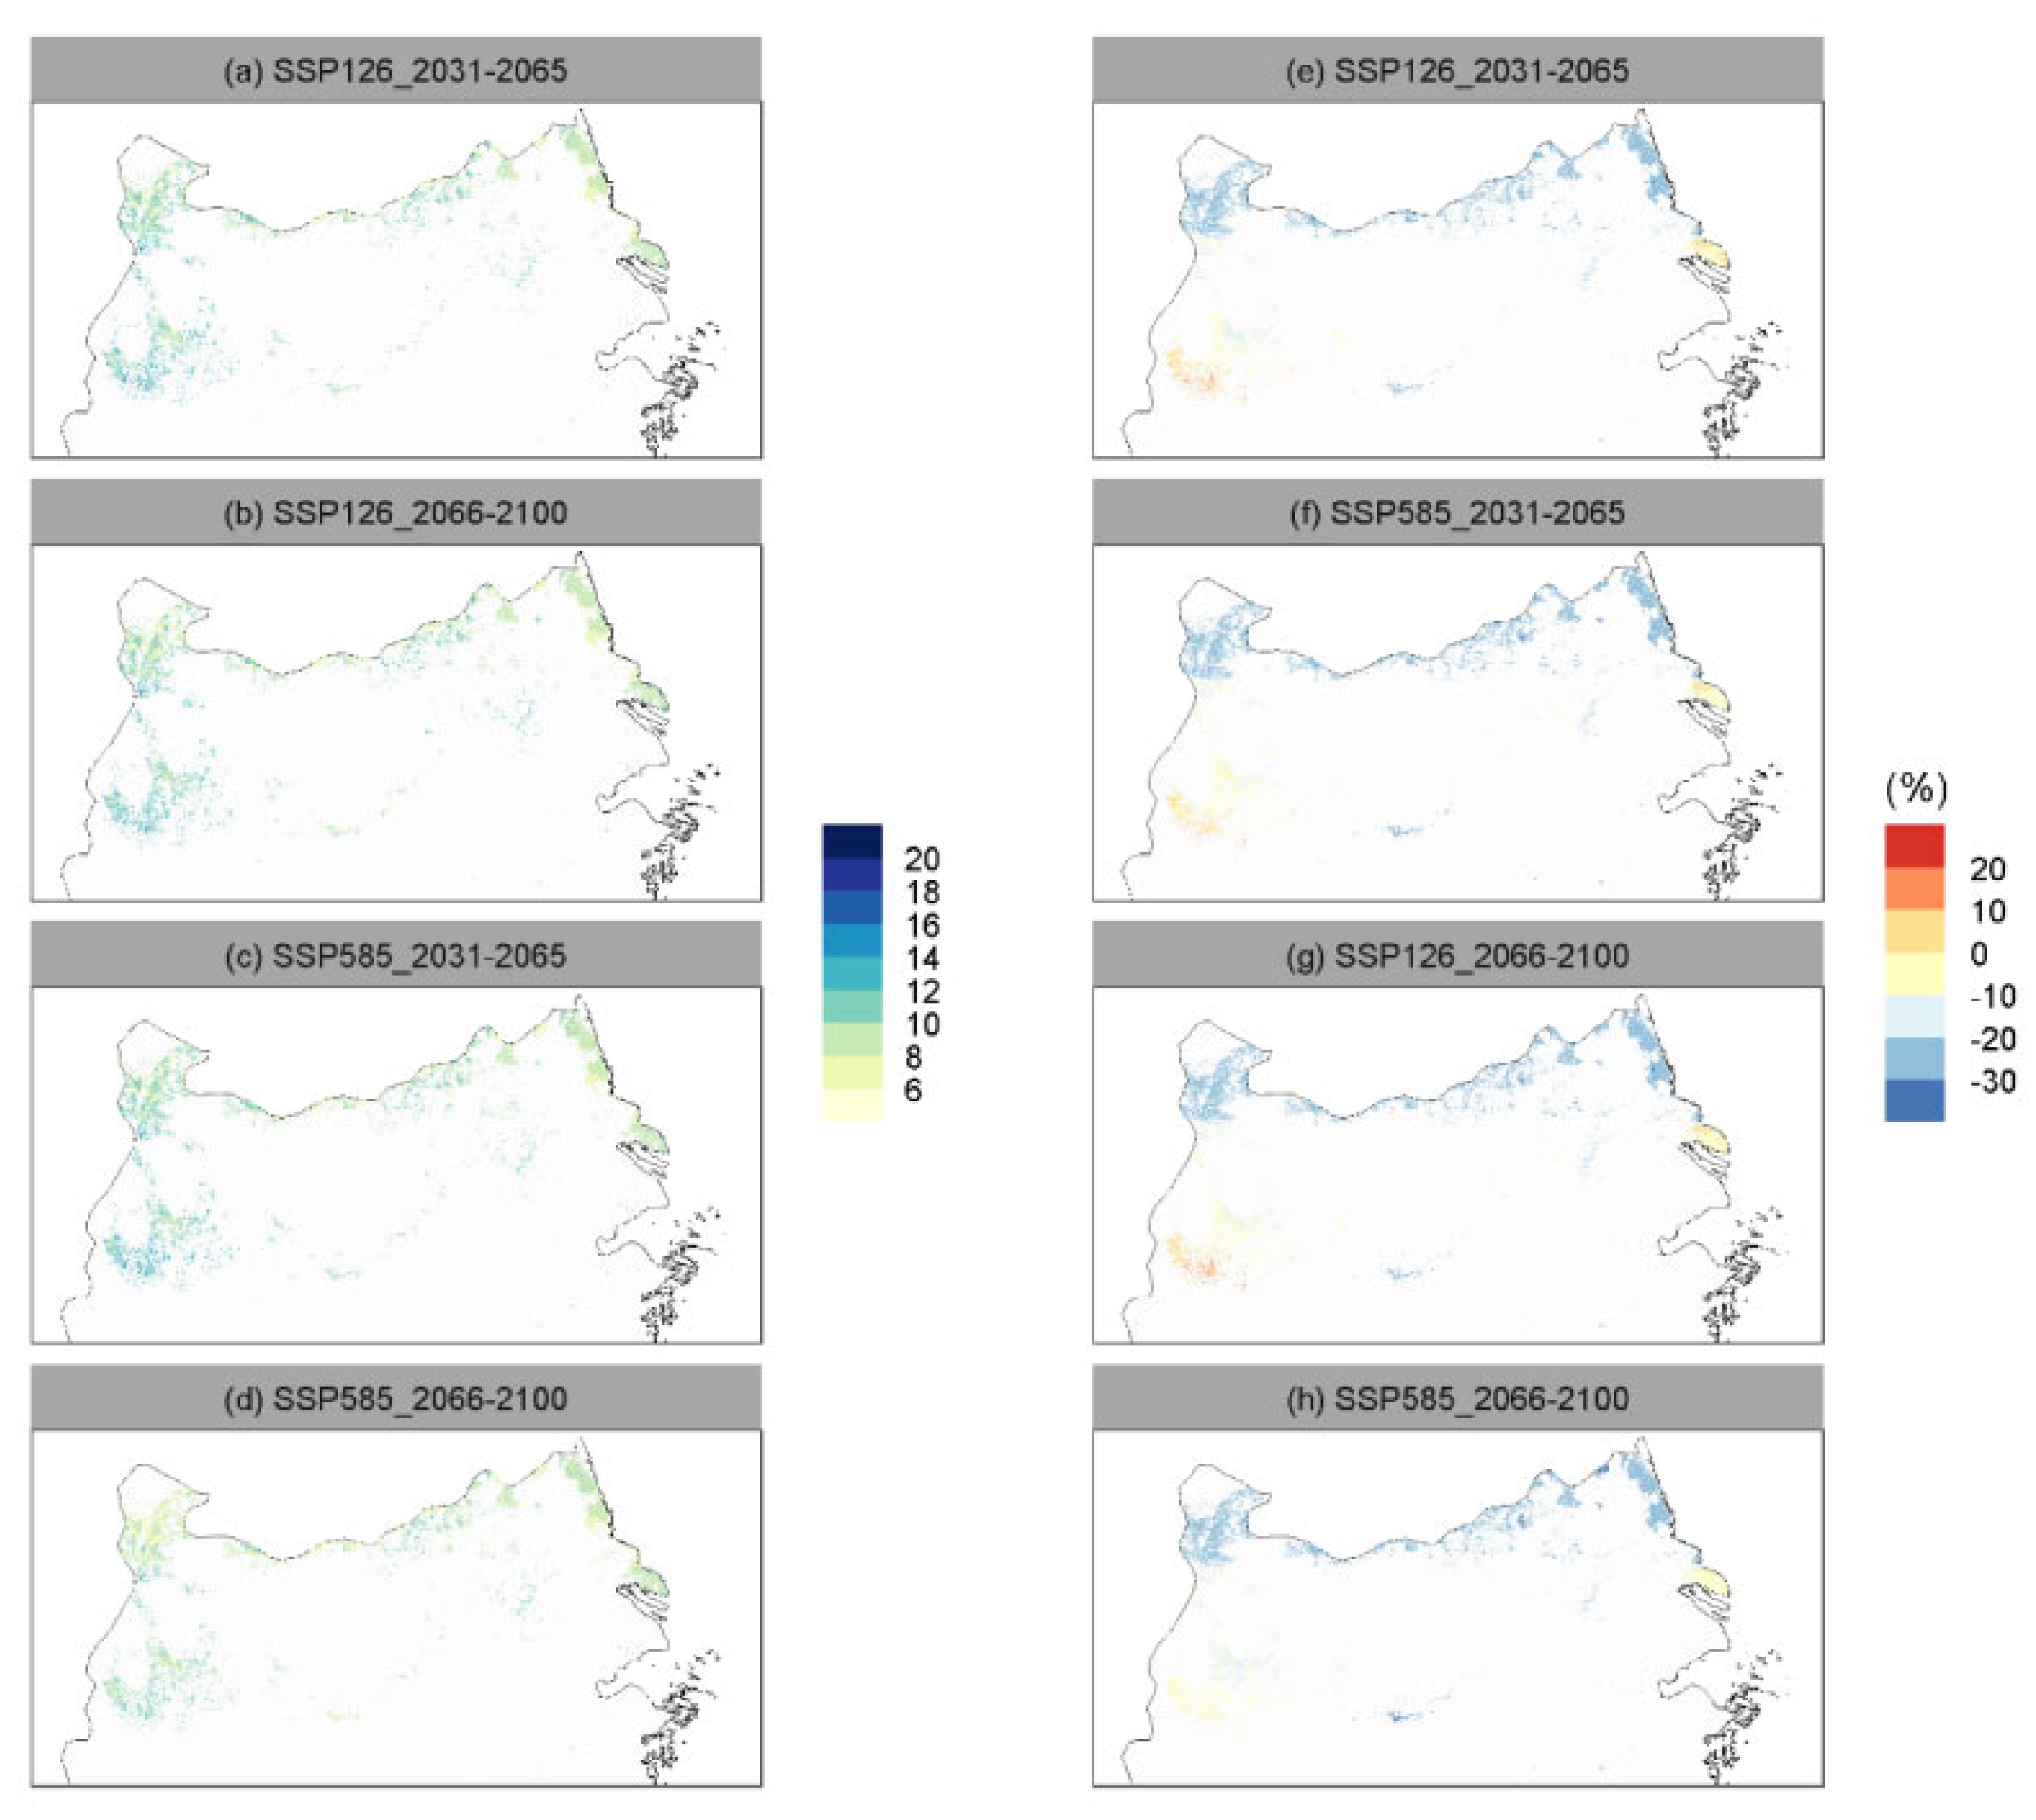
3.4. Spatial and Temporal Changes in Nitrogen Losses in Wheat Farmland in the Middle and Lower Reaches of the Yangtze River under Future Climate Change

In this study, nitrogen losses in wheat fields in the middle and lower reaches of the Yangtze River under future climate change were estimated based on the temperature and precipitation data of Tian et al.’s (2022) random forest model from the CMIP6. The results show that the relative historical change in total nitrogen losses of winter wheat farmland in the middle and lower reaches of the Yangtze River is about −10%~10% on average. Under the SSP126 scenario, the relative historical change in total nitrogen losses of winter wheat in the region for 2031–2065 is about −5%~0; under the SSP585 scenario, the total nitrogen losses of winter wheat in southwest China increased by about 5% for 2031–2065. Regarding changes in nitrogen under different loss pathways, the most significant decreases in nitrogen are under the NH3 and NO3 loss pathways, and nitrogen losses under the NO, N2O, and Nr loss pathways are predicted to increase in the western region (Figure 4).
Under four future climate change scenarios, the relative historical change in nitrogen losses averaged −20%~10% under the NO3 pathway. In the SSP585_2066-2100 scenario, in parts of the northwest, nitrogen losses under the NO3 pathway even decreased by more than 20%, and, in the eastern parts, the predicted nitrogen loss increased by approximately 5%. Nitrogen losses under the NH3 pathway had the most remarkable change in the SSP585_2066-2100 scenario, with a relative historical average reduction from −15% to −10%, and there was no significant difference in space. The changes in nitrogen losses under the NO and N2O pathways have similar spatial distributions and temporal trends, all predicted to increase in the southern parts under the SSP585 emission scenario, and the relative historical average increase for 2066–2100 was about 10%~15%; in the SSP126 scenario, the relative historical average increase in most areas decreased by about 10%. Nitrogen losses in the Nr pathway are predicted to increase in most areas under the SSP585_2066-2100 scenario. The relative historical average increase was about 10%~20% and even exceeded 20% in the eastern parts. In the remaining three climate change scenarios, nitrogen losses in the Nr pathway mainly show a spatial pattern of reducing the increase in the west.

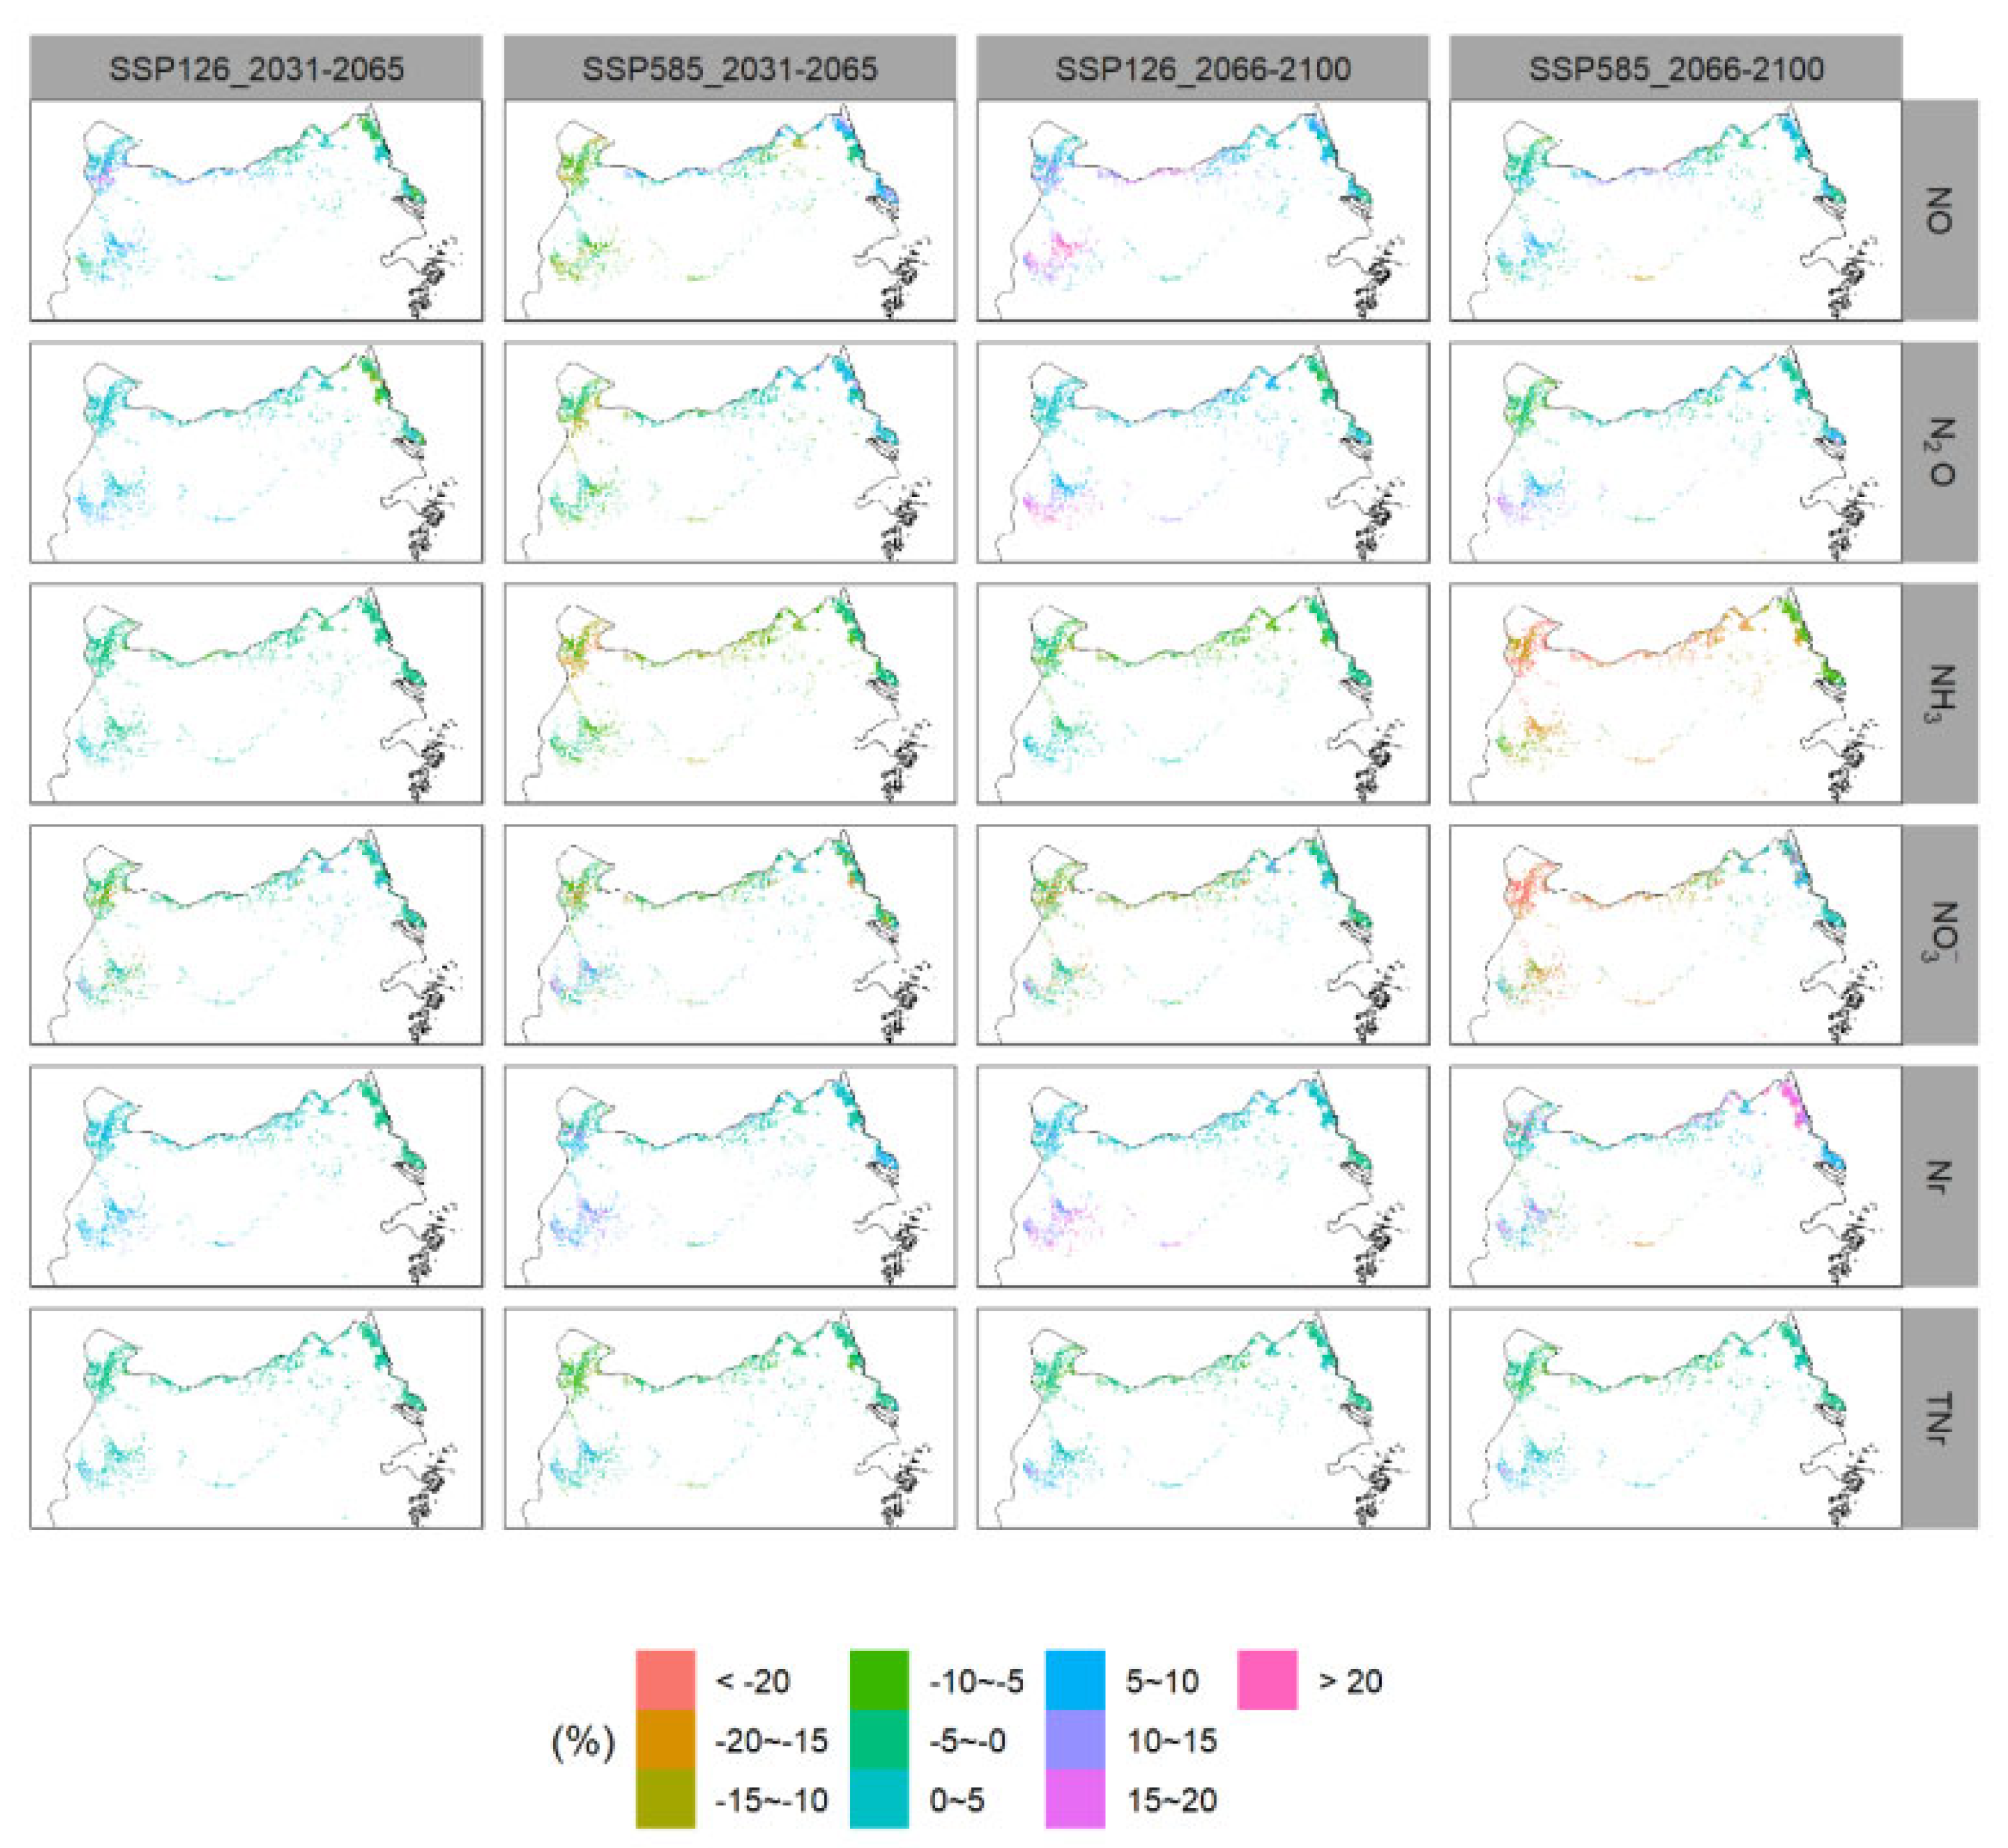
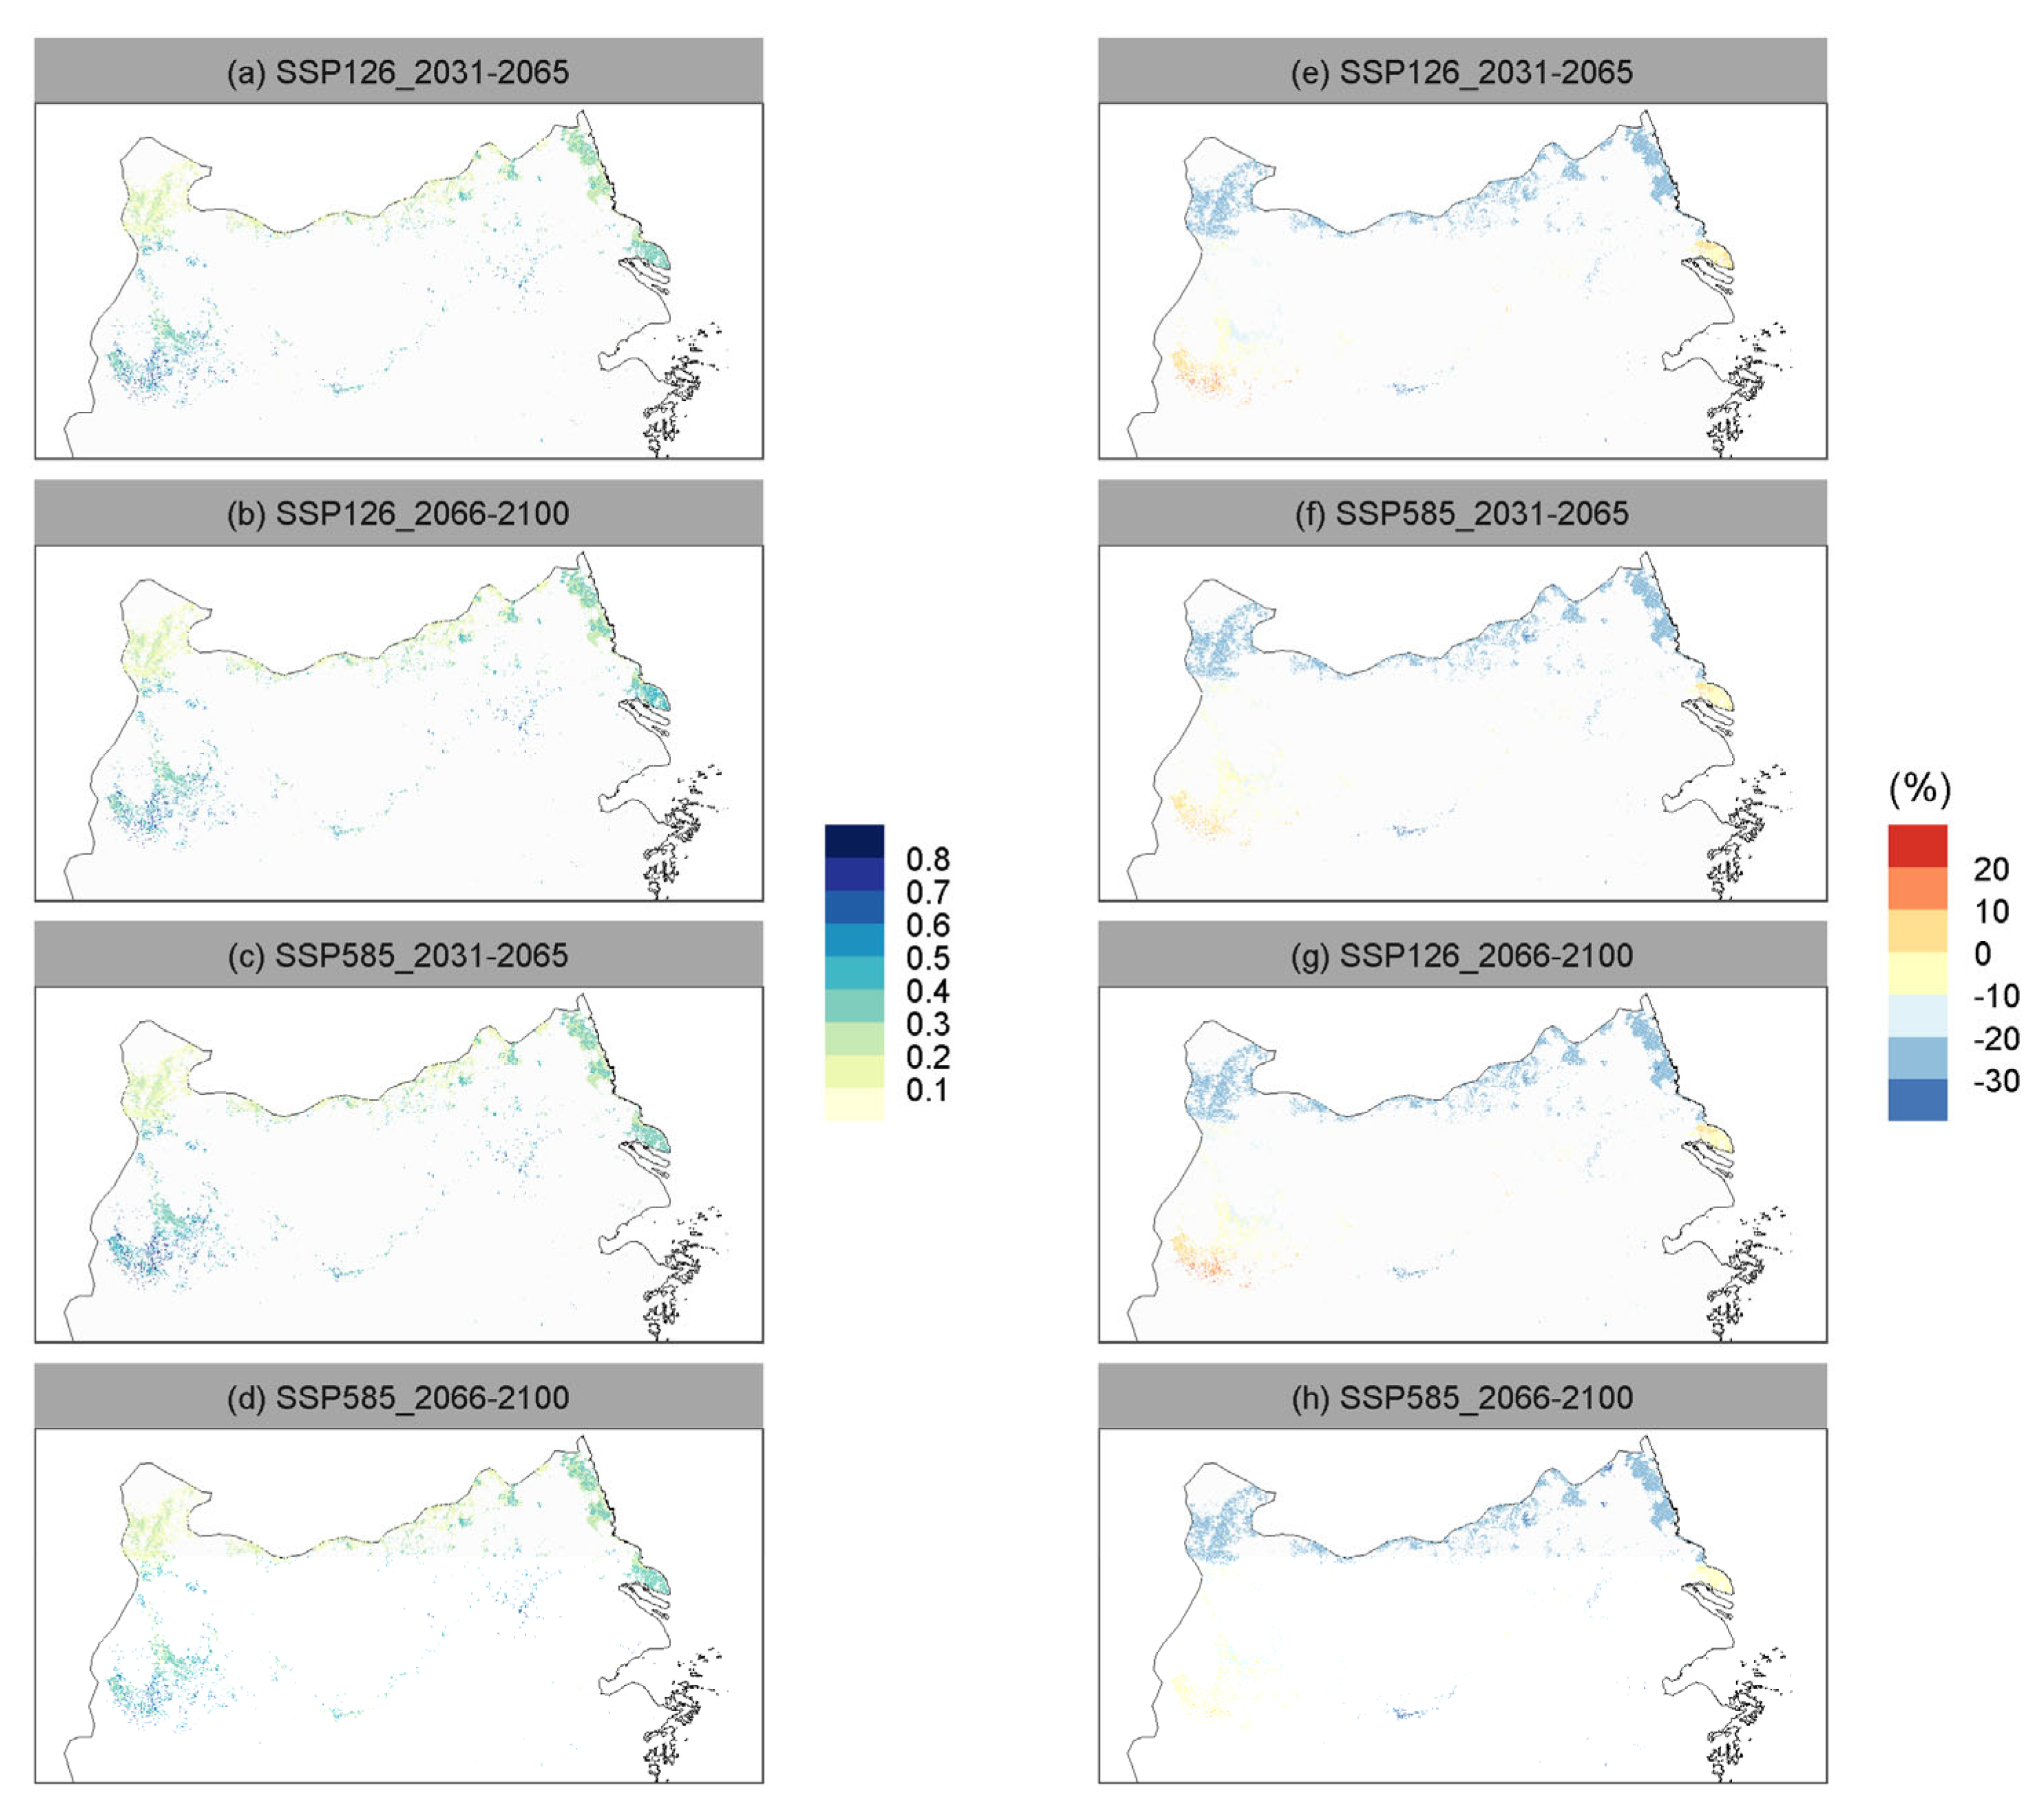
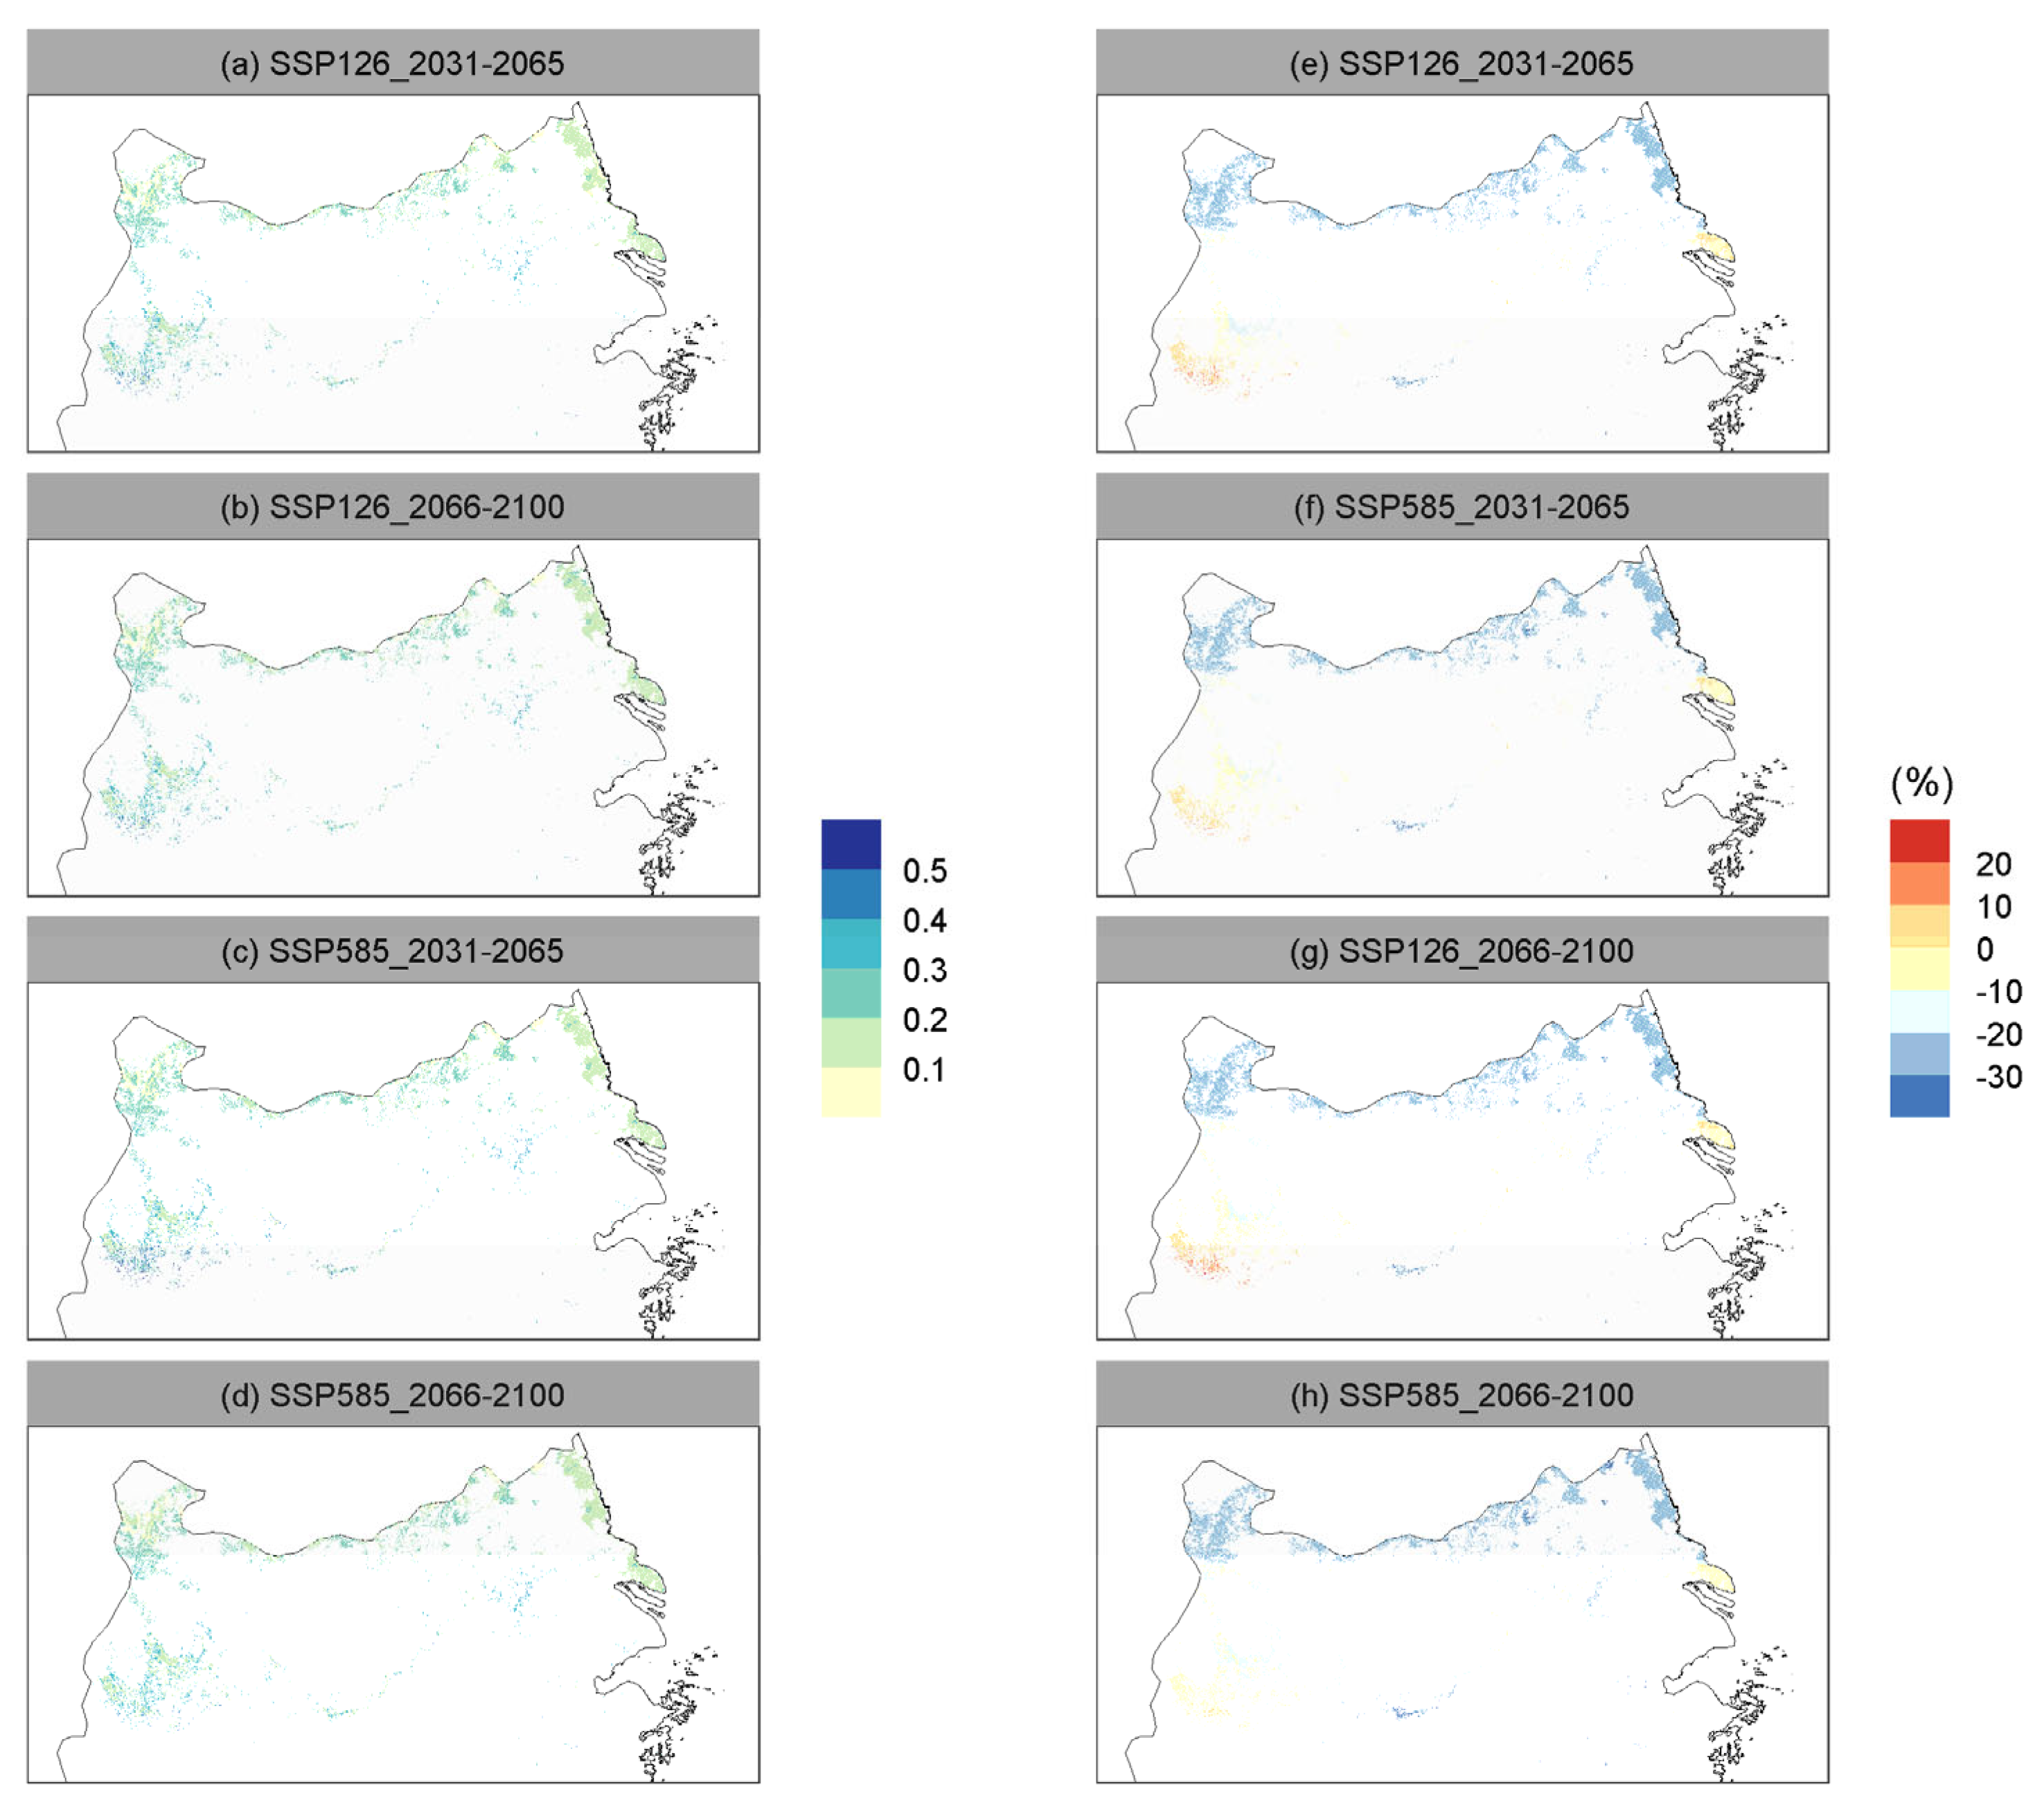
3.5. Spatial and Temporal Changes in Nitrogen Losses per Unit of Wheat Yield in the Middle and Lower Reaches of the Yangtze River under Future Climate Change

Combining the yield and nitrogen losses estimated by the random forest model, we investigated the effect of climate change on the middle and lower reaches of the Yangtze River. The results showed that the average total nitrogen losses per unit of yield in the middle and lower reaches of the Yangtze River from 2001 to 2015 was about 5~40 kg N × 1000 kg W−1ha−1 (Figure 5f), the nitrogen losses per unit of yield of the five pathways was ranked as Nr > NO3 > NH3 > NO > N2O (Figure 5a–f). Nr is the most extensive pathway of nitrogen losses per unit of yield, with the 2001–2015 average being about 2~18 kg N × 1000 kg W−1ha−1 (Figure 5e); the N2O pathway is a minor path for nitrogen losses per unit of yield, with a mean of about 0.01~0.9 kg N × 1000 kg W−1ha−1 from 2001 to ~2015, and it is high in the south and low in the north (Figure 5b).
Figure 4. Spatial distribution of relative historical changes in random forest projections of five nitrogen loss pathways and total nitrogen losses from winter wheat farms in the middle and lower reaches of the Yangtze River for 2031–2065 and for 2066–2100 under SSP126 and SSP585 emission scenarios.
Atmosphere 14 00824 g004
Combining the predictions of yield and nitrogen losses, the impact of future climate change on nitrogen losses per unit of yield in wheat fields in the middle and lower reaches of the Yangtze River was analyzed. Unlike the relative changes in total nitrogen losses, in the four climate change scenarios, most of the southwestern regions are predicted to have an increase of 0~10% in total nitrogen losses per unit of yield, while the remaining regions are predicted to have a decrease of 0~5%. Among the five pathways of total nitrogen losses per unit of yield, in most regions of the middle and lower reaches of the Yangtze River, nitrogen losses per unit of yield in the Nr pathway are predicted to increase by about 0~5% and 15%~20% in the two future periods under the SSP126 and SSP585 emission scenarios, respectively (Figure 6). Under the SSP126 emission scenario, nitrogen losses per unit of yield under the NO and N2O pathways are predicted to increase 0~5% in most regions. Under the SSP585 scenario, it is predicted that nitrogen losses per unit of yield under the NO and N2O pathways will increase by 5% to 10% in the southern region from 2065 to 2100, while they will decrease in the other regions. The relative changes in nitrogen losses per unit of yield under the NH3 and NO3 pathways and total nitrogen losses per unit of yield have similar spatial distribution patterns, with most regions predicted to decrease (Figure 6). Overall, nitrogen losses per unit of yield in agricultural fields are more variable, especially in regions with low yields, where the changes in nitrogen losses per unit of yield under different pathways are more complex; in regions with high yields, the predicted nitrogen losses per unit of yield under different pathways are generally lower.

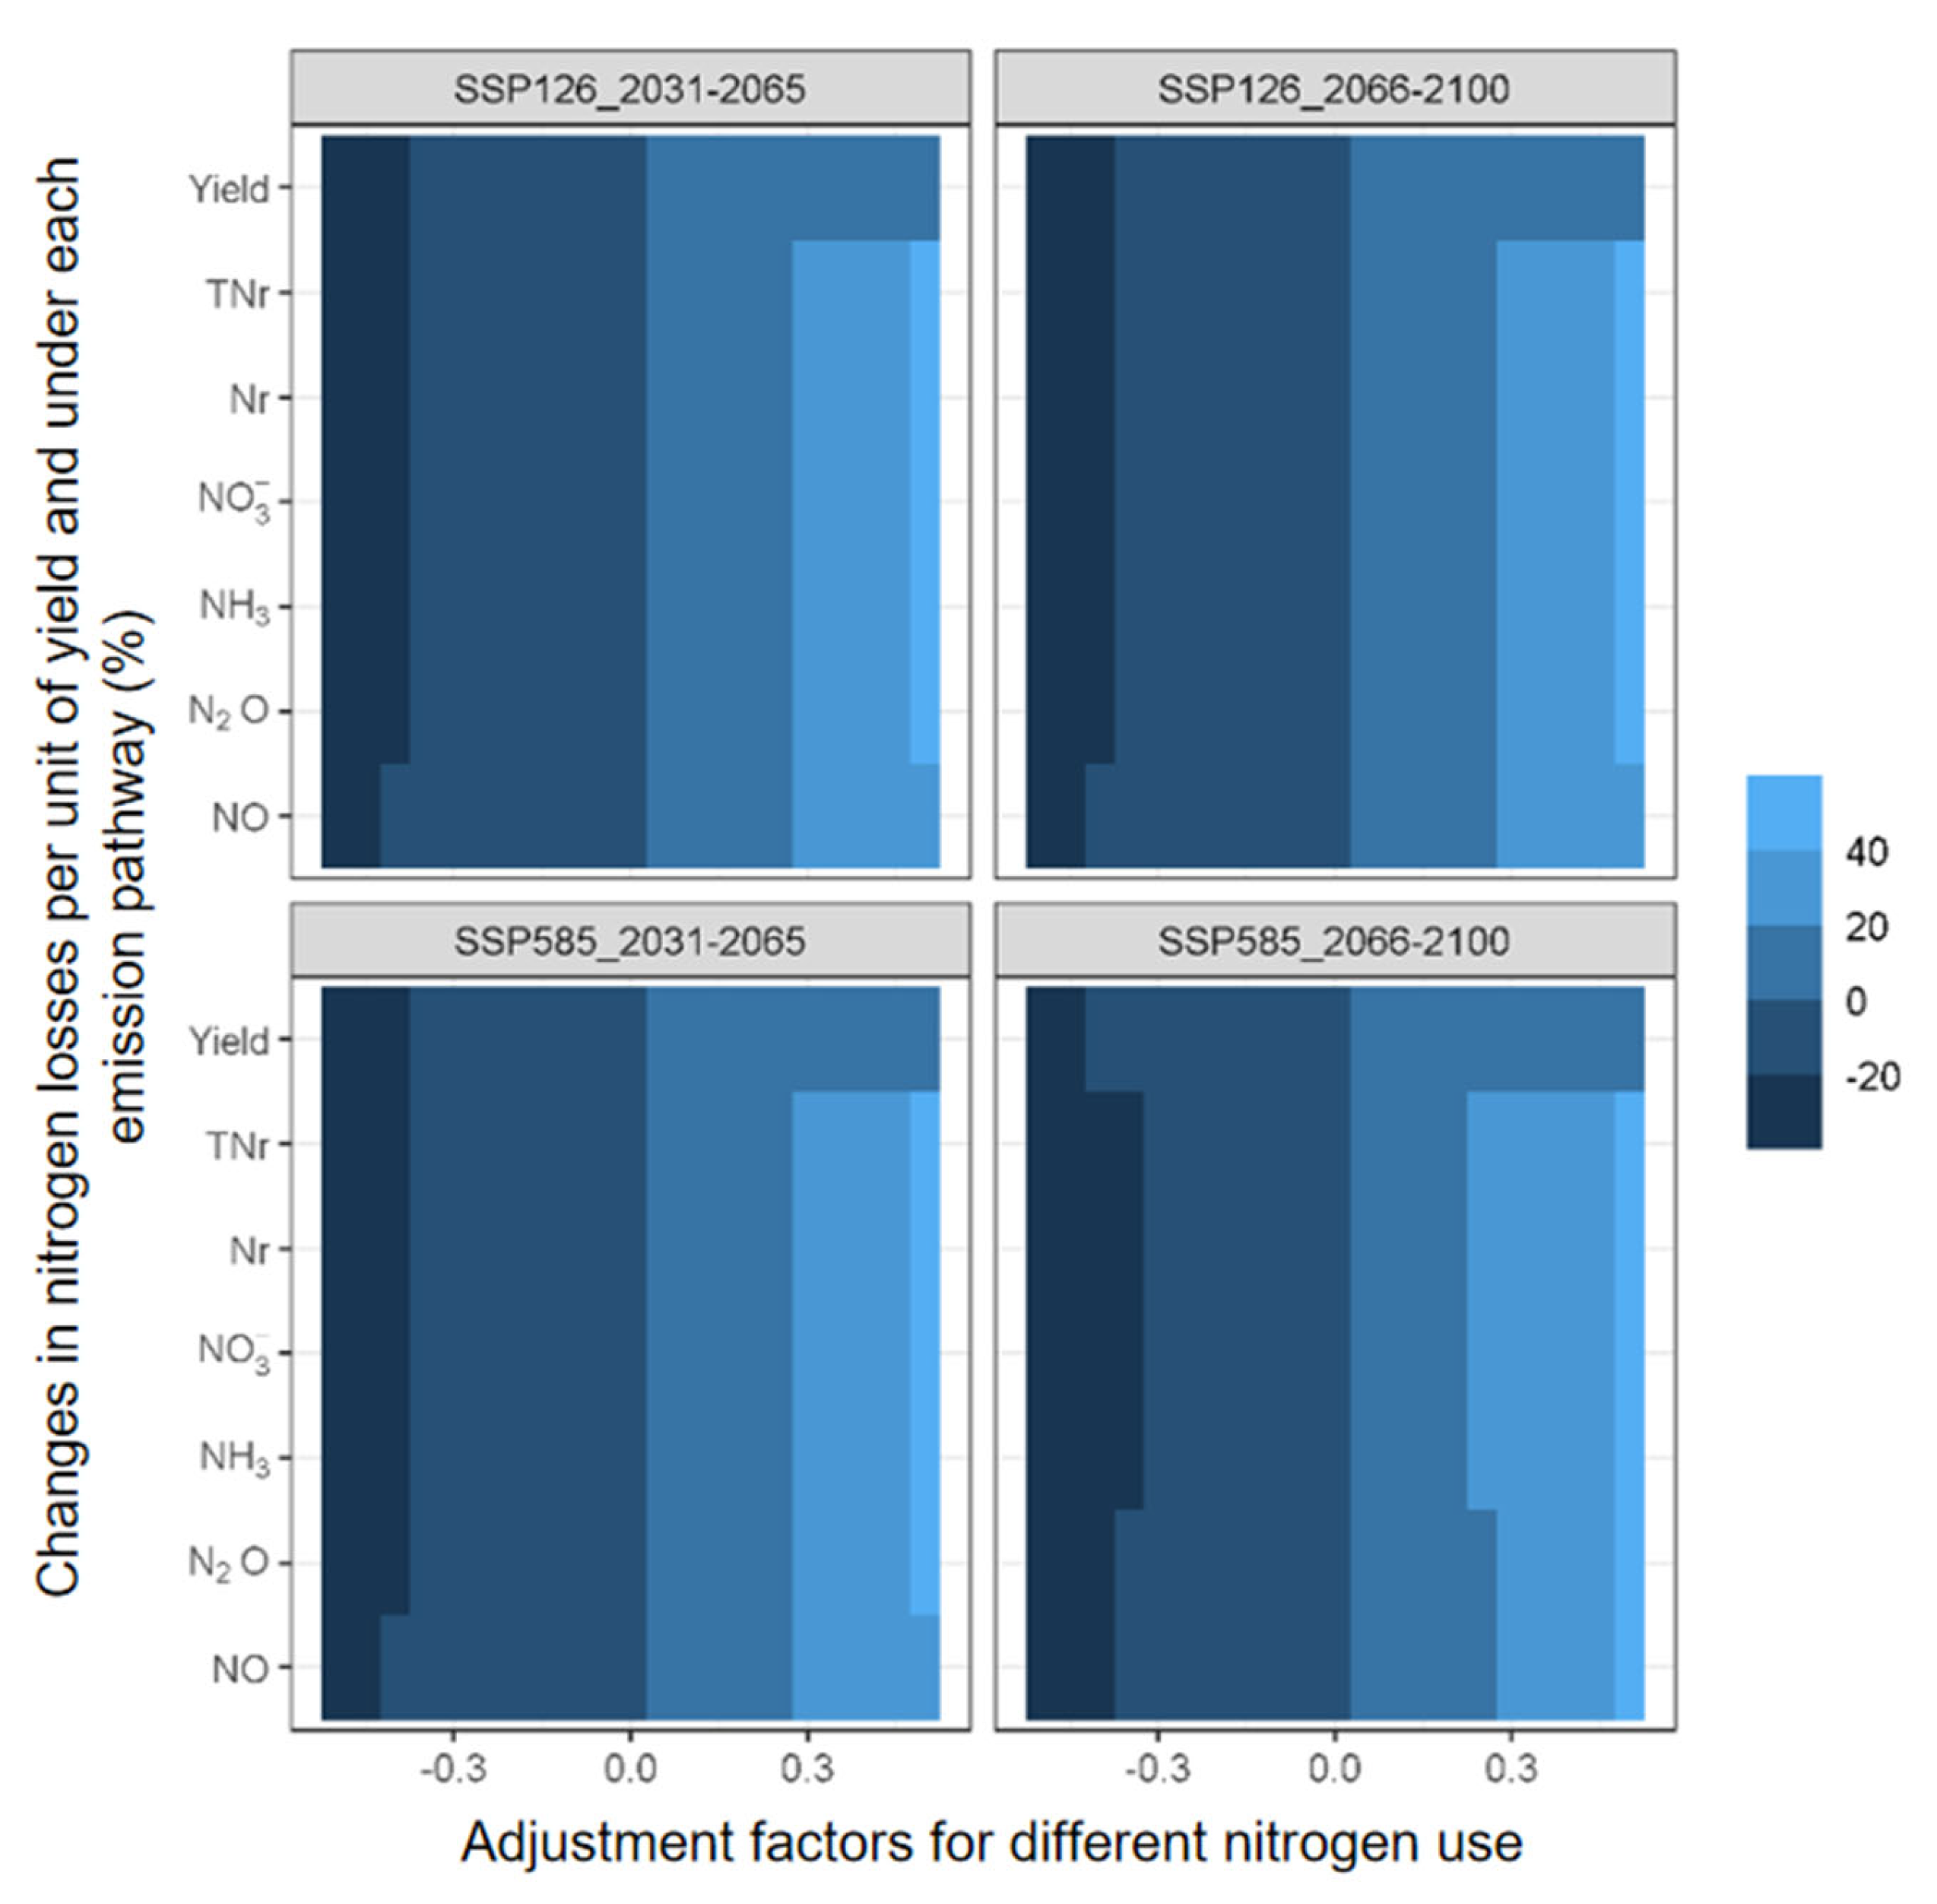
3.6. Changes in Yield and Nitrogen Losses per Unit of Yield under Different Nitrogen Application Rates under Future Climate Change

The effect of future climate change on winter wheat yield and nitrogen losses per unit of yield in the middle and lower reaches of the Yangtze River was quantified based on random forest models. The results show that, under the four future climate change scenarios, the yield with nitrogen input increases by −25%~5% and remains the same. The nitrogen losses per unit of yield increase with the farmland nitrogen input (Figure 7, −25%~40%). Under the two emission scenarios, the changes in winter wheat yield and nitrogen losses per unit of yield in the middle and lower reaches of the Yangtze River from 2031 to 2065 are similar (Figure 7, −25%~40%). Nitrogen losses per unit of yield in the SSP585_2066-2100 scenario change slowly compared to other climate change scenarios. Moreover, across the different pathways, the response relationships between N losses per unit of yield and N application rate are similar.
Further analysis was conducted on the response curves of agricultural yield and nitrogen losses per unit of yield to nitrogen use in response to future climate change in the region (Figure 8). The results showed that, in the two future periods under the two emission scenarios, the intersection of the response curve of nitrogen losses per unit of yield to nitrogen use and the response curve of yield to nitrogen use only existed at a nitrogen application rate of −0.5 to 0 times (−0.3), indicating that reducing nitrogen use by 0–0.3 times resulted in a smaller change in yield in the middle and lower reaches of the Yangtze River than in nitrogen losses per unit of yield. Reducing nitrogen use by more than 0.3 times resulted in changes in yield comparable to changes in nitrogen losses per unit of yield. In the two future periods under the two emission scenarios, the yield in the region no longer increased at a nitrogen use rate of 0.25 times, and the magnitude of the increase was smaller than that of the nitrogen losses per unit of yield. The nitrogen losses per unit of yield increased linearly with nitrogen application rate. This suggests that, in the future, the yield benefits of nitrogen increase may come at a high environmental cost.

3.7. Effect of Future Climate Change on Winter Wheat Yield and Nitrogen Losses at the Minimum Nitrogen Reduction Limit

Based on the response curve of winter wheat yield and nitrogen losses per unit of yield to nitrogen use in this region, the impact of future climate change on the minimum nitrogen reduction limit for winter wheat yield and nitrogen losses per unit of yield was further analyzed. The results show that, under the minimum nitrogen reduction limit (i.e., reducing nitrogen by 0.3 times), the high-yield areas in the north of the region have a smaller change in yield. In comparison, the south’s low-yielding areas have a larger yield change (Figure 9a,b). In the four climate change scenarios, the average yield in the high-yield areas in the north is about 4000–5500 kg/ha, with the largest relative change in the northeast region, ranging from −10% to 0, relative to historical changes. The average yield in the low-yield areas in the south is about 1000–3500 kg/ha, with a relative historical change of from −40% to −20%. In addition, except for the SSP585_2066-2100 scenario, the average yield ranges for the remaining three climate change scenarios are similar. The relative historical changes in the average yield ranges are also similar. The yield in the SSP585_2066-2100 scenario is, relatively, the highest, with an average yield of about 5000–5500 kg/ha in the northeast region.
The spatial pattern of total nitrogen losses per unit of yield under the nitrogen reduction limit measures differed from yield (Figure 10a,b). In the four climate change scenarios, the average total nitrogen losses per unit of yield showed a spatial pattern of high in the west and low in the east (Figure 10b), with the average total nitrogen losses per unit of yield in most areas in the west ranging from 12.5 to 22.5 kg N × 1000 kg W−1ha−1, and in most areas in the east ranging from 5 to 10 kg N × 1000 kg W−1ha−1.
However, the changes in total nitrogen losses per unit of yield show north-high and south-low spatial patterns. In the four climate change scenarios, most areas in the north have an average relative change in total nitrogen losses per unit of yield from approximately −30% to −10%, while most areas in the south have an average relative change in total nitrogen losses per unit of yield from approximately −10% to 0%. In addition, the average range of total nitrogen losses per unit of yield is similar in the four climate change scenarios, and the average range of relative change in total nitrogen losses per unit of yield is also similar. This suggests that nitrogen reduction measures lead to a decrease in the sensitivity of nitrogen losses per unit of yield to climate change in the region.

3.8. Impact of Future Climate Change on Winter Wheat Yield and Nitrogen Losses at the Maximum Nitrogen Increase Limit

Based on the response curves of winter wheat yield and nitrogen losses per unit yield to nitrogen use in the region, the final analysis is made on the effects of future climate change on the winter wheat yield and nitrogen losses per unit of yield under the maximum nitrogen increase limit. The results show that, in contrast to the spatial distribution of yield changes under the minimum nitrogen reduction limit (i.e., a reduction of 0.3 nitrogen), the spatial differences in winter wheat yield relative to historical changes are not significant under the maximum nitrogen increase limit (i.e., an increase of 0.25 nitrogen) in the middle and lower reaches of the Yangtze River region, with changes in most areas from approximately 10% to 20% (Figure 11a). In the four climate change scenarios, the average yield in the high-yield region of the north is from aproximately 5000 to 6000 kg/ha, and in the low-yield region of the south, it is from approximately 3500 to 4500 kg/ha. In addition, the yield ranges in the three climate change scenarios, except for SSP585_2066-2100, are similar in multi-year averages. The yield under the SSP585_2066-2100 scenario, relatively, is the highest, with the average yield in the northeast region being from approximately 5500 to 6000 kg/ha (Figure 11b).
Compared to the nitrogen reduction measures, the maximum nitrogen increase limit results in a more convergent spatial pattern between the spatial distributions of total nitrogen losses per unit of yield and yield (Figure 12a,b). In the four climate change scenarios, the average total nitrogen losses per unit of yield shows a pattern of being higher in the north and lower in the south (Figure 12b), with the average total nitrogen losses per unit of yield in most regions of the north being approximately 18~22 kg N × 1000 kg W−1ha−1, and the average total nitrogen losses per unit of yield in most regions of the south being approximately 10~12 kg N × 1000 kg W−1ha−1. The change in total nitrogen losses per unit of yield relative to historical changes exhibits a spatial pattern that is higher in the north and lower in the south. In the four climate change scenarios, the relative change in total nitrogen loss per unit of yield in most regions of the north is approximately 20–30% compared to historical changes. In most regions of the south, it is approximately 5–15% compared to historical changes. In addition, the average range of the total nitrogen losses per unit of yield in the four climate change scenarios is similar. The average range of relative change in total nitrogen losses per unit of yield compared to historical ranges is also relatively similar.

4. Discussion

In this study, random forest models are used to simulate the temporal trends and spatial distribution models of winter wheat yield and nitrogen losses per unit of yield in the middle and lower reaches of the Yangtze River under future climate change. In terms of a time dimension, under high emission scenarios, the predicted yield trend increases with the trend of precipitation and temperature. Currently, most machine learning studies for predicting crop yield do not predict crop yield at the regional scale under climate change but only estimate the yield on the time scale of observable yield. Leng and Hall [32] used a random forest model to predict future corn yields under climate change in the United States and compared the yields predicted by crop models and linear regression methods. They found that the random forest model could explain 93% of observed yield variability and could simulate the response of corn yield to future warming. Huntington, et al. [33] used random forest models to predict the future trends in sorghum biomass yield under four different greenhouse gas emission scenarios and two irrigation modes. Overall, in this study, random forest models can simulate, for a region, the production responses to climate change, such as a decrease in production due to increased temperature and an increase in production due to increased precipitation [34,35], and can simulate the spatial differences in this effect.
In this study, we combined the ML algorithms for yield prediction and ML algorithms for nitrogen loss prediction developed by Tian, Yin, Zhuang, Cong, Chu, He, Zhang and Cui [27] to quantify the nitrogen losses per unit of yield of winter wheat in the middle and lower reaches of the Yangtze River under future climate change. The results of this study showed that the baseline years of Nr and N2O were the pathways with the highest and lowest nitrogen losses per unit of yield in the region, respectively. Wang, et al. [36] showed that three significant crops had the highest N leaching loss and the lowest N2O emission loss at a national scale. Under future climate change scenarios, the predicted total nitrogen losses per unit of yield in low-yield areas in the region will increase, mainly due to an increase in N leaching loss. Xu, et al. [37] predicted future changes in NH3 emissions in three major crops in China using ML methods. The results showed that, by 2050, NH3 emissions would increase by 23.1%~32.0% under different climate change scenarios (CMIP5). Due to increased warming, climate change will significantly impact NH3 volatilization in the Yangtze River agricultural region of China. This study showed that, under future climate change, NH3 volatilization from winter wheat in the middle and lower reaches of the Yangtze River is predicted to decrease, which may be due to differences in emission scenarios and data sample differences in modeling. Compared to the CMIP5, the emission scenarios predicted by the CMIP6 have more precipitation and have a more uneven spatial distribution (Jägermeyr, et al. [38]) and the increase in N leaching loss is affected more by an increase in precipitation. In the study by Tian, Yin, Zhuang, Cong, Chu, He, Zhang and Cui [27], a random forest model captured this spatial distribution feature of N leaching loss. Combined with the prediction of yield decline, it suggests that nitrogen losses per unit of yield of winter wheat in the region will increase under future climate change.
This study was based on ML methods to investigate the impact of future climate change on winter wheat yield and nitrogen loss in the middle and lower reaches of the Yangtze River. The study comprehensively quantified the effects of climate change on the nitrogen losses per unit of yield and total yield under five different nitrogen loss pathways. The ML method used in this study has higher computational efficiency and more extensive spatial scale quantification analysis than previous studies. However, in actual agricultural production, regional-scale farmers use different nitrogen fertilizers. The ML method used in this study did not consider the impact of this difference on the results. In addition, machine learning model training and testing results are sensitive to sample size and distribution. Although, in this study, we collected a large amount of data to train and test the model, more samples for future climate change scenarios are needed, and could result in some uncertainties in the results. Therefore, in future studies, it is necessary to further evaluate the results by combining ML methods and mechanistic model methods.
By setting different nitrogen use strategies, in this study, we investigated the response of winter wheat yield and nitrogen losses per unit of yield to different nitrogen use strategies under future climate change in the middle and lower reaches of the Yangtze River. The results show that under four climate change scenarios, winter wheat yield increases first, and then remains unchanged with increasing nitrogen. On the one hand, this may be because the importance of nitrogen as a variable in the random forest model for yield prediction is relatively low compared to climate factors. On the other hand, it may be due to insufficient data samples. In this study, low nitrogen input in the middle and lower reaches of the Yangtze River corresponds to low yield, and high nitrogen input corresponds to high yield. However, the number of high-nitrogen samples is relatively small. As a result, the model can better simulate the yield response to nitrogen reduction. The limited number of high nitrogen samples constrains the yield response to nitrogen increase.
The results of the study by Leng and Hall [32] showed that a random forest model can reasonably simulate the average yield distribution pattern. Huntington, Baral, Yang, Sundstrom and Scown [33] used a random forest model to predict the future trend of sorghum yield under four greenhouse gas emission scenarios and two irrigation regimes in the United States. They found that the model did not show yield sensitivity to management measures. Compared to yield, nitrogen losses per unit of yield is more sensitive to nitrogen increase under future climate change, mainly due to the smaller magnitude of change in the increase of the exact nitrogen yield compared to nitrogen loss. In addition, the coefficient changes of different pathway of nitrogen losses are unrelated to nitrogen input and only related to meteorological factor change.
The process-based crop model and the statistical machine learning model are the primary tools for studying climate change and nitrogen management measures in agriculture. Based on a random forest model, in this study, we established the lower nitrogen and upper nitrogen limits for winter wheat in the middle and lower reaches of the Yangtze River region according to the response curve of nitrogen use to yield and nitrogen losses per unit of yield. However, establishing regional nitrogen reduction and nitrogen increase limits should have considered the heterogeneity of spatial nitrogen input. A unified nitrogen reduction and increase rate was used spatially, which may cause errors in the result evaluation. Shahhosseini, Martinez-Feria, Hu and Archontoulis [19] used machine learning algorithms to predict maize yield and nitrate loss, but the study only analyzed nitrogen loss in one pathway. It did not analyze the impact of different nitrogen management measures on nitrogen losses per unit of yield. Liu, et al. [39] simulated 180 climate change scenarios using the SPACSYS model. The results showed that nitrogen fertilizer management and sowing or transplanting dates could significantly alleviate yield losses in a winter wheat-rice rotation system. Delaying the sowing of winter wheat and advancing the transplanting of rice could reduce nitrogen losses caused by leaching and surface runoff. Wang, et al. [40] used the Root Zone Water Quality Model (RZWQM2) to test the ability of agricultural management practices (nitrogen fertilizer application, maize variety, planting date, tillage, and drainage control). The results showed increased yield and nitrogen loss under future downscaled climate scenarios with increasing fertilizer application. Crop models can simulate the response of nitrogen loss to different nitrogen use measures better than machine learning models. However, model-based research is only analyzed at a single-point scale, and the high uncertainty of the model input can lead to high uncertainty in the simulation results. In this study, we propose a random forest model of nitrogen losses per unit of yield, study it from a spatial scale, and analyze the response of total nitrogen losses per unit of yield to climate and nitrogen management strategies, providing more reference for nitrogen management in winter wheat production in the middle and lower reaches of the Yangtze River. Although, in this study, we attempt to use machine learning models to study nitrogen management strategies for winter wheat production in the middle and lower reaches of the Yangtze River under future climate change, and comprehensively quantify the impacts of climate and nitrogen on yield, the five pathways of nitrogen losses per unit of yield, and total nitrogen losses per unit of yield, the adjustment of nitrogen use in this study is a hypothetical scenario. It lacks corresponding samples in the machine learning training process of yield simulation, which may increase the uncertainty of the results. In addition, due to the small size of the data samples, the machine learning training process lacks samples corresponding to the responses of different nitrogen loss pathways to nitrogen and climate change, which may also increase the uncertainty of the results and needs to be further improved in future research.

5. Conclusions

A random forest model for wheat yield prediction in the middle and lower reaches of the Yangtze River based on meteorological and soil data can accurately simulate spatiotemporal wheat yield and can simulate the temporal trend and spatial distribution changes in wheat yield in this region, under future climate change. Based on the random forest model results, future climate change will lead to a 2–4% reduction in winter wheat production in the middle and lower reaches of the Yangtze River, but increased precipitation will offset the adverse effects of climate change. The total nitrogen losses per unit of yield in the main areas of the middle and lower reaches of the Yangtze River will decrease by 0–5% due to future climate change, but in other areas, the total nitrogen losses per unit of yield will increase by 0–5%. The predicted N leaching losses per unit of yield will increase by 0–10%. The winter wheat field yield in the middle and lower reaches of the Yangtze River responds nonlinearly to nitrogen use under future climate change, and the nitrogen losses per unit of yield responds linearly to nitrogen use. A reduction of 0.3 times the nitrogen and an increase of 0.25 times the nitrogen are the minimum nitrogen reduction and maximum nitrogen increase limits, respectively, for winter wheat field production in the middle and lower reaches of the Yangtze River.

Author Contributions

Conceptualization, X.Z. and C.F.; methodology, Y.Z. and X.Z.; software, Y.Z.; formal analysis, Y.Z. and X.Z.; data curation, Y.Z.; writing—original draft preparation, Y.Z. writing—review and editing, X.Z. and W.G. All authors have read and agreed to the published version of the manuscript.

Funding

This research was funded by the National Natural Science Foundation of China (32172111), the Special Technology Innovation Fund of Carbon Neutrality in Jiangsu Province (BE2022312), the Priority Academic Program Development of Jiangsu Higher Education Institutions; the Earmarked Fund for Jiangsu Agricultural Industry Technology System (JATS(2022)02).

Institutional Review Board Statement

Not applicable.

Informed Consent Statement

Not applicable.

Data Availability Statement

Not applicable.

Conflicts of Interest

The authors declare no conflict of interest.

References

  1. Asseng, S.; Ewert, F.; Rosenzweig, C.; Jones, J.W.; Hatfield, J.L.; Ruane, A.C.; Boote, K.J.; Thorburn, P.J.; Rötter, R.P.; Cammarano, D.; et al. Uncertainty in simulating wheat yields under climate change. Nat. Clim. Change 2013, 3, 827–832. [Google Scholar] [CrossRef]
  2. Asseng, S.; Foster, I.; Turner, N.C. The impact of temperature variability on wheat yields. Glob. Change Biol. 2011, 17, 997–1012. [Google Scholar] [CrossRef]
  3. Asseng, S.; Martre, P.; Maiorano, A.; Rötter, R.P.; O’Leary, G.J.; Fitzgerald, G.J.; Girousse, C.; Motzo, R.; Giunta, F.; Babar, M.A.; et al. Climate change impact and adaptation for wheat protein. Glob. Change Biol. 2019, 25, 155–173. [Google Scholar] [CrossRef]
  4. Bai, H.; Xiao, D.; Wang, B.; Liu, D.L.; Feng, P.; Tang, J. Multi-model ensemble of CMIP6 projections for future extreme climate stress on wheat in the North China plain. Int. J. Clim. 2020, 41, E171–E186. [Google Scholar] [CrossRef]
  5. Breiman, L. Statistical Modeling: The Two Cultures (with comments and a rejoinder by the author). Stat. Sci. 2001, 16, 199–231. [Google Scholar] [CrossRef]
  6. Cao, Q.; Miao, Y.; Shen, J.; Yuan, F.; Cheng, S.; Cui, Z. Evaluating Two Crop Circle Active Canopy Sensors for In-Season Diagnosis of Winter Wheat Nitrogen Status. Agronomy 2018, 8, 201. [Google Scholar] [CrossRef]
  7. Challinor, A.; Simelton, E.; Fraser, E.D.G.; Hemming, D.; Collins, M. Increased crop failure due to climate change: Assessing adaptation options using models and socio-economic data for wheat in China. Environ. Res. Lett. 2010, 5, 34012. [Google Scholar] [CrossRef]
  8. Chang, J.; Havlík, P.; Leclère, D.; de Vries, W.; Valin, H.; Deppermann, A.; Hasegawa, T.; Obersteiner, M. Reconciling regional nitrogen boundaries with global food security. Nat. Food 2021, 2, 700–711. [Google Scholar] [CrossRef] [PubMed]
  9. Eyring, V.; Bony, S.; Meehl, G.A.; Senior, C.A.; Stevens, B.; Stouffer, R.J.; Taylor, K.E. Overview of the Coupled Model Intercomparison Project Phase 6 (CMIP6) experimental design and organization. Geosci. Model Dev. 2016, 9, 1937–1958. [Google Scholar] [CrossRef]
  10. Feng, P.; Wang, B.; Liu, D.L.; Waters, C.; Xiao, D.; Shi, L.; Yu, Q. Dynamic wheat yield forecasts are improved by a hybrid approach using a biophysical model and machine learning technique. Agric. For. Meteorol. 2020, 285–286, 107922. [Google Scholar] [CrossRef]
  11. Gaupp, F.; Hall, J.; Mitchell, D.; Dadson, S. Increasing risks of multiple breadbasket failure under 1.5 and 2 C global warming. Agric. Syst. 2019, 175, 34–45. [Google Scholar] [CrossRef]
  12. Heting, W.; Conghe, Z.; Yu, F.; Jinhua, C.; Zhi, Y.; Guixiang, Z.; Lin, W.; Wei, Y.; Guangle, S.; Hui, W. The Impact of Climate Change on Crop Breeding Strategies in China. Chin. Agric. Sci. Bull. 2022, 38, 11. [Google Scholar]
  13. Huntington, T.; Baral, N.R.; Yang, M.; Sundstrom, E.; Scown, C.D. Machine learning for surrogate process models of bioproduction pathways. Bioresour. Technol. 2023, 370, 128528. [Google Scholar] [CrossRef]
  14. Jägermeyr, J.; Müller, C.; Ruane, A.C.; Elliott, J.; Balkovic, J.; Castillo, O.; Faye, B.; Foster, I.; Folberth, C.; Franke, J.A.; et al. Climate impacts on global agriculture emerge earlier in new generation of climate and crop models. Nat. Food 2021, 2, 873–885. [Google Scholar] [CrossRef] [PubMed]
  15. Leng, G.; Hall, J.W. Predicting spatial and temporal variability in crop yields: An inter-comparison of machine learning, regression and process-based models. Environ. Res. Lett. 2020, 15, 44027. [Google Scholar] [CrossRef] [PubMed]
  16. Liu, C.; Wang, L.; Le Cocq, K.; Chang, C.; Li, Z.; Chen, F.; Liu, Y.; Wu, L. Climate change and environmental impacts on and adaptation strategies for production in wheat-rice rotations in southern China. Agric. For. Meteorol. 2020, 292, 108136. [Google Scholar] [CrossRef]
  17. Lobell, D.B.; Schlenker, W.; Costa-Roberts, J. Climate Trends and Global Crop Production Since 1980. Science 2011, 333, 616–620. [Google Scholar] [CrossRef] [PubMed]
  18. Long, X.-X.; Ju, H.; Wang, J.-D.; Gong, S.-H.; Li, G.-Y. Impact of climate change on wheat yield and quality in the Yellow River Basin under RCP8. 5 during 2020–2050. Adv. Clim. Change Res. 2022, 13, 397–407. [Google Scholar] [CrossRef]
  19. Luo, Y.; Zhang, Z.; Li, Z.; Chen, Y.; Zhang, L.; Cao, J.; Tao, F. Identifying the spatiotemporal changes of annual harvesting areas for three staple crops in China by integrating multi-data sources. Environ. Res. Lett. 2020, 15, 74003. [Google Scholar] [CrossRef]
  20. Arias, P.; Bellouin, N.; Coppola, E.; Jones, R.; Krinner, G.; Marotzke, J.; Naik, V.; Palmer, M.; Plattner, G.-K.; Rogelj, J. Climate Change 2021: The Physical Science Basis. Contribution of Working Group I to the Sixth Assessment Report of the Intergovernmental Panel on Climate Change; Technical Summary; 2021. [Google Scholar]
  21. Meng, Q.; Hou, P.; Lobell, D.B.; Wang, H.; Cui, Z.; Zhang, F.; Chen, X. The benefits of recent warming for maize production in high latitude China. Clim. Chang. 2013, 122, 341–349. [Google Scholar] [CrossRef]
  22. Müller, J.; Joos, F. Global peatland area and carbon dynamics from the Last Glacial Maximum to the present – a process-based model investigation. Biogeosciences 2020, 17, 5285–5308. [Google Scholar] [CrossRef]
  23. Nb, S. National Bureau of Statistics; Publications of Beijing, September 2019. [Google Scholar]
  24. Pu, Z.; Zhang, S.; Bin, J.; Dou, X.; Gong, H.; Cao, X. Effect of Climate Change on Winter Wheat Yield in Urumqi City. J. Northwest AF Univ. Nat. Sci. Ed. 2013, 41, 115–123. [Google Scholar]
  25. Puntel, L.A.; Pagani, A.; Archontoulis, S.V. Development of a nitrogen recommendation tool for corn considering static and dynamic variables. Eur. J. Agron. 2019, 105, 189–199. [Google Scholar] [CrossRef]
  26. Rötter, R.; Appiah, M.; Fichtler, E.; Kersebaum, K.; Trnka, M.; Hoffmann, M. Linking modelling and experimentation to better capture crop impacts of agroclimatic extremes—A review. Field Crop. Res. 2018, 221, 142–156. [Google Scholar] [CrossRef]
  27. Schlenker, W.; Lobell, D.B. Robust negative impacts of climate change on African agriculture. Environ. Res. Lett. 2010, 5, 14010. [Google Scholar] [CrossRef]
  28. Shahhosseini, M.; Martinez-Feria, R.A.; Hu, G.; Archontoulis, S.V. Maize yield and nitrate loss prediction with machine learning algorithms. Environ. Res. Lett. 2019, 14, 124026. [Google Scholar] [CrossRef]
  29. Song, Y.; Linderholm, H.; Wang, C.; Tian, J.; Huo, Z.; Gao, P.; Song, Y.; Guo, A. The influence of excess precipitation on winter wheat under climate change in China from 1961 to 2017. Sci. Total Environ. 2019, 690, 189–196. [Google Scholar] [CrossRef]
  30. Tian, X.; Yin, Y.; Zhuang, M.; Cong, J.; Chu, Y.; He, K.; Zhang, Q.; Cui, Z. Bottom-up estimates of reactive nitrogen loss from Chinese wheat production in 2014. Sci. Data 2022, 9, 233. [Google Scholar] [CrossRef]
  31. Wang, G.; Chen, X.; Cui, Z.; Yue, S.; Zhang, F. Estimated reactive nitrogen losses for intensive maize production in China. Agric. Ecosyst. Environ. 2014, 197, 293–300. [Google Scholar] [CrossRef]
  32. Wang, Z.; Qi, Z.; Xue, L.; Bukovsky, M. RZWQM2 simulated management practices to mitigate climate change impacts on nitrogen losses and corn production. Environ. Model. Softw. 2016, 84, 99–111. [Google Scholar] [CrossRef]
  33. Wen, X. Study on the Risk of Nitrogen Runoff Loss in Single-Cropping Paddy Fields in the Middle and Lower Yangtze River Plain Master; Anhui Agricultural University: Hefei, China, 2021. [Google Scholar]
  34. Wiegand, C.L.; Cuellar, J.A. Duration of Grain Filling and Kernel Weight of Wheat as Affected by Temparature1. Crop. Sci. 1981, 21, 95–101. [Google Scholar] [CrossRef]
  35. Xu, X.; Ouyang, X.; Gu, Y.; Cheng, K.; Smith, P.; Sun, J.; Li, Y.; Pan, G. Climate change may interact with nitrogen fertilizer management leading to different ammonia loss in China’s croplands. Glob. Chang. Biol. 2021, 27, 6525–6535. [Google Scholar] [CrossRef] [PubMed]
  36. Xu, Z.; Han, Y.; Tam, C.-Y.; Yang, Z.-L.; Fu, C. Bias-corrected CMIP6 global dataset for dynamical downscaling of the historical and future climate (1979–2100). Sci. Data 2021, 8, 293. [Google Scholar] [CrossRef]
  37. Zhang, X.; Li, Z.; Siddique, K.H.; Shayakhmetova, A.; Jia, Z.; Han, Q. Increasing maize production and preventing water deficits in semi-arid areas: A study matching fertilization with regional precipitation under mulch planting. Agric. Water Manag. 2020, 241, 106347. [Google Scholar] [CrossRef]
  38. Zhao, C.; Liu, B.; Piao, S.; Wang, X.; Lobell, D.B.; Huang, Y.; Huang, M.T.; Yao, Y.T.; Bassu, S.; Ciais, P.; et al. Temperature increase reduces global yields of major crops in four independent estimates. Proc. Natl. Acad. Sci. USA 2017, 114, 9326–9331. [Google Scholar] [CrossRef]
  39. Zheng, C.; Zhang, J.; Chen, J.; Chen, C.; Tian, Y.; Deng, A.; Song, Z.; Nawaz, M.M.; van Groenigen, K.J.; Zhang, W. Nighttime warming increases winter-sown wheat yield across major Chinese cropping regions. Field Crop. Res. 2017, 214, 202–210. [Google Scholar] [CrossRef]
  40. Zhou, Y.; Wang, Q.; He, B.; Zhang, J.; Tan, S. Simulation Analysis of Effects of Air Temperature and CO2 Concentration Changes on Winter Wheat Yield in Northern Shaanxi. J. Soil Water Conserv. 2017, 31, 292–297. [Google Scholar]
Figure 1. The performance of training (a) and validating (b) for random forest models.
Atmosphere 14 00824 g001
Figure 2. Spatial distribution of relative historical changes in annual cumulative precipitation (ad) and annual mean temperature (eh) in the middle and lower reaches of the Yangtze River for 2031–2065 and 2066–2100 under SSP126 and SSP585 emission scenarios.
Atmosphere 14 00824 g002
Figure 3. Spatial distribution of the predicted mean (ad) and relative historical changes (eh) in winter wheat yields in the middle and lower reaches of the Yangtze River based on random forest models for 2031–2065 and for 2066–2100 under SSP126 and SSP585 emission scenarios.
Atmosphere 14 00824 g003
Figure 5. Spatial distribution of five pathways of nitrogen losses per unit of wheat yield ((a) NO; (b) N2O; (c) NH3; (d) NO3; (e) Nr) and total nitrogen losses per unit of wheat yield (f) in winter wheat farmland in the middle and lower reaches of the Yangtze River from 2001 to 2015, kg N × 1000 kg W−1ha−1.
Atmosphere 14 00824 g005
Figure 6. Spatial distribution of relative historical changes in random forest predictions of nitrogen losses per unit of wheat yield pathways and total nitrogen losses per unit of wheat yield for five winter wheat croplands in the middle and lower reaches of the Yangtze River for 2031–2065 and for 2066–2100, under SSP126 and SSP585 emission scenarios.
Atmosphere 14 00824 g006
Figure 7. Changes in yield and nitrogen losses per unit of yield under different nitrogen application rates in winter wheat fields in the middle and lower reaches of Yangtze River from 2031 to 2065 and from 2066 to 2100, under SSP126 and SSP585 emission scenarios.
Atmosphere 14 00824 g007
Figure 8. Nitrogen use response curves for yield and nitrogen losses per unit of yield in winter wheat farms in the middle and lower reaches of the Yangtze River for 2031–2065 and for 2066–2100, under SSP126 and SSP585 emission scenarios.
Atmosphere 14 00824 g008
Figure 9. Spatial distribution of mean(a-d) and relative changes(e-h) in winter wheat yield at the minimum nitrogen reduction limit in the middle and lower reaches of the Yangtze River for 2031–2065 and for 2066–2100, under SSP126 and SSP585 emission scenarios.
Atmosphere 14 00824 g009
Figure 10. Spatial distribution of mean(ad) (kg N × 1000 kg W−1ha−1) and relative changes(eh) in total nitrogen losses per unit of yield of winter wheat at the minimum nitrogen reduction limit in the middle and lower reaches of Yangtze River from 2031 to 2065 and from 2066 to 2100, under SSP126 and SSP585 emission scenarios.
Atmosphere 14 00824 g010
Figure 11. Spatial distribution of mean(ad) and relative changes(e–h) in winter wheat yield at the upper limit of nitrogen reduction in the middle and lower reaches of the Yangtze River for 2031–2065 and for 2066–2100, under SSP126 and SSP585 emission scenarios.
Atmosphere 14 00824 g011
Figure 12. Spatial distribution of mean (ad) (kg N × 1000 kg W−1ha−1) and relative changes (eh) in total nitrogen losses per unit of yield for winter wheat at the maximum nitrogen increase limit in the middle and lower reaches of the Yangtze River from 2031 to 2065 and from 2066 to 2100, under SSP126 and SSP585 emission scenarios.
Atmosphere 14 00824 g012
Table 1. Description of the wheat dataset for the middle and lower reaches of the Yangtze River.
ObjectMeanMedianMin-Max95%CIUnit
Yield5247.95584.6594.4–7056.33030.15–6521.28kg hm−2
N rate215.8216.355.9–301144.8–294.8kg N hm−2
MAP1383.01346.71103.3–1760.31285.5–1643.8mm
MAT10.210.52.4–12.48.7–11.9°C
SOM21.016.74.5–120.011.9–34.7g kg−1
TN1.10.90.3–4.60.7–1.8g kg−1
pH7.06.82.0–8.64.7–8.4
BD1.41.40.4–1.71.2–1.7g cm−3
Sand38.639.06.5–68.013.0–50.0%
Silt36.737.08.0–52.029.7–42.0%
Clay23.921.24.2–55.015.7–55.0%
Disclaimer/Publisher’s Note: The statements, opinions and data contained in all publications are solely those of the individual author(s) and contributor(s) and not of MDPI and/or the editor(s). MDPI and/or the editor(s) disclaim responsibility for any injury to people or property resulting from any ideas, methods, instructions or products referred to in the content.

