Article

Variations of Cooling and Dehumidification Degree Days in Major Climate Zones of China during the Past 57 Years

1
Tianjin Key Laboratory for Oceanic Meteorology, Tianjin 300073, China
2
Tianjin Institute of Meteorological Sciences, Tianjin 300074, China
3
Key Laboratory of Cities Mitigation and Adaptation to Climate Change in Shanghai, Shanghai 200030, China
4
Guangzhou Climate and Agrometeorology Center, Guangzhou 511430, China
5
Institute of Building Environment and Energy Efficiency, China Academy of Building Research, Beijing 100013, China
*
Authors to whom correspondence should be addressed.
Atmosphere 2023, 14(4), 752; https://doi.org/10.3390/atmos14040752
Submission received: 2 March 2023 / Revised: 12 April 2023 / Accepted: 20 April 2023 / Published: 21 April 2023
(This article belongs to the Special Issue Earth System Energy Budget and Climate Change)

Abstract

:
In previous studies, the concept of degree days has been widely used to indicate heating or cooling energy requirements, but it does not consider the dehumidification effect. In the present study, the concept of dehumidification degree days based on moisture content is used, and the degree days over the past 57 years for temperature decreasing and dehumidification in 4 cities belonging to major climate zones of China are analyzed. The results showed that the number of cooling degree days showed a significant increase (1.2–4.6 days/10 a) in all the selected cities, corresponding to the warming climate. In contrast, the degree days of dehumidification accounted for 19%–45% of the total days in summer and showed significant decreases (2.0–3.7 days/10 a) in the cold, hot summer and cold winter, and hot summer and warm winter climate zones. Comfortable days, i.e., days requiring no cooling and no dehumidification, accounting for 8–45% of the total days in summer, decreased significantly in the extreme cold and cold zones (0.9–1.8 days/10 a) but showed no apparent changes in the hot summer and cold winter and hot summer and warm winter climate zones. This study suggests that energy consumption for cooling increases linearly with climate warming, and only the energy consumed for dehumidification had an apparent decrease. The degree days of dehumidification, as well as those requiring no cooling and no dehumidification, should be fully considered in the capacity design of air-conditioning units, especially air-conditioning systems with temperature- and humidity-independent control (THIC). This study indicates that the assessment of energy consumption for requests for air-conditioning in relation to climate change should be carried out after separating energy consumption for cooling from energy consumption for dehumidification to improve building energy efficiency and indoor comfort.

1. Introduction

In 2018, energy consumption in buildings accounted for up to 30% of the total energy consumption worldwide, of which energy consumed for heating and cooling was responsible for about 40% of that demand [1]. A similar situation exists in China, where buildings also have a major role in the total energy demand. In China, building energy consumption accounts for more than 30% of the total national energy consumption and is projected to increase to 35% by 2020 [2]. The sixth assessment report of the Intergovernmental Panel on Climate Change (IPCC) showed that the global surface temperature increased around 0.85 °C and 1.1 °C in the periods of 1880–2012 and 2011–2020 compared with that from 1850 to 1900 [3]. More importantly, as global warming continues, the global surface temperatures in the years 2081–2100, depending on emissions scenarios and climate models, are projected to increase 1.4 °C–4.4 °C [3]. Continuous warming strongly affects global energy use and greenhouse gas emissions, which have received widespread attention. In order to grasp the impact of global warming on energy consumption, especially energy consumption for heating/cooling, the energy consumption simulation method [4,5,6,7,8], or degree-day method [9,10,11,12,13,14] has been used.
Compared with energy consumption simulation, the degree-day method, generally including heating and cooling degree days, has the advantages of simplicity, transparency, and repeatability that energy consumption simulation may not provide [14]. Many previous studies have used degree days to quickly estimate the impacts of climate change on energy consumption for heating or cooling buildings [13,14,15]. However, it is necessary to note that the degree days are defined as the accumulated degree deviations from a predefined base temperature without considering other climatic parameters, especially the humidity. This may have reduced the effectiveness of using heating degree days to reflect the energy consumption for heating due to the high relationship between heating energy requirements and temperature [5,9,16,17,18]. In contrast, it may be very unreliable to study the impact of climate change on cooling energy consumption by using cooling degree days because the energy consumed by air-conditioning systems is, to a large extent, used for dehumidification to achieve comfortable indoor conditions, especially in hot and humid areas [2,19,20,21,22]. In order to determine the combined impacts of temperature and humidity on nature and human society, some previous studies have focused on both dry and wet extreme high-temperature events [23,24,25] and the combined changes in temperature and humidity [26]. However, the impacts of humidity, alone or in combination with temperature, on building performance, especially on building energy consumption, are rather limited. In recent years, air-conditioning systems with temperature- and humidity-independent control (THIC) have been proposed to regulate indoor temperature and humidity separately through different approaches [27]. Therefore, it is necessary to reveal the effect of climate change on the energy consumption of air-conditioning systems by separating the use of cooling and dehumidification to improve the indoor comfort and energy efficiency of the air-conditioning system. To the best of our knowledge, there are fewer related studies investigating the effect of climate change on the building or energy performances of air conditioning in summer by considering cooling and dehumidification separately. In a study by Cao et al. [28], representative cities belonging to the major climate zones of China were selected to determine the effects of changes in outdoor design temperature and relative humidity over the past 57 years on the design loads for cooling and dehumidification in different climate zones. They demonstrated that the combined changes in humidity and temperature should be fully considered to determine the design capacity of an air-conditioning system. In addition, in order to reflect the effect of humidity, a model of coupled heat and moisture transfer was established to quantify the latent load in the hot and humid region of southern China in the context of global warming [29].
In this study, four representative cities in different climate zones of China were selected to determine the climate change impacts on cooling and dehumidification energy consumption by using cooling/dehumidification degree days. The aims of the present study were (1) to determine how cooling/dehumidification energy consumption changes in different climate zones under the conditions of global warming and (2) to investigate to what extent humidity affects the energy consumption of air conditioning and how the energy consumption for dehumidification should be considered in different climate zones when taking energy efficiency measures. This study may provide efficient evidence regarding the importance of dehumidification in the capacity design of air conditioning, especially for different climate zones. This will be beneficial for improving the energy efficiency and indoor comfort of buildings under the conditions of climate change.

2. Methodology

2.1. Study Area

There are five major climate zones in China: severe cold; cold; hot summer and cold winter; hot summer and warm winter; and mild climate zones. It is necessary to note that there are no heating or cooling loads in the mild climate zone and the heat transfer coefficient (HTC) of building envelopes has no limit. In addition, the number of cooling degree days during the past 60 years is nearly zero due to the average daily temperature in this climate being lower than 26 °C. Therefore, the mild climate zone is not included in the present study. Harbin, Tianjin, Shanghai, and Guangzhou were selected to represent the four major climate zones of China (Figure 1). The selected cities are the capitals of provinces (Harbin and Guangzhou) or the province-level municipalities (Tianjin and Shanghai) of China and can be seen as the representatives of their respective climate zones. This study can be useful for promoting energy-saving strategies for these large cities. More importantly, we have obtained relatively complete meteorological data from 1961 to 2017 for these four cities. These selected cities are located ranging in a range of low to high latitudes (23.0° N–45.5° N) with a longitudinal range of 113.1° E–126.3° E. Harbin and Tianjin are the second largest cities in the severe cold and cold climate zones, respectively, and Shanghai and Guangzhou are the largest cities in the hot summer and cold winter and hot summer and warm winter climate zones, respectively. It is necessary to note that, although only four cities (one city for each climate zone) were selected, the results obtained in these selected cities may be representative according to previous studies [2,17,18].

2.2. Meteorological Data

Daily average temperature and relative humidity data during the periods of 1961–2017 for the selected cities were used to calculate the number of cooling and dehumidification degree days. The meteorological data were obtained from the National Meteorological Information Center by uploading to the National Meteorological Science Data Center (http://data.cma.cn/, accessed on 19 June 2019). To obtain the information on climate change’s impacts on energy consumption in the central urban area, the meteorological observation stations (with longer history records) located in the urban centers of the four cities were selected (with the meteorological observation stations in Harbin, Tianjin, and Guangzhou belonging to the national basic meteorological stations of China, and the station in Shanghai being a national general meteorological station). The quality control and homogeneity of the selected meteorological data were strictly tested to ensure the reliability and accuracy of the data. Generally, station relocation is one of the most important factors that cause discontinuities in the temporal series of meteorological data. In previous studies, the RHtestsV3 combined with station metadata was used for the homogeneity test of meteorological data to ensure the reliability and accuracy of the meteorological data. In more detail, the RHtestV3, a data homogenization software package, is not limited by the time series length and has a friendly graphical user interface (GUI) that can be used to homogenize the time series at each station and its matching reference series based on the R environment [30]. This software package can detect and adjust for multiple breakpoints (shifts) that potentially exist in a data series using the penalized maximal t test (PMT) [31] and penalized maximal F test (PMF) [32]. It has been found that no apparent discontinuities are detected for these selected meteorological data and that the data are relatively reliable [2,17]. According to the actual demand for air-conditioning in summer in the representative cities, July to August, June to August, June to September, and May to October were selected as the air-conditioning periods of the severe cold, cold, hot summer and cold winter, and hot summer and warm winter climate zones, respectively.

2.3. Calculation of Degree Days

According to the design code for the HVAC of civil buildings (GB50736-2012) of China (DCHVAC 2012) [33] and referring to reference [34], an indoor air moisture content of 12.79 g/kg, determined by the indoor design temperature of 26 °C and relative humidity of 60%, is usually used as the standard threshold for dehumidification (i.e., indoor air moisture content above 12.79 g/kg requires dehumidification). When the air moisture content is above 12.79 g/kg, it means that the human body feels stuffy and the air needs dehumidification [34]. Therefore, 26 °C and 12.79 g/kg were used as the boundaries for cooling and dehumidification, respectively. Similar to the previous study, cooling degree days were calculated as the cumulative temperature above a base temperature (in this case, 26 °C) during one day. In this calculation, regardless of the moisture content, the daily average temperature above 26 °C is calculated. The dehumidification degree days were determined as the cumulative number of days with a daily average temperature below 26 °C and a daily average moisture content above 12.79 g/kg. Therefore, it can only be used to reflect the energy consumption for dehumidification. In addition, the number of comfortable degree days (i.e., no cooling and no dehumidification) was also determined by the daily average temperature below 26 °C and the daily average moisture content below 12.79 g/kg.

3. Degree Days of Cooling or Dehumidification in Different Climate Zones

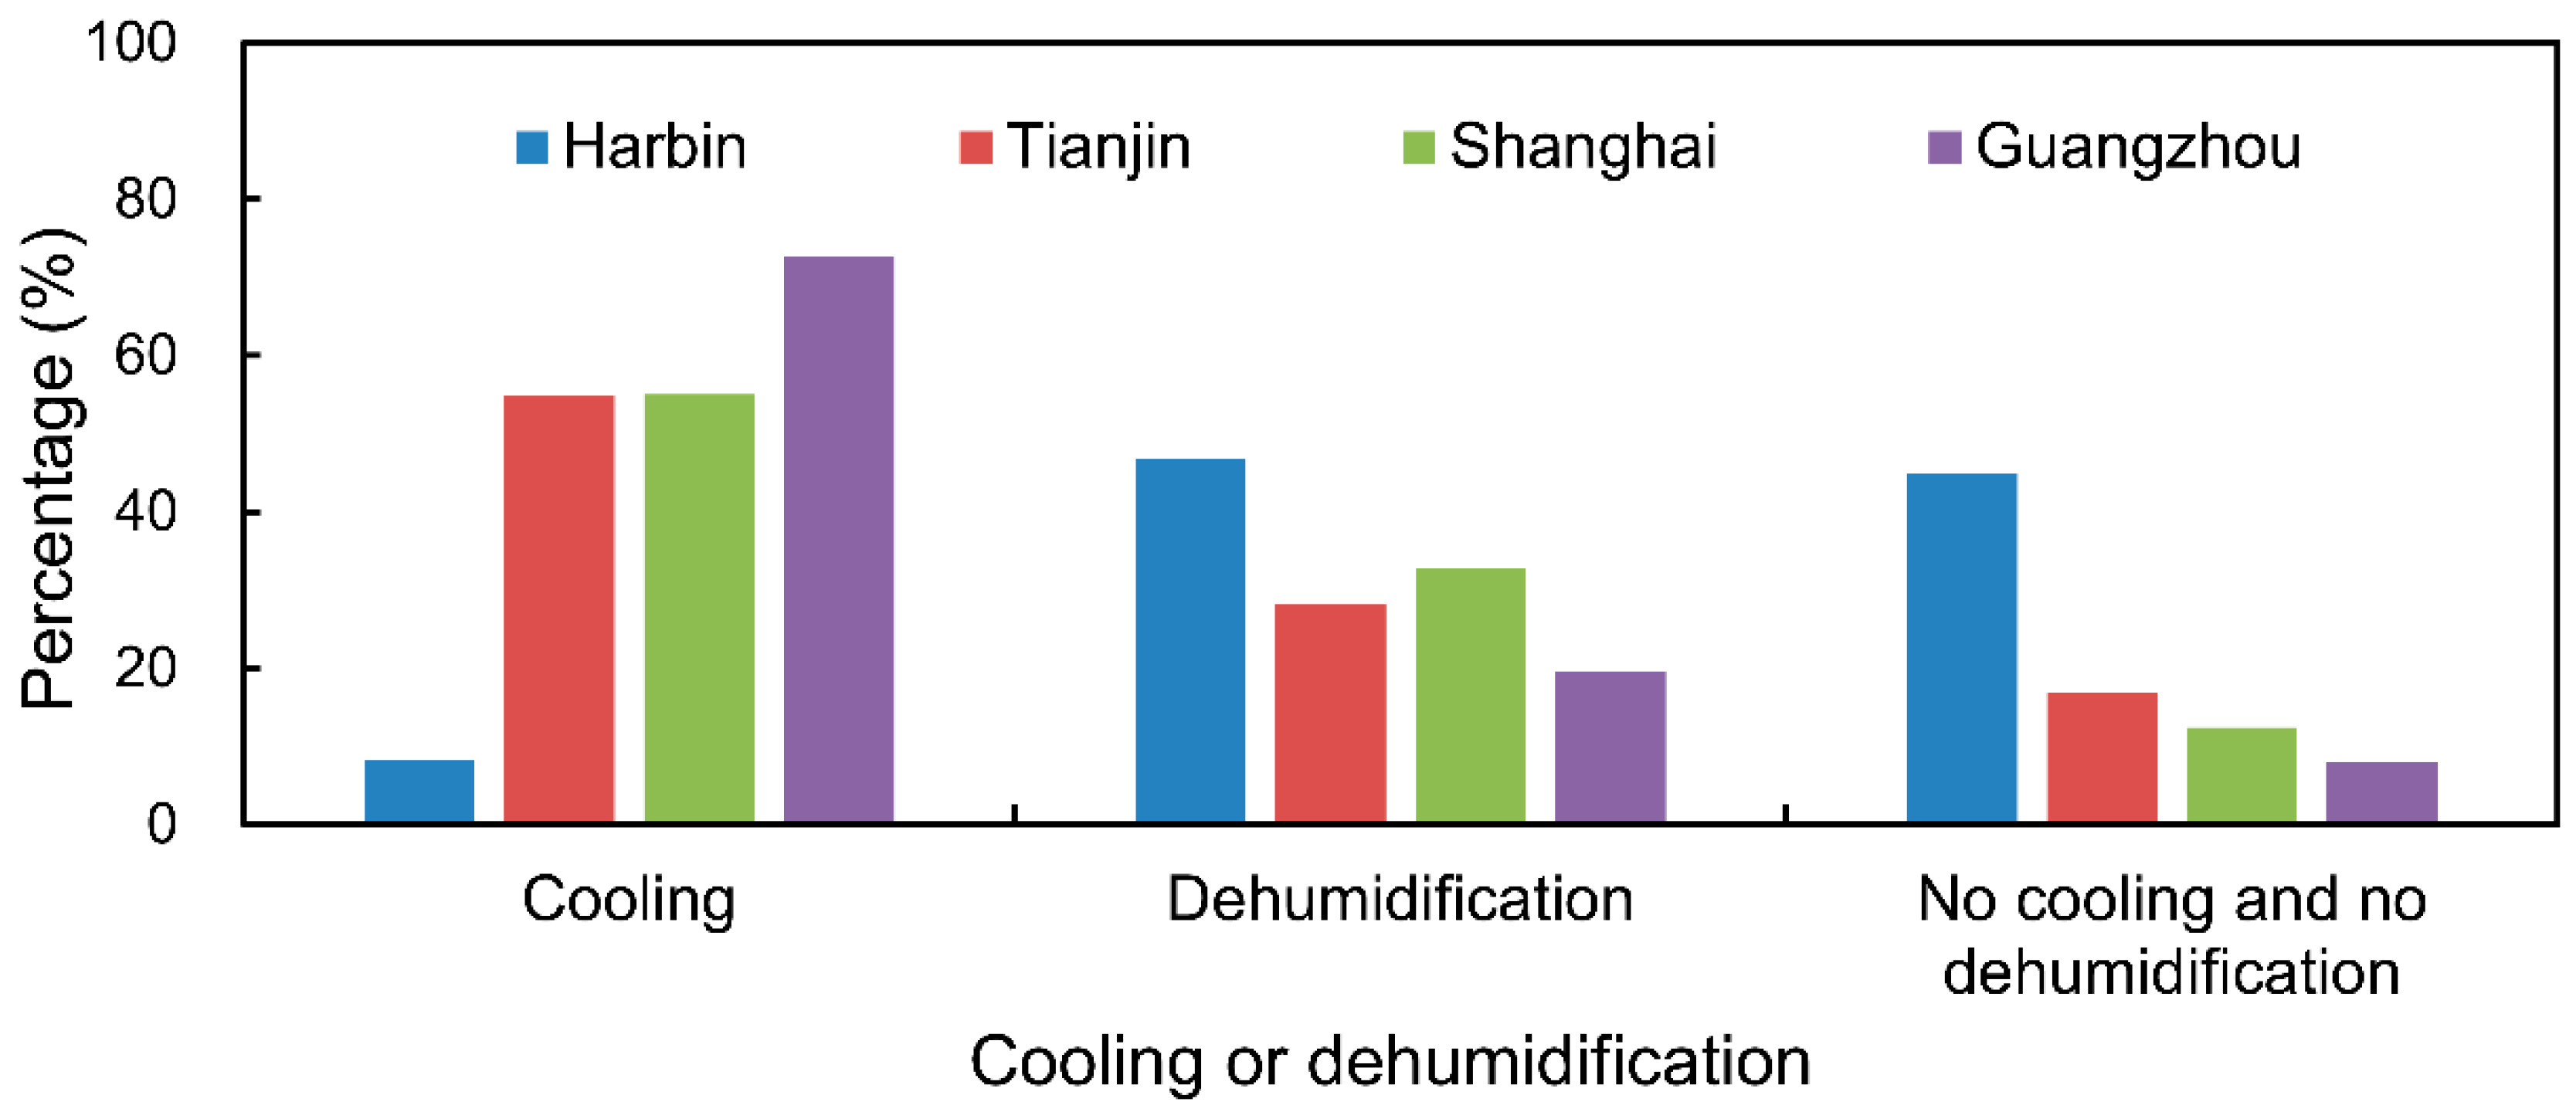
3.1. Spatial Differences

There were apparent differences in the number of cooling degree days and dehumidification degree days in the four different climate zones (Figure 2). For Harbin in the severe cold climate zone, the days requiring cooling only accounted for 8% of the total, whereas the percentage of the days requiring dehumidification and no cooling and no dehumidification requirement were 47% and 45 %, respectively. For Tianjin, Shanghai, and Guangzhou, belonging to the cold, hot summer and cold winter, and hot summer and warm winter climate zones, respectively, the percentage of days requiring cooling requirement was the highest (54%, 55%, and 73%), followed by the days needing dehumidification (28%, 32%, and 19%) and the days needing no cooling and no dehumidification (17%, 12%, and 8%). From the cold to warm zones, the number of cooling degree days apparently increased, whereas the number of dehumidification degree days and the degree days of no cooling and no dehumidification requirement largely decreased.

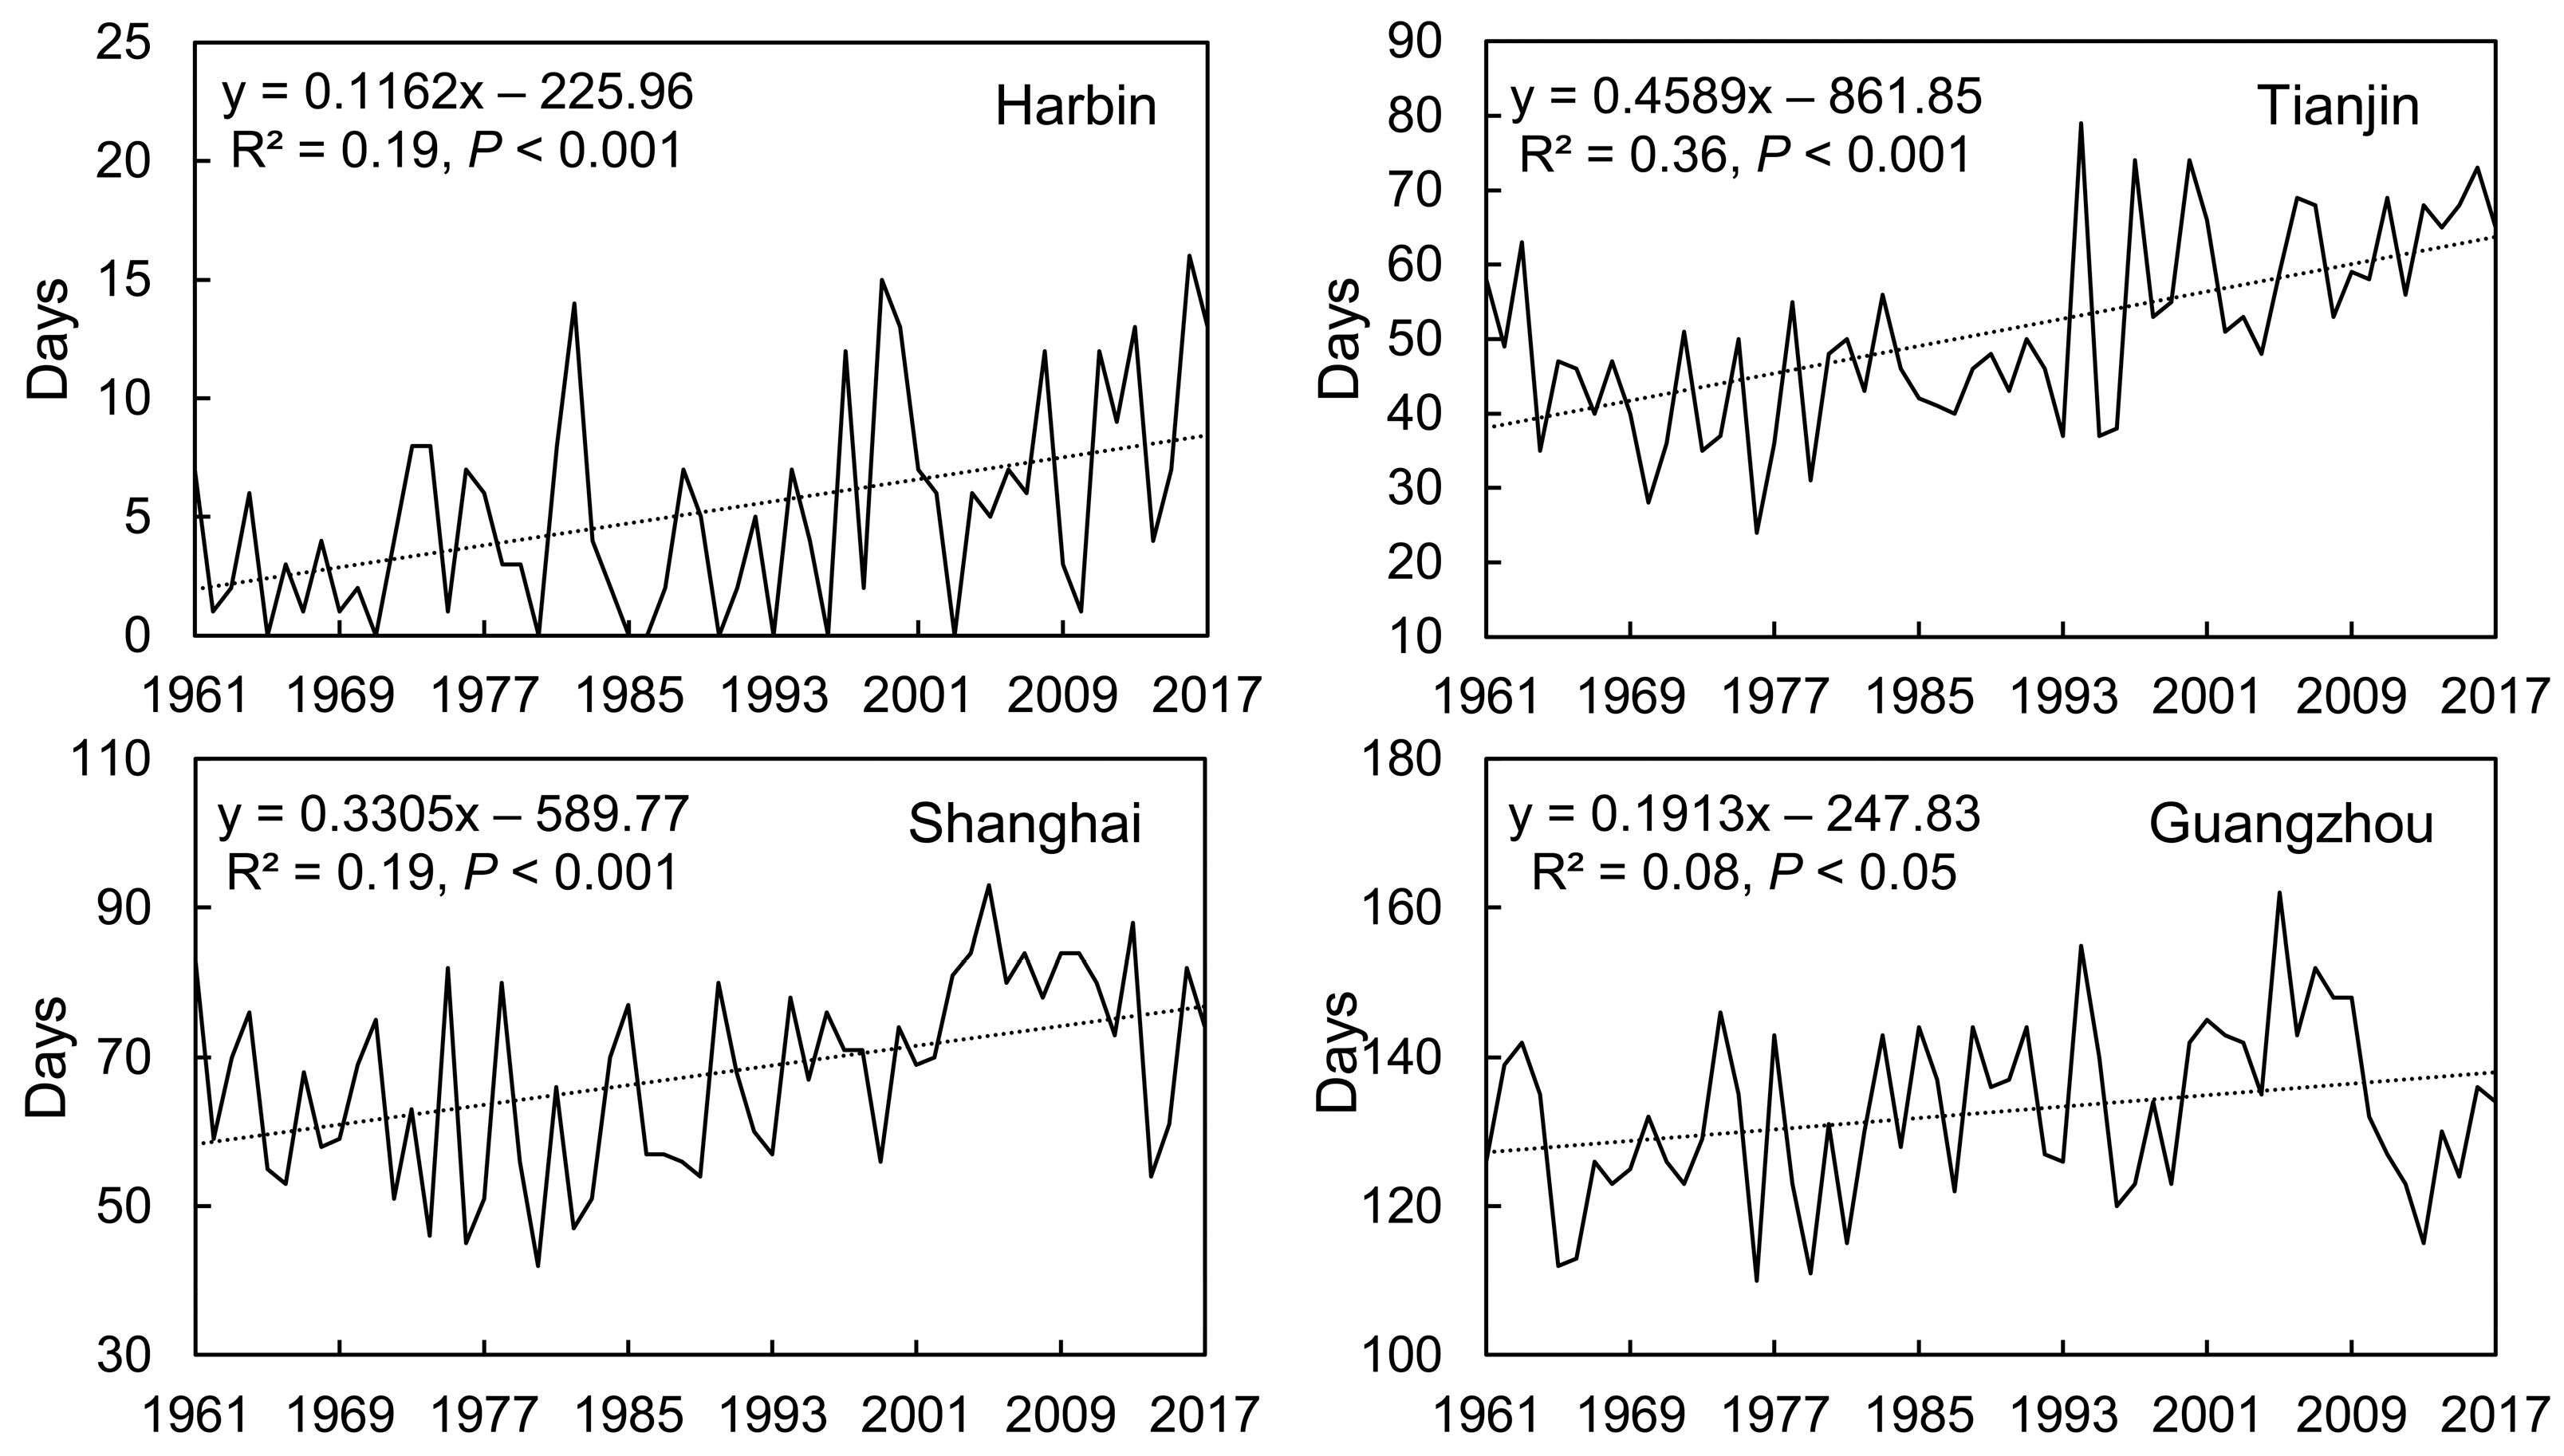
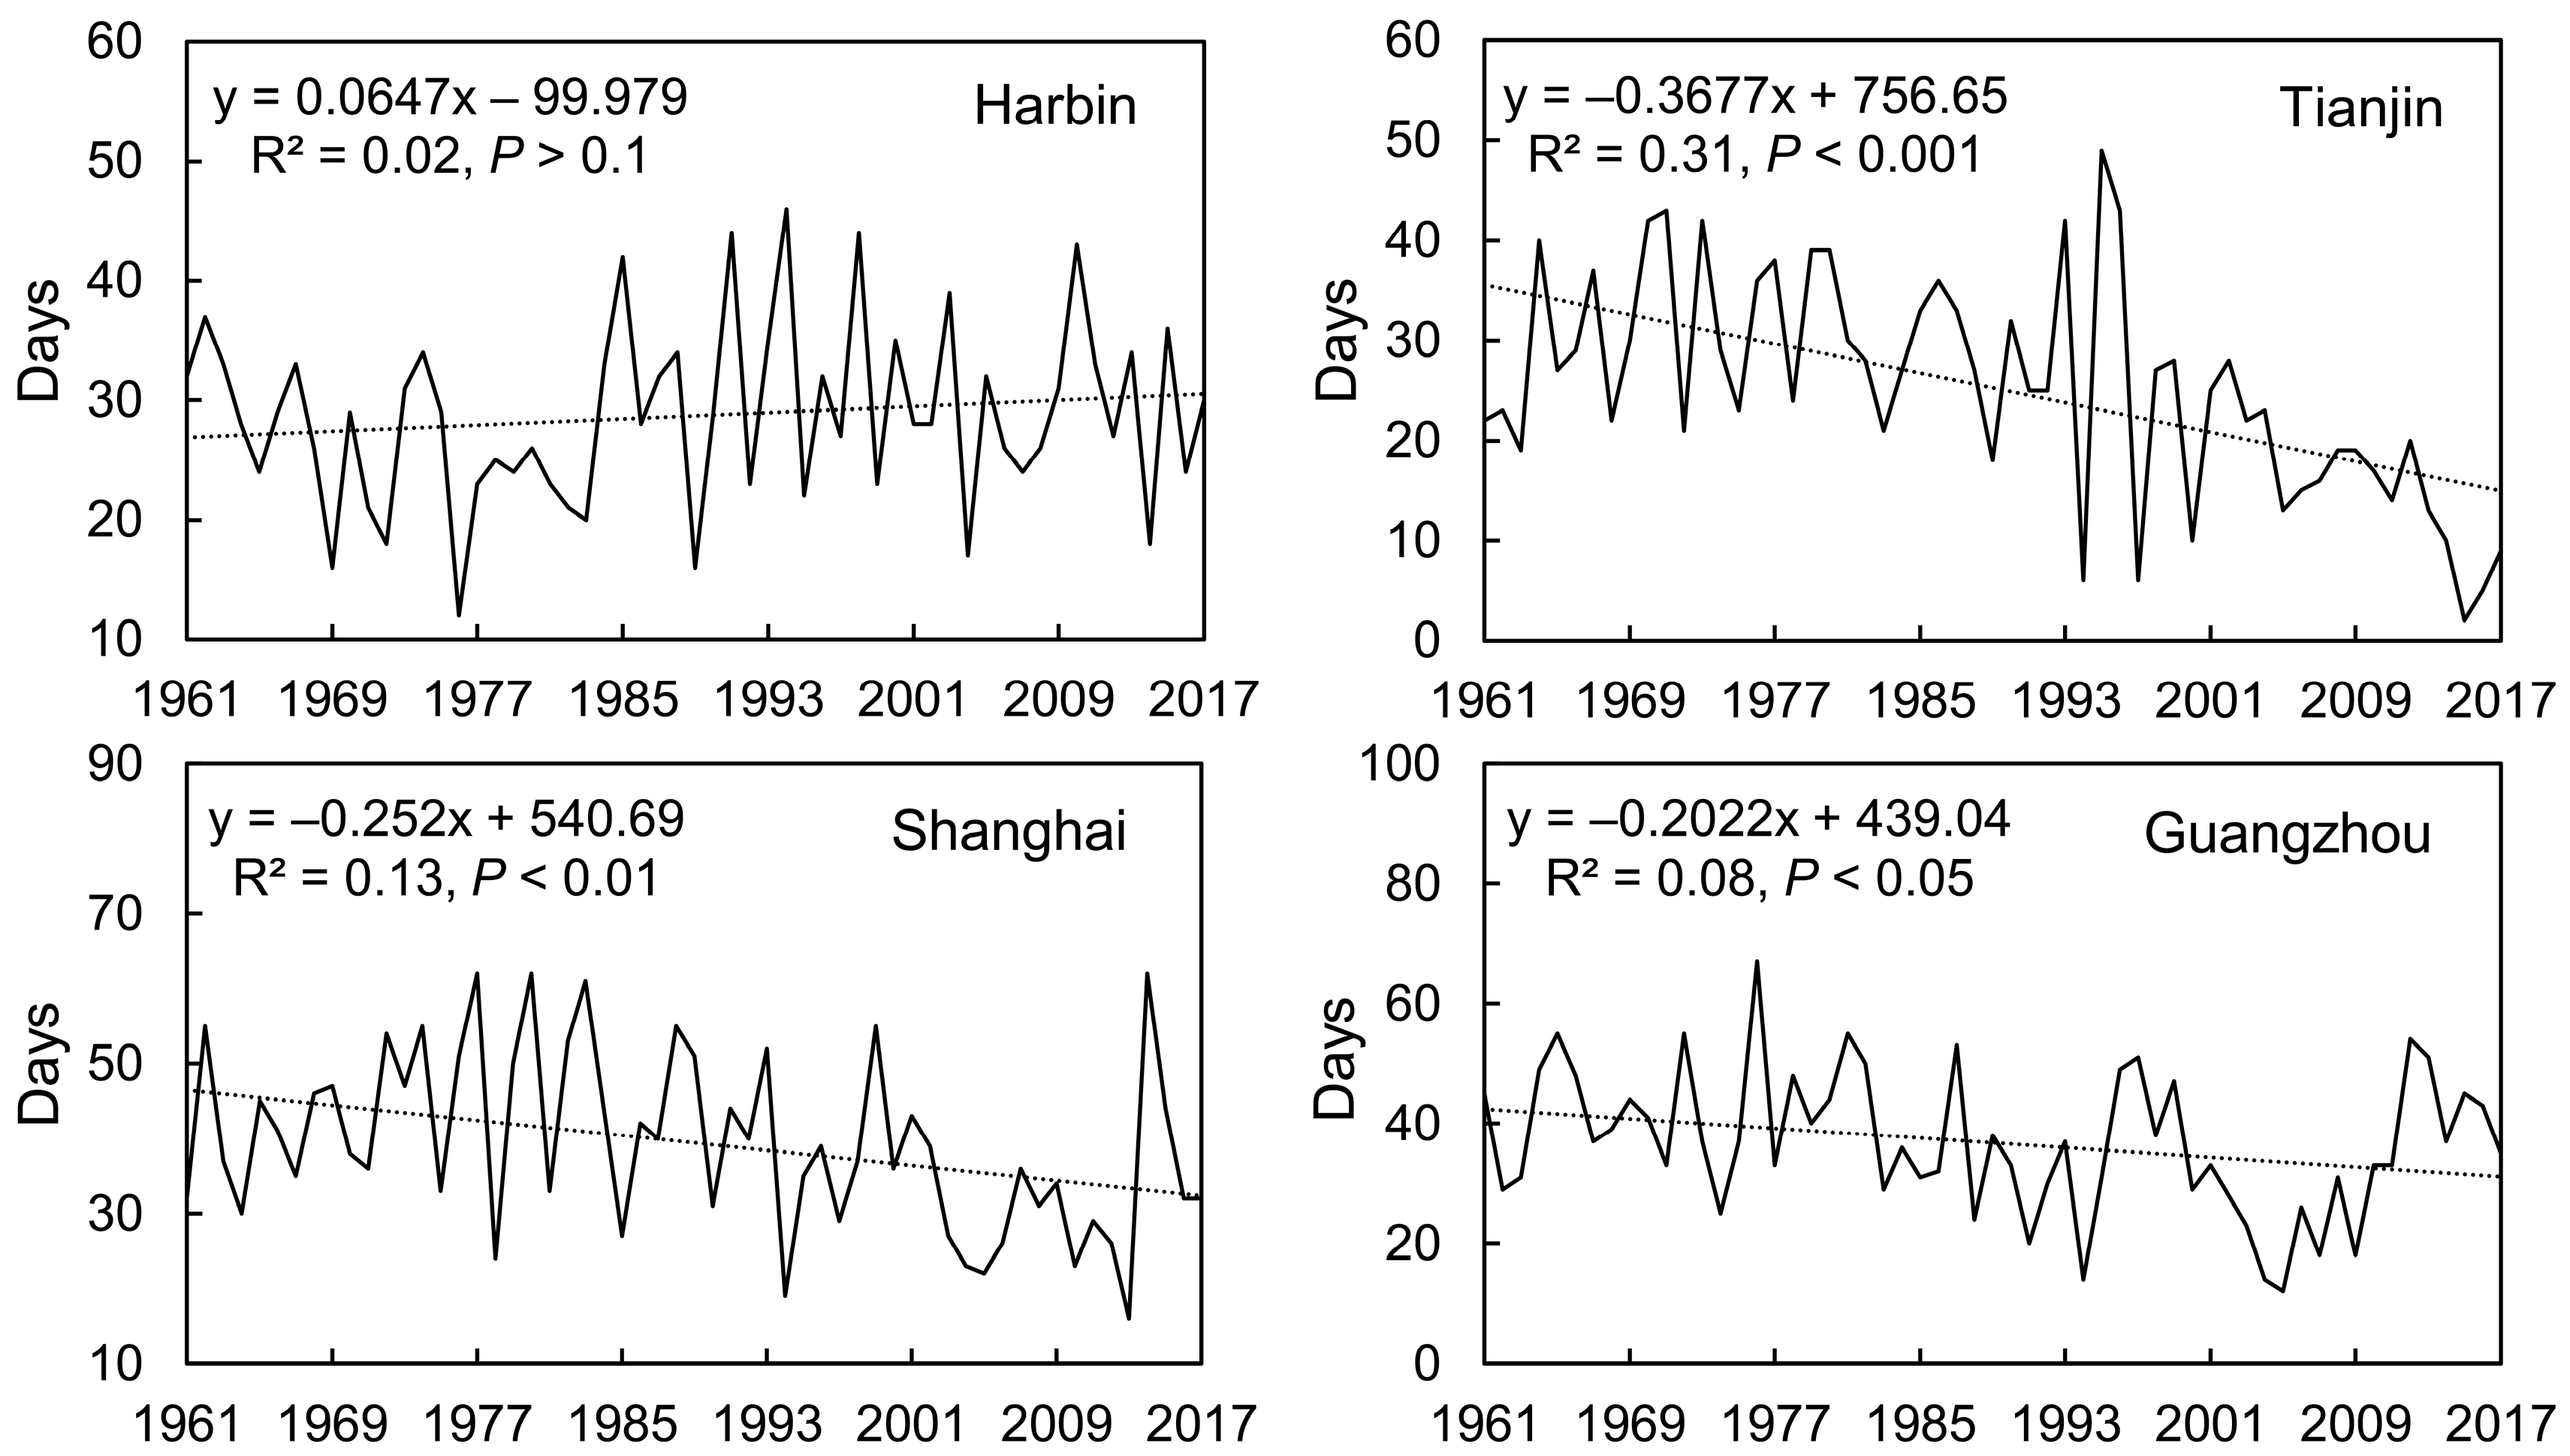
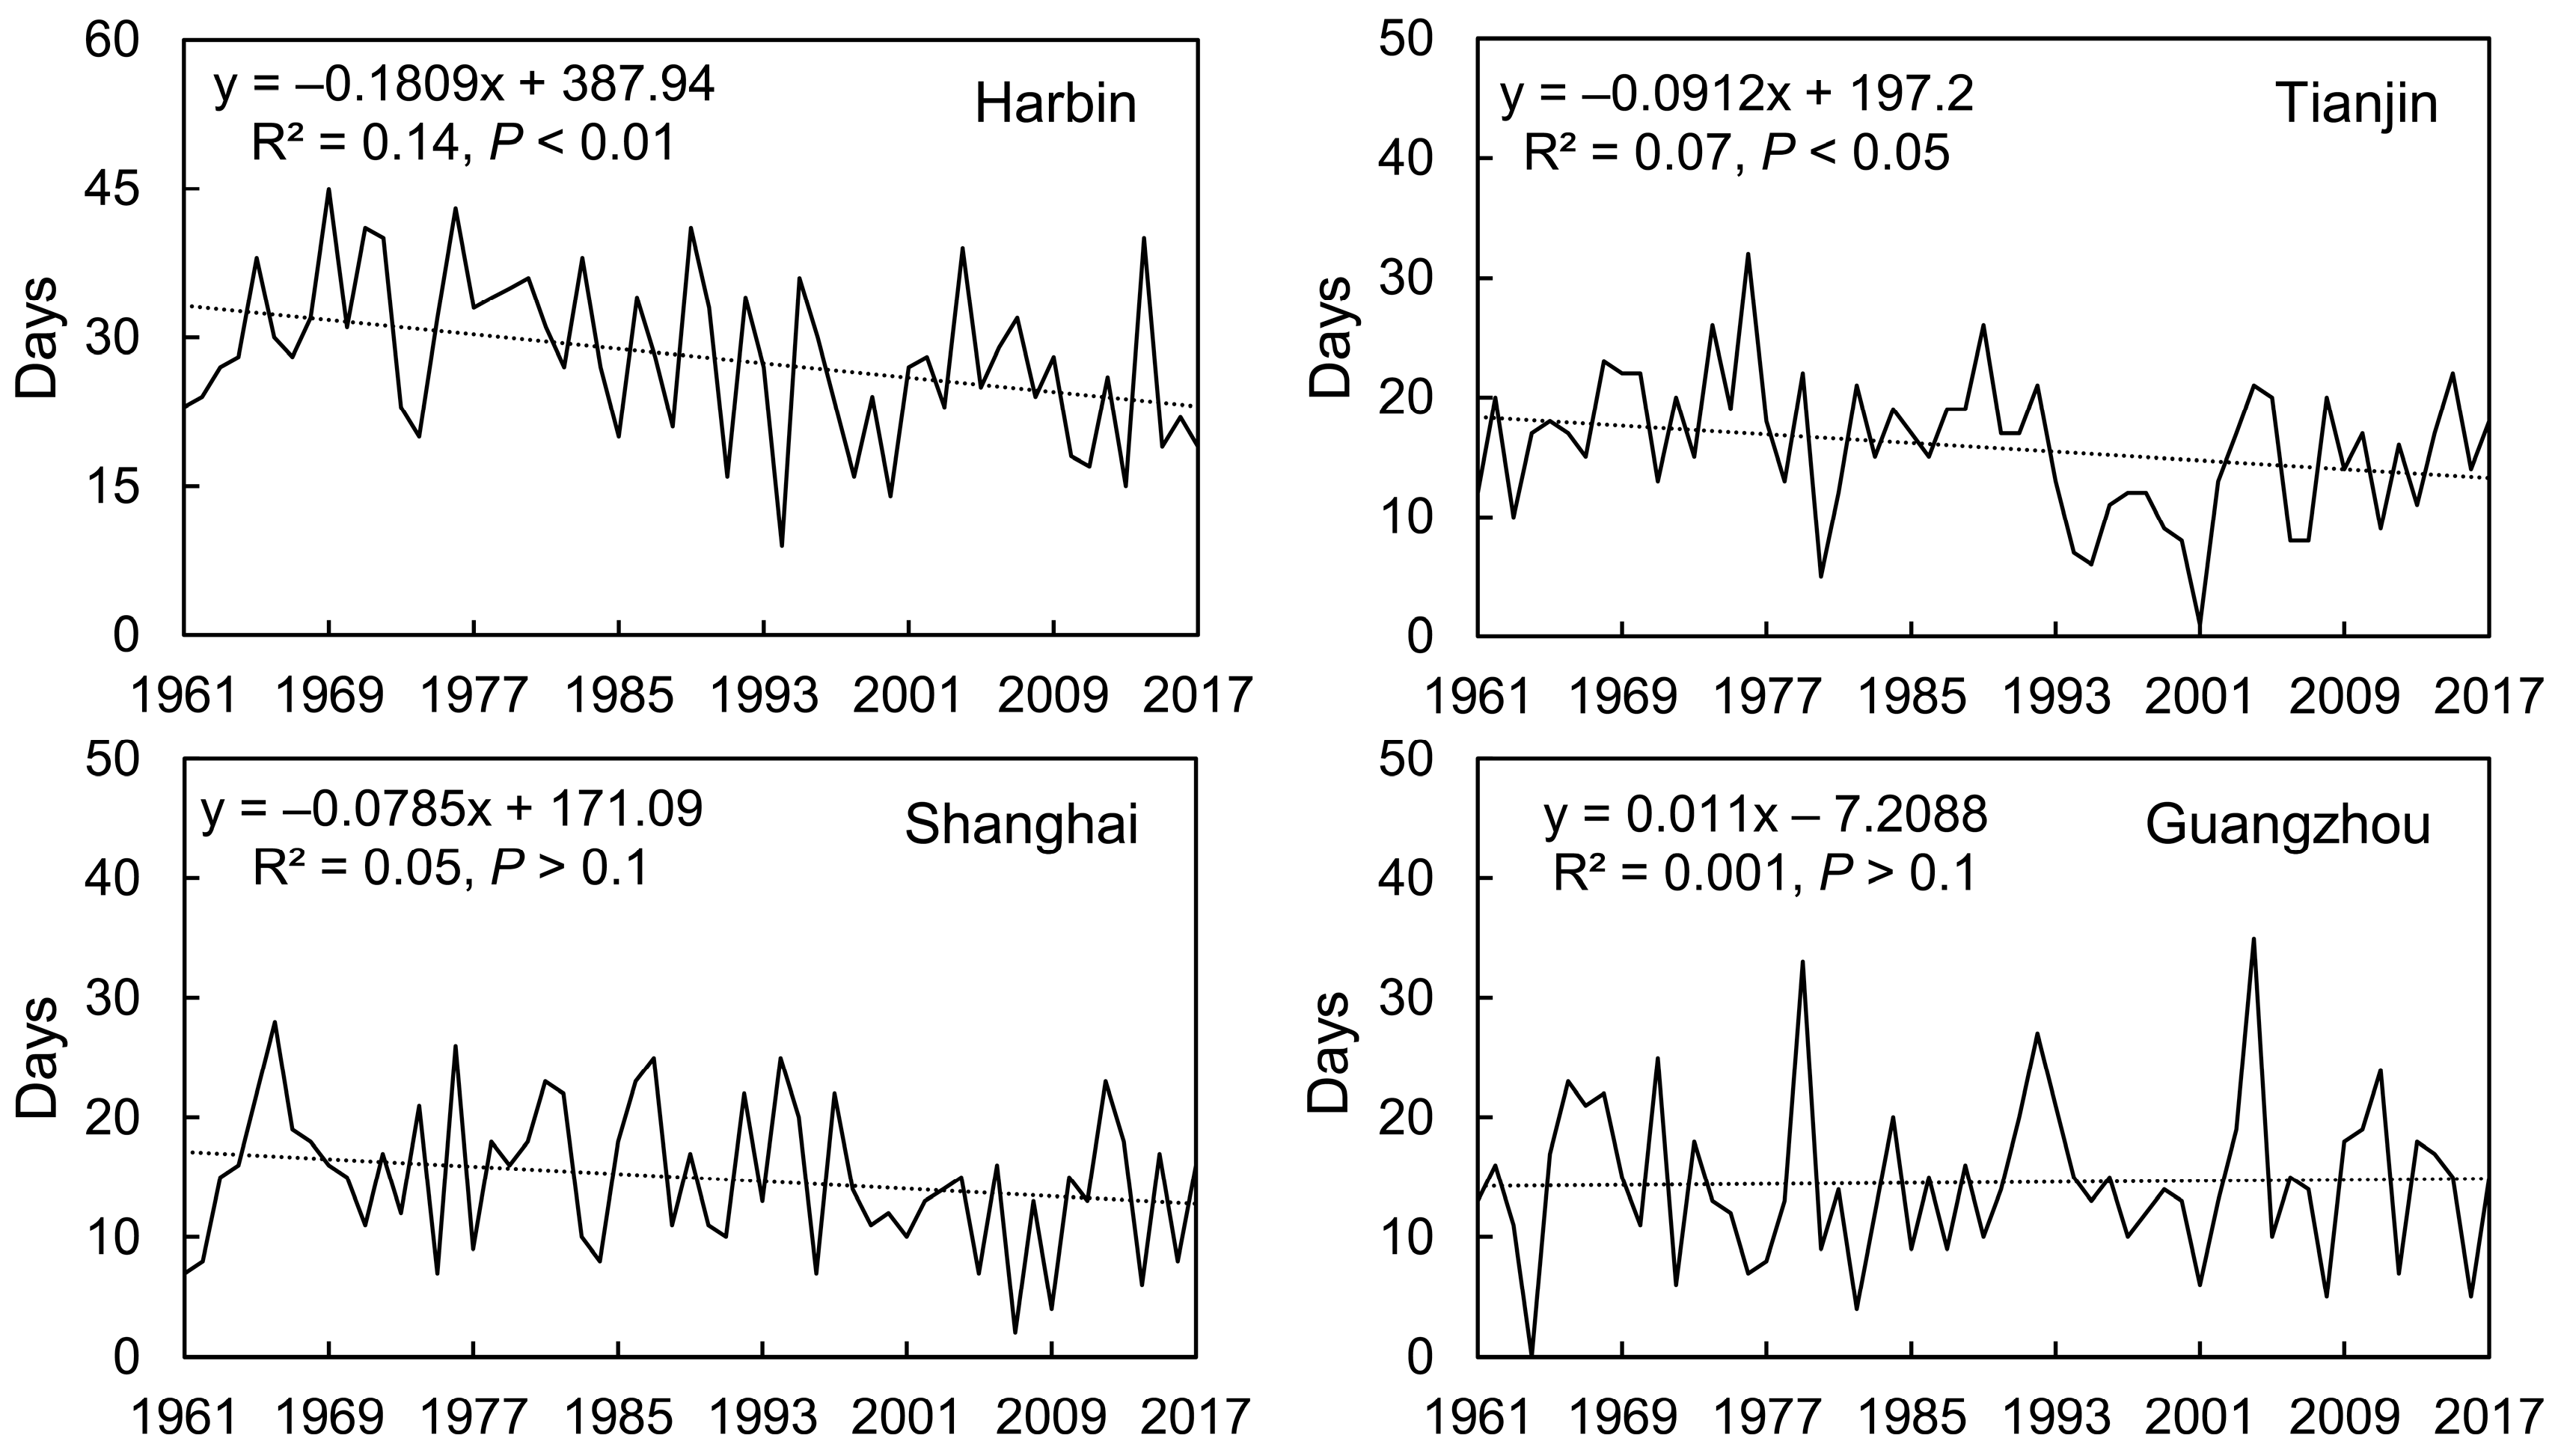
3.2. Temporal Changes in the Past 57 Years

Figure 3 shows the temporal changes in the number of cooling degree days for the different climate zones. For Harbin, Tianjin, and Shanghai in the severe cold, cold and hot summer, and cold winter climate zones, the number of cooling degree days significantly increased during the period of 1961–2017 (P < 0.001), with increasing rates of 1.2 days/10 a, 4.6 days/10 a, and 3.3 days/10 a, respectively. In contrast, the number of cooling degree days in Guangzhou belonging to the hot summer and warm winter climate zone only showed a weakly significant increase (P < 0.05, increasing by 1.9 days/10 a). The increasing trend in the number of cooling degree days is dominantly related to climate warming in these cities because the cooling degree days are determined only by the temperature. The more slowly increasing trend in Guangzhou may reflect the climate warming (0.13 °C/10 a) in the hot summer and warm winter zones being weaker compared with the other climate zones (0.42–0.51 °C/10 a).
There was no apparent change trend in the number of dehumidification degree days for Harbin, which belongs to the severe cold climate zone from 1961 to 2017 (P > 0.1) (Figure 4). For Tianjin, Shanghai, and Guangzhou in the cold, hot summer and cold winter, and hot summer and warm winter climate zones, the number of dehumidification degree days significantly decreased during the past 57 years (P < 0.05) (Figure 4), with decreasing rates of 3.7 days/10 a, 2.5 days/10 a, and 2.0 days/10 a, respectively. The decreasing number of dehumidification degree days in Tianjin, Shanghai, and Guangzhou is, to a large extent, due to the significant decrease in humidity (decreasing 0.9–2.0%/10 a), whereas the humidity of Harbin has a smaller decrease (only 0.4%/10 a).
The number of degree days requiring no cooling and no dehumidification had significant and apparent decreasing trends in Harbin (1.8 days/10 a) and Tianjin (0.9 days/10 a), which belong to the severe cold and cold climate zones, respectively (P < 0.05) (Figure 5). In contrast, no apparent change trend was found in the number of degree days requiring no cooling and no dehumidification in the hot summer and cold winter and hot summer and warm winter climate zones (P > 0.1) (Figure 5). The changes in the number of degree days requiring no cooling and no dehumidification are affected by the combination of temperature and humidity. For example, the significant increase in temperature and weak decrease in humidity in Harbin over the study period led to an apparent decrease in the number of degree days requiring no cooling and no dehumidification. For other cities, the significant increase in temperature and significant decrease in humidity causes a very weak decreasing trend (Tianjin) or no apparent changing trend (Shanghai and Guangzhou) of the degree days requiring no cooling and no dehumidification.

4. Discussion and Conclusions

Assessing the energy consumption or demand of buildings under the conditions of global warming is particularly important for taking measures to cope with climate change or to decrease pollution and greenhouse gas emissions [35]. Many previous studies, based on cooling and heating degree day methods, have revealed the impact of climate change on the energy consumption of building cooling or heating and have reached the conclusion that rising temperatures significantly increase the energy required for space cooling and have largely decreased the energy consumed for heating [9,12,14,16,36,37,38,39]. Consistent with these studies [9,12,16,38], the cooling degree days, assessed only based on temperature in this study, also revealed a gradually increasing trend of cooling energy demand in different climates. The most consistent trends in different continents or countries may be dominantly related to the almost consistent warming trend, although the increasing temperature rates vary in different regions, being more apparent in high-altitude or high-latitude regions [9,38]. The energy consumption or demand estimated by degree days is generally used to improve the energy-efficient design of air-conditioning systems by precisely determining their capacity under the conditions of climate change. When only considering the variations in cooling degree days, the design capacities of air-conditioning systems should be correspondingly enlarged for all cities in all climate zones. In fact, a large gap will exist between the design capacity and the actual demand for the air-conditioning systems.
Some studies have indicated the limitation of cooling degree days based on only temperature in reflecting the energy consumption. For example, appropriate base or reference temperatures that properly reflect the outdoor environment should be used to determine the changes in energy consumption with global warming [10,40,41,42,43,44]. More importantly, the cooling degree days are only calculated as the accumulated degrees of deviation from a predefined base temperature without considering the effect of other climatic variables such as the relative humidity, which will lead to unreliable estimation of the cooling energy consumption or demand [4,14,15,45]. In a study of Deroubaix et al. [15], it is pointed out that further research is needed to establish an explicit inclusion of humidity in the estimation of the future energy demand. Li et al. [2] found that annual building cooling loads based on a simulation tool (Transient System Simulation Program, TRNSYS) did not show consistent increasing trends in different climate zones, with a significant increase in the severe cold climate zone but no significant variation trend in other climate zones. Particularly, the yearly cooling load showed a weak decrease (significant at the 90% level) in the hot summer and warm winter climate zone. These different variation trends for different climate zones under climate warming conditions are dominantly due to the influence of other climatic elements, especially humidity, on the energy consumed for cooling. Therefore, it is necessary to propose reliable indices that can differentiate between cooling and dehumidification energy consumption to improve the energy efficiency of air-conditioning systems.
In this study, cooling and dehumidification degree days were proposed to indicate energy consumption for cooling and dehumidification, respectively. Just as pointed out above, the number of cooling degree days in all the climate zones showed a consistently increasing trend, which may be related to the consistently increasing temperature in these cities belonging to different climate zones (0.13–0.51 °C/10 a) as a result of global warming. This consistent increasing trend indicates the increasing energy consumption for cooling under climate warming conditions. The number of dehumidification degree days accounted for a large part of the total number of days in summer, with proportions of 45%, 28%, 32%, and 19% for the severe cold, cold, hot summer and cold winter, and hot summer and warm winter climate zones, respectively. In days that only require dehumidification, the improvement in the comfort of the indoor environment does not depend on cooling, but dehumidification is actually needed. In recent years, the THIC systems have been used as an efficient way to improve air-conditioning systems [46,47,48]. However, in the process of energy efficiency design or the operation of air-conditioning systems, dehumidification is not fully considered. Conventional single-chilling-source refrigeration system needs low-temperature chillers to handle the latent load (i.e., the load for dehumidification), which results in a lowered efficiency of the air-conditioning system [49]. Even for air-conditioning systems with THIC, the percentage of days requiring dehumidification without cooling is not calculated to improve energy efficiency because dehumidification is generally achieved by reducing the ambient air temperature below its dew point, causing more energy waste. According to the results in the present study, the days with only dehumidification should be fully considered in the capacity design of air-conditioning systems to decrease energy consumption and improve indoor comfort. Different from the consistently increasing trend in the number of cooling degree days, the number of dehumidification degree days has no consistent variation trends for the different climate zones. The number of dehumidification degree days in the severe climate zone increased slightly but decreased significantly in other climate zones. Li et al. [2] found that the cooling loads simulated by TRNSYS in the severe climate zone showed a significant increase, whereas no apparent variations were found in the cooling loads for other climate zones, which was largely caused by the combined effect of temperature and humidity. However, the effects of temperature and humidity were not quantitatively separated in their study [2]. This study reveals that, in the cold, hot summer and cold winter, and hot summer and warm winter climate zones, 19–32% of days in summer only need dehumidification and the number of dehumidification degree days show decreasing rates of 3.7, 2.5, and 2.0 days/10 a. The smaller number of dehumidification degree days is dominantly due to the significant decrease in humidity (decreasing 0.9–2.0%/10 a). This indicates that not only should the 19–32% of days requiring dehumidification in the summer be accounted for in the capacity of air-conditioning systems under the hot and humid climate conditions in summer, but the temporal variations in dehumidification degree days should also be considered. Compared with other climate zones, dehumidification may be more important in the design of air-conditioning systems in the severe cold climate zone because the number of dehumidification degree days is apparently greater than the number of cooling degree days (47% vs. 8%). However, the temporal variations in the number of dehumidification degree days is less important due to the lack of an apparent variation trend in the past 57 years. The results in this study indicate that the design capacity of an air-conditioning system should be adjusted according to the percentage of dehumidification degree days in a given climate zone and its different variation trends in different climate zones, especially for air-conditioning systems with THIC.
From severe to hot summer and warm winter climate zones, the percentage of the days requiring no cooling and no dehumidification in summer was in the range of 7.9%–44.9%. These days can be considered as comfortable days without the need for cooling or dehumidification, resulting in maximum energy saving between 8% and 45% if the proportion of comfortable days is fully considered in the design and operation of air-conditioning systems. In addition, the severe cold and cold climate zones have a significant but not strong decreasing trend in the comfortable days during the period of 1961–2017, which partly affects energy savings. In contrast, the number of comfortable days in the hot summer and cold winter and hot summer and warm winter climate zones have no apparent variation trends. These different variation trends in the number of comfortable degree days should be used in the design of air-conditioning systems.
It is necessary to note that, although this study reveals the importance of dehumidification in the design of air-conditioning systems in summer to improve building energy efficiency and indoor comfort, the results were only from meteorological stations in four cities belonging to the severe cold, cold, hot summer and cold winter, and hot summer and warm winter climate zones. The limited stations and cities may result in uncertainty in the data and the uneven distribution of meteorological stations may cause some uncertainty in the results [50,51]. Future studies should be carried out in more cities and stations, especially in the central and western regions of China, to make the conclusions more reliable.
In summary, in order to quantitatively separate the effects of temperature and humidity on the energy consumption of air-conditioning systems with climate change, the temporal variations in the number of cooling and dehumidification degree days were determined in the major climate zones of China. The results demonstrated that, consistent with previous studies, the number of cooling degree days showed a significant increase in all the selected cities under the conditions of global warming. In contrast, the number of dehumidification degree days accounts for 19%–45% of the total days in summer, showing a significant decrease in the cold, hot summer and cold winter, and hot summer and warm winter climate zones. The extreme cold climate showed no apparent variation trend with climate change. On these dehumidification days, energy consumption is only used for dehumidification without cooling, which may be helpful for improving energy efficiency. Therefore, the high percentage of and temporal variations in the number of dehumidification degree days should be fully considered in the capacity design of air-conditioning systems, especially those with THIC. Additionally, more attention should be paid to the days requiring no cooling and no dehumidification in different climate zones because they represent 8% to 45% maximum energy-saving potential according to climate zones. The assessment of cooling and dehumidification degree days with climate change should be conducted to reasonably design the capacity of air-conditioning systems and then to efficiently improve energy efficiency and indoor comfort.

Author Contributions

Conceptualization, J.C. and M.L.; methodology, J.S.; software, Z.Z.; validation, J.C., M.L. and Z.Z.; formal analysis, R.Z.; investigation, M.W.; resources, J.S.; data curation, J.C.; writing—original draft, J.C.; writing—review and editing, M.L.; visualization, Z.Z.; supervision, J.S.; project administration, J.S.; funding acquisition, M.L. All authors have read and agreed to the published version of the manuscript.

Funding

This work was supported by the National Natural Science Foundation of China (42105174) and the Key Innovation Team of China Meteorological Administration “Climate Change Detection and Response” (CMA2022ZD03).

Data Availability Statement

Data sharing is not applicable to this article as no datasets were generated or analyzed during the current study.

Conflicts of Interest

The authors have no relevant financial or non-financial interest to disclose.

References

  1. IEA (International Energy Agency). Global Status Report for Buildings and Construction: Towards a Zero-Emissions, Efficient and Resilient Buildings and Construction Sector; UN Environment and International Energy Agency: Paris, France, 2019. [Google Scholar]
  2. Li, M.C.; Cao, J.F.; Xiong, M.M.; Li, J.; Feng, X.M.; Meng, F.C. Different responses of cooling energy consumption in office buildings to climatic change in major climate zones of China. Energy Build. 2018, 173, 38–44. [Google Scholar] [CrossRef]
  3. IPCC. Summary for policymakers. In Climate Change 2023: The Physical Science Basis. Contribution of Working Group I to the Sixth Assessment Report of the Intergovernmental Panel on Climate Change; Masson-Delmotte, V., Zhai, P., Pirani, A., Connors, S.L., Péan, C., Berger, S., Berger, S., Caud, N., Chen, Y., Goldfarb, L., et al., Eds.; Cambridge University Press: Cambridge, UK, 2023; pp. 3–32. [Google Scholar]
  4. Wang, H.J.; Chen, Q.Y. Impact of climate change heating and cooling energy use in buildings in the United States. Energy Build. 2014, 82, 428–436. [Google Scholar] [CrossRef]
  5. Li, M.C.; Shi, J.; Cao, J.F.; Fang, X.Y.; Wang, M.; Wang, X. Climate change impacts on extreme energy consumption of office buildings in different climate zones of China. Theor. Appl. Climatol. 2020, 140, 1291–1298. [Google Scholar] [CrossRef]
  6. Ma, Y.C.X.; Yu, C. Impact of meteorological factors on high-rise office building energy consumption in Hong Kong: From a spatiotemporal perspective. Energy Build. 2020, 228, 110468. [Google Scholar] [CrossRef]
  7. Jafarpur, P.; Berardi, U. Effects of climate changes on building energy demand and thermal comfort in Canadian office buildings adopting different temperature setpoints. J. Build. Eng. 2021, 42, 102725. [Google Scholar] [CrossRef]
  8. Bell, N.O.; Bilbao, J.I.; Kay, M.; Sprol, A.B. Future climate scenarios and their impact on heating, ventilation and air-conditioning system design and performance for commercial buildings for 2050. Renew. Sustain. Energy Rev. 2022, 162, 112363. [Google Scholar] [CrossRef]
  9. Spinoni, J.; Vogt, J.V.; Barbosa, P.; Bigano, A.; Füssel, H.M. Changes of heating and cooling degree-days in Europe from 1981 to 2100. Int. J. Climatol. 2018, 38, e191–e208. [Google Scholar] [CrossRef]
  10. Bhatnagar, M.; Mathur, J.; Garg, V. Determining base temperature for heating and cooling degree-days for India. J. Build. Eng. 2018, 18, 270–280. [Google Scholar] [CrossRef]
  11. Morakinyo, T.E.; Ren, C.; Shi, Y.; Lau, K.K.L.; Tong, H.W.; Choy, C.W.; Ng, E. Estimates of the Impact of Extreme Heat Events on Cooling Energy Demand in Hong Kong. Renew. Energy 2019, 107, 576–589. [Google Scholar] [CrossRef]
  12. Shi, Y.; Han, Z.Y.; Xu, Y.; Xiao, C. Impacts of climate change on heating and cooling degree-hours over China. Int. J. Climatol. 2021, 41, 1571–1583. [Google Scholar] [CrossRef]
  13. Larsen, M.A.D.; Petrovic, S.; Radoszyski, A.M.; McKenna, R.; Balyk, O. Climate change impacts on trends and extremes in future heating and cooling demands over Europe. Energy Build. 2020, 226, 110397. [Google Scholar] [CrossRef]
  14. Ukey, R.; Rai, A.C. Impact of global warming on heating and cooling degree days in major Indian cities. Energy Build. 2021, 244, 111050. [Google Scholar] [CrossRef]
  15. Deroubaix, A.; Labuhn, I.; Camredon, M.; Gaubert, B.; Monerie, P.A.; Popp, M.; Ramarohetra, J.; Ruprich-Robert, Y.; Silvers, L.G.; Siour, G. Large uncertainties in trends of energy demand for heating and cooling under climate change. Nat. Commun. 2021, 12, 5197. [Google Scholar] [CrossRef] [PubMed]
  16. Rosa, M.D.; Bianco, V.; Scarpa, F.; Tagliafico, L.A. Historical trends and current state of heating and cooling degree days in Italy. Energy Convers. Manag. 2015, 90, 323–335. [Google Scholar] [CrossRef]
  17. Cao, J.F.; Li, M.C.; Wang, M.; Xiong, M.M.; Meng, F.C. Effect of climate change on outdoor meteorological parameters for building energy-saving design in the different climate zones of China. Energy Build. 2017, 146, 65–72. [Google Scholar] [CrossRef]
  18. Meng, F.C.; Li, M.C.; Cao, J.F.; Li, J.; Xiong, M.M.; Feng, X.M.; Ren, G.Y. The effects of climate change on heating energy consumption of office buildings in different climate zones in China. Theor. Appl. Climatol. 2018, 133, 521–530. [Google Scholar] [CrossRef]
  19. Keniar, K.; Ghali, K.; Ghaddar, N. Study of solar regenerated membrane desiccant system to control humidity and decrease energy consumption in office spaces. Appl. Energy 2015, 138, 121–132. [Google Scholar] [CrossRef]
  20. Mirrahimi, S.; Mohamed, M.F.; Haw, L.C.; Ibrahim, N.L.N.; Yusoff, W.F.M.; Aflaki, A. The effect of building envelope on the thermal comfort and energy saving for high-rise buildings in hot-humid climate. Renew. Sustain. Energy Rev. 2016, 53, 1508–1519. [Google Scholar] [CrossRef]
  21. Mba, L.; Meukam, P.; Kemajou, A. Application of artificial neural network for predicting hourly indoor air temperature and relative humidity in modern building in humid region. Energy Build. 2016, 121, 32–42. [Google Scholar] [CrossRef]
  22. Shin, M.; Do, S.L. Prediction of cooling energy use in building using an enthalpy-based cooling degree days method in a hot and humid climate. Energy Build. 2016, 110, 57–70. [Google Scholar] [CrossRef]
  23. Ge, H.; Zeng, G.; Iyakaremye, V.; Yang, X.; Wang, Z. Comparison of atmospheric circulation anomalies between dry and wet extreme high-temperature days in the middle and lower reaches of the Yellow river. Atmosphere 2021, 12, 1265. [Google Scholar] [CrossRef]
  24. Russo, S.; Sillmann, J.; Sterl, A. Humid heat waves at different warming levels. Sci. Rep. 2017, 7, 7477. [Google Scholar] [CrossRef] [PubMed]
  25. Zhang, Y.; Chen, C.; Niu, Y.; Shen, L.; Wang, W. The severity of heat and cold waves amplified by high relative humidity in humid subtropical basins: A case study in the Gan River Basin, China. Nat. Hazards 2023, 115, 865–898. [Google Scholar] [CrossRef]
  26. Fischer, E.M.; Knutti, R. Robust projections of combined humidity and temperature extremes. Nat. Clim. Change 2013, 3, 126–130. [Google Scholar] [CrossRef]
  27. Zhang, T.; Liu, X.H. Performance comparison of temperature and humidity independent control air-conditioning system with conventional system. Build. Serv. Eng. Res. Technol. 2016, 37, 479–488. [Google Scholar] [CrossRef]
  28. Cao, J.F.; Li, M.C.; Wang, M.; Li, B.J. Impacts of temperature and humidity changes on air-conditioning design load under the climate change conditions in different climate zones of China. Meteorol. Appl. 2021, 28, e2026. [Google Scholar] [CrossRef]
  29. Fang, A.; Chen, Y.; Wu, L. Transient simulation of coupled heat and moisture transfer through multilayer walls exposed to future climate in the hot and humid southern China area. Sustain. Cities Soc. 2020, 52, 101812. [Google Scholar] [CrossRef]
  30. Wang, X.L. Accounting for autocorrelation in detecting mean shifts in climate data series using the penalized maximal t or F test. J. Appl. Meteorol. Climatol. 2008, 47, 2423–2444. [Google Scholar] [CrossRef]
  31. Wang, X.L.; Wen, Q.Z.; Wu, Y.H. Penalized maximal t test for detecting undocumented mean change in climate data series. J. Appl. Meteorol. Climatol. 2007, 46, 916–931. [Google Scholar] [CrossRef]
  32. Wang, X. Penalized maximal F-test for detecting undocumented mean-shifts without trend-change. J. Atmos. Ocean. Technol. 2008, 25, 368–384. [Google Scholar] [CrossRef]
  33. DCHVAC. Design Code for Heating Ventilation and Air Conditioning of Civil of Building GB 20736-2012; Ministry of Housing and Urban Rural Development of the People’s Republic of China: Beijing, China, 2012. (In Chinese)
  34. Zeng, X.C.; Xing, Y.Y.; Lu, L.; Wang, J.K.; Li, J.H. Design method of temperature and humidity independent processed air conditioning system based on dehumidification moisture days. J. HVAC 2016, 46, 38–41, (In Chinese with English Abstract). [Google Scholar]
  35. Yau, Y.H.; Hasbi, S. A review of climate change impacts on commercial buildings and their technical services in the tropics. Renew. Sustain. Energy Rev. 2013, 18, 430–441. [Google Scholar] [CrossRef]
  36. Li, D.H.W.; Yang, L.; Lam, J.C. Impact of climate change on energy use in the built environment in different climate zones-A review. Energy 2012, 42, 103–112. [Google Scholar] [CrossRef]
  37. Ahmed, T.; Muttaqi, K.M.; Agalgaonkar, A.P. Climate change impacts on electricity demand in the State of New South Wales, Australia. Appl. Energy 2012, 98, 376–383. [Google Scholar] [CrossRef]
  38. You, Q.L.; Fraedrich, K.; Sielmann, F.; Min, J.Z.; Kang, S.C.; Ji, Z.M.; Zhu, X.H.; Ren, G.Y. Present and projected degree days in China from observation, reanalysis and simulations. Clim. Dyn. 2014, 43, 1449–1462. [Google Scholar] [CrossRef]
  39. Ramon, D.; Allacker, K.; Troyer, F.D.; Wouters, H.; van Lipzig, N.P.M. Future heating and cooling degree days for Belgium under a high-end climate change scenario. Energy Build. 2020, 216, 109935. [Google Scholar] [CrossRef]
  40. McGilligan, C.; Natarajan, S.; Nikolopoulou, M. Adaptive comfort degree-days: A metric to compare adaptive comfort standards and estimate changes in energy consumption for future UK climates. Energy Build. 2011, 3, 2767–2778. [Google Scholar] [CrossRef]
  41. Indraganti, M.; Boussaa, D. A method to estimate the heating and cooling degree-days for different climatic zones of Saudi Arabia. Build. Serv. Eng. Res. Technol. 2017, 38, 327–350. [Google Scholar] [CrossRef]
  42. Roshan, G.R.; Ghanghermeh, A.A.; Attia, S. Determining new threshold temperatures for cooling and heating degree day index of different climatic zones of Iran. Renew. Energy 2017, 101, 155–167. [Google Scholar] [CrossRef]
  43. Harvey, L.D.D. Using modified multiple heating-degree-day (HDD) and cooling-degree-day (CDD) indices to estimate building heating and cooling loads. Energy Build. 2020, 229, 110475. [Google Scholar] [CrossRef]
  44. Abebe, S.; Assefa, T. Determining and mapping the base temperature for heating and cooling degree days for Ethiopia. Energy Effic. 2022, 15, 62. [Google Scholar] [CrossRef]
  45. Li, M.C.; Guo, J.; Shi, J.; Xiong, M.M. Applicability evaluation of cooling/heating degree-days in analyzing building energy consumption changes. Clim. Change Res. 2013, 9, 43–48, (In Chinese with English Abstract). [Google Scholar]
  46. Guan, B.W.; Liu, X.H.; Zhang, Q.L.; Zhang, T. Performance of a temperature and humidity independent control air-conditioning system based on liquid desiccant for industrial environments. Energy Build. 2020, 214, 109869. [Google Scholar] [CrossRef]
  47. Liu, J.; Zhang, X.S.; Lin, Z. Exergy and energy analysis of a novel dual-chilling-source refrigerating system applied to temperature and humidity independent control. Energy Convers. Manag. 2019, 197, 111875. [Google Scholar] [CrossRef]
  48. Meng, N.; Li, T.L.; Wang, J.Q.; Jia, Y.A.; Liu, Q.H.; Qin, H.S. Synergetic cascade-evaporation mechanism of a novel building distributed energy supply system with cogeneration and temperature and humidity independent control characteristics. Energy Convers. Manag. 2020, 209, 112620. [Google Scholar] [CrossRef]
  49. Liu, J.; She, X.H.; Zhang, X.S.; Cong, L.; Man, L.; Lindeman, B.; Lin, T. Experimental and theoretical study on a novel double evaporating temperature chiller applied in THICS using R32/R236fa. Int. J. Refrig. 2017, 75, 343–351. [Google Scholar] [CrossRef]
  50. Shen, X.J.; Liu, B.H.; Mark, H.; Wang, L.; Jiang, M.; Lu, X.G. Vegetation greening, extended growing seasons, and temperature feedbacks in warming temperate grasslands of China. J. Clim. 2022, 35, 5103–5117. [Google Scholar] [CrossRef]
  51. Zhou, D.; Sun, S.; Li, Y.; Zhang, L.; Huang, L. A multi-perspective study of atmospheric urban heat island effect in China based on national meteorological observations: Facts and uncertainties. Sci. Total Environ. 2023, 854, 158638. [Google Scholar] [CrossRef]
Figure 1. The major climate zones and geographical distribution of the selected representing cities.
Atmosphere 14 00752 g001
Figure 2. Percentage of the degree days of cooling, dehumidification, and no cooling and no dehumidification of the four selected cities.
Atmosphere 14 00752 g002
Figure 3. Changes in cooling degree days during the period of 1961–2017 for the four selected cities.
Atmosphere 14 00752 g003
Figure 4. Changes in dehumidification degree days during the period of 1961–2017 for the four selected cities.
Atmosphere 14 00752 g004
Figure 5. Changes in degree days with no cooling and no dehumidification during the period of 1961–2017 for the four selected cities.
Atmosphere 14 00752 g005
Disclaimer/Publisher’s Note: The statements, opinions and data contained in all publications are solely those of the individual author(s) and contributor(s) and not of MDPI and/or the editor(s). MDPI and/or the editor(s) disclaim responsibility for any injury to people or property resulting from any ideas, methods, instructions or products referred to in the content.

