1. Introduction
During the months of June and July every year, a southwesterly monsoonal airstream brings a substantial amount of moisture into Eastern China, producing a sizeable portion of annual rainfalls, known as the Meiyu season, over the Yangtze–Huaihe River Basin (YHRB) [
1,
2,
3,
4,
5]. Most rainfalls are generated along an elongated rainbelt hundreds of kilometers in length, which is referred to as the Meiyu front and is often defined by a high horizontal equivalent potential temperature (θe) gradient [
4,
5]. In some years, in the YHRB, Meiyu rainfalls accounts for more than half of the annual precipitation [
6], and floods triggered by the concentrated regional rainstorms cause major disasters [
7]. Given the typical nature of heavy convective rainfalls, flash floods, landslides, and urban inundation are often related to short-duration rainfalls, such as hourly and sub-hourly rainfalls [
8,
9,
10]. Thus, the temporal and spatial features of hourly rainfalls during the rainy season and the associated climate trends have been studied in Eastern China, covering the YHRB [
7,
11,
12,
13]; however, rainfall features on the sub-hourly scale are seldom studied, and the contribution from rainfalls on the hourly and sub-hourly scale compared with other scales is not quantitatively presented, especially during the abnormal Meiyu season.
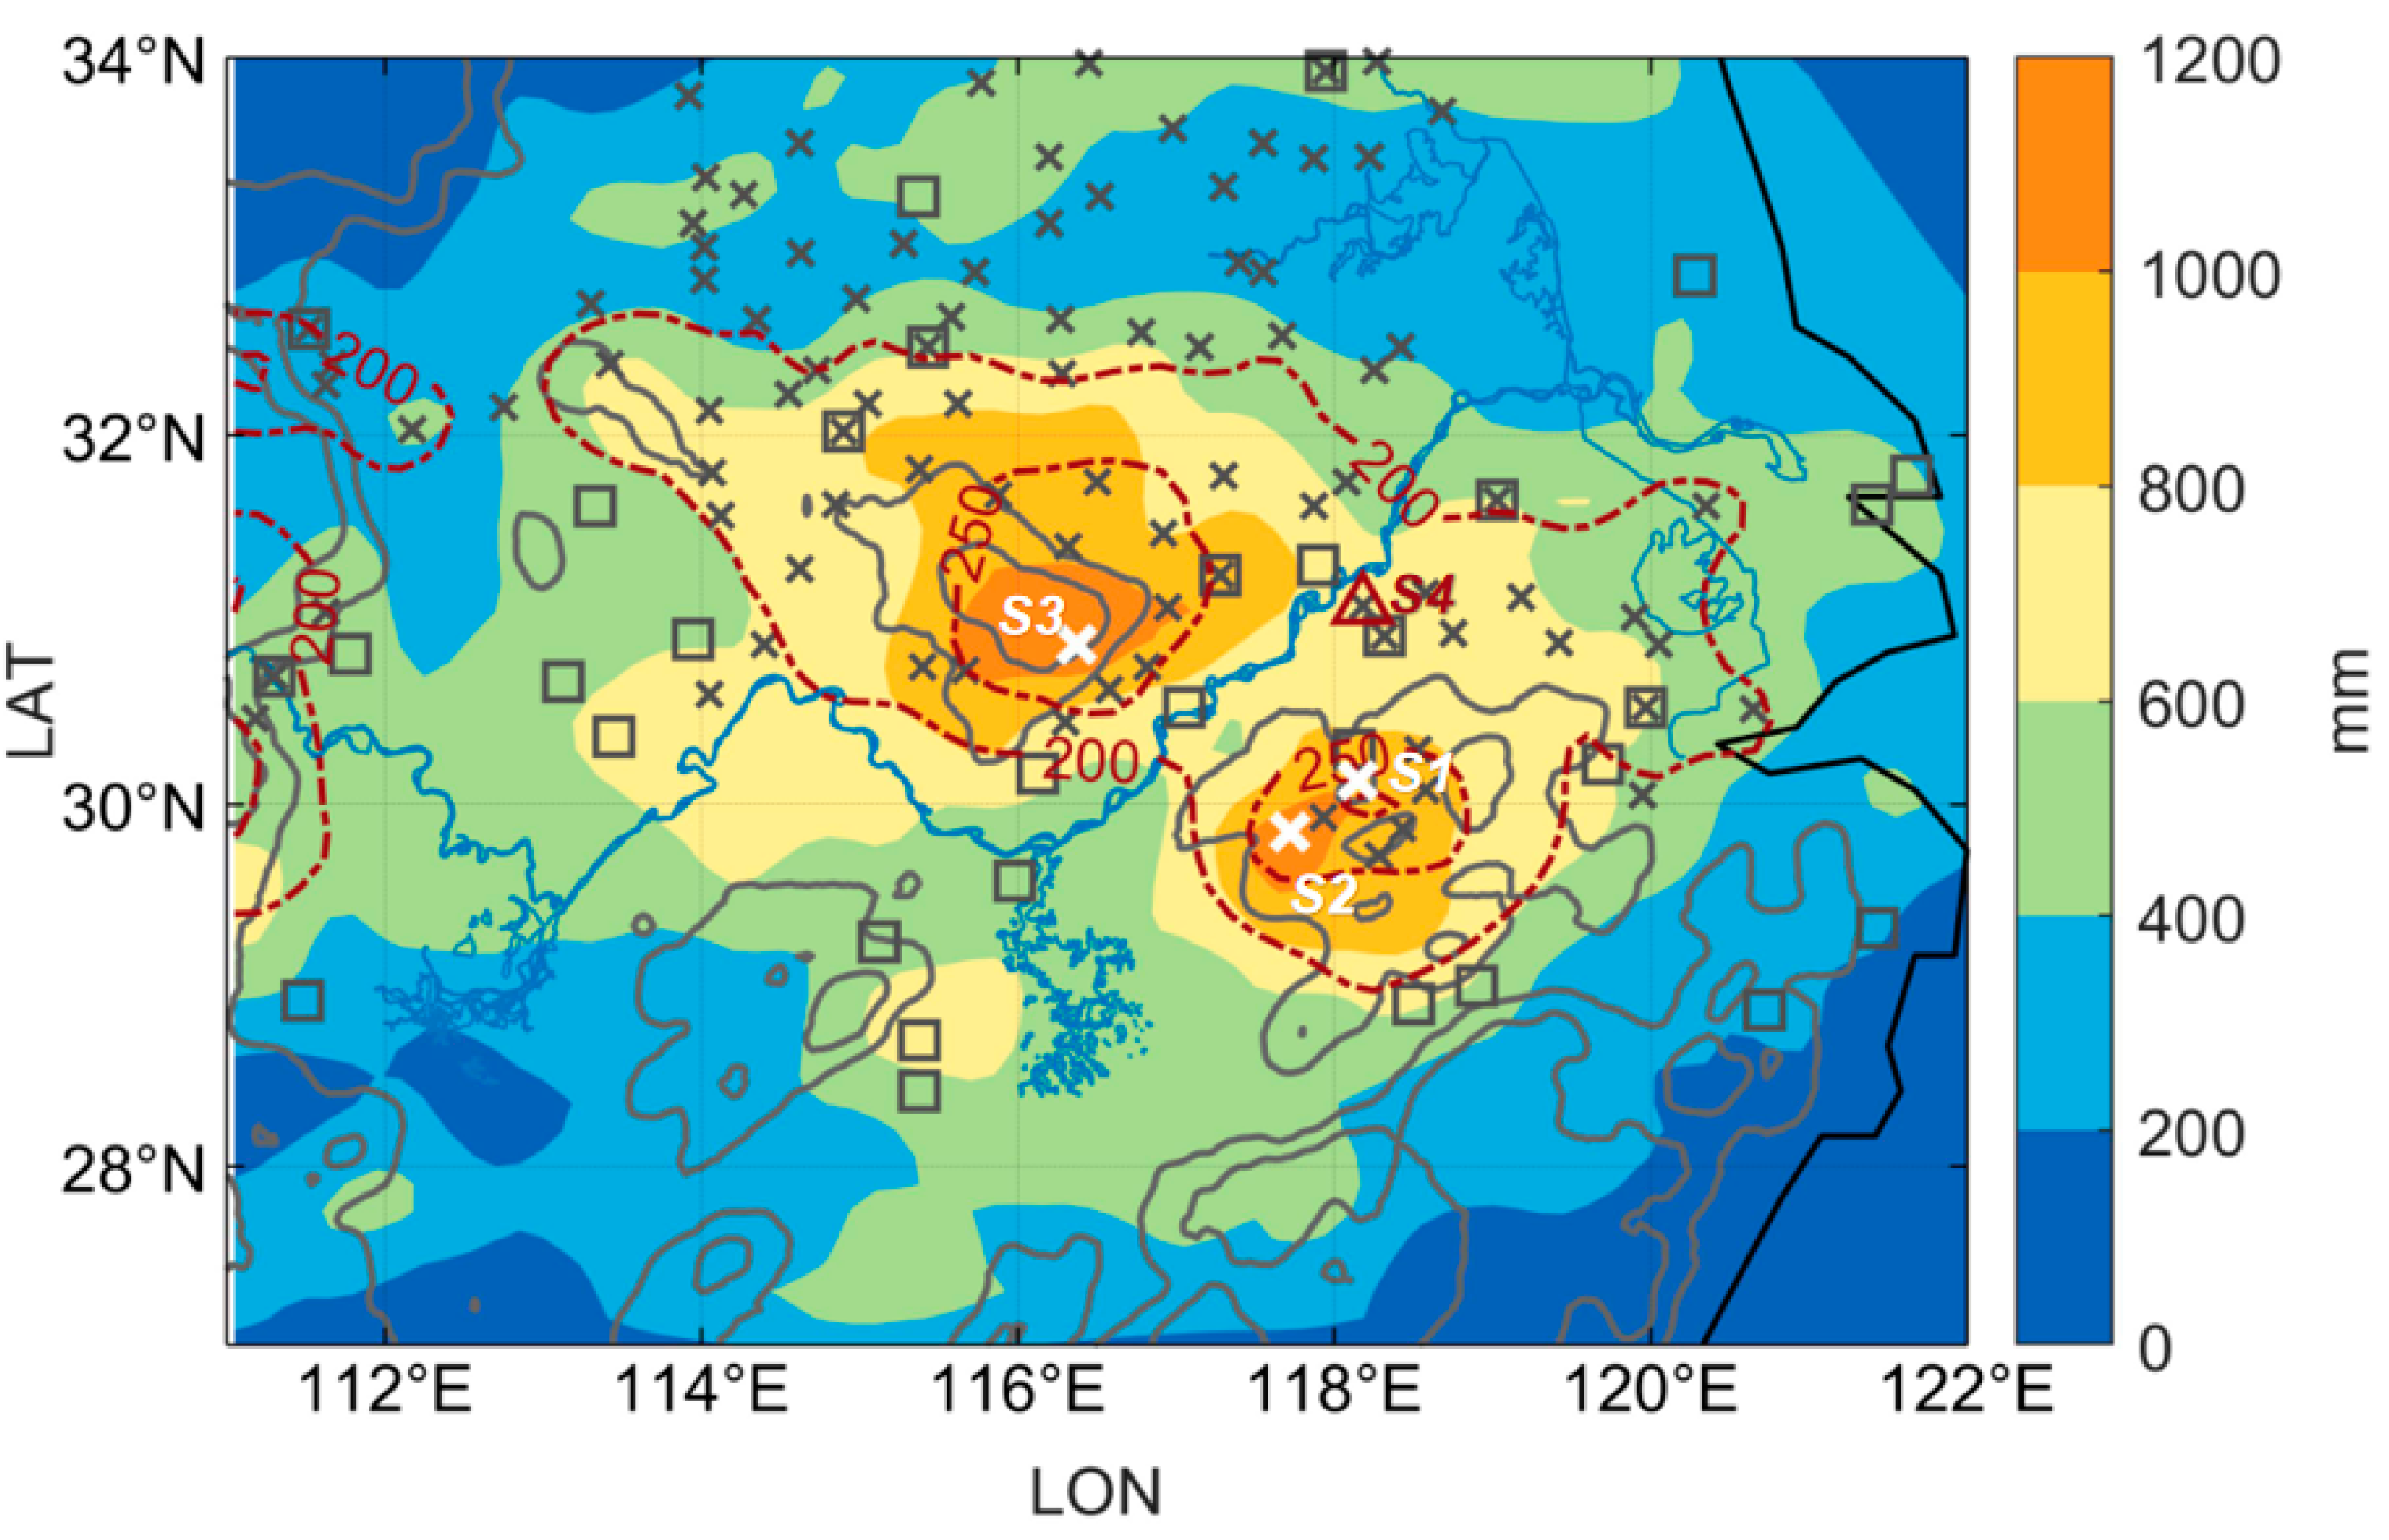
The most recent abnormal Meiyu season was that of 2020, during which the YHRB received the heaviest rainfall since 1961 [
14,
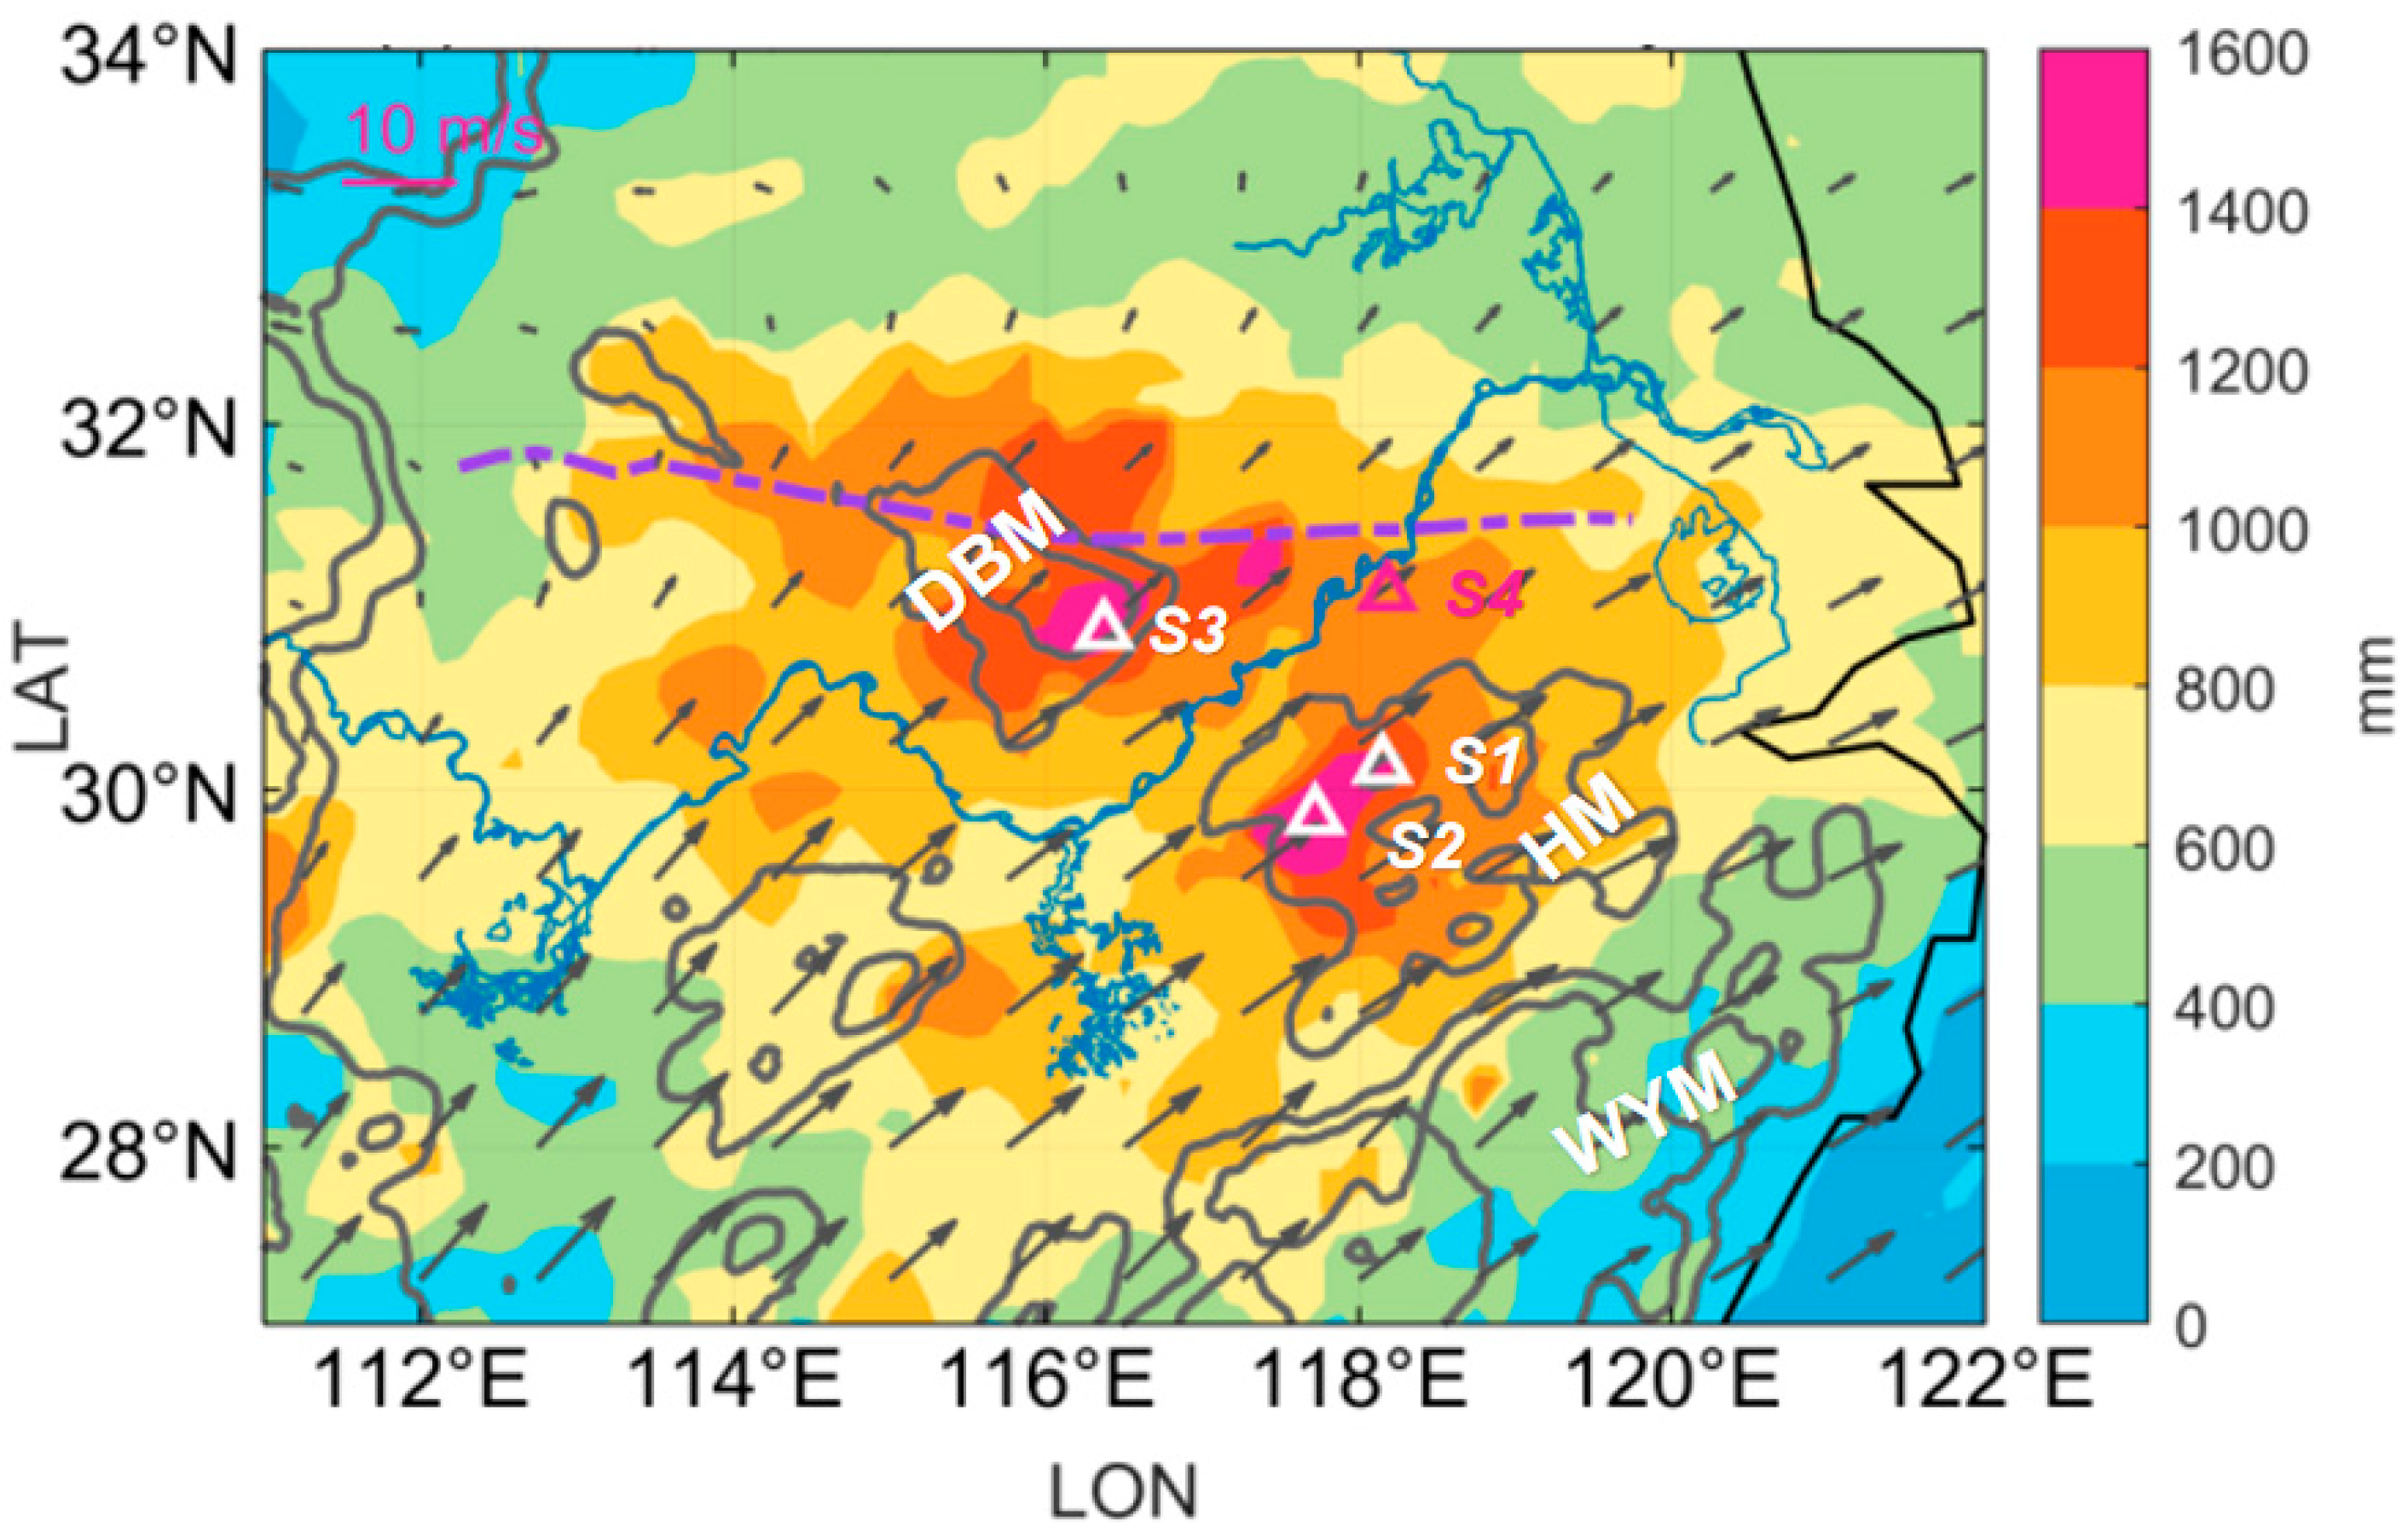
15]. As many as 124 rain gauges within the YHRB recorded an accumulated rainfall of over 800 mm, with the maximum accumulated rainfall being 1719.5 mm in the Huang mountains (S1 at
Figure 1) and the maximum hourly rate being 88.7 mm at the lower reach of the Yangtze River (S4 in
Figure 1). The 2020 Meiyu season affected 63.46 million people over the YHRB and resulted in direct economic losses of over CNY 178.96 billion (
http://www.gov.cn/xinwen/2020-08/13/content_5534534.htm, accessed on 1 September 2020).
Numerous studies have been conducted on the generation of this record-breaking and high-social-impact Meiyu season. The results show that the interdecadal [
16] and interannual variations in Sea Surface Temperature (SST) in the Indian, Pacific, and Atlantic oceans [
14,
17,
18] facilitated the development of anomalous large-scale circulations, such as an extremely strong Western Pacific Subtropical High (WPSH), excessive atmospheric blocking over East Siberia, an upper-level westerly jet, and a low-level southwesterly jet [
15,
19,
20]. The anomalously strong WPSH and the southwesterly flows to its west advected warm and moist air from the Arabian Sea, the Bay of Bengal, and the South China Sea to the YHRB [
15,
19,
21,
22]. Moreover, quasi-stationary blocking highs promoted active cold air intrusion to the south. Thus, mass convergence and uplifting in the lower troposphere was increased over the YHRB [
15,
19,
20]. In addition, upper-level divergence and ascending motions over the YHRB were enhanced by a periodically strengthened upper-level westerly jet [
15]. As a result, stagnant rainbelts with heavy precipitation could be maintained over the YHRB during the 2020 Meiyu season.
In addition to the total rainfall anomaly, rainfall features on the synoptic and diurnal scales during the 2020 Meiyu season have also been investigated, together with the associated circulation patterns. The synoptic variations were related to a mid-latitude trough, eastward-propagated low-level cyclonic vortices, and a WPSH that shifted northwest–southeast [
23,
24]. Diurnal variation in the low-level southerlies favored nocturnal low-level jets (NLLJs) and the development of nocturnal rainbelts [
25]. Those superimposed synoptic and diurnal variations led to the temporal and spatial heterogeneity of rainfalls, so that the 2020 Meiyu rainfall included several intense multi-day rainfall episodes [
15,
24,
25,
26] and presented localized features over the YHRB (
Figure 1).
However, little work has been done on the sub-hourly and hourly characteristics of the 2020 Meiyu rainfall events and their associated large-scale circulations. In addition, the high seasonal rainfall amounts in the 2020 Meiyu season could be partly attributed to heavy rainfall rates and partly to the unusually long duration of the 2020 Meiyu season, (62 days) (
Table 1). It is unclear if intensity or frequency potentially contributed to the 2020 Meiyu rainfall anomaly. More work is needed to examine the sub-hourly and hourly rainfall features and the favorable larger-scale circulations that could account for the accumulated heavy rainfall.
To this end, the objectives of this study were to (i) explore the hourly and sub-hourly characteristics of the 2020 Meiyu rainfalls; (ii) investigate the types of larger-scale circulations that led to the distinct sub-hourly and hourly rainfall features; and (iii) compare the hourly rainfall features of the 2020 Meiyu season with other years. The next section describes the data and methodology used in this study.
Section 3 presents the sub-hourly and hourly characteristics of the 2020 Meiyu rainfall events.
Section 4 shows the representative circulations during the 2020 Meiyu season and hourly variations in circulations.
Section 5 explores the features of sub-hourly and hourly rainfalls under different synoptic patterns during the 2020 Meiyu season. The features of the hourly 2020 Meiyu rainfalls are compared with historical data in
Section 6. A summary and concluding remarks are given in the final section.
4. Regional Flow Regimes and Hourly Rainfall Features
The rainfall episodes with different temporal features, as shown in
Figure 3a, could form sequences of organized convection, such as squall lines, meso-scale convective systems, and meso-scale convective complexes, subject to the influence of their synoptic environments [
42,
43]. Under weak-forcing conditions, the cloud/rainfall episodes could occur in short durations [
44,
45]. During the 2020 Meiyu season, synoptic disturbances included a mid-latitude trough with active cold air intrusions and generated southwest vortices (SWVs) [
15,
23], which are conducive to record rainfalls. To establish how synoptic patterns affect the spatial and temporal features of sub-hourly and hourly Meiyu rainfalls, first, the hourly circulation patterns needed to be objectively grouped into major types for the Meiyu seasons using the PCT method.
4.1. Clustered Flow Regimes
The hourly synoptic patterns in Central and East China during the Meiyu season without typhoon days from 2018–2021 were objectively classified into four types using the PCT method, with a cumulative variance of 95% calculated by the principal component analysis. The frequency of the four patterns in 2020 was 56.3%, 30.6%, 7.5%, and 4.5%, respectively. The composite patterns of the clustered flow regimes and the accumulated rainfall under each during June–July 2020 are presented in
Figure 4. The accumulated rainfall under P1 was widely distributed, with a maximum center over 1000 mm around the Dabie mountains and the surrounding areas, near the average maximum equatorial gradient of the equivalent potential temperature around 30–32° N. The WPSH 5880 m isoline extended northward to 29° N. Along the west rim of the WPSH, low-level southerlies crossing the horizontal isothermal line brought a substantial amount of moisture into the YHRB, which is the major energy source in the form of latent heat for the development and maintenance of the disturbances in the Meiyu rainbelt [
46,
47,
48]. The YHRB was generally under the warm sector, with relatively uniform dynamic and thermal-dynamic conditions with few synoptic disturbances from the mid-latitudes and southwest.
In contrast to the weak-forcing environment of P1, the synoptic patterns of P2 (
Figure 4b) and P4 (
Figure 4d) both have distinct mid-latitude disturbances of high- and low-pressure centers in a sequence, but the differences between P2 and P4 are noticeable as well. Firstly, the northern YHRB was covered by the post-frontal northerly wind related to a low-pressure center under P2. Moreover, it was under the descending region of a high-pressure center under P4. Secondly, the WPSH under P2 extended northwestward but retreated southward under P4. Thus, the meridional pressure gradient under P2 was enhanced and the average wind speed was greater than 10 m s
−1. Thirdly, P2 had distinct wind convergence between the dry northerly and moist southwesterly regions within the YHRB, and a rainbelt over 400 mm was observed to the south of the mean Meiyu front around 31° N, with a maximum center over 800 mm near the Huang mountains. By contrast, P4 had a lower pressure and equivalent pressure gradient and thus weaker convergence in the YHRB, contributing only 3.25% to the Meiyu rainfalls over the YHRB in 2020. Therefore, we chose not to focus on P4 in this paper.
P3 (
Figure 4c) only had a frequency of 7.5% during 2020, but it caused intense and localized rainfalls, with a maximum record over 150 mm in the southern YHRB. The frequency of P3 was only comparable to 13.8%, but the maximum cumulative rainfall reached 27.9% of that under P1 in June–July 2020. The synoptic pattern of P3 featured a vortex in the YHRB. Such meso-scale cyclonic circulations within the YHRB can develop from eastward-moving SWVs, which occurred in the eastern and southeastern flanks of the Tibetan Plateau and were identified at 700 hPa. The east-moving SWVs may become the quasi-stationary cyclone center for the Meiyu front and produce heavy rainfalls [
43,
49,
50,
51,
52]. In the composite synoptic pattern of P3, the horizontal wind shear was at ~30° N, with southwesterly winds to the south and easterly winds to the north. The equivalent potential temperature had a maximum gradient in the northern part of the vortex around 31° N, while precipitation accumulated to the south of the shear line. The WPSH under P3 retreated southward and the low-level southerly wind was strong, with a wind speed of over 10 m s
−1, favoring the conveyance of moisture.
4.2. Vertical Cross Section
Figure 5,
Figure 6 and
Figure 7 present the mean vertical cross sections in the north–south direction under the major synoptic patterns of P1, P2, and P3 (
Figure 5a,
Figure 6a, and
Figure 7a), including the equatorial gradient of the equivalent potential temperature, the distribution of relative humidity, and the in-plane wind vectors. The cross section is located along the longitude of the maximum accumulated rainfall center under each synoptic pattern. In addition, the zonally averaged rainfall within the longitudinal boundary of the YHRB is also shown along the latitudes (
Figure 5b,
Figure 6b, and
Figure 7b).
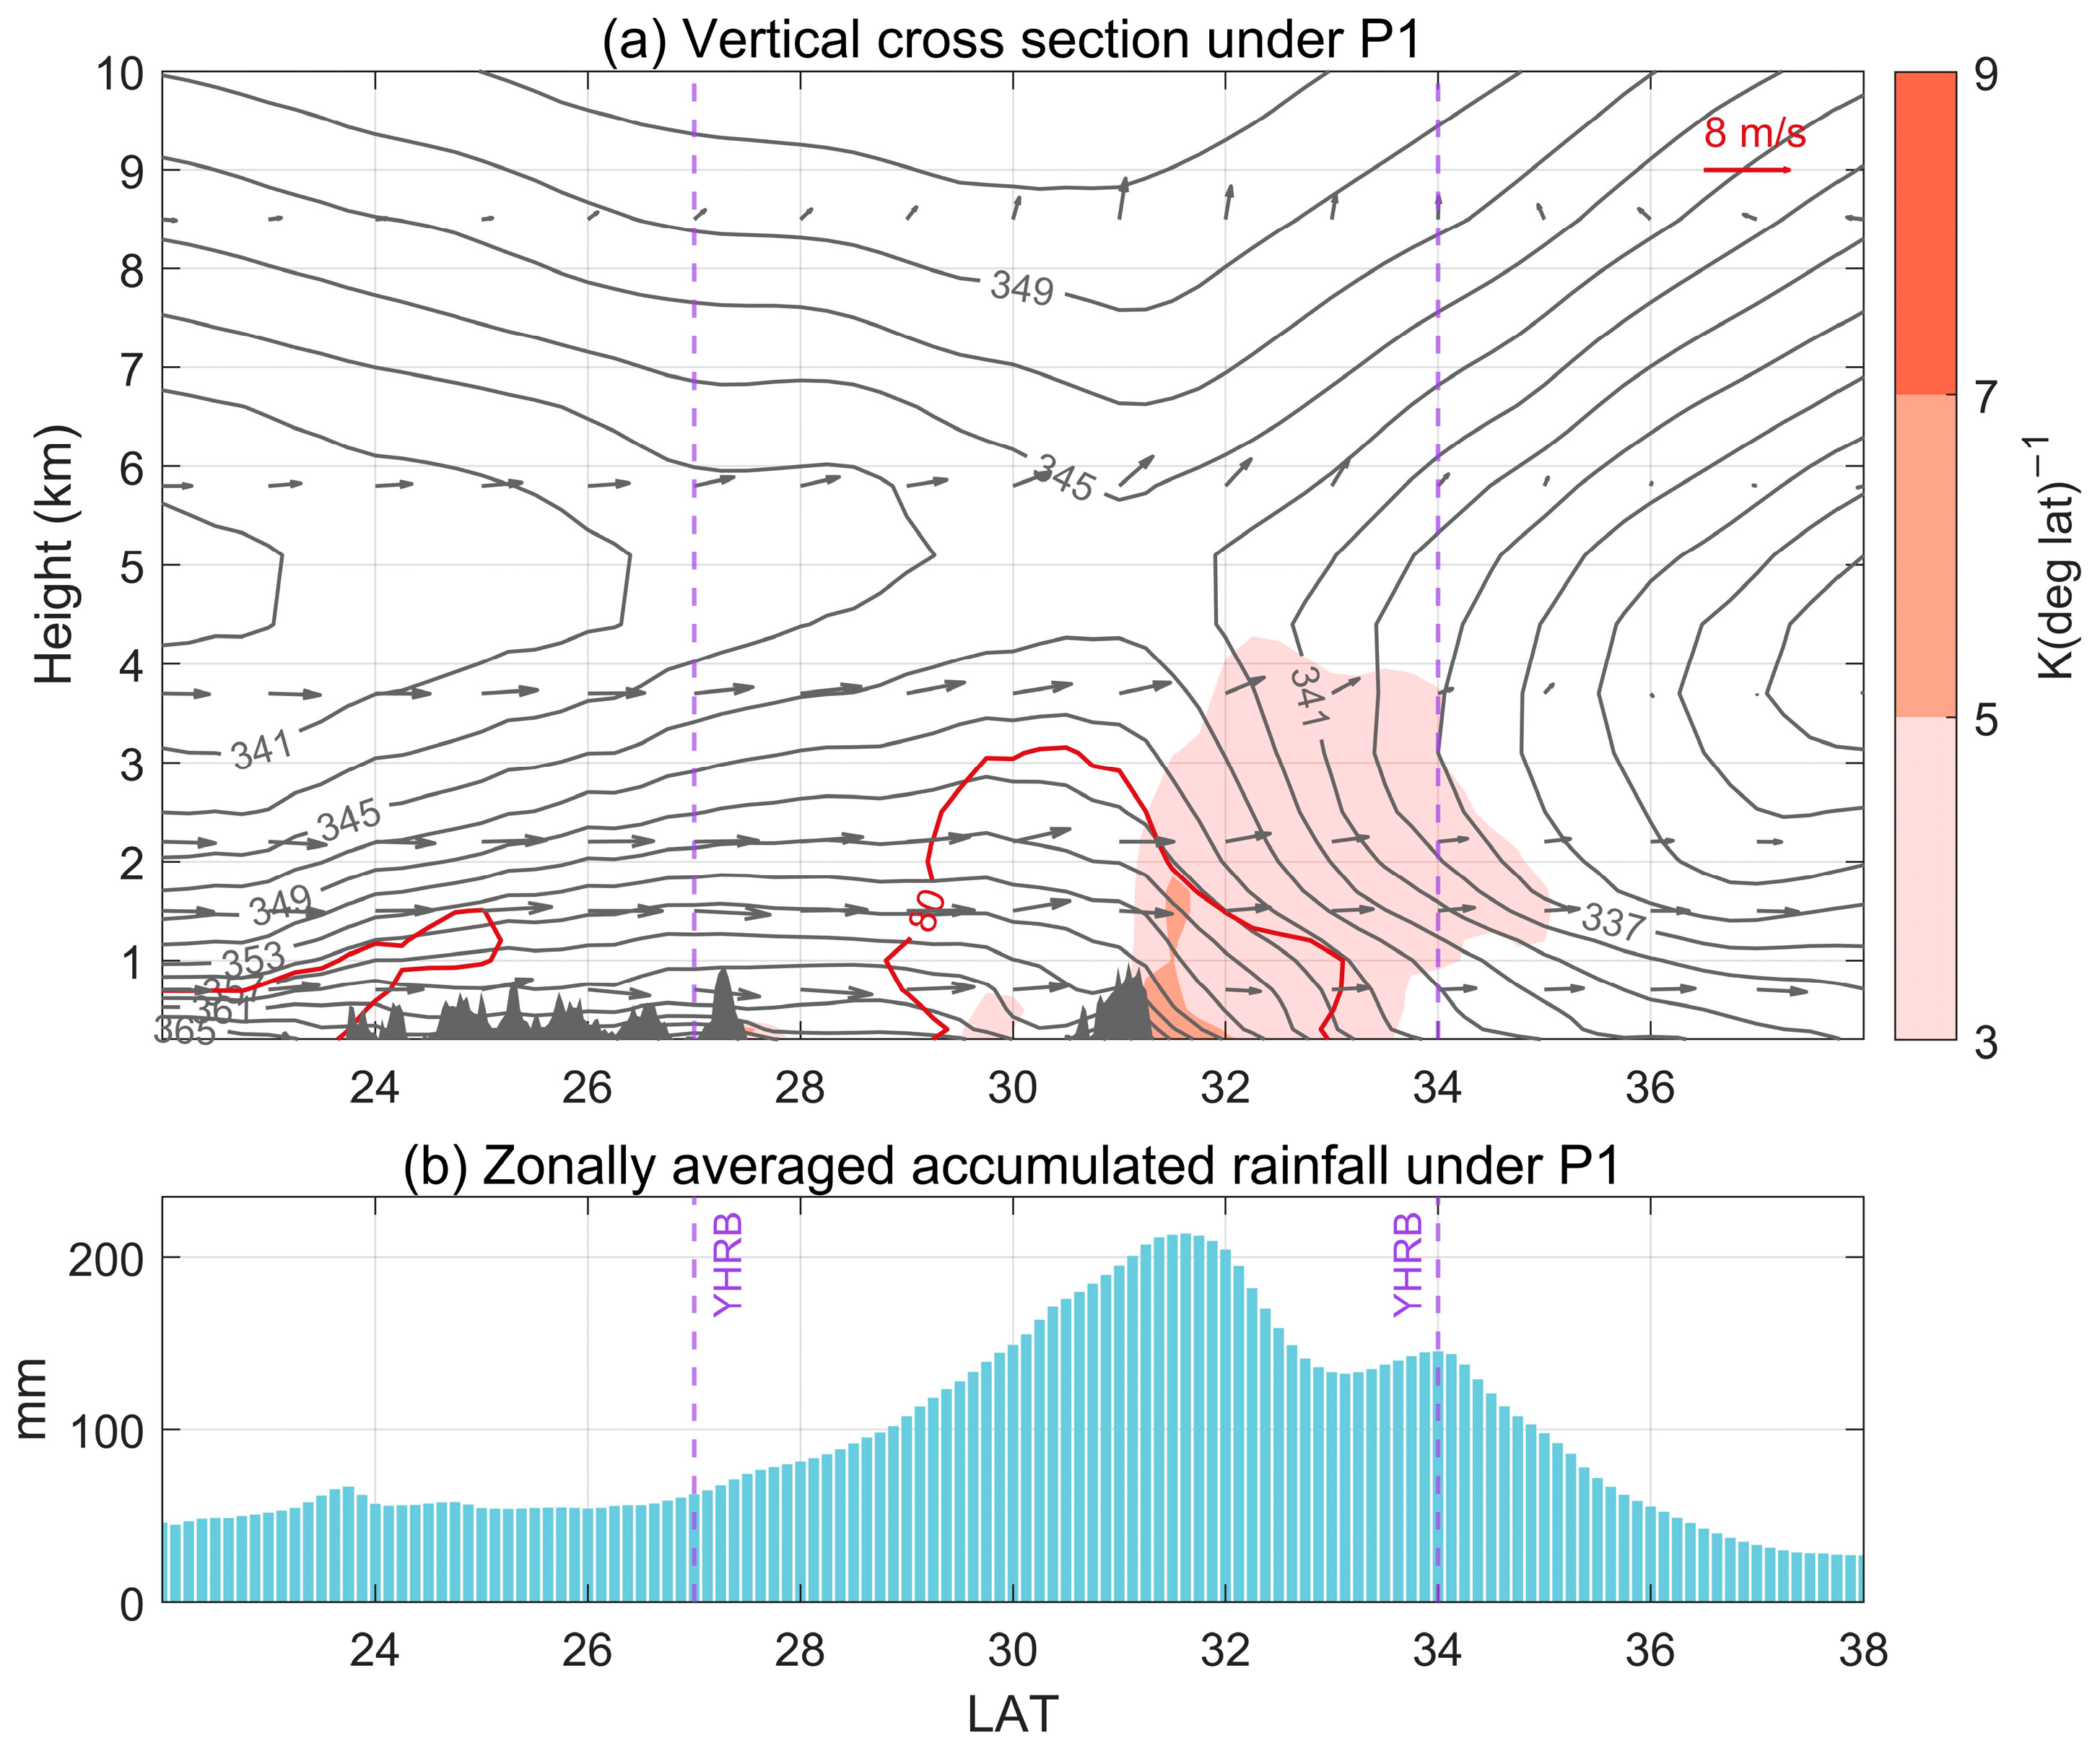
The In-plane winds under P1 (
Figure 5a) were steady southerlies, promoting the movement of moisture northward, with a low-level relative humidity over 80% in the YHRB. The belt of the maximum equatorial equivalent potential temperature over 3 K (deg lat
−1) was around 31 to 34° N, and it tilted northward along with the height, indicating the average location of the Meiyu front. The steady southerlies crossing the dense isotherm lines of the equivalent potential temperature indicate the warm advection favoring the upward motion along the Meiyu front [
5]. In addition, impinging airflow towards the terrain caused upslope lifting, and moisture was piled up on the upslope and above the mountains, suggesting a possible orographic effect. The zonal mean accumulated rainfall under P1 in the YHRB (
Figure 5b) at latitudes from 28 to 34° N was over 100 mm, and the maximum was around 32° N, under the high gradient of the equivalent potential temperature.
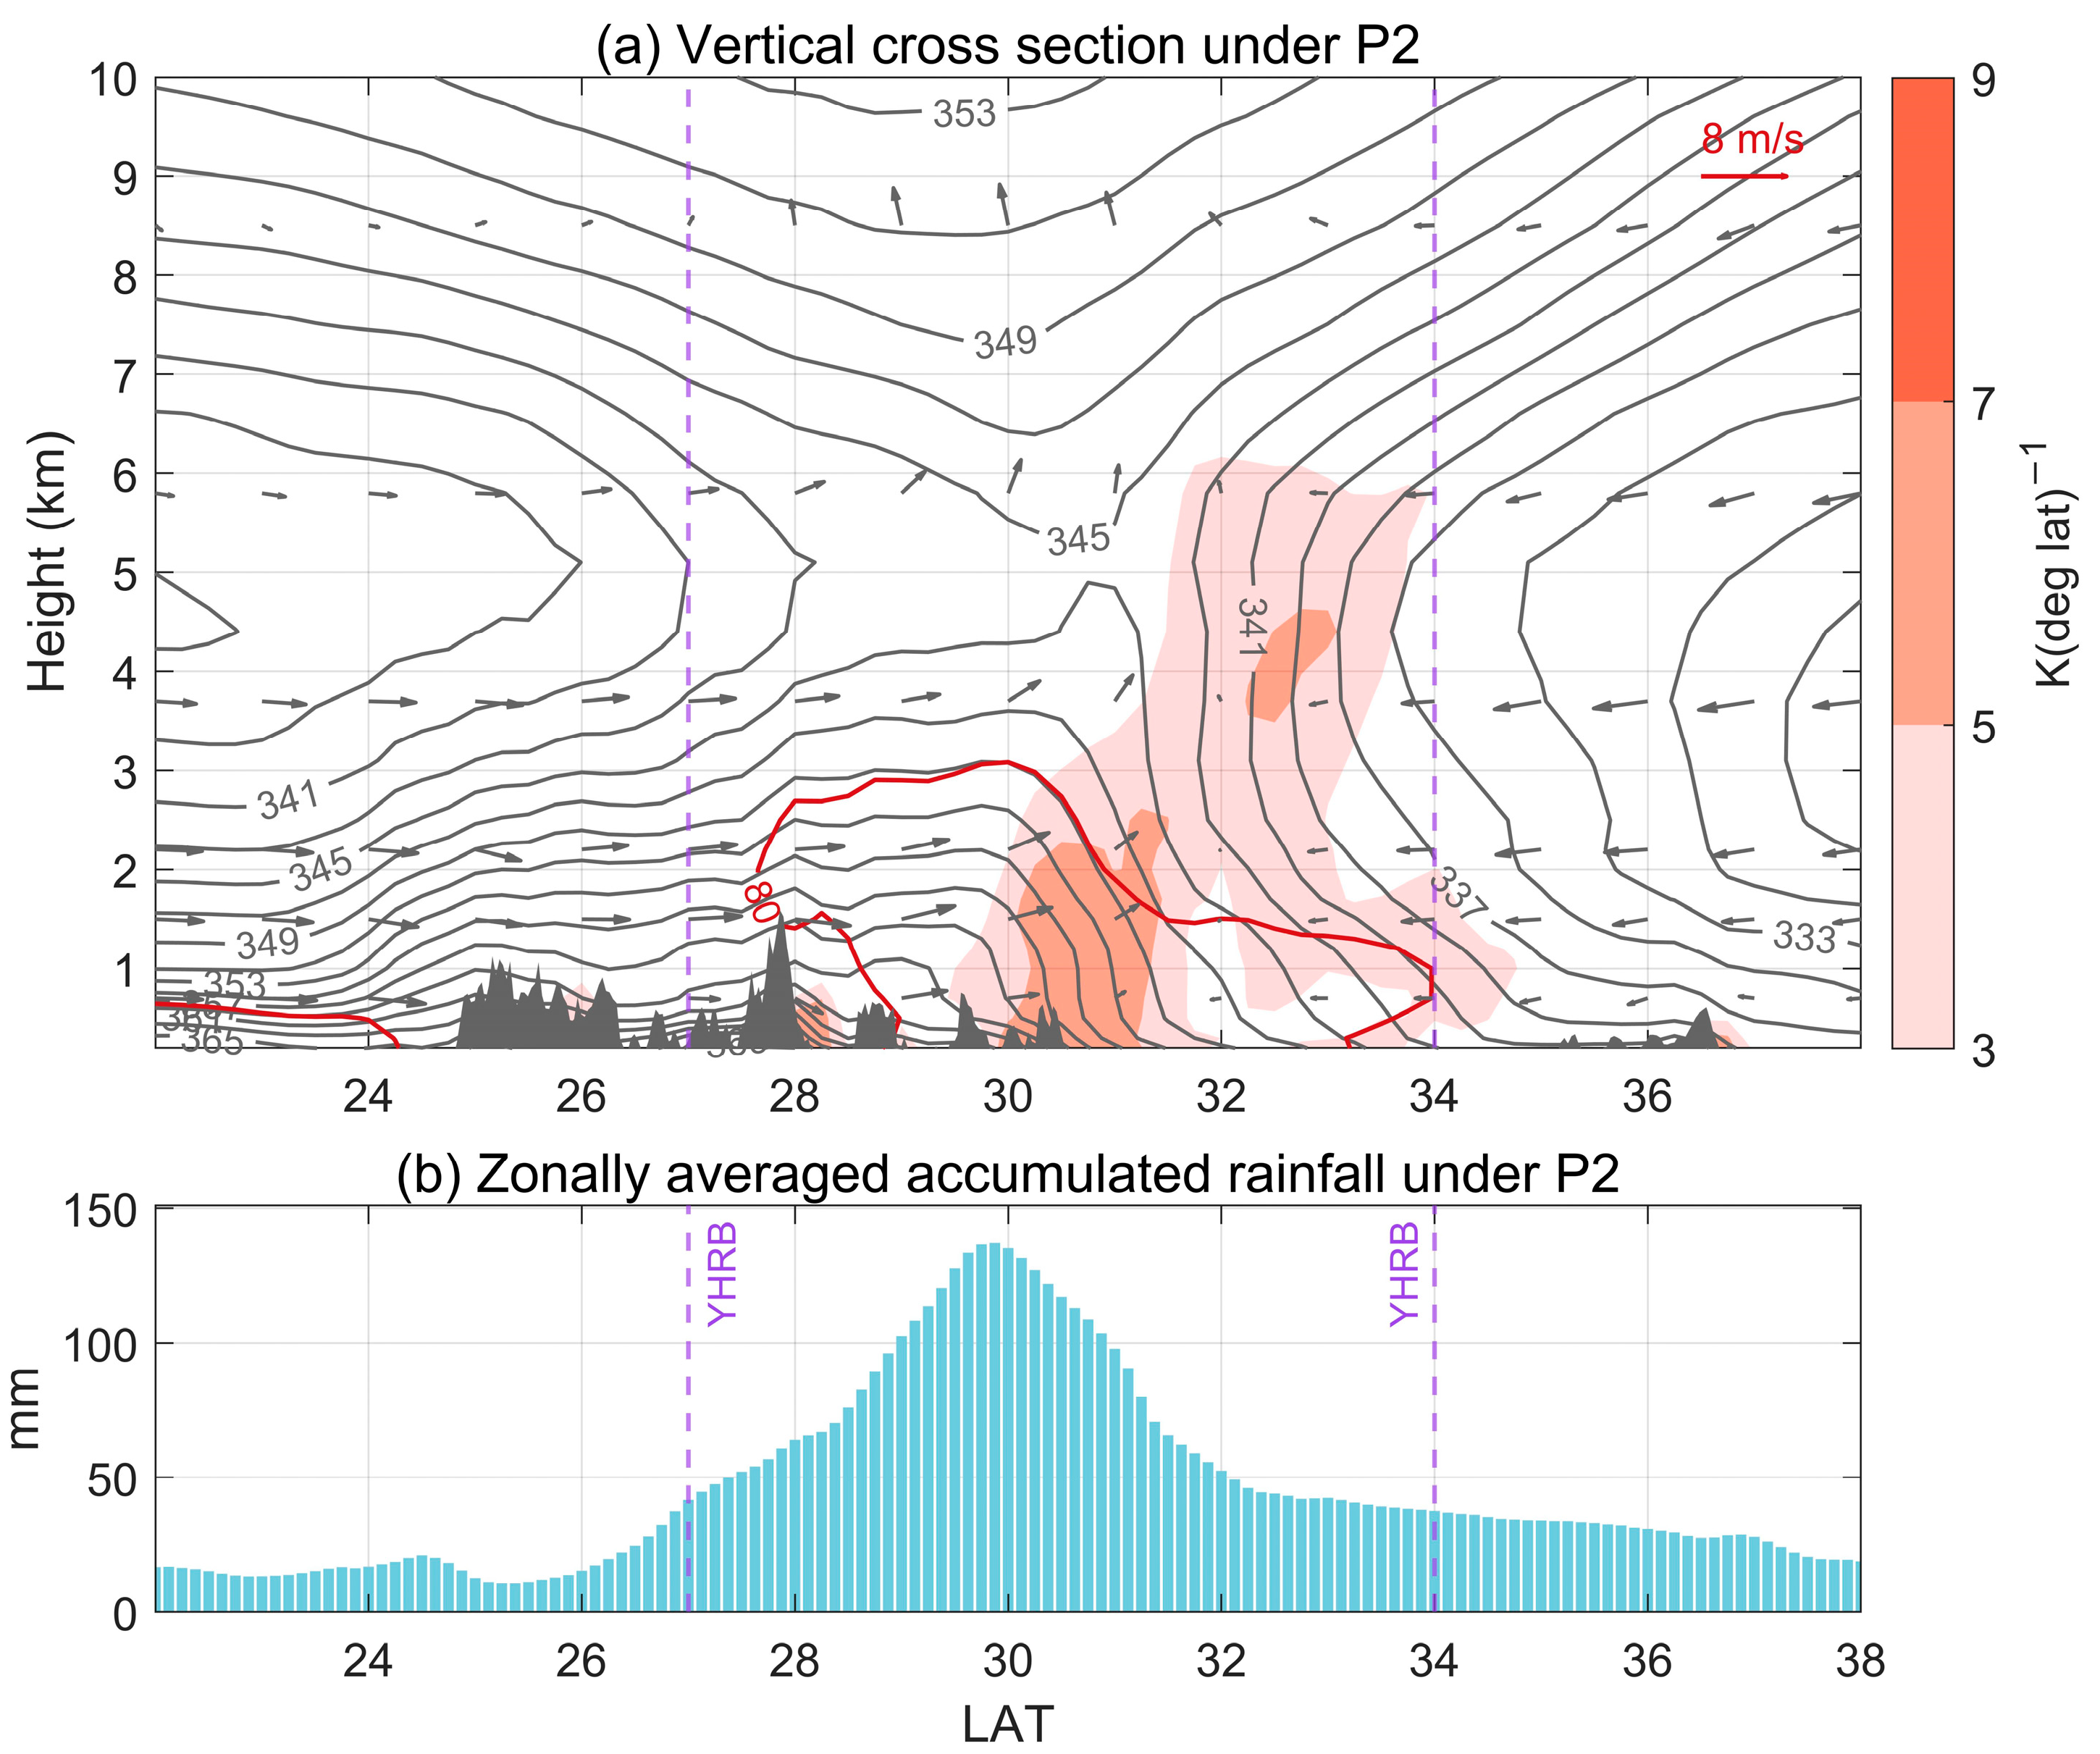
Apart from warm advection from the southerlies similar to that observed under P1, the synoptic pattern of P2 (
Figure 6a) has a noticeable convergence line around 32° N with a dry northerly from the mid-latitude and increased upward motion around 30° N. The strong convergence intensified, and the gradient was over 5 K (deg lat
−1) around 30–32° N. The external forcing under P2 triggered a convection by lifting air parcels, and the upward motion was further reinforced by the convective instability and the resultant diabatic heating. Therefore, the convection–circulation feedback intensified the Meiyu front [
5,
53,
54] and the accumulated rainfall was produced to the south of the convergence line around 30° N (
Figure 6b).
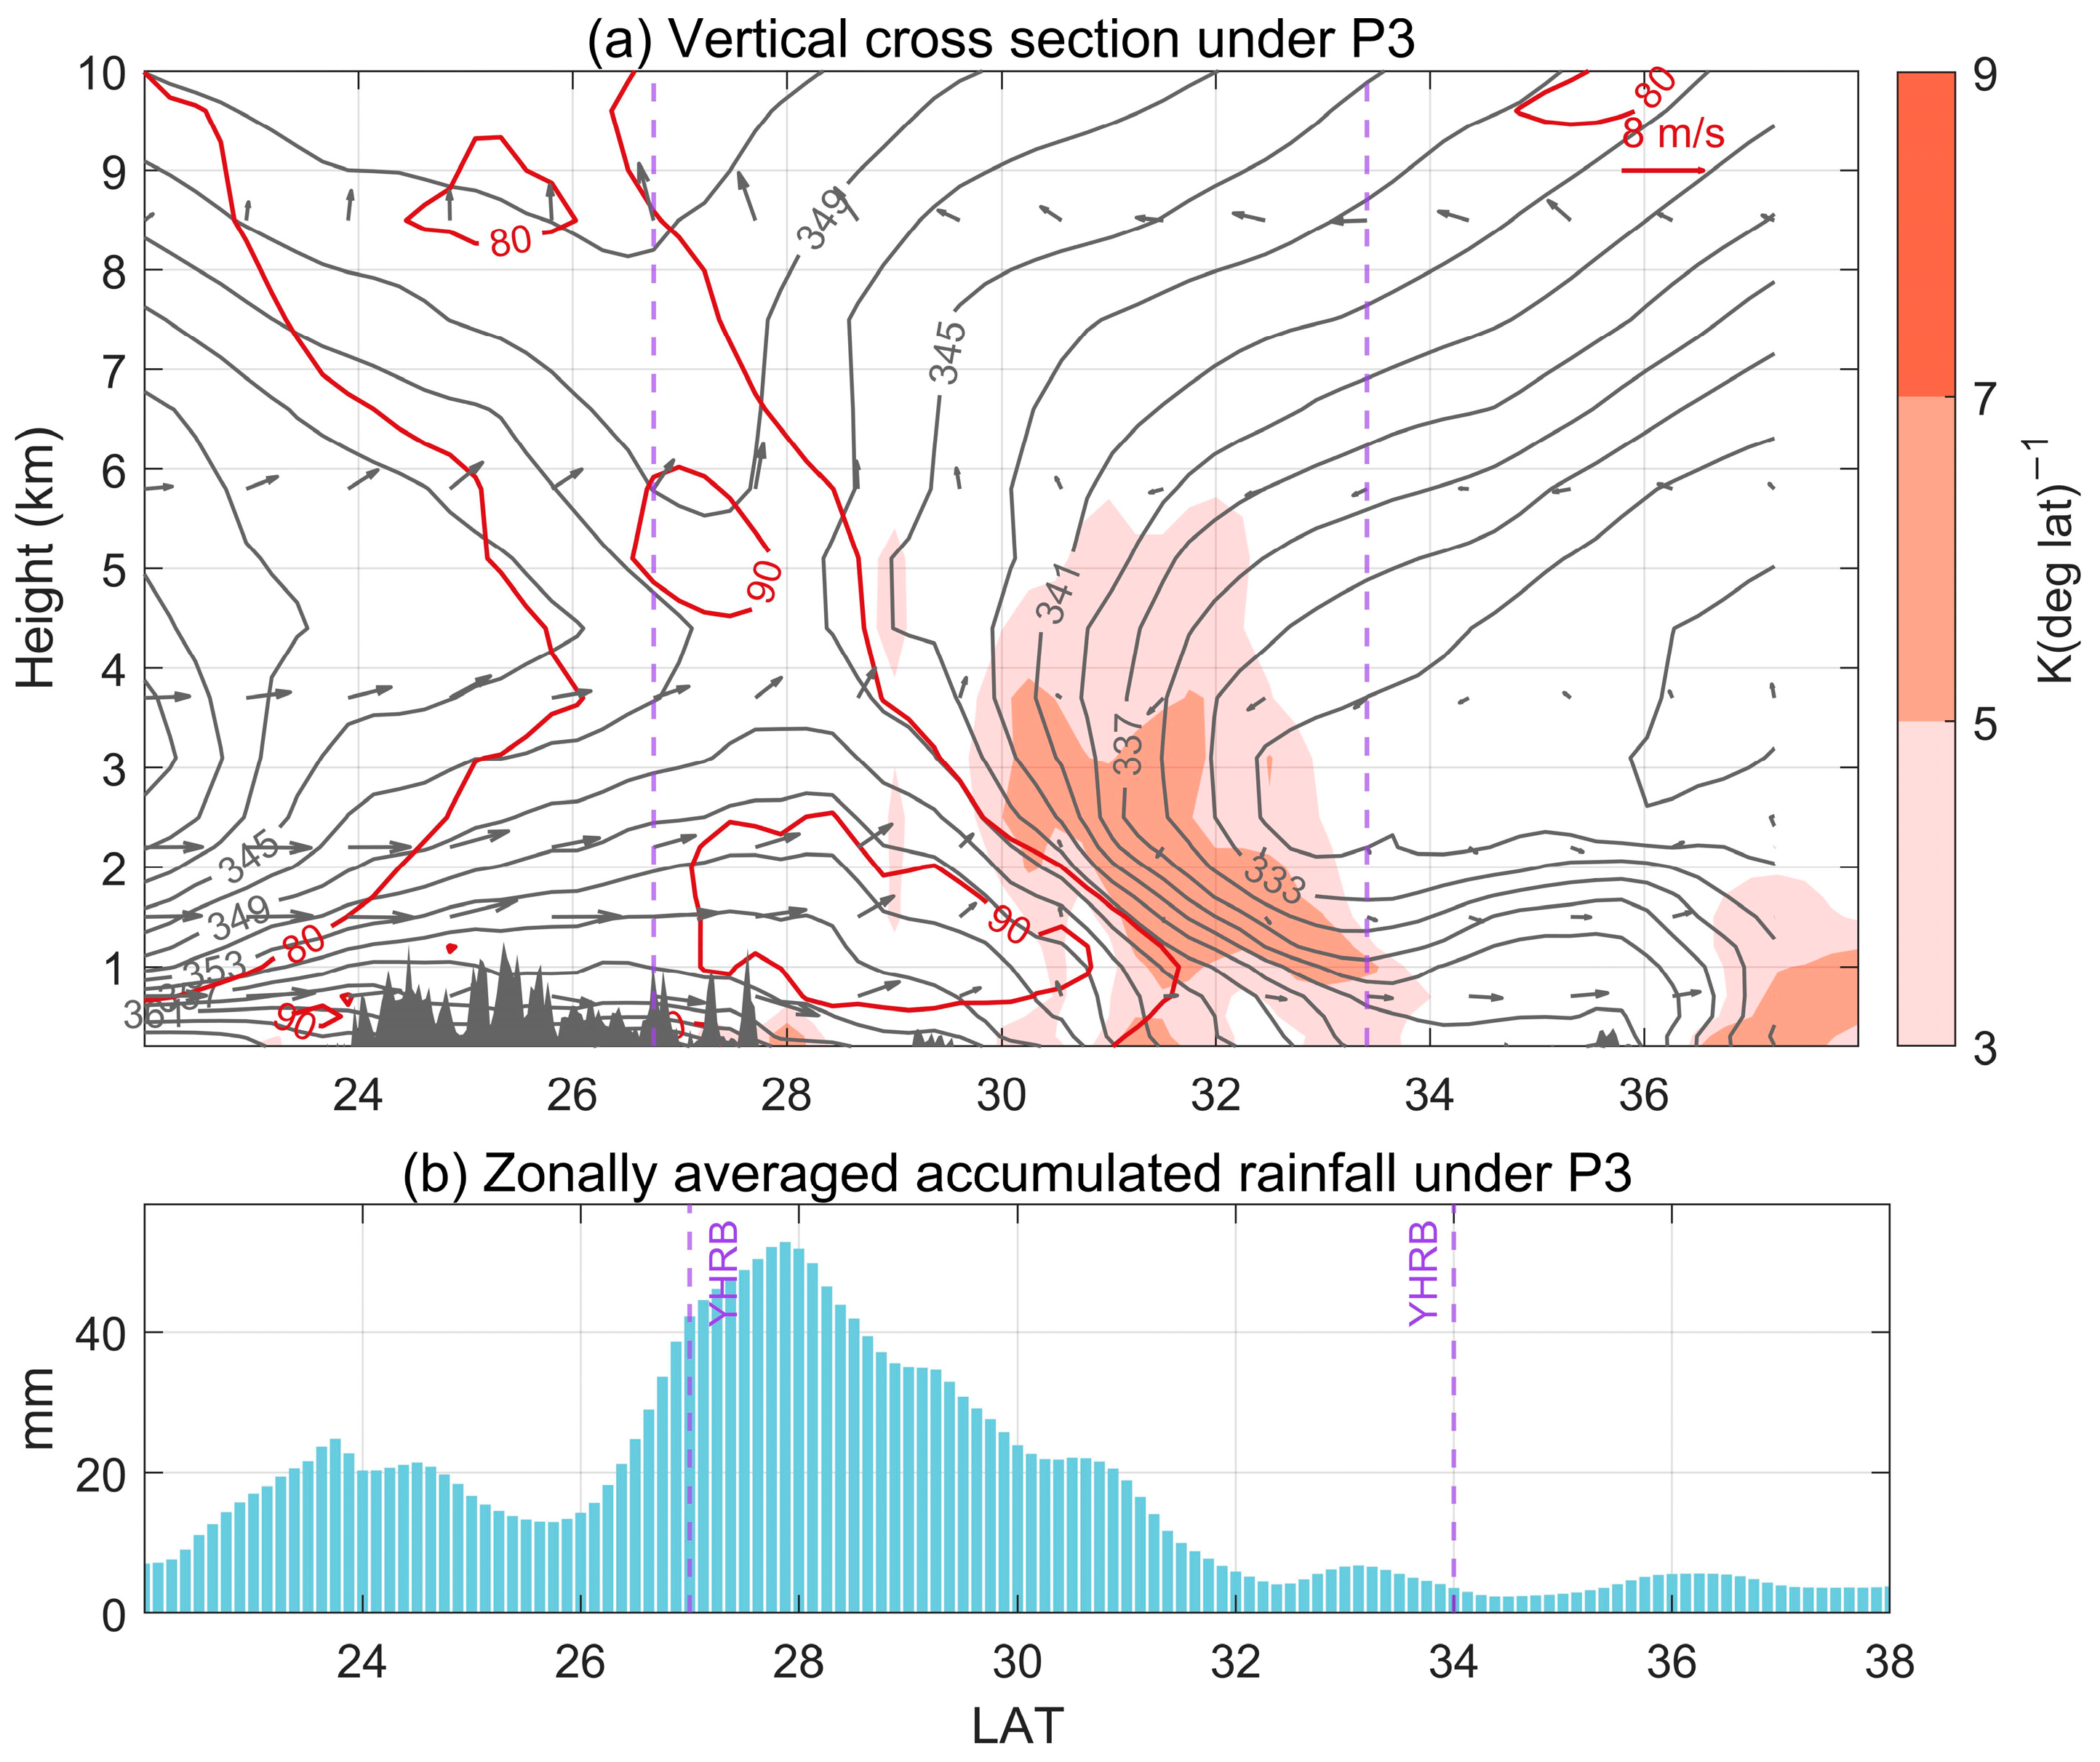
In terms of P3 (
Figure 4c and
Figure 7a) with a vortex average center around 30° N, the equivalent potential temperature decreased rapidly to the north of the horizontal shear line, leading to a high gradient zone around 32° N with a core above from 1 to 4 km, which was more intense than those of the other patterns. In addition, a localized and intense rainfall was generated to the south of the horizontal shear line (
Figure 7b), where the surface moisture was confined with a maximum of over 90% and spread upwards to the upper level, and the southerly wind turned into an upward motion.
4.3. Hovmöller Diagram of Hourly Rainfall Clusters
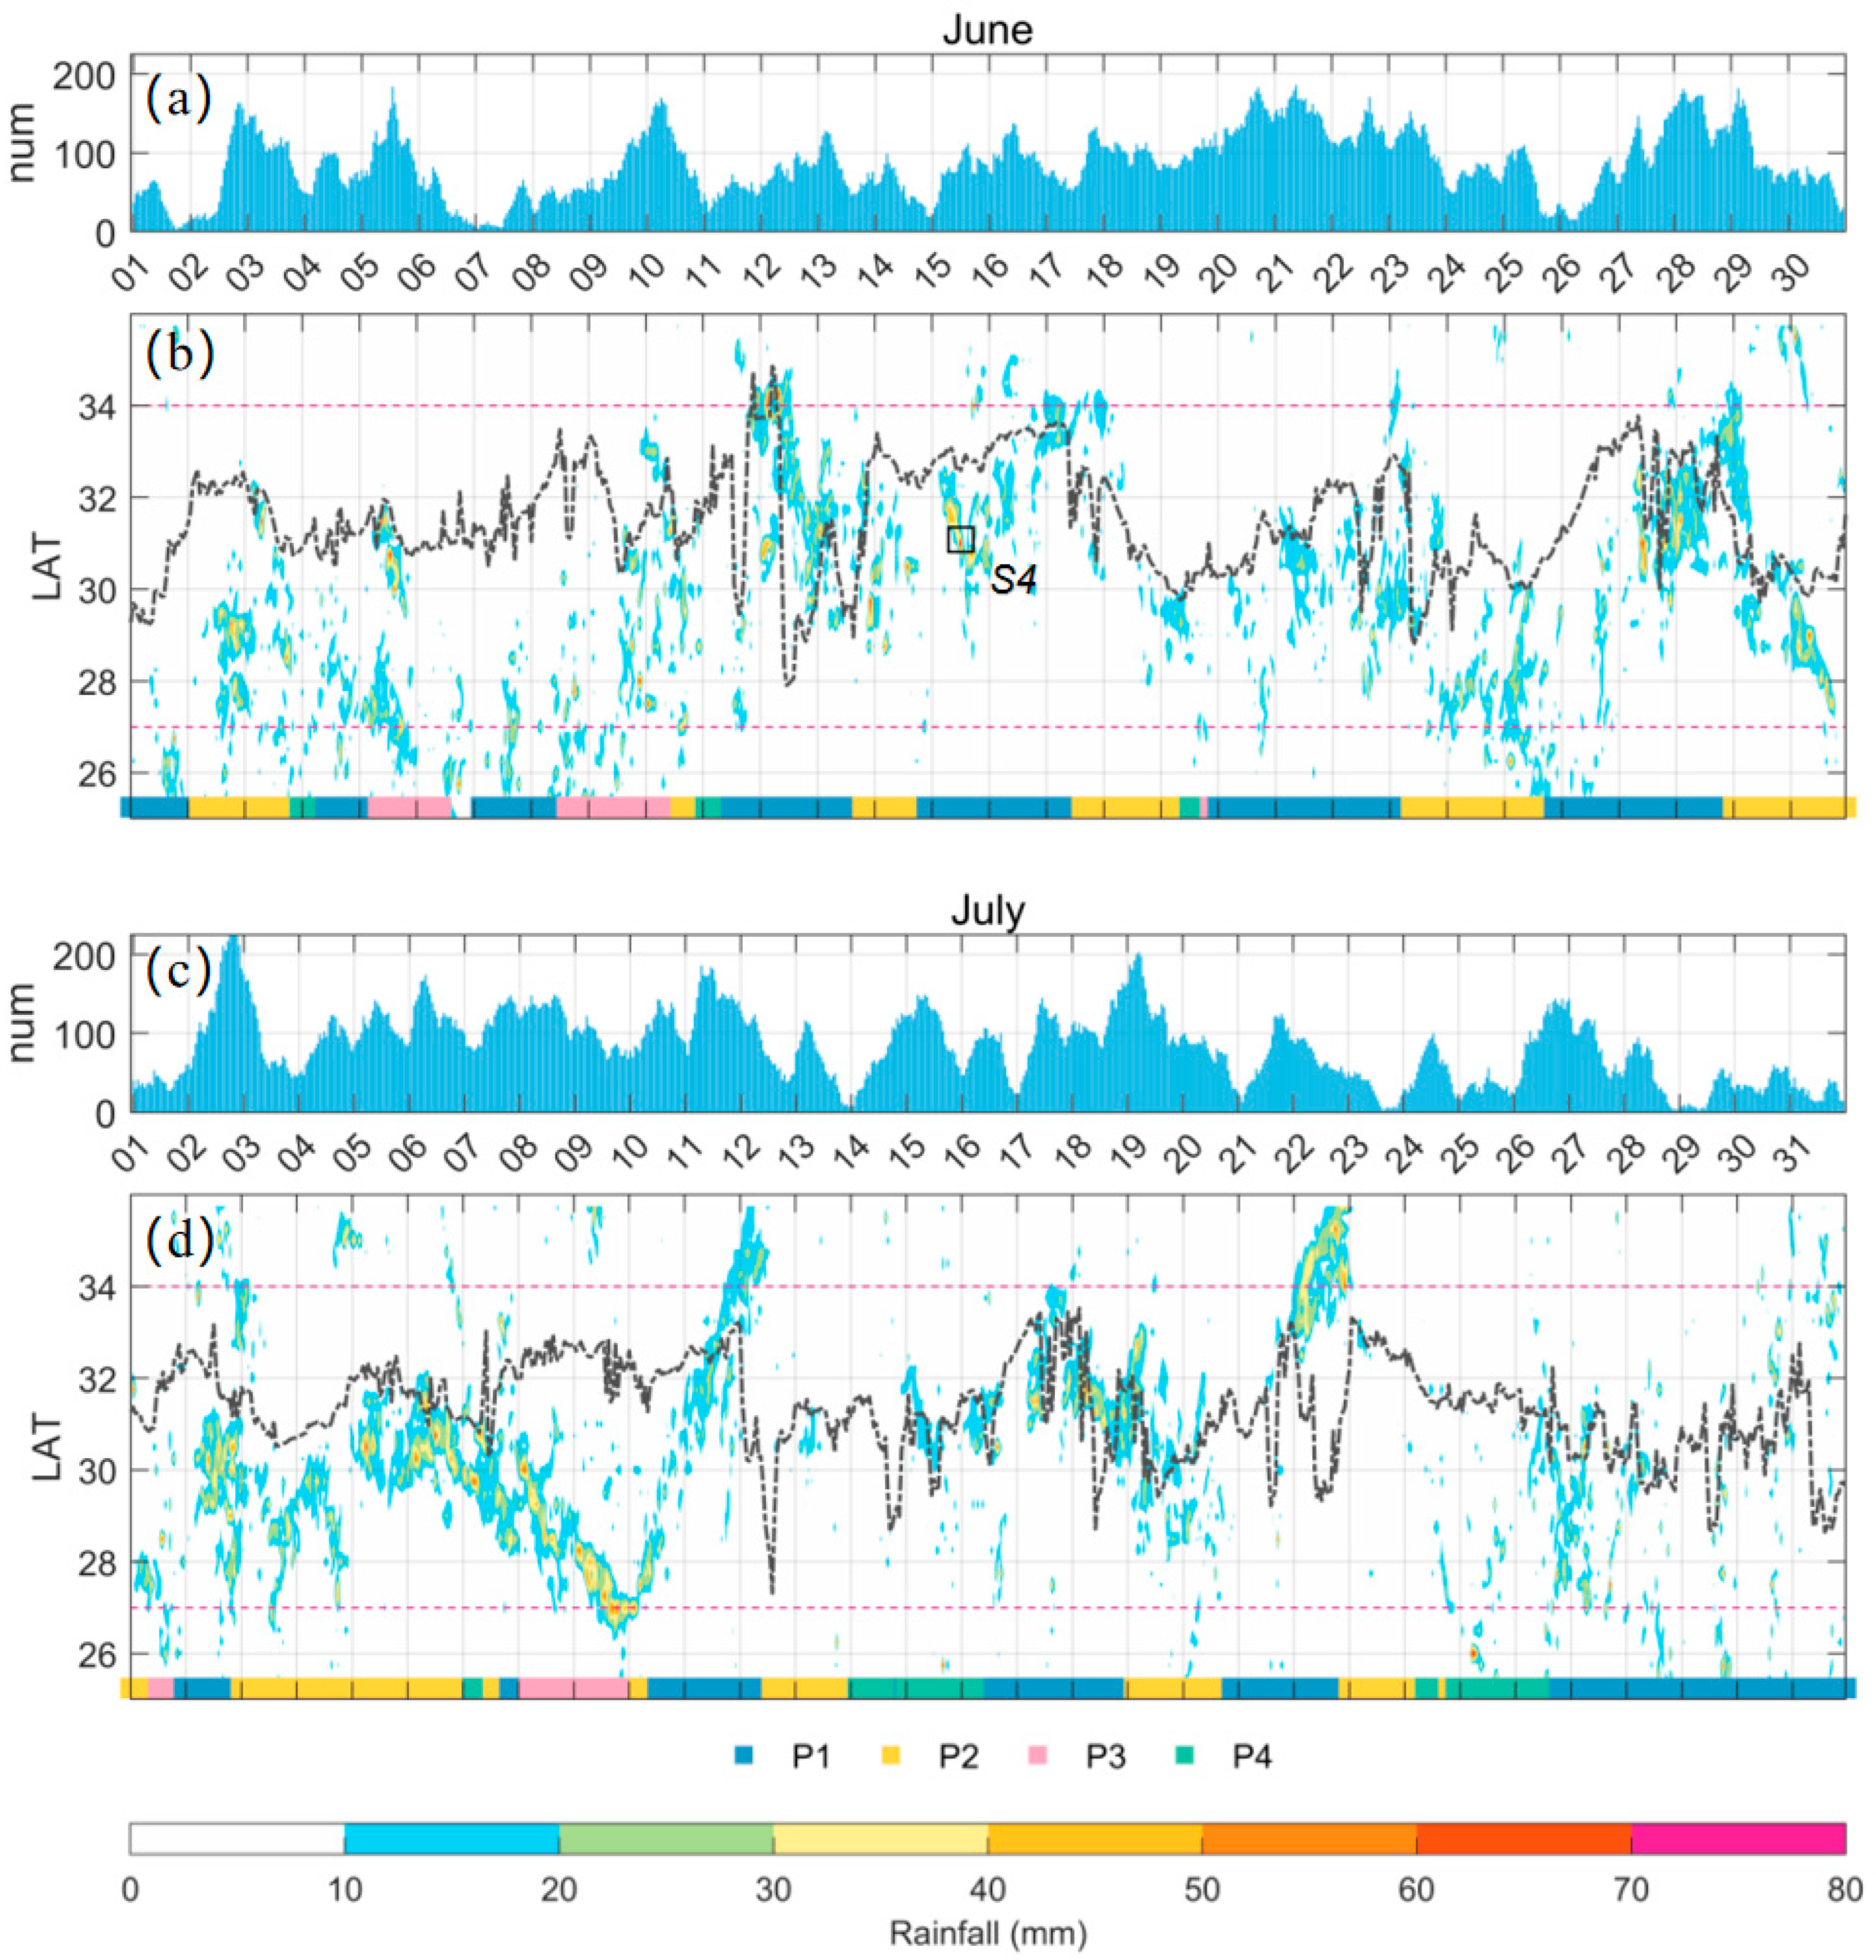
Under the effect of the strength and variation of synoptic disturbances, the circulation patterns change and bring rainfall with different features. To check the impact of the hourly synoptic variations on sub-hourly and hourly rainfalls, representative synoptic patterns for each hour were labeled using different color blocks along the timeline for June–July 2020 (
Figure 8b,d and
Figure 9). The time series of the hourly rainfall frequency in the YHRB is plotted in
Figure 8a,c. The hourly rainfall is presented in Hovmöller space to exhibit the meridional (
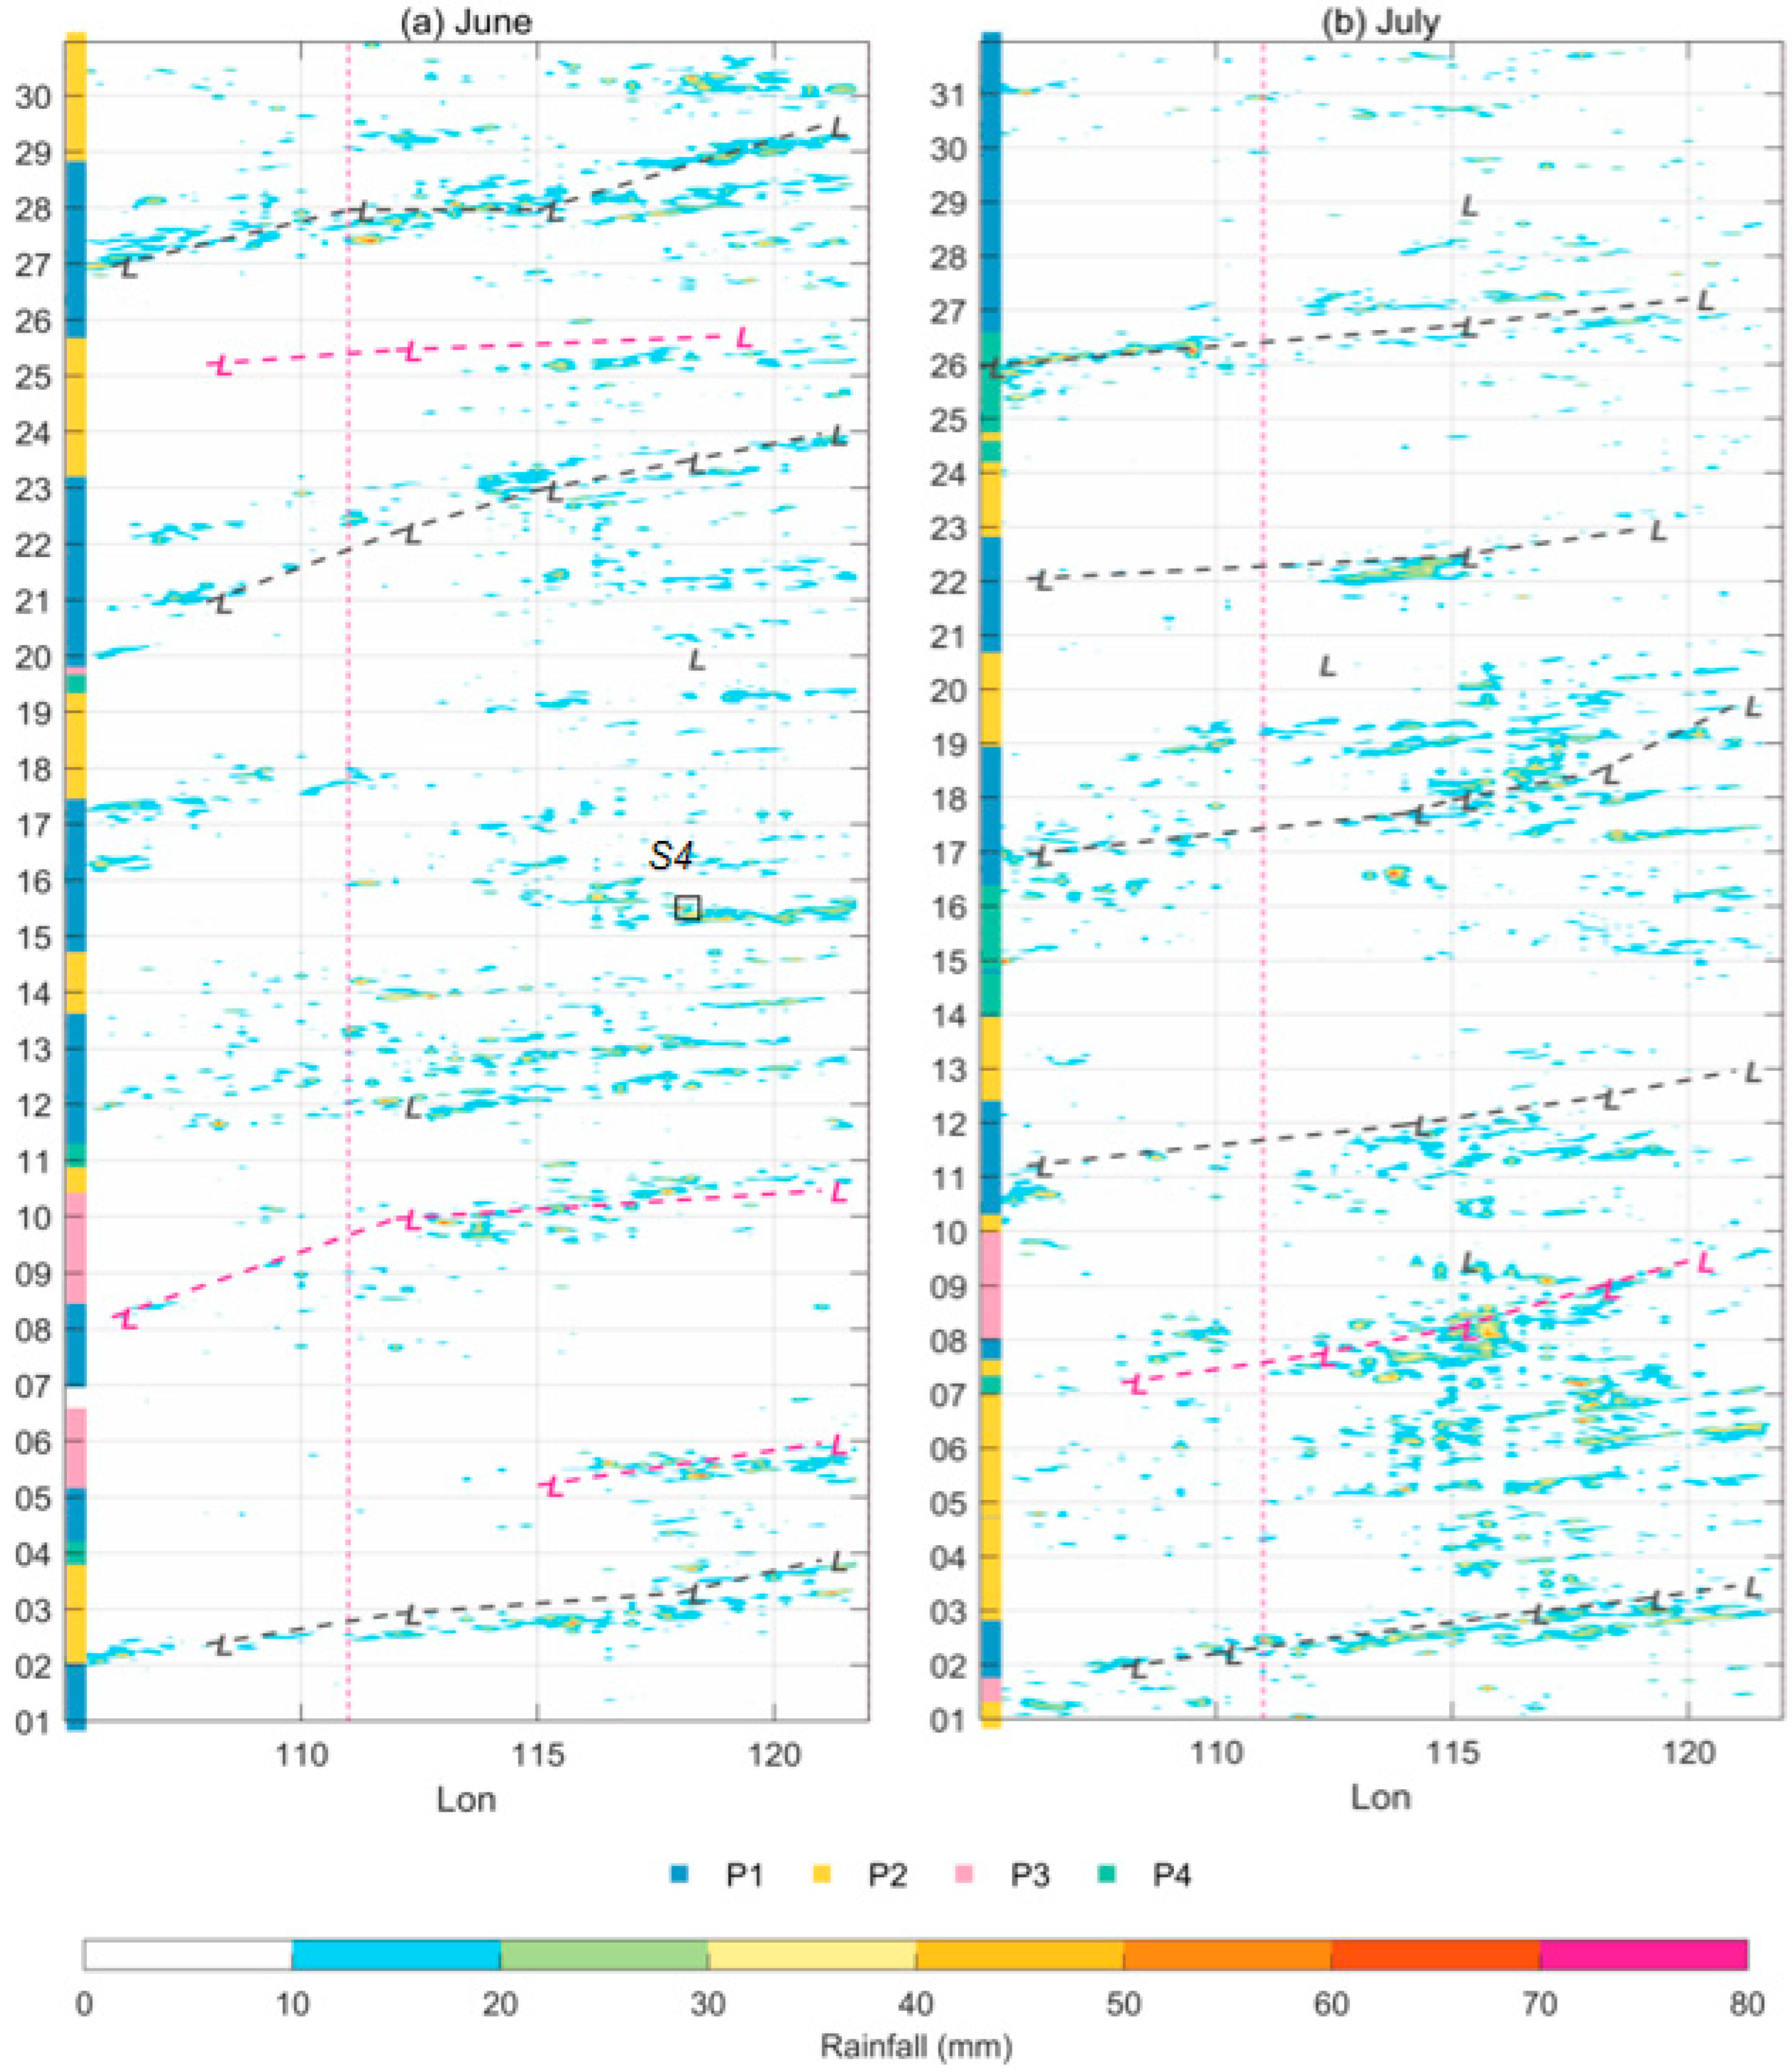
Figure 8b,d) and zonal (
Figure 9) propagating characteristics of rainfall clusters. In particular, to identify the impacts from mid-latitude disturbances and eastward-moving SWVs, the locations and trajectories of any closed vortex at 850 hPa within 112–120° E and 27–34° N are marked with the letter
L and a dashed line, and SWVs with its center entering the YHRB are emphasized in red (
Figure 9).
Meridionally, the Meiyu front stayed in the YHRB region with several north–south swings after its first northward movement in early June (
Figure 8b,d). Zonally, the YHRB was affected by strong and weak synoptic disturbances, including 12 sets of eastward-moving meso-vortices with four sets across the YHRB, and weak-forcing breaks between the sets of vortices, such as those seen in mid-June and the end of July (
Figure 9). Overall, the location of the hourly rainfall clusters varies in relation to the meridional shifting Meiyu front and the eastward-moving disturbance. In addition, the synoptic patterns altered between P1 and P2 with occasional interludes of P3 (
Figure 8 and
Figure 9).
During the breaks of the eastward-moving vortices, without strong synoptic forcing from mid-latitude or southwest China, the synoptic pattern was often classified as P1 (
Figure 9). In addition, the Meiyu front either stayed stationary at around 31–32° N (e.g., 15–17 June, 27–31 July) or moved northward under the promotion of the steady southwesterly (e.g., 7–8 June, 20–23 June, 26–28 June) (
Figure 8b,d). While the Meiyu front moved northward, the rainfall clusters were weak and widely spread in the warm sector with little longitudinal migration (
Figure 9), and the hourly rainfall frequency was enhanced within the YHRB (
Figure 8a,c).
When the vortices were moving eastward from ~105° E to the north of the YHRB (
Figure 9), the post-trough dry northerly was enhanced to favor its convergence with the moist southwesterly at a low level. In addition, the Meiyu front retreated southward after a rapid swing (
Figure 8b,d) and P1 turning to P2 can be observed, such as on 21–24 June, 27–30 June, 2–3 July, 11–12 July, and 17–20 July. The rapid switch between P1 and P2 reveals the intense collision between the dry northerly and moist southerly within the YHRB, producing aggregated hourly rainfall clusters near the Meiyu front in latitude (
Figure 8b,d) and displacing eastward in longitude with time (
Figure 9). Once the YHRB was largely occupied by the dry air mass from the north under P2, the rainfall diminished (
Figure 8b,d) and the hourly rainfall frequency decreased (
Figure 8a,c) under the dry sector, such as on 17–19 June and 23–24 July.
When the vortices were moving eastward and entering the YHRB (
Figure 9), as shown in the case of 5–6 June, 8–10 June, 25–26 June, and 7–9 July, the synoptic patterns were mostly clustered as for P3, except for the case of 25–26 June, during which the SWV was weak and the flow pattern was close to a shear line rather than a vortex (not shown); thus, the pattern is classified as P2. The SWVs on 7–9 July were the strongest and stayed the longest in eastern China from the aforementioned cases, causing continuous heavy rainfall in the southern quadrant of the vortex. During this rainfall event, the maximum 6 h rainfall during the 2020 Meiyu season was recorded at 212.6 mm at 0100-0600 LST, on 8 July.
In summary, the hourly variation in synoptic patterns features an evolution of the mid-latitude ridge/trough, eastward-moving SWVs, and a steady southwesterly, which together affect the location of the Meiyu front and the rainfall distribution. The classification of P1–P3 can show the hourly synoptic variations that produced rainfalls during the 2020 Meiyu season.
4.4. Hourly and Sub-Hourly Rainfall under Synoptic Patterns
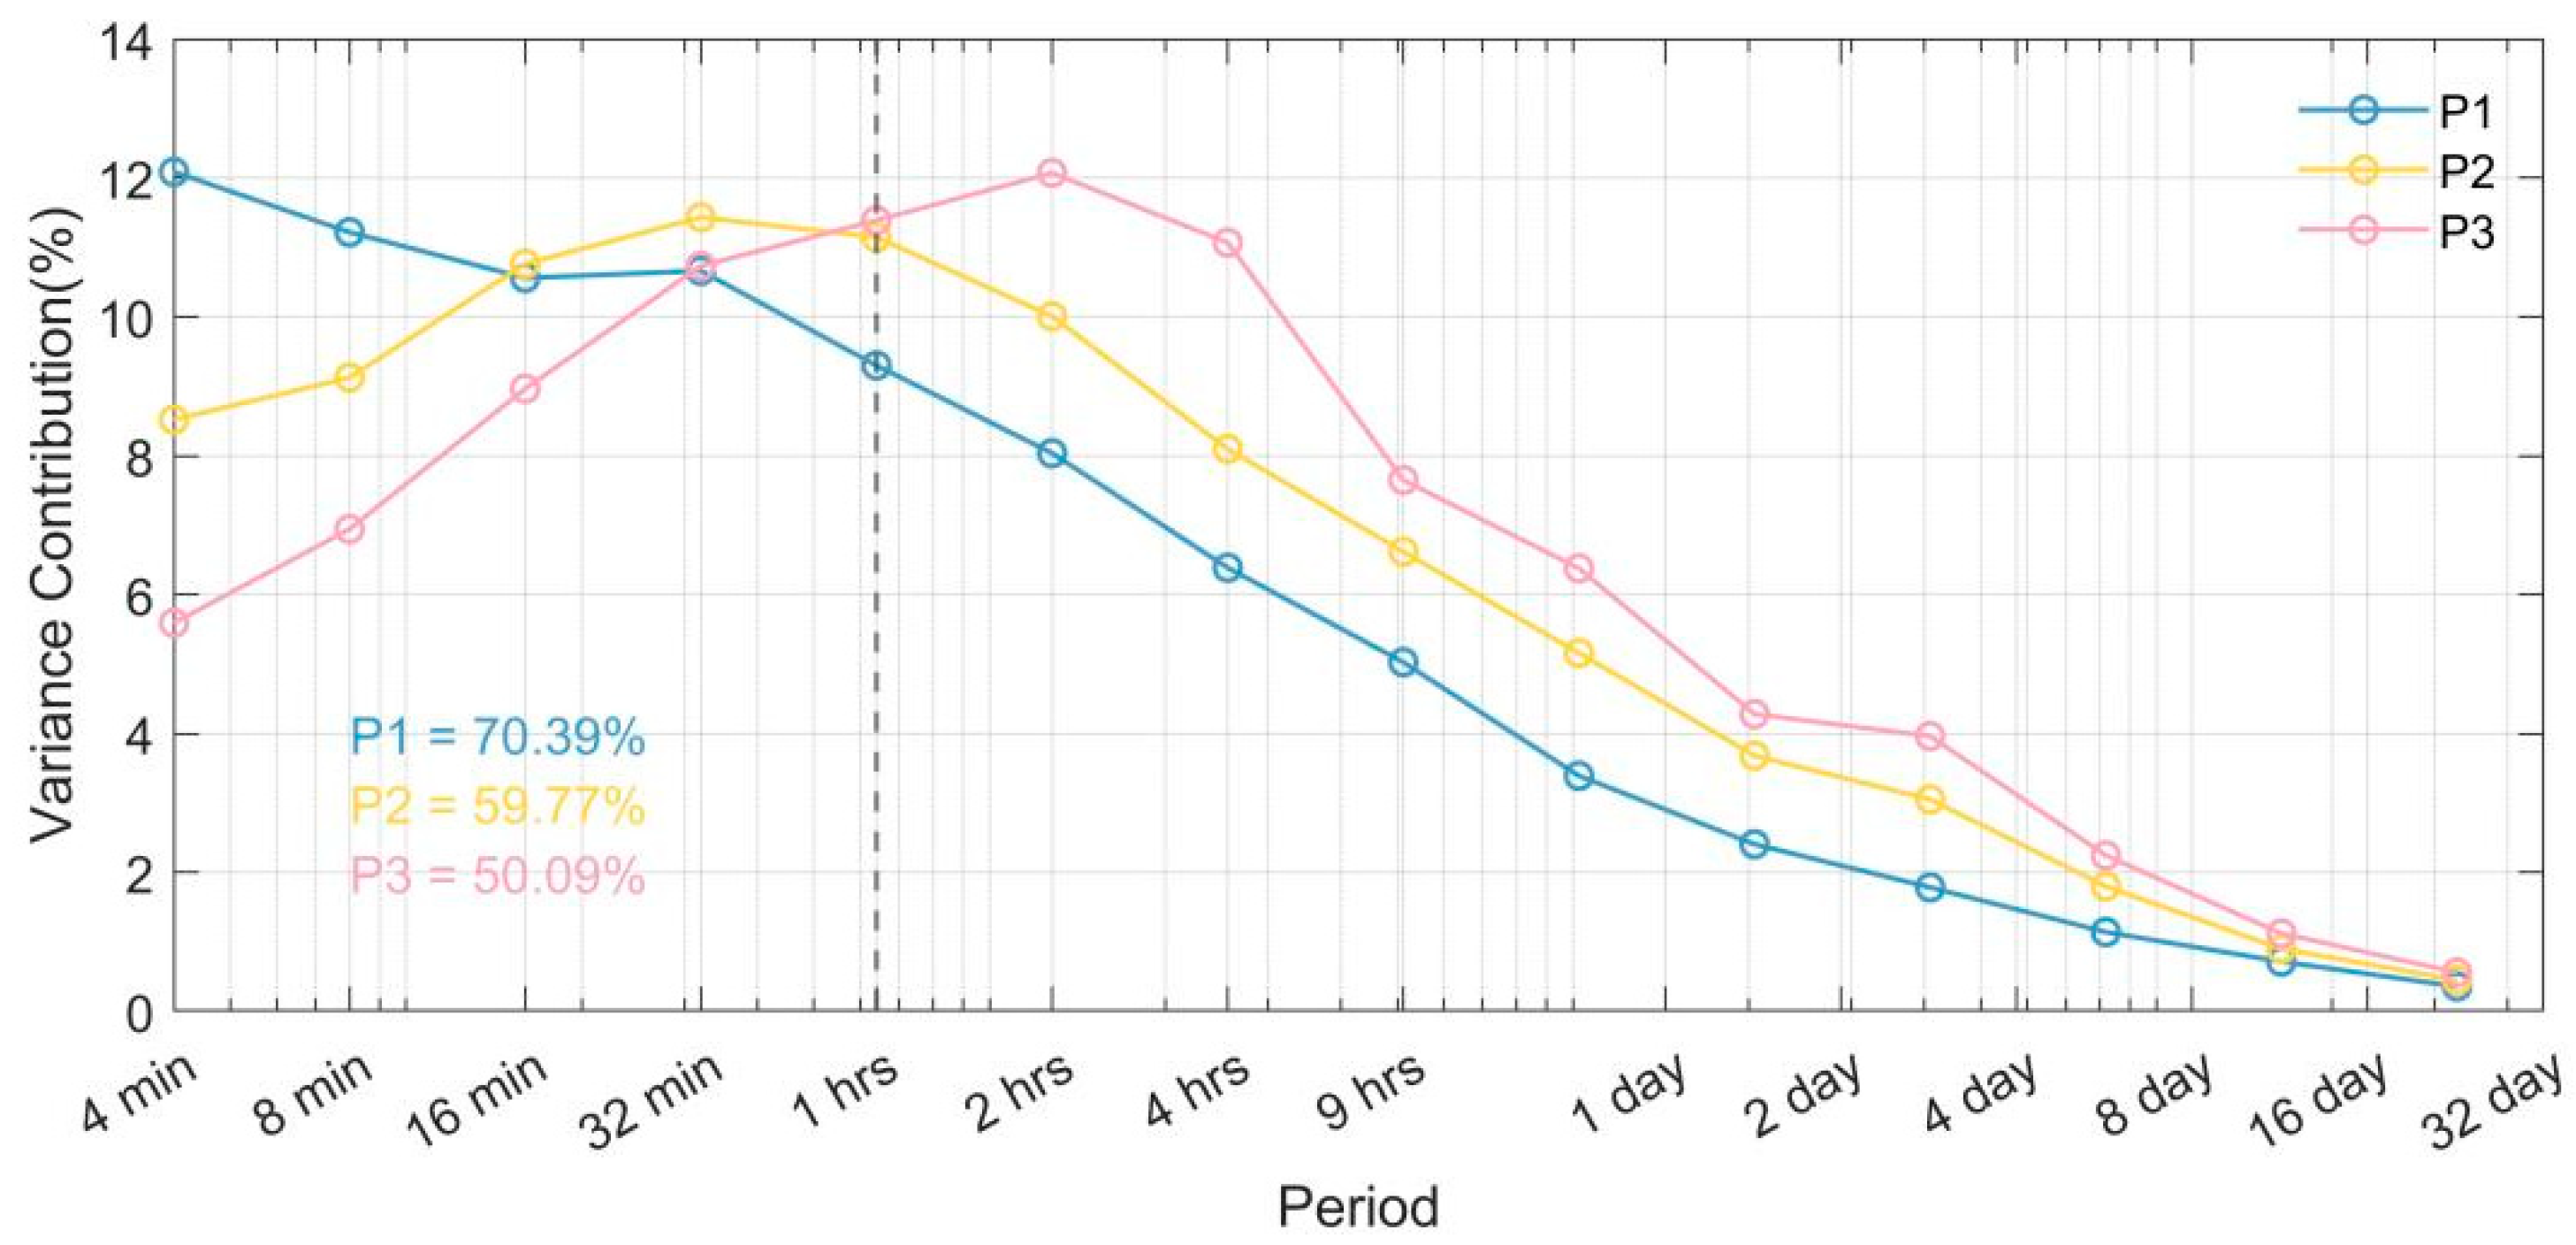
To quantitatively capture the rainfall features under each synoptic pattern, a similar wavelet analysis to that shown in
Figure 3a was applied on the R1m data under P1, P2, and P3 (
Figure 10). As shown in the results, the energy distribution of the wavelet variance under each pattern exhibited a different distribution on a range of time scales. The rainfall episodes under P1 had the shortest time scale, with a 70.4% rainfall expectation from sub-hourly to hourly rainfalls, suggesting that the rainfall episodes under P1, produced by warm and steady southerlies without significant synoptic disturbance, were the shortest in duration but made the largest contribution to the accumulated rainfall compared with the other patterns. In addition, with the frequent occurrence of P1 (56.3%), the accumulated rainfall under P1 was 57.6% of the total 2020 Meiyu rainfall, indicating that weak/no forcing days can accumulate considerable rainfall via short-term rainfall episodes with a high frequency.
P2 has a wavelet variance maximum around 30 min–1 h and 59.8% of the rainfall expectation is from the sub-hourly to hourly scales, implying that the external forcing of the convergence line prolonged the duration of rainfall episodes. In contrast to P1 and P2, the rainfall episodes under P3 lasted longer with a maximum wavelet variance of 1–4 h; thus, the percentage of the sub-hourly to hourly rainfalls was reduced to 50.1%, which is related to the quasi-stationary vortex in the YHRB. Overall, the sub-hourly and hourly rainfalls contributed more than half of the total Meiyu rainfall under each synoptic pattern.
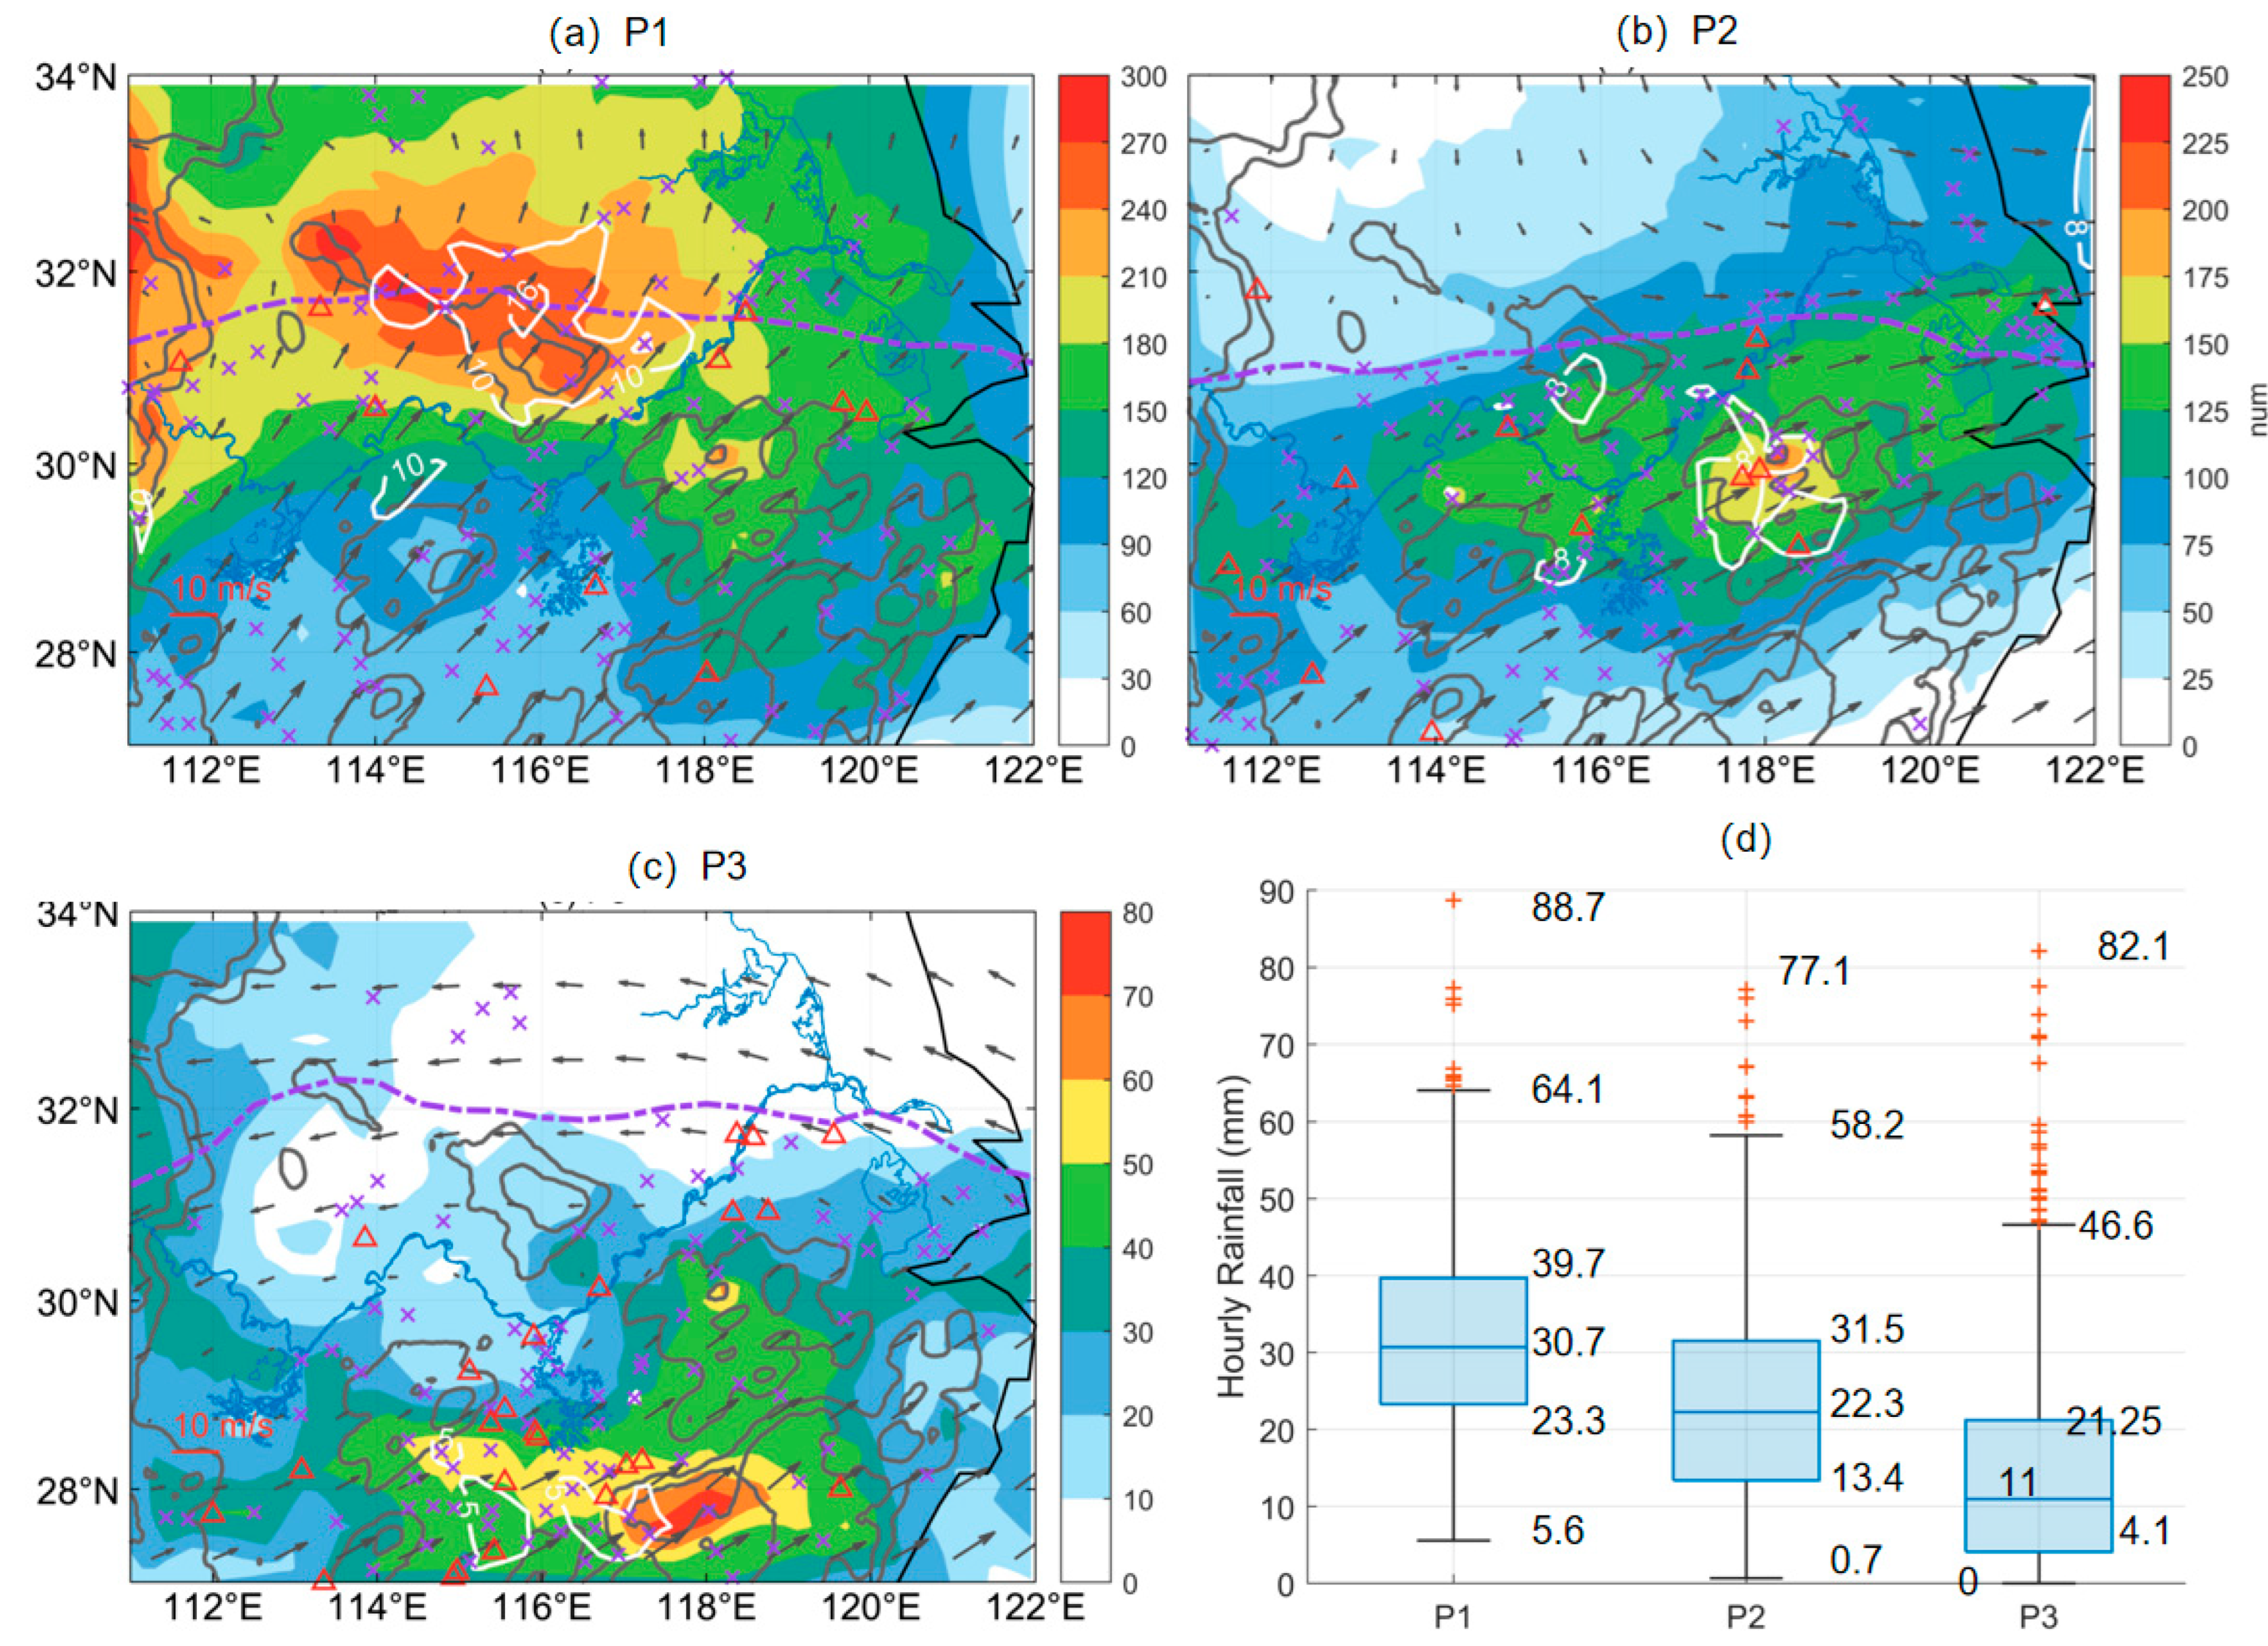
To separate the effect of the hourly rainfall frequency under different synoptic patterns on shaping the spatial distribution of the 2020 Meiyu rainfall, the hourly rainfall (≥0.1 mm h
−1) frequency and the center of the hourly heavy rainfall (≥15 mm h
−1) frequency are spatially shown in
Figure 11a–c. In addition, a box and whisker plot of the maximum hourly rain rates at the 480 rain gauges within the YHRB under P1, P2, and P3 are presented (
Figure 11d). Rain gauges that recorded the hourly rainfall over the 25th quantile and the maximum outlier are labeled in
Figure 11a,c, so that the spread of the most intense rainfalls under each synoptic pattern are illustrated.
In general, the hourly rainfall frequency (
Figure 11) exhibited a similar distribution to the accumulated rainfall under each pattern (
Figure 4). Rain gauges within the YHRB under P1 (
Figure 11a) widely observed an hourly rainfall frequency of more than 90 counts, with the maximum frequency reaching 300 counts around the Dabie mountains. The hourly heavy rainfall was also more frequent near the average location of the Meiyu front and over terrain, indicating a possible orographic enhancement under steady impinging southwesterlies. Moreover, 75% of the rain gauges had a maximum hourly rain rate (
Figure 11d) of over 20 mm h
−1 and intense hourly rainfalls over the 25th quantile, and the maximum outlier was widely observed in the warm sector of the YHRB under P1, suggesting that the rainfall system producing hourly rainfalls was also widely dispersed to the south of the Meiyu front under P1.
The hourly rainfall frequency and the center of the hourly heavy rainfall frequency were concentrated to the south of the Meiyu front under P2, along the convergence line. In addition, they were enhanced on the upslopes and mountaintop of the Huang mountains (
Figure 11b). Compared with P1, less rain gauges under P2 recorded the maximum hourly rainfall over the threshold of hourly heavy rainfalls (≥15 mm h
−1), due to the less frequent rainfalls in the dry sector to the north of the convergence line. Rain gauges that observed hourly rainfalls over the 25th quantile were concentrated to the south of the convergence line, along with the steady southwesterlies.
The hourly rainfall under P3 was further limited to the south of the vortex within the YHRB, and the maximum hourly rainfall frequency was on the slope of the Huang mountains (
Figure 11c). Abundant moisture supplied by the strong southerlies was restricted to the south of the horizonal shearline (
Figure 7a), producing a localized rainfall distribution. In addition, P3 had the lowest portion of rain gauges, recording a maximum hourly rainfall over 15 mm h
−1, but had the most records beyond the maximum outliers, which were distributed in the southeast quadrant of the average location of the vortex. The maximum hourly rain rate under P3 was 82.1 mm h
−1, close to that of 88.7 mm h
−1 under P1. The hourly rainfall feature under P3 indicated that the quasi-stationary meso-vortex not only extended the duration of rainfall episodes (
Figure 10) but also increased the hourly rainfall frequency and produced localized intense rainfalls.
5. Contribution from Hourly Rainfall to Meiyu Anomaly
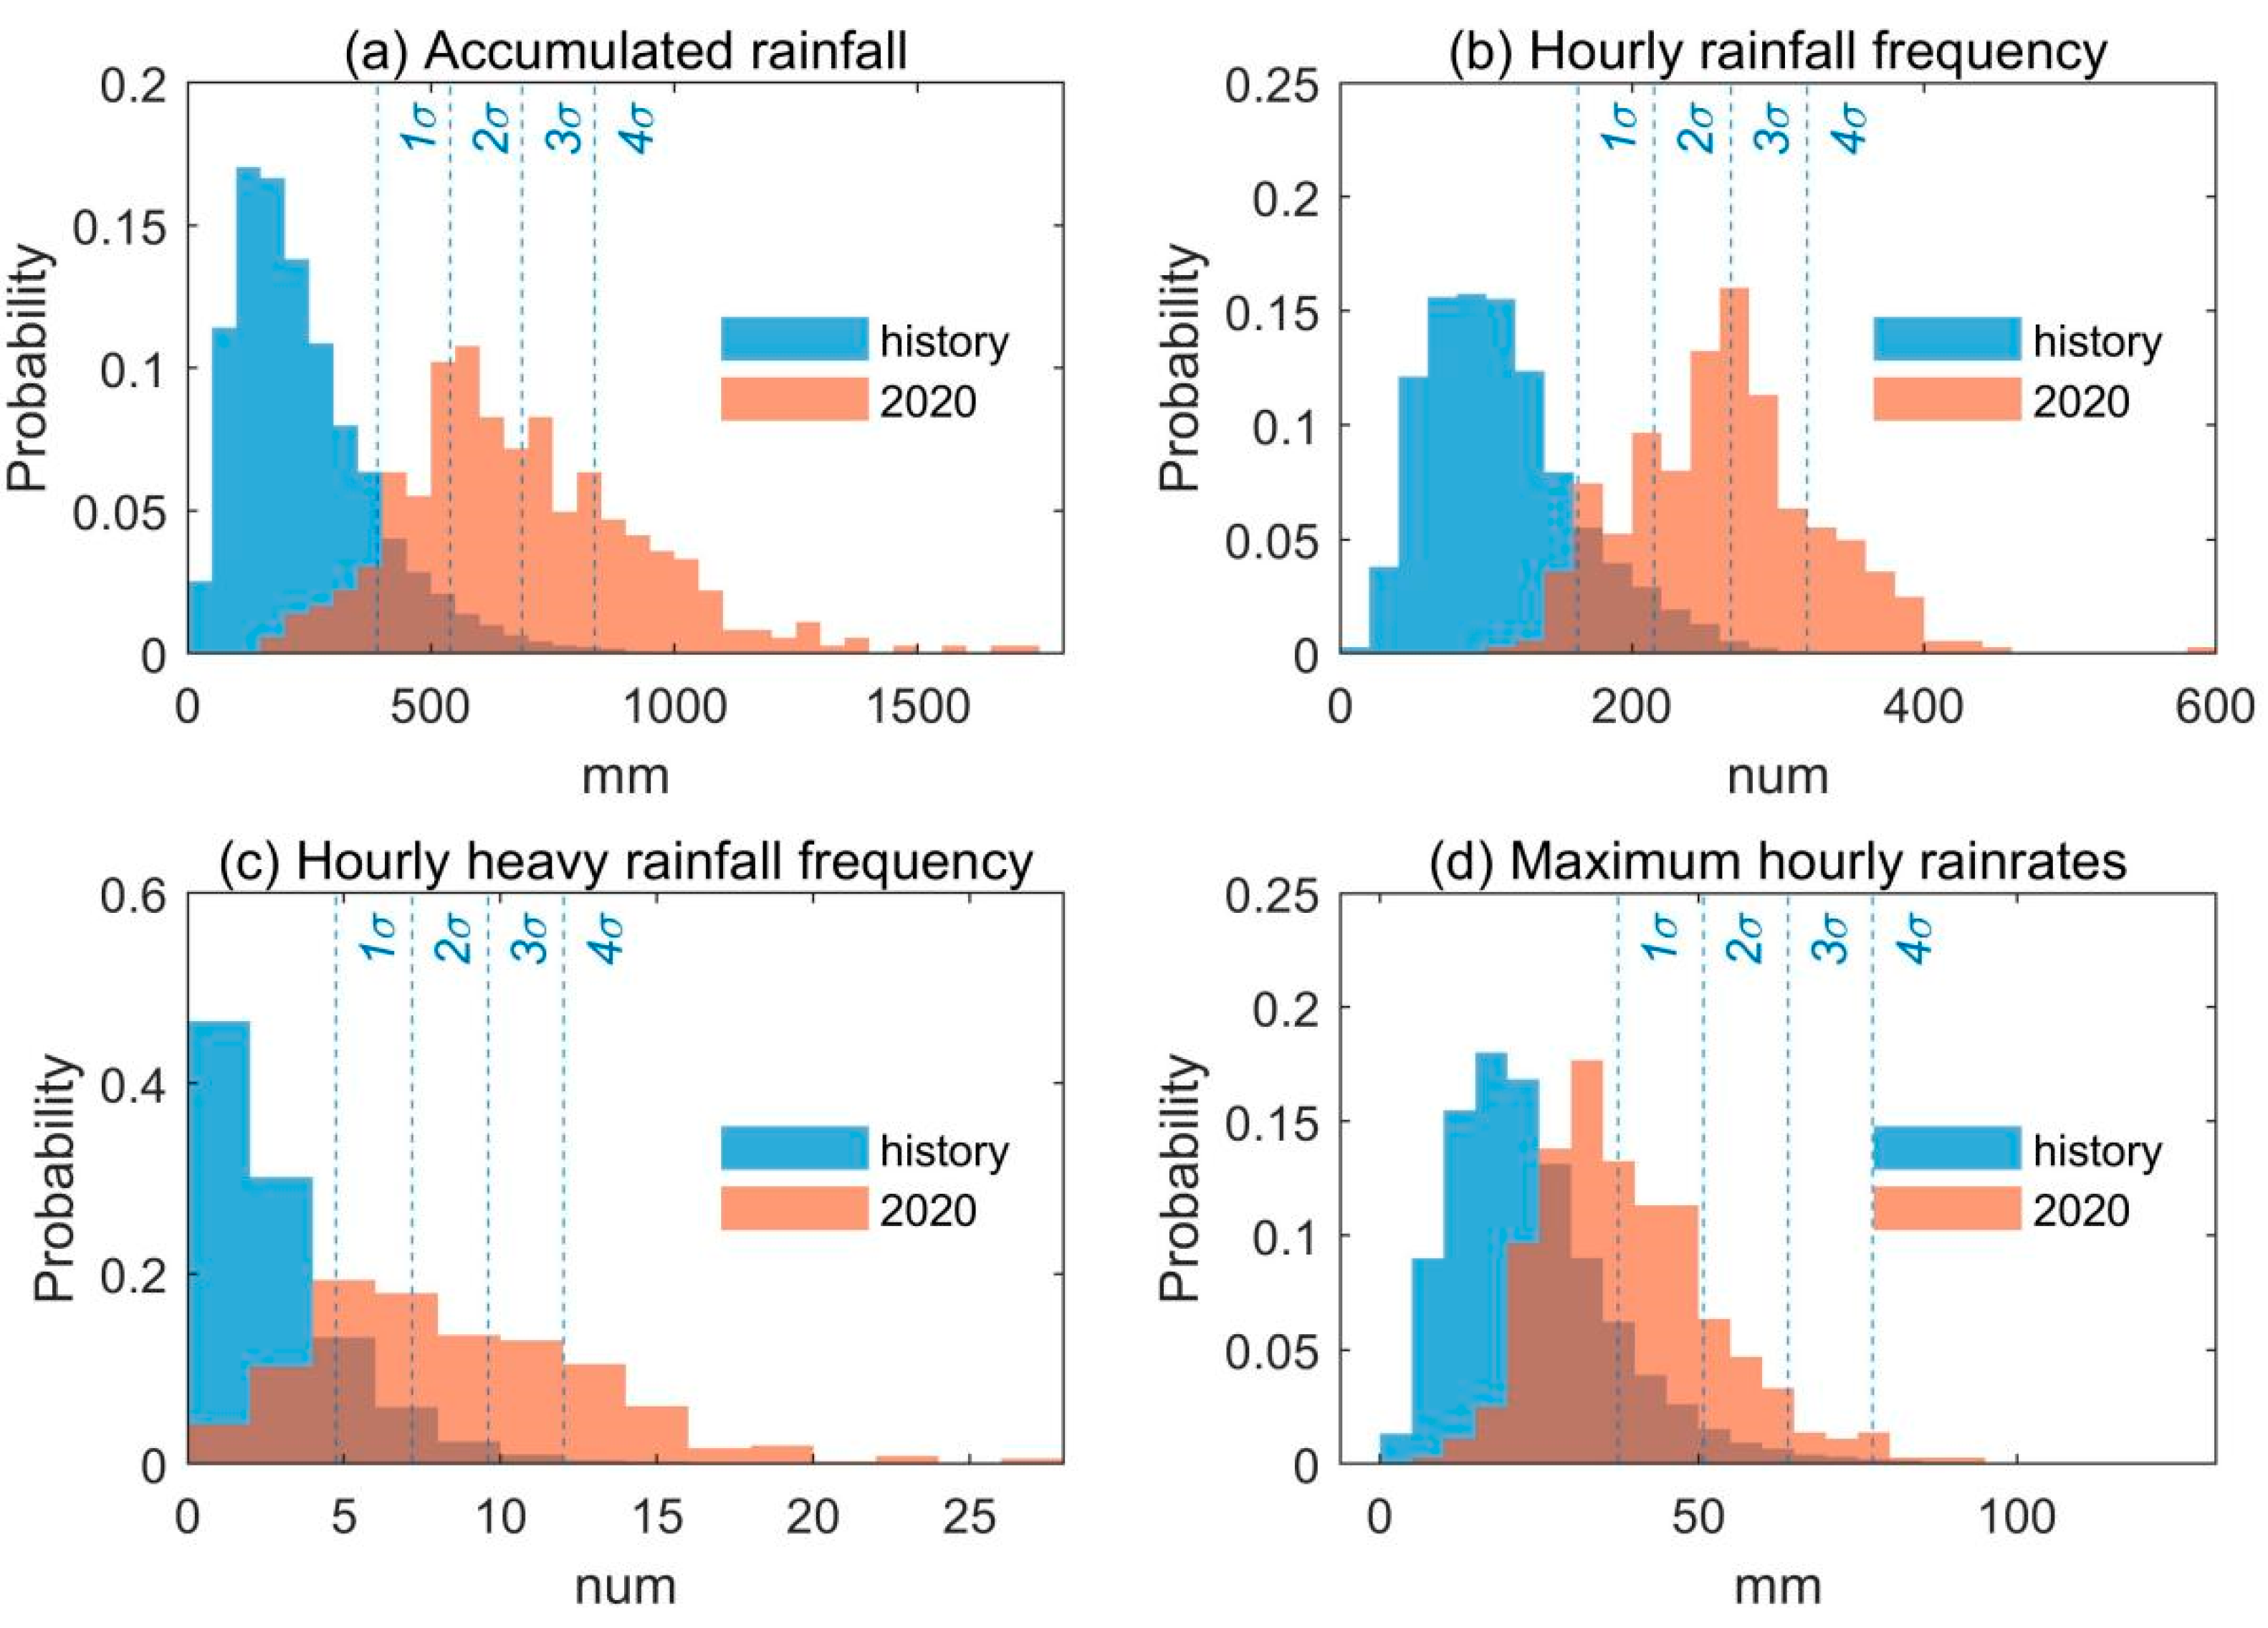
Rain intensity or rainfall frequency may have both contributed to the 2020 Meiyu rainfall anomaly and are analyzed in this section. Because historical rainfall data at a 1m interval (R1m) were not available, and considering the sub-hourly rainfall occurrences were included in the hourly rainfall occurrence, the analysis in this section is based on R1h, and the deviation was calculated using the 2020 Meiyu season from the climate mean of 1980–2019. The probability density distributions were calculated using the accumulated rainfall (
Figure 12a), the hourly rainfall frequency (
Figure 12b), the hourly heavy rainfall frequency (
Figure 12c), and the maximum hourly rainfall rates (
Figure 12d).
As presented in
Figure 12a, the accumulated rainfall records from the national rain gauges in the YHRB during June–July 2020 deviated significantly from the climate mean of the Meiyu seasons in 1980–2019, with 93.9% of the rain gauges recording an accumulated rainfall over one standard deviation and 52.2% over three standard deviations higher than the mean. Similarly, a large percentage of rain gauges recorded much more frequent hourly rainfalls than the historical data show (
Figure 12b). Overall, 93.1% of the rain gauges exhibited an hourly frequency deviation over one standard deviation and 56.1% over three standard deviations (
Figure 12b) higher than the climate mean. The increase in the hourly rainfall frequency also enhanced the probability of hourly heavy rainfalls (
Figure 12c), with 80.1% of the rain gauges in June–July 2020, exceeding one standard deviation of the historical mean data. In comparison, the maximum hourly rainfall intensity was not as anomalous as the rainfall frequency (
Figure 12d), with a smaller portion of the rain gauges recording similar levels of deviation, i.e., 49.7% of the rain gauges recorded maximum hourly rainfall rates over one standard deviation higher than the mean and only 8.6% over three standard deviations higher (
Figure 12c). The above comparison emphasizes the contribution of the hourly rainfall frequency to the 2020 Meiyu rainfall anomaly.
The spatial correlation between anomalies of the accumulated rainfall and the hourly rainfall frequency is demonstrated in
Figure 13. The deviation of the accumulated rainfall (shading) and the sub-hourly frequency (red contours) both depict large values in the middle and lower reaches of the Yangtze River and the two maximum centers at the Huang and Dabie mountains. This pattern almost overlaps with that of the accumulated rainfall distribution over the YHRB (Fig 1), that is to say, the accumulated rainfall centers in the 2020 Meiyu season were the areas with more frequent hourly rainfalls than shown in the historical data, suggesting that hourly rainfall frequency contributed to the total rainfall anomaly.
In addition, the rain gauges with an hourly rainfall intensity exceeding two standard deviations (18.0%) and an hourly rainfall frequency exceeding four standard deviations (30.6%) are marked in
Figure 13. These thresholds of standard deviation were selected so that sufficient samples with relatively extreme values in each group were included. The rain gauges with a large hourly rainfall frequency (grey crosses) were distributed in areas that experienced an abundant accumulated rainfall anomaly. Moreover, the records of maximum hourly rainfall (grey squares) were widely dispersed in the YHRB, with no significant spatial correlation with the accumulated rainfall distribution. The maximum hourly rainfall records may have been produced by individual rainfall events and may lack universality in contributing to the accumulated Meiyu rainfall in 2020. In summary, the hourly rainfall frequency is indispensable to understanding the accumulated rainfall in 2020.
6. Summary and Conclusions
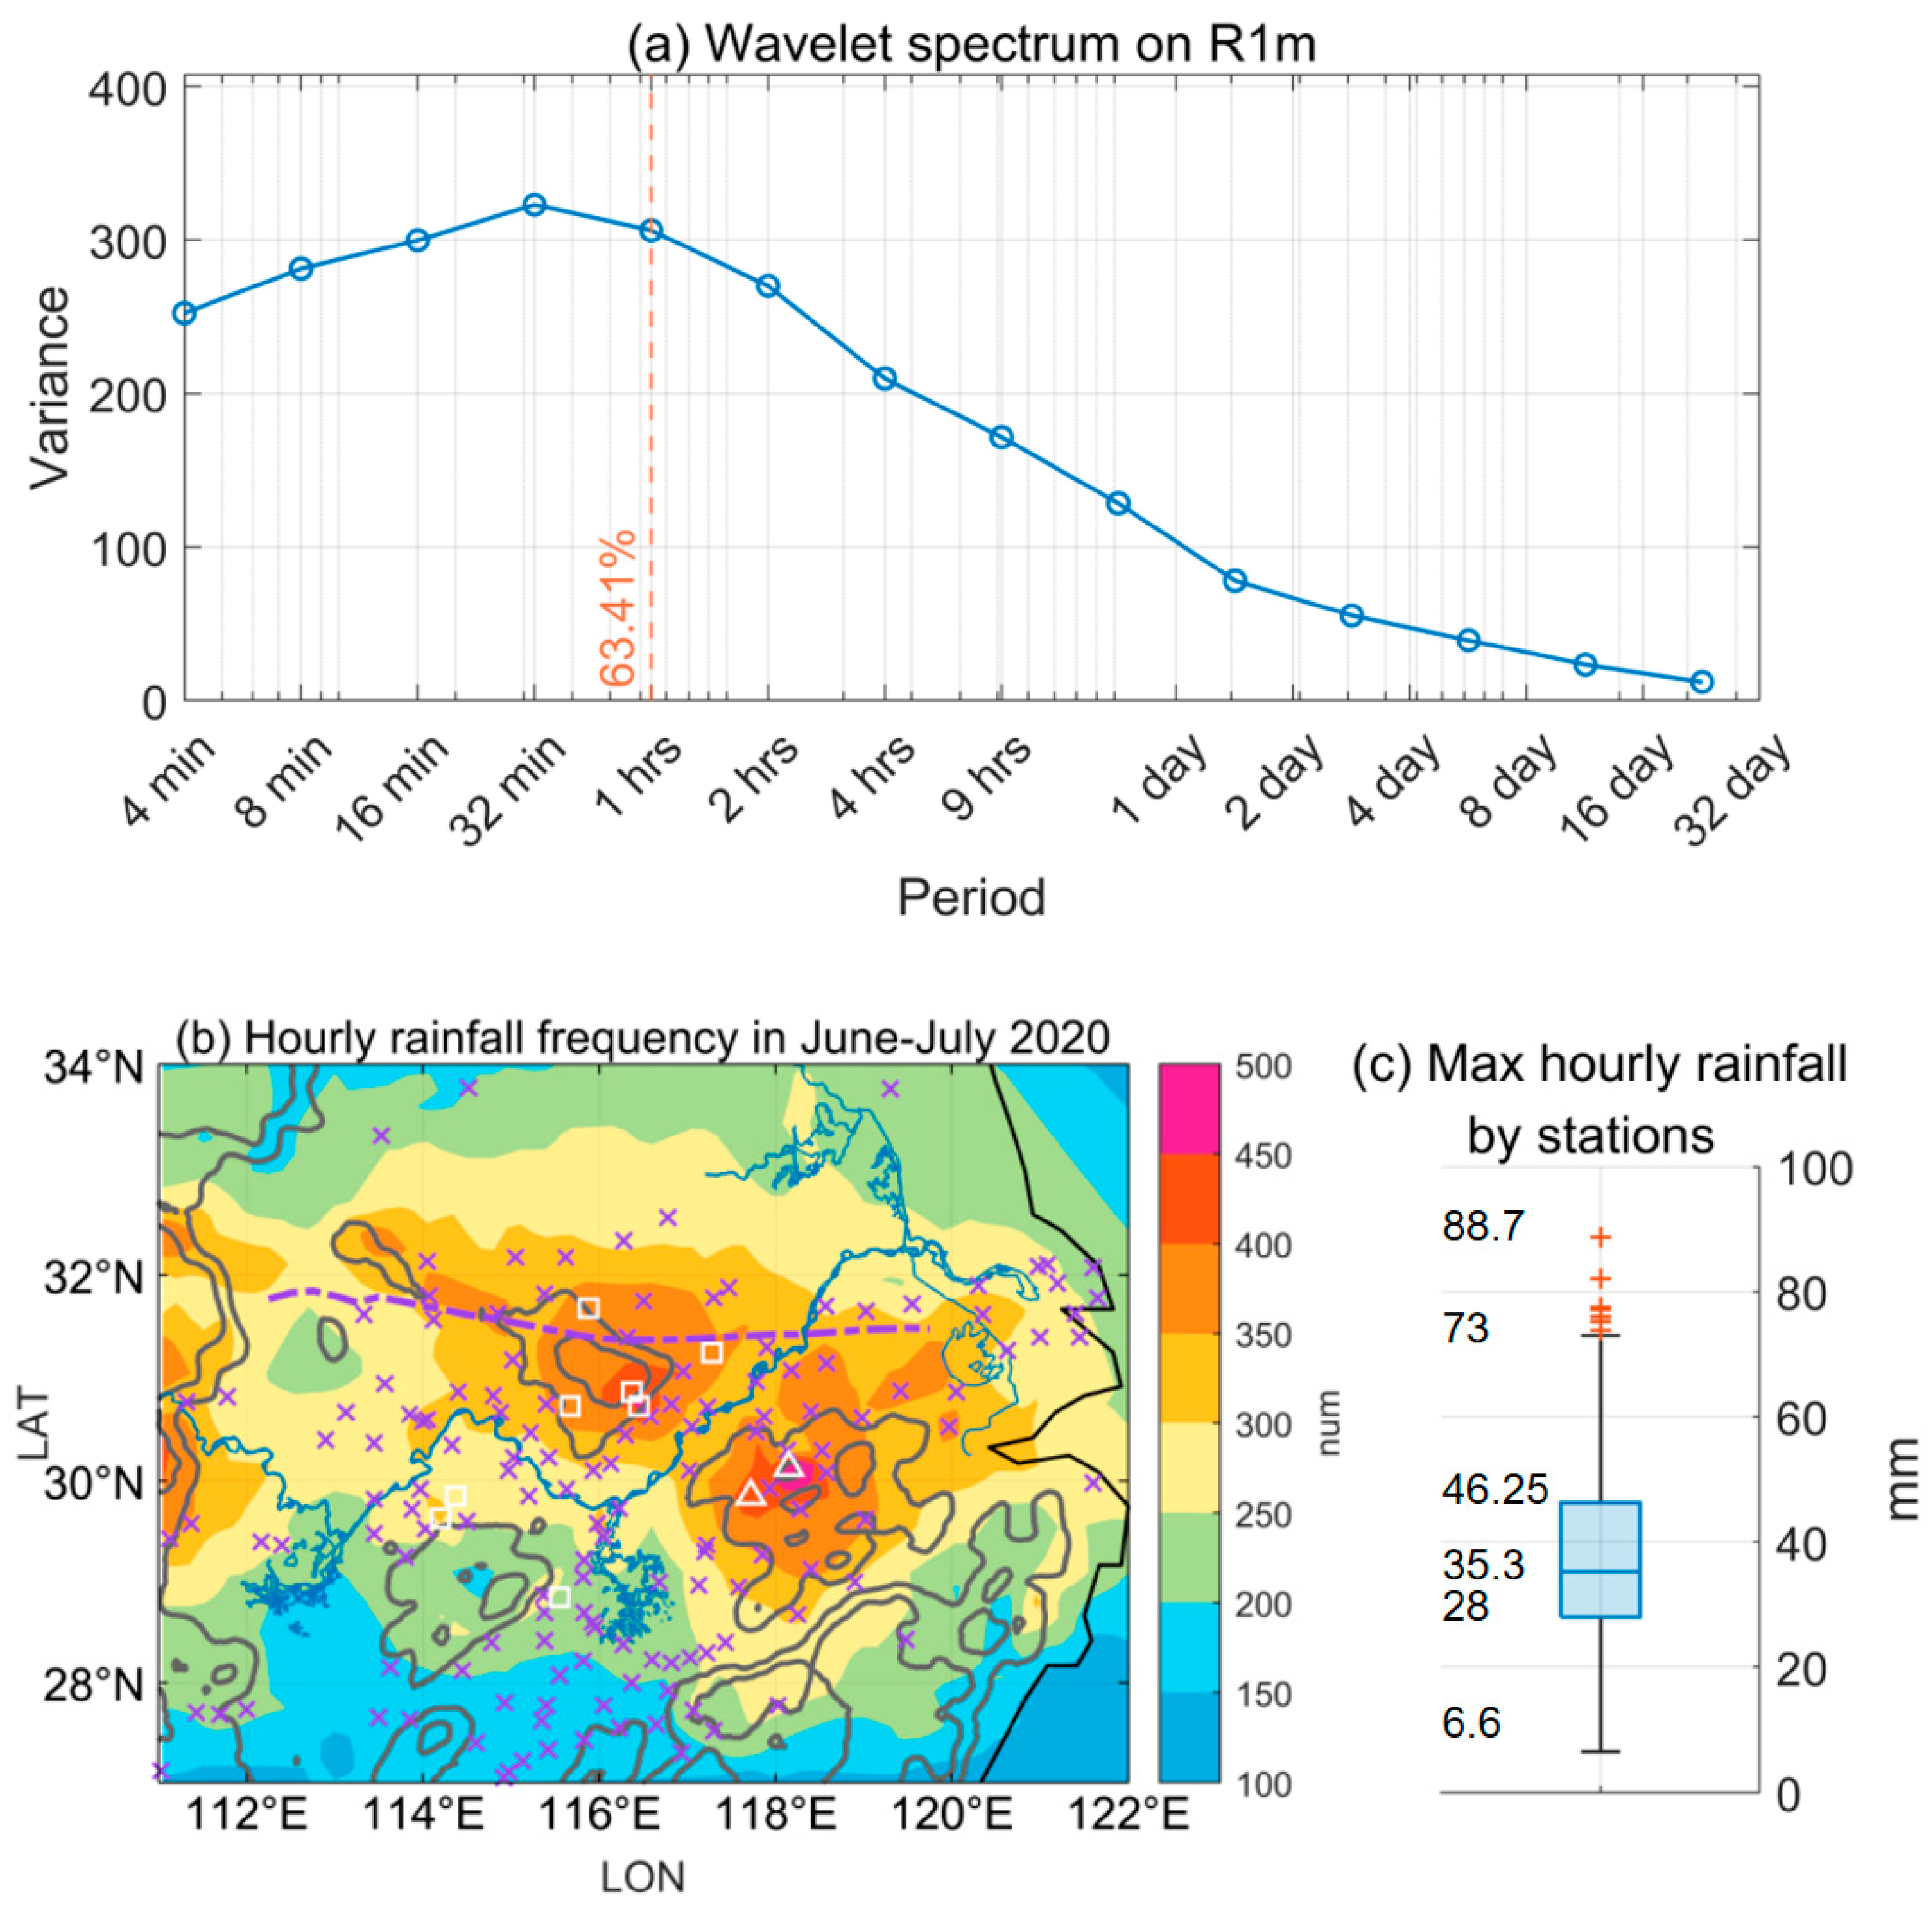
A record-breaking abundant rainfall was observed in the YHRB during the extra-long 2020 Meiyu season. Firstly, the features of hourly and sub-hourly rainfalls and their contribution to the Meiyu rainfall in 2020 were investigated. The accumulated rainfall and the hourly rainfall frequency overlapped significantly in spatial distribution, intuitively suggesting the importance of hourly rainfall frequency to the total anomaly. The role of sub-hourly and hourly rainfalls was further quantitatively confirmed via the energy decomposition of R1m over the YHRB., i.e., 63.4% of the Meiyu rainfall expectation in 2020 was from sub-hourly and hourly rainfalls.
Distinct rainfall features on the sub-hourly and hourly scales were associated with hourly synoptic variations, such as steady southwesterlies, mid-latitude disturbance, and eastward-moving southwest vortices. Using the PCT method, representative synoptic patterns of P1, P2, and P3 were objectively summarized, and rainfall features under each were analyzed.
When the YHRB was mostly under steady southwesterlies without a strong synoptic disturbance (trough/vortex), the circulation patterns were likely to be categorized as P1. Under P1, the Meiyu front was around 31–32° N, the WPSH extended northwestward, and sufficient moisture was conveyed into the YHRB by a low-level wind. The relatively uniform dynamic and thermal-dynamic environment of P1 produced short-term and dispersed rainfalls within the YHRB. Compared with the others, these rainfall episodes had the shortest time scale, with a 70.4% expectation from the sub-hourly to hourly scale. The accumulated rainfall and hourly rainfall frequency were widely distributed in the warm sector of P1 and enhanced near the dense isothermal line of the equivalent potential temperature and terrain. With the highest frequency of P1 being 56.3%, the accumulation of short-term rainfalls significantly contributed to the total rainfall in the 2020 Meiyu season.
In addition to the weak-forcing hours of P1, the YHRB was frequently affected by sets of eastward-moving disturbances in the mid-latitude and from southwest during the 2020 Meiyu season. If the approaching trough/vortices were to the north of the YHRB, the region was affected by the post-trough northerly. The dry northerly and moist southwesterly converged near 31° N on average, and the Meiyu front intensified with a stronger horizontal gradient of the equivalent potential temperature. This pattern had an occurrence of 30.6% in June–July 2020 and was classified as P2. The strong synoptic forcing under P2 favored the upward motion and brought concentrated rainfall clusters along the convergence line. The duration of rainfall episodes was extended under P2 compared to P1, and the percentage of sub-hourly and hourly rainfalls in the energy analysis was reduced to 59.8%, with most rainfall expectations within the time scale of ~30 min–1 h.
Once the eastward-moving southwest vortices entered the YHRB, the area was occupied by a quasi-stationary cyclonic wind flow at a low level and significant vertical lifting. This distinct pattern was classified as P3, which was the least frequent type (7.5%) from those studied. Nevertheless, it generated intense and localized rainfalls in the southern quadrant of the horizontal shear line, where the moisture was strongly confined. In terms of duration, rainfall episodes under P3 were elongated, with a maximum variance of 1–4 h, which is distinctively longer than those under P1 or P2.
The time series of hourly synoptic variations during the 2020 Meiyu season can be interpreted via the alternation between the major patterns. Scattered short-term rainfalls were mostly observed under the warm sector of P1. Heavy rainfalls were likely to occur under P3 or during the quick alternation between P1 and P2. Overall, more than half of the rainfall expectations under each pattern were from the sub-hourly and hourly scales. In addition, the role of short-term rainfalls was examined in relation to the 2020 accumulated rainfall anomaly. In comparison with the climate mean of the Meiyu seasons in 1980–2019, the 2020 season exhibited a positive deviation above one sigma for the hourly rainfall frequency and the hourly heavy rainfall frequency, as recorded by more than 80% of the rain gauges within the YHRB. This result emphasizes the indispensable role of hourly rainfall frequency in understanding the accumulated rainfall anomaly in 2020.
The sub-hourly and hourly rainfalls during the 2020 Meiyu season can be further analyzed in association with the meso-scale convective process. The features and occurrence of convective cells, meso-scale convective systems, and the mechanism of convective initiation under each synoptic pattern, can be investigated in detail. In addition, the effect of the terrain in terms of rainfall enhancement or orographic blocking is worth examining in the future.


