Article

Machine Learning and Physics-Based Hybridization Models for Evaluation of the Effects of Climate Change and Urban Expansion on Photosynthetically Active Radiation

by
Samuel Chukwujindu Nwokolo
1,*,
Nikolaos Proutsos
2,
Edson L. Meyer
3 and
Chinedu Christian Ahia
3
1
Department of Physics, Faculty of Physical Sciences, University of Calabar, Calabar 540004, Nigeria
2
Institute of Mediterranean Forest Ecosystems, Hellenic Agricultural Organization “Demeter”, Terma Alkmanos, 11528 Athens, Greece
3
Fort Hare Institute of Technology, University of Fort Hare, Private Bag X1314, Alice 5700, South Africa
*
Author to whom correspondence should be addressed.
Atmosphere 2023, 14(4), 687; https://doi.org/10.3390/atmos14040687
Submission received: 15 March 2023 / Revised: 4 April 2023 / Accepted: 4 April 2023 / Published: 5 April 2023
(This article belongs to the Special Issue Atmospheric Radiative Transfer and Remote Sensing)

Abstract

:
Given the interdependence of climate change (CLC) and urban expansion (URE) on ecosystem productivity in China and India, hybrid physics-based models were fitted in this study to evaluate the effects of these variables on photosynthetically active radiation (PAR). This was accomplished by interpolating the most recent five general circulation models (GCMs) from coupled model intercomparison project phase 6 (CMIP6) into the CMIP6 multi-ensemble model. The potential of PAR is projected to increase by 0.001 to 2.077% in China and by 0.002 to 6.737% in India, on a seasonal and annual basis, if the warming is kept at 1.5 °C from now until the end of this century. The effects of CLC and URE on the changes in PAR in China and India were investigated, and URE had a greater impact than CLC when compared to effective contributions, with 49.47% for China and 28.41% for India in the entire case scenario. In contrast, CLC and PAR residual factor (PRF) have a greater impact in India than in China, with effects of 13.79% and 57.79% compared to 0.89% and 49.64%, respectively. Preferences for exotic, high-productivity plant species, irrigation, CO2 fertilization, and nitrogen deposition are suggested as measures for replenishing PAR in both countries.

1. Introduction

Photosynthetically active radiation, or PAR, is the component of solar irradiance at wavelengths of 400–700 nm that is preferable, preferably absorbed by plants for photosynthesis. PAR regulates Earth’s climate since it is absorbed by plant tissues for food and oxygen production, impacting warming through heat transfer processes. Additionally, PAR is important in the global water cycle, as photosynthesis drives the processes of evaporation and transpiration. PAR is thus a vital part of the Earth’s climate system, helping to maintain global temperatures, driving the water cycle, and ensuring that there is enough oxygen and food available for life on Earth to survive. Despite the importance of PAR, there are still gaps in our understanding of its role in regulating the Earth’s climate, imposing the need for further research on how PAR affects global and local climate patterns.
PAR is essential for the assessment of crop yields [1] as well as for monitoring vegetation health [2], land degradation [3], desertification [4], and related processes [5]. In addition, PAR can be used to measure the effect of changes in the environment due to deforestation [6], irrigation [7], and other human activities in ecosystems [8], as well as to track the effects of natural disasters such as hurricanes [9] and floods [10] on the environment. Thus, PAR is a multifaceted tool for monitoring and assessing the environmental impact of human activity as well as natural disasters, and its importance cannot be underestimated [11]. It is therefore an invaluable resource for understanding and predicting environmental changes and can be used to identify potential solutions to mitigate these impacts, prevent further degradation of the environment, and ultimately help protect the health and wellbeing of all living organisms on our planet.
To ensure global food security, the collaborative efforts of farmers, research institutions, and academia must be focused on developing ecophysiological models to effectively predict the global ecosystem and model carbon cycles for their efficiency in addressing the global food security crisis [12]. By leveraging data and improving research, farmers, research institutions, and academia have the potential to establish a more accurate understanding of the global ecosystem and develop more reliable models for predicting the long-term sustainability of our global food supply.
Accurate PAR data is critical to understanding the global carbon cycle [13] and its relationship with gross primary productivity, GPP [14], so that a precise determination of the contribution of GPP to global climate change can be made. As the impact of climate change on the planet intensifies, understanding GPP and its relationship to PAR has become increasingly important over the past several decades [15]. In order to achieve an accurate and complete understanding of PAR, sophisticated methods for data analysis need to be employed to ensure that the data accurately reflects GPP’s contribution to climate change. Ultimately, this requires the use of cutting-edge technology such as remote sensing devices, computer algorithms [16], and cloud computing [17] to accurately analyse and store data in a manner that is both timely and cost-effective. While this challenge of accurately assessing and recording PAR data is a daunting one, there are certain measures that can be taken to ensure its accuracy and reliability, such as employing advanced statistical methods, calibrating devices regularly [18], and using models [19] to predict future GPP behavior in order to make informed decisions about mitigating climate change.
PAR data is expected to be increasingly valuable in the next few years, as climate change becomes an ever-growing global issue, because understanding the underlying contributing factors is of paramount importance to successfully combating the climate crisis. Thus, it is essential that scientists and researchers are able to accurately measure and record PAR in order to understand the effects of climate change on the environment and to make informed decisions about how best to combat it in a cost-effective and timely manner.
There are a number of global PAR datasets with a fair amount of accuracy based on satellite data, including the Global Land Cover Facility [20], the Breathing Earth System Simulator [21], and the Japan Aerospace Exploration Agency (JAXA) satellite monitoring program for environmental studies [22]. These datasets provide an unprecedented level of accuracy, allowing researchers to map the Earth’s PAR fluxes in ways previously not possible at large scales. The availability of global PAR datasets today provides an unparalleled level of accuracy, not only for mapping the PAR fluxes but also for a broad range of fields such as ecology [23], hydrology [24], and climatology [25]. The improved data accuracy has enabled researchers to make precise estimations and predictions in these fields, to better understand how PAR changes will affect ecosystems and future climate [26] and to assess the solar energy resource availability [27] at local and global scales.
The limited availability of historical PAR data, especially before the 1990s, is a drawback for assessing the long-term impacts of the changing climate on natural and agricultural ecosystems. This is a limiting factor for the accuracy of predictions about future ecosystem responses to climate change and also for the development of effective strategies for habitat conservation and management. On the other hand, satellite data can produce highly accurate spatial patterns. By combining satellite-based PAR datasets with data on other environmental parameters such as soil moisture [28], precipitation [29], and temperature [30], researchers can gain a more complete picture of how ecosystems are responding to climate change and how changes in the environment may impact species composition [31], food webs [32], and other complex ecological relationships [33].
Hao et al. [34] recently investigated the daily and hourly land surface downward shortwave and PAR performances of numerous satellite and in situ monitoring networks in various locations around the world, and found that NASA’s Deep Space Climate Observatory (DSCOVER) and Earth Polychromatic Imaging Camera (EPIC) 1.2 atmospheric and cloud products perform better than in situ observation networks such as the Baseline Surface Radiation Network (BSRN) and the Surface Radiation Budget Network (SURFRAD), and the Earth’s Radiant Energy System Synoptic (CERES), GLASS, BESS, ISCCP-FD, and GEWEX-SRB data. The same authors discovered that NASA DSCOVER/EPIC displays comparable geographic variability and latitudinal gradient distribution when compared to CERES data [35].
Despite DSCOVER/EPIC and CERES having similar performance, it is worth noting that DSCOVER/EPIC outperforms in situ observation networks such as BSRN and SURFRAD. The authors found that while all of the data sources performed similarly at larger scales, DSCOVER and EPIC still outperformed in situ observation networks due to their higher spatial and temporal resolutions and their capability for capturing more detailed features at a finer spatial resolution. This is due to the fact that DSCOVER and EPIC are able to better detect and distinguish small-scale cloud and atmospheric features, leading to more accurate estimates of the surface radiation budget, which is critical for climate studies and climate model validation.
Moon [36] discovered that the PAR/H conversion ratio was relatively constant, regardless of the latitude or season of the year. He proposed that this constant ratio applied to fluxes of global solar radiation (H), which was later found to be true to an extent by several researchers [37,38]. These researchers found that the ratio proposed by Moon [36] still holds true, as they calculated that PAR is 0.45 to 0.46 times the flux of global solar radiation, depending on the season, which is consistent with the ratio proposed by Moon [36]. These findings by Nwokolo and Amadi [37] provide further evidence of the pioneering work done by Moon [36]—which established that PAR can be generated from fluxes of global solar radiation—in their global review study on PAR ratio, which resulted in significant advances in our understanding of solar radiation and its implications for photosynthesis and the photosynthetic productivity of plants. Since the discovery by Moon [36], there have been numerous advances in understanding the process of photosynthesis, its implications on global solar radiation, and its effects on the photosynthetic productivity of plants, which can be attributed to his pioneering work.
The conversion from the global solar radiation datasets, which have been recorded since 1900 with frequent intervals [39,40], is the only way to predict solar fluxes in the past due to the extreme scarcity of PAR data globally. For instance, since 1979, a monthly dataset on the world’s solar radiation (H) has been made available by the interim reanalysis of the ERA [32]. Since 1958, the JRA55 reanalysis has provided solar fluxes, and NCEP/NCAR has done so since 1948 [41]. Global ecosystem models have used and converted these datasets of solar radiation to PAR [42]. The conversion process is not without its issues, however, as the uncertainties associated with these datasets can be substantial and cause errors in model simulations if not accounted for. Thus, careful attention must be paid to the accuracy of solar radiation datasets and how they are converted into photosynthetically active radiation for use in global ecosystem models.
To ensure accuracy and prevent errors in model simulations, global ecosystem models should not rely solely on the conversion of datasets for solar radiation to PAR [41]. Instead, a combination of satellite data and ground observations can be used to validate the conversion process and make sure that the correct data is being used in the models. This combination of satellite data and ground observations allows for the validation of datasets as well as confirmation that they accurately represent solar radiation before they are converted into PAR for use in global ecosystem models. This allows for greater accuracy in the models and reduces the likelihood of errors in simulations, which can have far reaching impacts on global ecosystems. In addition, data from other sources, such as remotely sensed vegetation indices, can be used to further validate the datasets before they are converted and used in global ecosystem models.
Various researchers have used empirical [43,44,45], machine learning [46], and numerical methods [47,48,49] to predict PAR in all-sky weather conditions. This might be explained by the fact that, in contrast to other weather-solar parameters such as the length of the sunshine, relative humidity, minimum and maximum temperatures, the amount of clouds and precipitation, etc., radiometric fluxes are less frequently measured in most weather stations around the world. Furthermore, this makes it difficult to establish correlations between radiometric fluxes and PAR with other weather-solar parameters [50], which limits the accuracy of empirical models to predict PAR in all-sky conditions and calls for the development of machine learning and numerical models, which can be more accurate in forecasting PAR in the presence of clouds. Despite the challenges of accurately predicting PAR in all-sky weather conditions, researchers have made significant advances in the use of machine learning and numerical methods to develop accurate models for this purpose and have shown that these models are able to accurately predict PAR with a greater degree of accuracy than traditional empirical models in many cases. In particular, the use of machine learning and numerical models has enabled researchers to more accurately predict PAR in all-sky weather conditions due to their ability to capture non-linear relationships between radiometric fluxes and other weather-solar parameters than traditional empirical models can, which makes it possible to more accurately predict PAR in different weather conditions with greater accuracy.
In relation to PAR prediction and forecast, achieving sustainable international goals such as disaster preparedness, greenhouse gas mitigation, and sustainable development plans calls for a significant reduction in the error indicators of empirical, machine learning, and numerical approaches, as well as the development of new methods to predict and project PAR potential using cutting-edge crop and climate models. Such a reduction in error indicators and the development of new predictive methods would enable accurate, reliable PAR prediction and forecasting, which is key to achieving sustainable international goals accurately and efficiently. By accurately predicting and forecasting PAR potential, we can reduce the risk of suffering a natural disaster or other environmental consequence, provide the necessary resources to sustainably develop regions prone to agricultural failure, mitigate greenhouse gas emissions to protect the environment, and maintain a healthy and sustainable future for all.
It is critical to remember that no model based on any parameter can surpass the PAR predictions. Given that each of the aforementioned methods necessitates a distinct set of input variables, the cost of the evaluation soars. This increases the importance of selecting the appropriate parameter and model that is not only the most cost-effective but also efficient in its ability to accurately predict PAR. The most important point to consider when selecting a model for predicting PAR is that accuracy should not be sacrificed in the name of cost-effectiveness.
The MLP-CARIMA-GPM approach, which was not previously used to predict PAR but produces a higher-level predictive capacity comparable to existing hybrid machine learning approaches, was employed to estimate PAR in this work. The MLP-CARIMA-GPM approach is capable of predicting high accuracy PAR fluxes without the need for expensive satellite imagery or manual labor to monitor environmental conditions over large areas on the ground.
The externalities of global climate change affect all solar energy sources and the parameters derived from them, including PAR. The degree to which these externalities affect PAR fluxes and the ways in which they are absorbed and converted into photosynthetic energy vary from region to region and depend on a variety of factors, such as local weather patterns, vegetation cover, air pollution levels, and surface albedo effects.
The results of PAR assessments can also vary greatly because the accuracy of climate simulations is typically dependent on the model’s accuracy and assumptions. Therefore, research examining the reality of climate change effects on PAR fluxes using the most recent Coupled Model Intercomposition Project Phase Six (CMIP6) is crucial. Since CMIP6 models offer more accurate estimations of current climate conditions, they are better able to predict future climatic effects on plant growth and PAR fluxes compared to CMIP5 models due to more sophisticated parameterizations, higher resolution, and an improved representation of aerosols and clouds. In addition, the improved resolution of CMIP6 allows for a better representation of regional climate change due to its ability to capture finer scale features such as changing weather patterns and land cover changes. Therefore, applying the CMIP6 model is useful for understanding the effects of climate change on plant growth and PAR and predicting how these effects will interact with the growth of vegetation over time in order to better understand the implications of climate change on vegetation growth and ecosystem functioning in the future.
Specifically, this study aims to identify the impact of climate change on PAR flux potentials and additionally evaluate which fitted novel hybrid MLP-CARIMA-GPM PAR prediction model can best capture likely climate effects in China and India up until the end of this century. To achieve this goal, the climate-induced changes in PAR in the near-future (2015–2049), far-future (2041–2099), and all-future (2015–2099) were simulated using an ensemble of Global Climate Models (GCMs) and the best-performing fitted novel hybrid MLP-CARIMA-GPM PAR prediction model was used to determine the future potential PAR flux projections in both China and India till the end of this century. The authors developed a computational model based on theoretical physics to isolate and account for the impacts of climate change and urban expansion (URE) on changes in PAR in the future (2015–2099) in China and India under various emission scenarios and under the assumption that changes in PAR productivity are attributed to climate change (CLC) and URE.
This study provides a valuable insight into the potential effects of climate change and urbanization on PAR over the next century and the implications that this may have for sustainable development in China and India. To predict PAR, several meteorological parameters were employed, and the influence of climate change and urban expansion on PAR fluxes for future emission scenarios was also investigated:
  • using a novel hybrid parameter-based strategy (MLP-CARIMA-GPM) to predict PAR;
  • using the most recent simulated CMIP6 multi-ensemble model interpolated from five GCMs CMIP6 models to quantify the effects of future climate change on PAR under various shared socioeconomic pathways (SSPs) for the near future (2015–2049), far future (2050–2099), and all future (2015–2099) in China and India;
  • by analyzing historical data (1984–2014), to assess the impacts of climate change and urbanization on PAR for the near (2015–2049) and far (2050–2099, 2015–2099) futures, considering also various shared socioeconomic pathways (SSPs).
  • The remaining sections of this study are as follows: Gumbel’s probabilistic method (GP), swapped ARIMA and controlled ARIMA models, boosting, bagging, and MLP models for PAR using meteo-solar parameters, as well as hybridization of the MLP, GPM, and ARIMA (MLP-CARIMA-GPM) models are all covered theoretically in Section 1. Section 2 provides details on positions, datasets, quality control checks, data pre-processing, and evaluation metrics. Model, configuration, performance, and reporting are presented in Section 3 along with a discussion of the results. The conclusions are discussed in Section 4. The conceptual/theoretical framework for the study’s primary focus, pertinent literature review studies, methodology, findings, and concluding remarks.

2. Materials and Methods

2.1. Meteorological Datasets

The National Aeronautics and Space Administration atmospheric science data center (NASA) provided the historical datasets of photosynthetically active radiation used in this study. NASA is responsible for archiving and distributing Earth science data related to the atmosphere, including data on aerosols, clouds, precipitation, and atmospheric chemistry. The climatological PAR and other atmospheric datasets can be downloaded as longitude-latitude specific point data between 2001 to 2021, at a mean monthly resolution, at: https://power.larc.nasa.gov/data-access-viewer/ (accessed on 14 March 2023).
PAR datasets from 3415 cities in China and from 889 cities in India were used in this work (Table 1 and Figure 1. The cities are available via an online country geographical coordinate assessment (https://www.countrycoordinate.com). To obtain generalized datasets for further analysis, the location-based datasets were processed by averaging all the locations in each country. Surface incoming shortwave radiation (global solar radiation, H in W/m2), incident shortwave radiation in the upper atmosphere (extraterrestrial radiation, Ho in W/m2), surface air temperature at 2 m height (Tave in °C), and near-surface relative humidity (%) with monthly spatial resolution were used as input parameters (Figure 1 and Table 1). The National Center for Meteorological Research, France (HadGEM3-GC31), the EC-Earth Consortium, Europe (EC-Earth3), the Centre for Climate Research, Indian Institute of Tropical Meteorology, India (IITM-ESM), the Beijing Climate Center Climate System Model (BCC-CSM2), and the National Oceanic and Atmospheric Administration, Geophysics and Fluid Dynamics Laboratory, USA (GFD-ESM4) were among the five global climate model (GCM) outputs that contributed to the Coupled Model Intercomparison Project Phase 6 (CMIP6) used in this study. The mathematical techniques described in Zheng et al. [51], were applied to produce the additional input parameters such as saturated vapor pressure (SVP in kPa), actual vapor pressure (AVP in kPa), and vapor pressure deficit (VPD in kPa) presented in Figure 1 and Table 1. The monthly extraterrestrial PAR (PARo) was estimated by using the following equation:
P A R o = 0.5 H o
The datasets the from the selected five global climate model (GCM) outputs were interpolated to generate a multi-model ensemble analysis based on the most recent climate projections so as to examine the spatial and temporal variability of the relevant energy variables over the 21st century, since most GCMs are likely to underestimate or overestimate climate datasets. This can be accomplished because different model outputs are accessible at different spatial resolutions (Table 2). The multi-model ensemble CMIP6 climate datasets generated in this study under different shared socioeconomic pathways (SSPs) such as SSP1-2.6 (hereafter SSP126), SSP2-4.5 (hereafter SSP245), and SSP5-8.5 (hereafter SSP585) in the near future (2015–2049), far future (2050–2099), and all-future (2015–2099), with respect to the historical climate data (1984–2014), were employed to evaluate the impacts of climate change on PAR productivity. The five GCMs were chosen based on the availability of pertinent meteo-solar variables for all SSPs created by the European Centre for Medium-Range Weather Forecasts (ECMWF, https://www.ecmwf.int/en/forecasts/datasets/reanalysis-datasets/era5) (accessed on 14 March 2023). The datasets were downloaded using latitudes that cut across North (38°) to South (8°), and West (68°) to East (98°) of India, as well as latitudes that cut across North (60°) to South (18°), and West (80°) to East (135°) of China under monthly time resolution.

2.2. Data Quality and Modeling

The scattering technique developed by Khorasanizadeh et al. [52] was used to test and verify the quality of the NASA satellite datasets used in this work, since they were the main configuration factors of the input. Datasets outside the range 0–1 were discarded, as shown in Figure 1, and the PAR ratio (RPAR = PAR/H) in the range 0–1 was used to model PAR. The 0–1 range of values used to generate the Gumbel probabilistic model (GPM) and hybridize the GPM with the controlled ARIMA model (CARIMA) and the multilayer perceptron artificial neural network (MLP) models established in the following sections is also set to correspond to this. As shown in Table 3, the datasets for China and India that were used to create the models—six machine learning models and three physics-based models—included empirical, PAR coefficient ratio (PCR), and hybrid MLP-CARIMA-GPM models that used a variety of input parameters and were implemented using IBM SPSS version 25 software. These datasets were split into two different groups. The models were tested for fit using the remaining 25% of the datasets after they had been trained on 75% of the total datasets. Hundred and ten (110) models using boosting, bagging, the multilayer perceptron artificial neural network model (MLP), and swapped ARIMA approaches were simulated in China and India using the same input and output configuration elements used for simulating controlled ARIMA (CARIMA) and empirical (44) models.

2.2.1. Empirical Approach

Empirical modeling is a type of regression analysis used in statistical modeling to analyze and predict complex real-world phenomena based on observed data. Evolutionary machine learning models, along with their evolving hybrid counterparts, have outperformed the performance of the earliest empirical method of predicting observed datasets. However, the empirical approach is used in this study to develop an array of models for predicting PAR productivity and to contrast them with other techniques already in use in China and India. Table 4 displays the results of this method’s estimation, or coefficients for China and India.

2.2.2. Auto-Regressive Integrated Moving Average (ARIMA) Approach

ARIMA is a type of machine learning model used for time series analysis, forecasting, and prediction. It uses statistical methods to identify patterns and trends in historical data and use those patterns to make predictions about future values in the series. However, they may not always provide accurate predictions if the data is too complex or unpredictable, and they require a significant amount of data cleaning and preprocessing in order to be effective. It is important for analysts to carefully evaluate the suitability of the model for their specific data before implementation, and to have a thorough understanding of the underlying statistical assumptions and limitations of the model when interpreting their results. ARIMA models are a useful starting point for time series analysis, but they are not suitable for all types of data and may require significant manipulation or transformation. Advanced modeling techniques such as neural networks or ensemble approaches may be necessary to achieve accurate predictions. ARIMA models assume that the time series data is stationary, but when the data is non-stationary, alternative models such as SARIMA can be used to address this issue. Non-stationary time series data can lead to inaccurate forecasts and predictions if not properly addressed. Proper pre-processing and transformation techniques can mitigate this issue and improve the performance of ARIMA or SARIMA models. In this study, the controlled ARIMA (CARIMA) and swapped ARIMA (SARIMA) approaches were used to predict PAR as described in our previous works [24,53,54,55]. The predictions are compared with the actual PAR values to evaluate the performance of the models. Table 5 displays the results of this CARIMA estimation, with coefficients for China and India.

2.2.3. Radial Basic Function

Radial basic function is a neural network model which uses radial basis functions as activation functions. These functions are typically gaussian or inverse quadratic functions and have the advantage of good approximation properties for smooth input-output mappings. Other advantages of radial basis functions include their ability to handle noisy data and their computational efficiency when compared to other methods. They are versatile enough to be applied in both regression and classification problems and have the ability to interpolate functions, making them suitable for use in signal processing and image processing applications. This makes them a popular choice for applications in finance, engineering, machine learning, and climate-related forecasting or prediction, as applied in predicting PAR in this paper. The schematic diagram of the top-performing model (model 11) generated with the radial basis function (RBF) method is shown in Figure 2.

2.2.4. The Multilayer Perceptron (MLP) Artificial Neural Network

The multilayer perceptron (MLP) artificial neural network model is a type of feedforward neural network which includes multiple layers of nodes between the input and output layers. It is commonly used for tasks such as classification, regression, and pattern recognition. MLPs have proven to be effective in a variety of applications, from image and speed recognition to financial analysis and natural language processing. A simpler model may be more suitable for some tasks where the computational resources are limited, while a more complex network architecture may be necessary for tasks that require a higher level of accuracy or deal with more complex data. Ultimately, the choice of network architecture depends on the specific task and available resources. This makes them a popular choice for applications in finance, engineering, machine learning, and climate-related forecasting or prediction, as applied in predicting PAR in this paper. The schematic diagram of the top-performing model (model 11) generated with the multilayer perceptron (MLP) method is shown in Figure 3.

2.2.5. Boosting

Boosting is a machine learning technique which enhances the accuracy of models by combining multiple weak models. It works by iteratively training weak learners on subsets of the data and weighting their predictions based on their accuracy. It is commonly used in applications such as image classification, natural language processing, and predictive modeling, but can lead to overfitting if not properly tuned. Regularization techniques such as early stopping and shrinkage are essential for preventing the boosted model from becoming overfit. These techniques are complementary and often used together to enhance model performance. Additionally, merging multiple methods can lead to new and innovative insights that may not have been possible with just one approach. Details on the boosting technique can be found in Nwokolo et al. [24].

2.2.6. Bagging

Bagging is a type of ensemble machine learning model which combines the predictions of multiple base models to improve overall accuracy. It can be used in various applications such as image recognition, speech recognition, and natural language processing. It is particularly effective for high variance algorithms, where small perturbations to the training set could significantly affect the learned models. Bagging is a popular ensemble method commonly used in decision tree algorithms, where it randomly selects data subsets and trains multiple decision trees with them, which are then combined to make a final prediction. It can also be used to reduce bias in models that are prone to underfitting. Bagging works well with both classification and regression problems, and it can be further improved by using techniques such as random forests or boosting. Bagging, also known as bootstrapping aggregating, is a popular ensemble learning technique which can improve the stability and accuracy of machine learning models. It involves creating multiple variations of a model by training it on different subsets of the data. Details on the bagging technique can be found in Nwokolo et al. [24].

2.2.7. PAR Ratio (PCR)

The PAR ratio is frequently calculated using a coefficient of 0.45 based on research from the global literature. This coefficient is used to estimate the amount of PAR that is absorbed by plants for photosynthesis. However, it is important to note that this coefficient may vary depending on the specific plant species and environmental conditions. As shown in the global review article [37], the regional review study [56], and the global PAR ratio analysis, this approach is frequently feasible where PAR measurement is not available [57]. In order to compare the performance of this prediction approach to other ones used in this study, the authors listed it in the literature as the PAR prediction method. Mathematically, PCR can be written as:
P A R = 0.45 H

2.2.8. Hybridization of MLP, CARIMA, and GPM (MLP-CARIAM-GPM)

The Gumbel distribution is a type of probability distribution used in extreme value theory to model the distribution of the maximum or minimum of a large number of independent and identically distributed random variables. It is commonly used in fields such as engineering, economics, and meteorology to model extreme events such as floods, earthquakes, and hurricanes. The Gumbel distribution is also known as the Type I extreme value distribution and is characterized by its shape parameter and location parameter. It has been found to be a useful tool for predicting rare events that have significant impacts on society and the environment. The Gumbel distribution approach offers a reliable way to predict solar fluxes in any given region, and its accuracy is useful for preparing plans related to solar flux production and other activities that require an understanding of potential levels of solar radiation over a given time period. Our most recent publications discuss the Gumbel distribution approach’s (GPM) discovery, potential, and applications in predicting solar radiation [24,53,54,55]. However, as shown in Table 3, the method is utilized in this study to predict the performance of PAR productivity.
PAR ratio (RPAR) is mathematically expressed as:
P A R H = R P A R
P A R = R P A R H
where RPAR stands for the normalized PAR productivity parameter, H represents the global solar radiation. CARIMA and MLP approaches were used to fit Equations (5)–(8) using H, VPD, and RH parameters as follows:
R P A R = 0.126 + 0.0000638 H + 0.018 V P D + 0.004 R H
M L P R P A R C A R I M A R P A R = 1.00458
  M L P RPAR = 1.00458 C A R I M A R P A R
Putting (5) into (7) yields (8)
R P A R = 0.1266 + 0.0000641 H + 0.0181 V P D + 0.00402 R H
Putting (8) into (4) yields (9)
P A R = 0.1266 + 0.0000641 H + 0.0181 V P D + 0.00402 R H   × H
The time series stochastic function for a continuous distribution like is expressed as:
F P A R F P A R = f P A R R P A R
The normal distribution for P A R / R P A R is given as:
µ = P A R / R P A R β λ
where RPAR is the PAR ratio derived from global solar radiation, vapour pressure deficit, and relative humidity parameters simulated using CARIMA to normalize the PAR to confirm the Gumbel probabilistic range (0–1) expressed in (5), the mean of PAR/RPAR represents the standard deviation of PAR/RPAR, =0.4457, and for generalized datasets of PAR for India; the Gumbel’s reliability or cumulative distribution is given as follows:
R P A R / R P A R = 1 e x p e x p µ
Putting (11) into (12) yields (13)
R P A R / R P A R = 1 e x p e x p P A R / R P A R β λ
Let   Q = R P A R / R P A R
Q = 1 e x p e x p P A R / R P A R β λ
P A R = R P A R β + λ I n I n 1 Q
P A R = R P A R 0.4457 + 0.0157 I n I n 1 Q
Equating (16) and (4) yields (17)
R P A R H = R P A R 0.4457 + 0.0157 I n I n 1 Q
H = 0.4457 + 0.0157 I n I n 1 Q
Putting (17) into (9) yields (18)
P A R = 0.1266 + 0.0000641 H + 0.0181 V P D + 0.00402 R H   × 0.4457 + 0.0157 I n I n 1 Q
From the best-performing CARIMA model (CARIMA11),
P A R = 60.781 + 0.451 H + 3.556 V P D + 0.680 R H
Equating (18) and (19) yields (20)
P A R = 60.781 + 0.451 H + 3.556 V P D + 0.680 R H = 0.1266 + 0.0000641 H + 0.0181 V P D + 0.00402 R H   × 0.4457 + 0.0157 I n I n 1 Q
Equation (20) transforms into (21)
P A R = 60.781 + 0.451 H + 3.556 V P D + 0.680 R H = 1.00458 ( RPAR ) × H
Putting (21) into (4) yields (22)
P A R = 60.781 + 0.451 H + 3.556 V P D + 0.680 R H = 1.00458 P A R
P A R = 60.504 + 0.4489 H + 3.539 V P D + 0.677 R H
A MLP-CARIMA-GPM model with evolutionary hybridization is used in Equation (22) to predict PAR productivity in India. The same procedure was used to obtain MLP-CARIMA-GPM for China, as represented by Equation (23) and Table 6.
P A R = 117.768 + 0.4360 H + 9.067 V P D + 1.243 R H

2.2.9. Analytical Tools and Performance Evaluation

The evaluation metrics used in this study were the coefficient of determination (R2), mean absolute percentage error (MAPE), root mean square error (RMSE), normalized root mean square error (nRMSE), and relative percentage error (RPE), as shown in Table 7.

2.3. Climate Change and Urban Expansion Impacts on PAR Productivity Evaluation

2.3.1. Evaluation of the Impacts of Climate Change on PAR Productivity Using the MLP-CARIMA-GPM Model

The potential for seasonal and annual PAR productivity under various levels of emission scenarios (SSP126, SSP245, and SSP585) between 2015–2099 as well as the historical period (1984–2014) was evaluated using the MLP-CARIMA-GPM (Table 6). The model utilizes detailed information about global solar radiation, vapour pressure deficit, and relative humidity parameters to accurately calculate the seasonal and annual PAR. Since the input parameters (global solar radiation, temperature, and relative humidity) are fitted into the European Centre for Medium-Range Weather Forecasts (ECMWF) as detailed in Section 2.1, future emission scenarios can be generated by a simple evaluation of the MLP-CARIMA-GPM model mathematically for any location across the globe. Accordingly, the MLP-CARIMA-GPM model was employed to assess the PAR productivity potential in India and China under various emission scenarios and sequencing periods through the end of this century. The findings of this assessment highlighted the immense PAR productivity potential in these countries, with the study concluding that two countries have sufficient PAR productivity potential to make them viable candidates for modern biomass production in the near future. As a result, the MLP-CARIMA-GPM model provides an invaluable resource for making informed decisions regarding the deployment of modern biomass production systems in developing countries and beyond.

2.3.2. Evaluation of the Contribution of Urban Expansion to PAR Productivity

According to data from Smith and Rothwell’s [58] publications, land use change includes all ecosystems, such as boreal forest, other forest, cropland, grassland, high latitude wetland, low latitude wetland, pasture land, primary other forest, rockice desert, shrubland, tundra, and urban land for China and India between the years of 1984–2099. This data was employed to evaluate the contribution of urban expansion to PAR productivity.

3. Results

3.1. Potential of PAR in China and India

The annual mean photosynthetic productivity in China and India varies concurrently, with a range in India from 69.85 to 128.73 W/m2 and a corresponding range from 40.88 to 122.50 W/m2 in China. China reported lower values than India, within a range from 40.88 to 122.50 W/m2 and a corresponding mean value of 82.67 W/m2 (Table 1 and Figure 1). This difference in PAR can be attributed to various factors such as climate, vegetation cover, and land use practices, which differ between the two countries. This indicates that solar fluxes are typically greater than 43.76% in both China and India, indicating that crops and plants have the capacity to use their photosynthetic processes in those regions for an extended period of time [55,59,60,61]. This highlights the potential for higher agricultural productivity in these regions, provided that other factors such as water availability and soil quality are favorable. However, it is important to note that excessive solar radiation can also lead to heat stress and damage to crops if not managed properly. To mitigate the risks associated with excessive solar radiation, farmers can adopt measures such as shading, irrigation, and crop rotation to maintain soil moisture and fertility. Additionally, the use of heat-tolerant crop varieties and agronomic practices can help increase resilience to extreme weather conditions.
The annual mean of 94.82 W/m2 measured in India is comparable to the Nigerian value of 93.50 W/m2 reported in our most recent paper [55], while the annual mean of 82.67 W/m2 measured in China is less than that measured in Nigeria [55]. The value of 82.67 W/m2 found for China, however, is comparable to those found in Chinese literature. Wang et al. [62] unearthed an average monthly value of 80.60 W/m2 in China. Hu et al. [63] provided data for the North Chinese Plain and reported a value of 82.44 W/m2. In Lhasa, Haibai, and China, the same research team recorded values of 111.85 W/m2 and 111.09 W/m2 for the lighting and dimming periods, respectively [64]. These findings suggest that there is significant regional variation in the amount of direct solar radiation reaching the Earth’s surface, which may have important implications for local ecosystems and human populations. Further research is needed to better understand the drivers of this variability and its potential impacts.
In Mainland China, Niu et al. [65] observed a value of 72.10 W/m2. Other regions of the world reported values of 94.83 W/m2 and 82.67 W/m2 that were comparable. For Fuji Yoshida, Japan, Mizoguchi et al. [66] found 126.69 W/m2. Zhu et al. [67] measured 86.40 W/m2 in the Sanya region of China, compared to 83.64 W/m2 on the Tibetan Plateau. The lowest values, from 82.09 to 85.98 W/m2 for southern Nigeria’s Delta, Bayelsa, Cross River, and Akwa Ibom, are similar to the value of PAR obtained for China, with Calabar producing the lowest solar PAR flux at 82.16 W/m2 [55]. The highest values, from 109.06 to 111.69 W/m2 representing the states of Kastina, Borno, and Yobe in northern Nigeria, are comparable to the PAR value obtained for India, with Kastina having the highest value of 111.70 W/m2.

3.2. Potential of PAR Ratio in China and India

The PAR ratio’s minimum, maximum, range, and mean values for China and India are shown in Table 1. India’s PAR ranged from 0.4216 to 0.4753 with a corresponding mean value of 0.4457, and China’s PAR ranged from 0.4234 to 0.4695 with a corresponding mean value of 0.4514. These results suggest that there is a similar level of photosynthetic activity in both countries, with China having slightly higher PAR values on average. However, further analysis is needed to determine the factors contributing to these differences and their implications for plant growth and productivity. These were assessed by dividing the observed photosynthetic productivity (PAR) with global solar radiation (H). In cases where there is no instrumentation network to measure the solar fluxes, this value, which is also in the range of 0.45 and 0.47, is frequently used to estimate the PAR value [37,57,68,69,70,71]. This method of estimating PAR can be useful in areas where there is no access to instrumentation, but it is important to note that the accuracy of the estimation may vary depending on factors such as cloud cover and atmospheric conditions. As a result, care should be taken when using this technique for exact measurements. It is recommended to use this method in conjunction with other methods of measuring PAR for more accurate results. Additionally, regular calibration of the estimation technique may be necessary to ensure consistent and reliable measurements.
These values are comparable to various experimental findings made worldwide. According to our most recent publication from various parts of Nigeria, the PAR ratio there ranged from 0.4377 to 0.4539. Additionally, we discovered that from the northeastern region of Nigeria to the primarily coastal region in the south, the general distribution of the PAR ratio increases. The global PAR ratio varied from 0.4714 in the coastal region of Calabar to 0.4377 in the interior region of Kastina. This suggests that, as predicted by Akitsu et al. [57], the PAR ratio is likely to rise in areas with higher relative humidity and vapor pressure. This suggests that coastal regions or locations which are nearer to open water bodies have higher PAR ratio productivity compared to inland region.
Numerous studies also favorably compare the values of the PAR ratio obtained in China and India. The PAR ratio was recorded at 0.46 by Tsubo and Walker [72] in Bloemfontein, South Africa; Aguiar et al. [73] obtained 0.42 and 0.444 in pasture and forest areas of Brazil; Finch et al. [74] recorded 0.44 in Lusaka, Zambia; [59,60] scored 0.46 for Ilorin, Nigeria; Howell et al. [75] reported 0.45 for California, USA; and Ituen et al. [76] reported 0.46 for California, USA. These findings suggest that the PAR ratio in China and India is comparable to or even higher than that of other countries, indicating a potential for high photosynthetic efficiency in these regions. Overall, the PAR ratio varies across different regions and ecosystems, but it is generally consistent within a particular ecosystem type. These variations in PAR ratio can be attributed to differences in vegetation structure, climate, and other environmental factors. For example, in tropical rainforests, the PAR ratio is typically lower due to the dense canopy cover, while in grasslands and savannas, it is higher due to the lack of vertical vegetation structure. Understanding these variations in PAR ratio can help us better understand ecosystem functioning and productivity. However, further research is needed to fully understand the factors contributing to these differences in PAR ratios across different regions.
Papaioannou et al. [77] scored 0.44 for Athens, Greece. Rao [78] recorded 0.46 in Oregon, USA. These results suggest that air pollution levels in Athens and Oregon were relatively similar during the time periods studied. However, it is important to note that direct comparisons between the two locations may not be entirely accurate due to differences in measurement methods and environmental factors. For instance, Athens is a densely populated city with high traffic congestion, while Oregon is a state with varying levels of urbanization and industrial activity. These contextual differences may impact the interpretation of the data and should be taken into consideration when drawing conclusions.

3.3. Simulation Model Performance

The results of the monthly mean PAR productivity’s prediction performance are presented in Figure 4 and Table 8, which show the input combination parameters and their corresponding machine learning models (MLP, RBF, BOO, BAG, CARIMA, SARIMA), the indirect method of PAR estimation (PCR), empirical approaches, and the MLP-CARIMA-GPM hybridization approach using five error metrics. Boosting and bagging ensemble approaches, neural network approaches (MLP and RBF), physics-based approaches, and two statistical machine learning approaches (CARIMA and SARIMA) are used to study the shared effects of various input-combination parameters (PCR, empirical, and MLP-CARIMA-GPM). It was evident that the SARIMA model outperformed its CARIMA counterpart, MLP outperformed RBF, and MLP-CARIMA-GPM outperformed PCR and empirical approaches. By contrast, boosting and bagging, which are members of the ensemble family, had comparable performance capacities.
In order to predict the PAR productivity, the input combination parameters of global solar radiation (H), relative humidity (RH), and vapour pressure deficit (VPD) showed varying capacities in China and India. The six machine learning models (MLP, RBF, BOO, BAG, CARIMA, and SARIMA) and the three physics-based models (PCR, empirical, and MLP-CARIMA-GPM), on the other hand, showed similar variation, according to the results of the error metrics shown in Figure 5. The performance capabilities of each input parameter on the nine methods used were generally evaluated using the coefficient of determination (R2), mean absolute percentage error (MAPE), root mean square error (RMSE), relative percentage error (RPE), and relative root mean square error (nRMSE).
According to Figure 4 and Table 8, the hybridized model using MLP, CARIMA, and the Gumbel probabilistic model (MLP-CARIMA-GPM) produced the highest R2 and the lowest MAPE, RMSE, RPE, and nRMSE of all the nine approaches used. It should be noted that all of the top-performing models from each of the nine different approaches are shown in Table 8 and did well in both the training and testing categories; R2, MAPE, RPE, RMSE, and nRMSE are all within the range of reliability of 0.9670 < R2 < 0.999 for R2, 0.001 < MAPE < 0.0028 for MAPE, −0.048 < RPE < 0.014 for RPE, 0.001 < RMSE < 0.0768 for RMSE, and 0.0001 < nRMSE < 0.060 as shown in Table 8 and Figure 4. From one simulated approach to the next, different error metrics are obtained.
Overall, all machine learning algorithms and empirical approaches in China and India reported the best-performing hybrid parameter-based model using global solar radiation, vapor pressure deficit, and relative humidity (Model 11), with the exception of RBF, which produced the best-performing model using global solar radiation parameter-based Model 2 in China. This implies that the chosen input variables are accurate at predicting PAR in both countries. As shown in Table 8 and Figure 4, the MLP algorithm produced the best-performing models for all the models developed in China and India using the input combination parameters shown in Table 3, while the RBF algorithm performed the worst in terms of predicting performance.
Consequently, when performing PAR prediction analysis using various machine learning and empirical approaches, the R2-values ranged from: 0.997 to 0.999% for India and 0.999 to 0.999% for China when using the MLP algorithm; 0.983 to 0.991% for India and 0.995 to 0.999% for China when using the SARIMA algorithm; 0.981 to 0.990% for India and 0.996 to 0.998% for China when using the CARIMA algorithm; 0.981 to 0.990% for China and 0.996 to 0.998% for India when using both bagging and boosting ensemble algorithms; 0.968 to 0.975% for India and 0.921 to 0.948% for China using the RBF algorithm; and finally 0.981 to 0.990% for India and 0.996 to 0.998% for China using the empirical approach. When RMSE, MAPE, nRMSE, and RPE error metrics were taken into account using various machine learning algorithms along with an empirical approach, the same pattern was seen.
The small changes shown by these models in the two countries were triggered by using the same input configuration parameters on six machine learning algorithms and an empirical approach on the various geographical and climatic features of China and India. The MLP algorithm, denoted by the yellow color in the plot’s legend, clearly demonstrated higher performing capacity using input combination model M1, M4–M11 (described in detail in Table 3) in China and India compared to other machine learning algorithms (RBF, CARIMA, SARIMA, BOT, and BAG) as well as empirical approaches, as shown by Figure 4, which compares the performance of error metrics for various approaches. This explains why the MLP algorithm outperforms other prediction techniques. However, using the input combination models M2 and M3 for bagging and boosting algorithms led to the best-performing algorithm as well as the empirical approach in both China and India. These models are described in detail in Table 3. This suggests that while the ensemble algorithm family has a high capacity for predicting PAR productivity in China and India, the MLP algorithm outperforms them, making it the best-performing method of non-hybridized models.
As seen in Figure 4, both the input combination model (M4–M6) and the model (M7–M9) underperformed in China and India. This explains why fitting PAR productivity models in both China and India cannot be done using a single parameter-based relative humidity or vapor pressure deficit. However, India’s use of CARIMA, SARIMA, BAG, BOT, and empirical approaches led to more accurate prediction outcomes when compared to China. However, models using global solar radiation (M1–M3) produced appreciable performance but were not as viable as their hybrid counterparts (M10–M11) fitted using all the input parameters (H, RH, and VPD) in China and India.
For all input combination-based models that were simulated, the MLP algorithm produced higher predictive performance in both countries due to the lower performance of BAG, BOT, RBF, CARIMA, SARIMA, and empirical approaches in China compared to India (M1–M11). Due to their best results in this study, MLP seems to be the most highly recommended algorithm-based approach for fitting PAR productivity in both China and India.
The MLP algorithm is compared to the PAR coefficient ratio model (PCR) and hybridization of the MLP, CARIMA, and GPM (MLP-CARIMA-GPM) approaches because it produced the best-performing models using all the input combination predictive parameters shown in Table 4 in China and India. Table 8 makes it clear that in terms of error metric performance in China and India, the MLP algorithm outperformed the PCR model. However, based on the assessment of error metrics in both the training and testing categories, the super MLP-CARIMA-GPM hybrid model completely outperformed the MLP algorithm in both China and India.
This suggests that the H, RH, and VPD input combination parameter values in China and India are more sensitive to and appropriate for the MLP-CARIMA-GPM model. The predicted datasets are nevertheless reliable even in this era of climate change externalities, as shown by the tested dataset’s high R2-value and low MAPE, RPE, RMSE, and nRMSE error metrics.
This demonstrates that the MLP-CARIMA-GPM fitted approach for predicting PAR in China and India is deserving of recommendations for various environmental and renewable energy resource predictions, subject to the constraints confronted during the modeling. The Gumbel probabilistic interval is confirmed by normalizing predicted PAR to fall within a range of 0–1.
There is a dearth of literature evaluating the effects of climate change on solar PAR fluxes in China and India using the Gumbel probabilistic model (GPM) in conjunction with machine learning techniques like CARIMA and MLP. As a result, it is necessary to compare the evolution MLP-CARIMA-GPM model’s performance to that of fitted models that have already been tested in the past using a single algorithm, as well as to their hybridization counterparts, which are shown in Table 9. Table 9 demonstrates that when compared to empirical, machine learning, and hybridizations of various algorithms in the literature, the proposed hybridized MLP-CARIMA-GPM produced the highest R2-value and lowest RMSE error metrics.
The empirical model reported by Akitsu et al. [57], who used vapour pressure and clearness index (kt) to obtain an R2-value of 0.763 and an RMSE-value of 0.0109 in Tateno, Japan, was surpassed by the proposed MLP-CARIMA-GPM model. Additionally, the proposed MLP-CARIMA-GPM outperformed the multilinear regression models fitted in Burgos, Spain, and Sioux Falls, South Dakota, USA, by Garcia-Rodriguez et al. [79]. In comparison to the proposed hybrid model, which produced an R2-value of 0.999 and an RMSE-value of 0.0002–0.0061 W/m2 in China and India, Foyo-Moreno et al. [80] empirically established model recorded lower error metrics performance R2-values of 0.994 and 0.993, as well as 0.047 W/m2 and 0.050 W/m2, respectively, for Granada, Spain. Wang et al. [81] multilinear regression model in Changbaishan, China had an R2 value of 0.985 and an RMSE value of 0.1330. The proposed MLP-CARIMA-GPM model outperformed them.
Sustainable machine learning and numerical model hybridization fitted in this study outperformed a number of empirical multilinear regression best-performing models for evaluating PAR potential in Burgos, Spain [82] and Thessaloniki, Greece [83]. This is in line with a number of experimental and review reports on empirical and multilinear regression for predicting PAR [37], for predictions of global solar radiation in Africa [12], West Africa [84], and Nigeria [15], and for diffuse solar radiation in Africa [13], and North Western Africa [85].
This suggests that using empirical or multilinear regression approaches to fit solar PAR fluxes is inefficient in the current era of global sustainability, global warming, and climate change, because the MLP-CARIMA-GPM model, which is more cost effective, clean, efficient, reliable, and sustainable, can quantify the potential of solar PAR fluxes in accordance with SDG prescriptions and requirements. The proposed MLP-CARIMA-GPM model, however, outperformed all of the few studies that used machine learning and hybridization models to predict PAR fluxes. Wang et al. [86] found R2 values of 0.996, 0.993, and 0.995 for the MLP, GRNN, and RBNN models, respectively, in addition to RMSE-values of 0.065 W/m2 and 0.068 W/m2 in various Chinese ecosystems. Similar ranges of R2 and RMSE values were reported by Ferrera-Cobbs et al. in 2020 [87].
According to the results of this study, the Gumbel probabilistic model is used to help the proposed MLP-CARIMA-GPM model accurately predict the solar PAR fluxes even though it was developed using commonly measured global solar radiation (H), relative humidity (RH), and vapour pressure deficit (VPD). As a result, the new prediction method used in this study is crucial for mapping the monthly mean prediction of solar PAR fluxes in China and India and represents a fresh direction for future global research.
Table 8. Best-performing models for China and India.
CountryModel #Training Model Fit StatisticsTesting Model Fit Statistics
R2MAPERPERMSEnRMSER2MAPERPERMSEnRMSE
IndiaMLP110.9990.0004−0.0220.01270.00010.9290.0008−0.0150.0100.0001
IndiaRBF110.9530.0027−0.0010.08540.00100.9670.0048−0.0010.0600.001
IndiaCARIMA110.9900.00100.0110.03210.00040.9690.00190.0080.0230.0003
IndiaSARIMA110.9910.0010−0.0340.03310.00040.9690.0028−0.0240.0230.0005
IndiaBAG110.9900.00110.0100.03250.00040.9690.00180.0070.0230.0003
IndiaBOT110.9900.00110.0100.03250.00040.9690.00210.0070.0230.0004
IndiaEMP110.9900.00110.0140.03320.00040.9690.00310.0100.0230.0004
IndiaPCR0.9740.00250.0000.07680.00090.9680.00200.0000.0540.0007
IndiaMLP-CARIMA-GPM0.9990.00020.0000.00610.00010.9700.00010.0000.0040.0001
ChinaMLP110.9990.0003−0.0480.00660.00010.9700.0081−0.0340.0050.0001
ChinaRBF20.9900.00180.0000.04800.00060.9690.00160.0000.0340.0007
ChinaCARIMA110.9980.00080.0070.01930.00030.9700.00110.0050.0140.0003
ChinaSARIMA110.9970.0010−0.0170.02430.00030.9700.0014−0.0120.0170.0003
ChinaBAG110.9980.00080.0060.01970.00030.9700.00190.0040.0140.0003
ChinaBOT110.9980.00080.0060.01970.00030.9700.00180.0040.0140.0003
ChinaEMP110.9980.00080.0080.02040.00030.9700.00130.0060.0140.0006
ChinaPCR0.9950.00190.0020.05080.00070.9690.00120.0010.0360.0005
ChinaMLP-CARIMA-GPM0.9990.0010.0010.00020.00010.9700.00180.0010.0000.0001
Table 9. A comparative analysis between developed hybrid models with various techniques in previous studies.
StudiesModelPlace/CountryR2RMSE
Akitsu et al. [57]EmpiricalTateno, Japan0.7630.0109
García-Rodríguez et al. [79]MLRBurgos, Spain0.9940.0437
García-Rodríguez et al. [79]ANNBurgos, Spain0.9940.0422
García-Rodríguez et al. [79]MLRSioux Falls, South Dakota USA0.9950.0684
García-Rodríguez et al. [79]ANNSioux Falls, South Dakota USA0.9950.0634
Proutros et al. [5]EmpiricalMt Oiti, Greece0.993
Wang et al. [81]MLRChangbaishan, China0.9850.1330
Foyo-Moreno et al. [80]EmpiricalGranada, Spain0.9940.047
Foyo-Moreno et al. [80]ANNGranada, Spain0.9930.050
López et al. [88]ANNBrazil0.9980.026
Jacovides et al. [89]ANNEastern Mediterranean0.9720.079
Zhang et al. [90]ANFISChina0.9700.748
Zhang et al. [90]M5TreeChina0.9670.799
Zhang et al. [90]LSSVMChina0.9610.903
Janjai et al. [91]EmpiricalChiang Mai0.9700.073
Escobedo et al. [92]EmpiricalBotucatu, Brazil0.9980.033
Jacovides et al. [89]EmpiricalAnthens, Greece0.9040.268
García-Rodríguez et al. [82]MLRBurgos, Spain0.9760.078
García-Rodríguez et al. [82]ANNBurgos, Spain0.9920.038
Ferrera-Cobos et al. [87]ANNSantiago EOAS, Spain0.9930.106
Zempila et al. [83]ANNThessaloniki, Greece0.9980.063
Zempila et al. [83]MLRThessaloniki, Greece0.9980.066
Zempila et al. [83]EmpiricalThessaloniki, Greece0.9980.068
Yu and Guo [93]ANNBON0.9980.027
Yu and Guo [93]ANNSXF0.9990.019
Yu and Guo [93]EmpiricalBON0.9690.034
Yu and Guo [93]EmpiricalSXF0.9780.023
Wang et al. [86]MLPLSA0.9960.065
Wang et al. [86]GRNNLSA0.9930.068
Wang et al. [86]RBNNLSA0.9950.068
Nwokolo et al. [55]CARIMA-PCMNigeria0.9990.562
Hao et al. [34]EPIC-basedGlobe0.8516.80
Hao et al. [35]Random ForestGlobe0.89014.09
Present studyMLP-CARIMA-GPMChina0.9990.0002
Present studyMLP-CARIMA-GPMIndia0.9990.0061

3.4. Climate Change’s Effects on Changes in PAR Productivity

3.4.1. Effects of Climate Change on Variations in PAR from the Interpolation Line Plots

According to the interpolation line in Figure 5, changes in photosynthetic productivity in China are generally expected to increase every year, in all seasons, and for various emission scenarios (SSPs). In contrast, it is anticipated that changes in photosynthetic productivity in India will decline annually, across all emission scenarios, and during all seasons. This suggests that, compared to its Chinese counterparts, India is more susceptible to decreased photosynthetic productivity as a result of climate change. The decline in photosynthetic productivity in India can be attributed to factors such as increasing temperatures, changing rainfall patterns, and soil degradation. These findings highlight the urgent need for India to implement effective measures to mitigate the impact of climate change on its agricultural sector. The decline in photosynthetic productivity in India can have significant implications for food security and the livelihoods of millions of people who depend on agriculture. Therefore, it is crucial for India to implement effective adaptation strategies to mitigate the adverse effects of climate change on its agricultural sector.
From Figure 5, it is clear that the photosynthetic productivity in China is expected to rise between 2025 and the end of this century under the best-case emission scenario (when the global temperature is projected to rise to 1.5 °C, (SSP126)). Photosynthetic productivity is anticipated to rise in China during the Boreal Winter (DJF) season from 2070 to 2099 and decrease from 2015 to 2069 under the moderate-case (SSP245) and worst-case (SSP585) emission scenarios, when the global temperature rises to 2.5 °C (SSP245) and 3.5 °C (SSP585), respectively. Under the moderate-case and worst-case emission scenarios, respectively, the photosynthetic productivity is predicted to increase during the boreal spring (MAM) and summer (JJA) seasons from 2030–2099 and decrease from 2015–2030. The photosynthetic productivity in the boreal autumn season is projected to increase from 2025 to 2099 and decline from 2015 to 2024. Under the moderate-case (SSP245) and worst-case (SSP585) emission scenarios, the changes in photosynthetic productivity are expected to rise from 2050 to 2099 and decrease from 2015 to 2049 in China. These changes in photosynthetic productivity are likely to have significant impacts on the carbon balance and ecosystem services in China, particularly as the country is one of the world’s largest emitters of greenhouse gases. Therefore, it is crucial to implement effective measures to mitigate climate change and promote sustainable land use practices.
This shows that if the warming of the Earth’s circulation system is kept at 1.5 °C by the end of this century, changes in the potential of photosynthetic productivity in China are estimated to rise by 0.001 to 2.077%. However, China’s potential changes in photosynthetic productivity are projected to decline by 0.001 to 0.917% as a result of climate change if the global warming temperature exceeds 1.5 °C and moves towards 2.5 °C or 3.5 °C as a result of the inability to control the warming Earth system. This suggests that the effects of climate change on photosynthetic productivity have had only a minor negative impact (less than 1% on the solar PAR fluxes in China) both seasonally (short-term) and annually (long-term).
Despite the small adverse impact on photosynthetic productivity, it is important to note that any decline in productivity can have significant consequences for food security and the overall health of ecosystems in China. Thus, these findings highlight the importance of taking action to limit global warming to 1.5 °C in order to minimize the negative impact on China’s photosynthetic productivity. It also emphasizes the need for effective climate change policies and strategies to mitigate the potential decline in productivity if global warming exceeds 1.5 °C.
On the other hand, if the Earth’s circulation system is kept warm by an average increase of 1.5 °C from now until the end of this century, the potential of PAR productivity in India is anticipated to increase by 0.002 to 6.737%, respectively, on a seasonal and annual basis. If global warming exceeds 1.5 °C, India’s potential changes in PAR productivity could decline by 0.127 to 2.007%. This shows that both seasonally (short-term) and annually, India is predicted to experience more severe adverse effects of climate change (greater than 2% on the solar PAR fluxes) compared to China. These findings highlight the urgent need for India to implement effective climate change mitigation and adaptation strategies to minimize the negative impacts on its agricultural productivity. Failure to do so could have significant implications for food security and economic stability in the country.

3.4.2. Climate Change’s Effects on Changes in PAR under Various Emission Scenarios

Table 10 displays the percentage changes in photosynthetically active radiation productivity relative to the historical period (1984–2014) for various shared socio-economic pathways (SSP126, SSP245, and SSP585) in China and India for the near future (2015–2049), the far future (2050–2099), and the all future (2015–2099). India, when compared to China, showed an increase in photosynthesis for all four seasons on an annual basis and for the three sequencing periods. China, on the other hand, produced contradictory results, showing either an increase or a decrease in changes in photosynthesis under the same scenarios. India outperformed China in terms of annual, three sequencing period, and all four seasons of the year results under the SSP126 and all emission scenarios due to the effects of climate change. It is imperative that India and China take action to mitigate climate change as soon as possible in order to protect their agricultural productivity, which is a major factor in determining agricultural yields and food security. The results of this study suggest that India may have seen more significant increases in PAR productivity during the earlier stages (2015–2049) and far future (2050–2099) of this century as a result of the impacts of climate change. However, China may surpass India by the end of the century due to its increased capacity to respond to climate change-related effects. This suggests that India may benefit from short-term gains, but may struggle to keep up with China’s long-term performance due to the size of its land area and shorter growing season. To ensure sustainable agricultural productivity and food security in both India and China, action must be taken to reduce the impact of climate change and improve the resilience of agricultural systems. India may be able to better handle short-term fluctuations in photosynthetically active radiation productivity, but will not be able to compete with China’s long-term performance due to its smaller land area and shorter growing season. This limitation may prevent India from ever achieving the level of sustained agricultural productivity that China has been able to attain over the long term. This could have important implications for India’s ability to feed its population in the coming decades and beyond. To ensure food security for its population, India must capitalize on these benefits in the short term to ensure sustainable food security over the course of a century.
Contrarily, as shown in Table 10, India produced an increase in PAR productivity under the three sequencing periods, seasons, and on an annual basis, whereas changes in PAR productivity as a result of the impacts of climate change are expected to result in higher cases of decrease rather than an increase in PAR productivity in China as the impacts of climate change intensify under the moderate and extreme scenarios. The results from India suggest that its agricultural sector could benefit from the climate change scenarios, where the increase in PAR productivity will create more favorable conditions for crop growth and could even help mitigate the effects of the climate change. This is likely attributed to the fact that India is located in the subtropics, where climate change is expected to cause an increase in atmospheric water vapor, leading to a higher availability of moisture and allowing more PAR productivity in India than in China, where the impacts of climate change will be much more severe. India’s results demonstrate that under a changing climate, agricultural sectors could benefit from increased PAR productivity, whereas in China and other parts of the world where decreases are expected, mitigating strategies and sustainable practices should be implemented to minimize the negative effects of climate change on agricultural production and food security.
This research shows that the effects of climate change on photosynthetically active radiation productivity vary significantly by location, with countries located in the subtropics likely to experience more favorable conditions due to increased moisture and higher PAR productivity. India has the potential to reap benefits from increased PAR productivity, while other countries may need to implement strategies to protect their crops and food security from the damaging effects. This study highlights the need for tailored strategies and sustainable practices to ensure adequate food production and security. Climate change can lead to a decrease in PAR productivity, impacting not only farmers and producers but also consumers across India. This could lead to a crisis for food production and a greater risk of hunger and malnutrition among the population.
To mitigate the effects of climate change on food production, steps should be taken to implement climate-smart agricultural practices, such as reduced tillage and cover cropping, improved irrigation and water management strategies, and increased investment in renewable energy sources. Additionally, research and development should be conducted into crop varieties that are tolerant of drought or heat, as well as a shift to more plant-based diets and improved access to nutrition-rich foods.

3.4.3. The Impact of Climate Change on Seasonal Variations in PAR Productivity

As shown in Table 10 for India, the percentage changes in photosynthetically active radiation productivity over the near-future period (2015–2049) relative to the historical period (1984–2014) are typically more prominent for boreal summer than for boreal winter, spring, and autumn, and on an annual basis for all the scenarios (SSPs). This suggests that, in the near future period (2015–2049), changes in PAR productivity as a result of climate change are expected to produce a commensurate increase in food production. However, toward the end of this century (2050–2099), changes in PAR productivity as a result of climate change impacts are expected to reduce food production in India. These findings are consistent with the recent scientific evidence that indicates that the most significant climate change impacts will occur in the later part of this century and will have a greater effect on boreal summer than winter, spring, and autumn under the most extreme scenarios. In general, this research has shown that while there is potential for increased food production as a result of PAR productivity in the near-future period (2015–2049), by the end of this century (2050–2999) the impacts of climate change are expected to cause a decrease in food production in India.
Climate change could have serious implications for India, both in terms of food security and socio-economic development. To minimize the potential effects of climate change on food production, it is essential to develop robust and effective adaptation strategies that take into account the projected changes in climate and food production systems in India, as well as the challenges posed by existing and future population growth, poverty levels, and food insecurity. To be successful, all stakeholders must work together to develop and implement climate change adaptation strategies, which take into account local context and resources while also focusing on long-term, sustainable solutions. Research and innovation are also essential to develop evidence-based policies and interventions to mitigate and address the risks posed by climate change to food production and food security in India.
Conversely, the percentage changes in PAR productivity during the far-future period (2050–2099) with respect to the historical period (1984–2014) are more prominent for boreal autumn as compared to other seasons and on an annual basis for all the SSPs in China, as shown in Table 10 and Figure 5 In particular, the best-case emission scenario (SSP126) shows the largest change, with an average increase of 2.077% in PAR productivity in boreal autumn compared to the historical period. These results indicate that, for China, boreal autumn has the highest potential for PAR productivity change. This could be attributed to the higher levels of PAR productivity during boreal autumn due to warmer temperatures and longer daylight hours, which help in biomass accumulation.
Overall, the results from Table 10 suggest that the areas in China with the greatest potential for productivity increase are those located in boreal autumn, due to their higher levels of PAR and increased biomass accumulation relative to other seasons. Moreover, the effects of climate change and increasing levels of atmospheric CO2 have a greater impact on PAR productivity during boreal autumn than any other season. This result is supported by previous studies showing that increased temperatures and longer day length during boreal autumn could provide more favorable conditions for photosynthesis [94,95] and, consequently, higher biomass accumulation compared to the other seasons [96,97].
As a result, this combination of climatic and biophysical factors can have a positive effect on agricultural productivity in China during boreal autumn in comparison to other seasons. However, it is important to remember that these results are based on limited observations and that further research is needed to confirm the potential of boreal autumn for increased photosynthetic productivity in China. Therefore, while boreal autumn may present a beneficial environment for increased photosynthetic productivity in China, further research is necessary to confirm this potential and ensure the long-term viability of agricultural production in the region.
However, towards the beginning of this century (2015–2049), changes in photosynthetic productivity as a result of the impacts of climate change are expected to reduce food production in China. Additionally, many of the environmental and biophysical factors discussed above are predicted to be affected by climate change in the upcoming decades. These impacts include rising temperatures, water scarcity, and extreme weather events such as droughts, floods, and windstorms. As climate change begins to take hold, certain seasonal patterns that may have been beneficial for crop production in the past could become unreliable or even detrimental to agricultural productivity in China.
China must invest in research and development to advance the adaptation of sustainable agricultural practices and provide farmers with advanced farming techniques to reduce the environmental impacts of climate change. It should also focus on developing strategies to increase resilience among rural communities, such as strengthening disaster preparedness plans and training farmers in climate-smart agricultural practices. Finally, it should prioritize investing in agricultural extension services to provide farmers with training and information on climate-resilient agricultural practices to protect their livelihoods and food security.
The boreal summer seasons were reported to have experienced the largest changes in photosynthetic productivity, with an increase of about 3% under SSP245 in the near-future sequencing period in India. In contrast, the Indian boreal winter showed the lowest changes in photosynthetic productivity, with an increase of only 0.2% under the SSP585 scenario for the long-term sequencing period (2050–2099). While in the boreal autumn, with near and far future sequencing periods, respectively, the effects of climate change were found to result in an increase in photosynthetic productivity of between 0.125% and 2.077%. These changes in photosynthetic productivity in India due to climate change were found to be greater in the summer months but still significant in the autumn and winter months as well.
These results suggest that climate change is likely to have a wide-reaching impact on photosynthetic productivity in India, with both short- and long-term effects across all seasons leading to an increase in productivity during the summer and a decrease during the winter months, as well as a more subtle increase in productivity during the autumn and winter months. This indicates that while climate change is likely to have a negative effect on photosynthetic productivity in the boreal winter, it is also likely to result in an overall increase in productivity in India over time due to its positive effects in the spring, summer, and autumn seasons. This could have long-term implications for India’s agricultural output, with increases in photosynthetic productivity potentially leading to higher crop yields and greater food security across the country over the long term. These changes in photosynthetic productivity could potentially have a significant impact on the agricultural industry in India overall, leading to a more secure and stable food supply for its citizens in the years to come.

3.4.4. Climate Change Effects Based on the Scale of the Impact

On the other hand, the boreal spring under the best-case scenario (SSP126) within the near-future sequencing scenario in India showed the highest changes in photosynthetic productivity, with a decrease of productivity of about 0.127%. The opposite is true in the case of China, where boreal spring reported the highest decrease in photosynthetic productivity under the near-future sequencing period under a moderate-case scenario (SSP 245), whereas the lowest decrease under the same conditions was recorded under the all-future sequencing period at 0.001% (2015–2099).
Despite this discrepancy between the two countries, it is important to note that these changes in photosynthetic productivity still have the potential to significantly impact India’s agricultural industry and food supply, as an increase of even 0.127% can result in an increase in crop yields, providing much-needed relief to farmers and food security for the entire nation. Moreover, the changes in photosynthetic productivity have implications that go beyond agricultural production and into the realm of climate change. As global temperatures continue to rise, photosynthetic productivity is likely to suffer further in both China and India. India saw an increase in photosynthetic productivity of 1.38%, while China experienced a decrease of 0.127% during the same period.
In India, the changes in photosynthetic productivity were even greater, with an increase of 0.127% from 2015 to 2049, a period of time that saw significant global warming and climate change initiatives from both countries. Despite this discrepancy between the two countries, the changes in photosynthetic productivity have much wider implications than just crop yields, and these impacts may be even more severe if global temperatures continue to rise due to the increasing CO2 concentration in the atmosphere. As a result, it is essential to consider the potential impacts of climate change on photosynthetic productivity in both India and China, as they are likely to be far-reaching and have consequences on both countries’ long-term agricultural and economic stability.

3.5. Contributions of Urbanization, Climate Change, and the Photosynthetic Residual Factor on Changes in PAR

To separate the relative contributions of climate change (CLC), urban expansion (URE), and the photosynthetic residual factor (PRF) from the changes in potential photosynthetic productivity, the team developed a relationship between these three variables. The impacts of each parameter are more explicitly and objectively reflected in Table 11. Table 11 demonstrates that urban expansion significantly influenced changes in PAR productivity when compared to the contribution of climate change in China and India, as well as in all emission scenarios and sequencing periods.

3.5.1. Contributions of Urban Expansion to Changes in PAR under Various Scenarios

First, urban expansion contributed 50.18%, 48.13%, 50.11%, and 49.47%, to China’s emissions in the best-case scenario (SSP126), the moderate-case scenario (SSP245), the worst-case emissions scenario (SSP585), and the entire case emission scenarios, respectively. For India, it contributed 11.75%, 35.700%, 37.79%, and 28.41%, respectively. In contrast to India, which has a moderate level of urbanization, China has experienced rapid urbanization [98]. Given the current rate of urbanization and growth in both countries toward the end of this century [99], it is clear from Table 11 that urban expansion may have had a significant impact on potential photosynthetic productivity in both China [98] and India if the global temperature is limited to a 1.5 °C rise. This trend is also likely to continue in the future.
The contribution of urban expansion to PAR productivity has been substantial in both China and India over the last two decades [100], with a higher relative contribution in China due to its more rapid rate of urbanization and growth [101]. This indicates that Indian development is more ecologically conservative than Chinese development, and that there is a need for more sustainable and ecologically conscious urban expansion policies in India if it wants to match the level of economic growth seen in China. India must ensure that its urban expansion policies are ecologically conscious and take into account the long-term impacts of such policies on the environment and local ecosystems, and should look to the Chinese model for guidance and inspiration when formulating its own urban expansion policies. Urban expansion has been an important part of the development and growth of both China and India over the past two decades. It is important for policymakers in both countries to ensure that policies are implemented that foster continued urban expansion while also creating a sustainable and equitable urban environment that balances the interests of both rural and urban populations.
To maximize the benefits of urban expansion, both countries need to ensure that cities are designed in such a way that they can accommodate population growth while also providing quality services such as adequate housing [102], sanitation [103], education, and transportation infrastructure [104]. Additionally, they must have a strong regulatory framework in place to ensure that urban expansion is managed in an efficient manner and that the interests of all citizens are taken into account when creating and implementing policies [105].

3.5.2. Contributions of Climate Change to Changes in PAR under Various Scenarios

Secondly, the climate change in the best-case emission scenario, the moderate-case scenario (SSP245), and the worst-case emissions scenario (SSP585), as well as the entire case emission scenarios, contributed 1.19%, 0.85%, 0.62%, and 0.89%, respectively, in China, as well as 7.248%, 18.416%, 15.71%, and 13.791%, respectively, in India. It is obvious that the contribution of climate change to changes in PAR productivity may decrease under the best-case emission scenario (SSP126) to the worst-case emission scenario (SSP585), ranging from 0.19 to 0.62% in China with correspondingly lower impacts in terms of magnitude compared to India, which registered an increase in the impacts of climate change on changes in PAR productivity with a commensurately increased magnitude.
This indicates that in spite of the rapid urbanization currently taking place in China as a result of industrialization and the economic revolution [106], as seen in Table 11 compared to India, artificial greening [107], such as the cultivation of exotic high-productivity species and applications of scientific irrigation [108], fertilization [109], and pest control to vegetation in the urban areas of China [107], could be a major contributor that curtailed the impacts of climate change on PAR productivity. In order to maximize the benefits of urbanization while minimizing its risks, both countries must develop comprehensive plans that will ensure the protection and conservation of rural resources while enabling balanced urban expansion and development while mitigating the effects of climate change on agricultural productivity.
China and India must implement strategies to reduce the impacts of climate change on agricultural productivity, particularly in areas vulnerable to such changes. This can be done through investing in infrastructure development and sustainable agricultural techniques, providing incentives to farmers, and promoting agroforestry practices. Additionally, both countries must develop and implement effective adaptation strategies to ensure the resilience of rural communities in the face of climate change. Finally, it is important to foster public awareness and engagement regarding the importance of climate-smart agriculture and adaptation. Governments should develop and promote collaborative efforts to promote the use of climate-smart agriculture and adaptation practices, such as diversifying crop production, agroforestry, sustainable land management, and improved irrigation systems.
These initiatives should be coupled with improved social policies to ensure the well-being of farmers and their families. To reduce the impact of climate change, both countries must take steps to reduce emissions and increase resilience through adaptation measures. Policies should include the development and deployment of renewable energy sources, the promotion of energy efficiency, and the reduction of greenhouse gas emissions through carbon pricing and other market-based instruments.

3.5.3. Contributions of Photosynthetic Residual Factor to Changes in PAR under Various Scenarios

Thirdly, the contribution of the photosynthetic residual factor (PRF) in the best-case emission scenario, moderate-case emission scenario, worst-case emission scenario, and the entire case-emission scenario to the changes in photosynthetic productivity were 48.63%, 51.02%, 49.27%, and 49.64%, respectively, in China, as well as 80.99%, 45.88%, 46.50%, and 57.79%, respectively, in India, as presented in Table 11. In contrast to the contribution of climate change, the contribution of the photosynthetic residual factor decreased from the best-case emission scenario to the moderate-case emission scenario and slightly increased in the worst-case emission scenario in India; however, the reverse is true in the case of China. In India, under the best-case emission scenario, the contribution of the photosynthetic residual factor (PRF) reached its highest level (80.99%), whereas China registered its highest PRF of 51.02% under the moderate-case emission scenario.
Overall, the photosynthetic residual factor was found to have a significant influence on photosynthetic productivity in both India and China. Therefore, the difference in PRF between China and India is significant, indicating that the photosynthetic residual factor had a greater impact on photosynthetic productivity in India than it did in China. This discrepancy indicates that the photosynthetic residual factor may be a more important determinant of photosynthetic productivity in India than in China. These findings suggest that the photosynthetic residual factor plays an important role in driving photosynthetic productivity in both India and China and that further study of the photosynthetic residual factor should be conducted in order to gain a better understanding of its influence on photosynthetic productivity in both countries. The results of this study suggest that the photosynthetic residual factor should be taken into account when assessing the overall productivity of photosynthetic systems in both India and China. The photosynthetic residual factor (PRF) measures the amount of light energy that remains after photosynthesis and is an important determinant of photosynthetic productivity in both India and China. This discrepancy between India and China indicates that the PRF is an important factor influencing photosynthetic productivity in both countries and should be taken into account when assessing photosynthetic productivity in order to gain an accurate understanding of the photosynthetic productivity of both countries
Climate-sensitive factors such as temperature and precipitation play a greater role in generating photosynthetic productivity in India than in China, while non-climate sensitive factors such as investment in infrastructure, technology, and agricultural practices play a larger role in China. Despite the differences, both countries have managed to capitalize on these factors to improve their productivity growth significantly in the present and future. The contribution of PRF is dependent on both the type of emission scenario and the country under consideration, with India more dependent on the reduction of non-climate-sensitive factors than the reduction of climate-sensitive factors.
The contribution of PRF to photosynthetic productivity growth is different between India and China due to their differing levels of exposure to climate-sensitive and non-climate sensitive factors. In India, climate-sensitive factors such as temperature and precipitation play a greater role than in China. In China, investment in infrastructure, technology, and agricultural practices play a larger role than in India. These findings suggest that PRF interventions need to be addressed differently in India and China, as India’s economy is more heavily dependent on agriculture and China’s is more diversified. PRF interventions can potentially increase photosynthetic productivity in India and China, but their effectiveness is likely to depend on the country’s level of exposure to climate-sensitive or non-climate sensitive factors and the degree to which interventions are tailored to address these factors.
India’s higher level of exposure and more heavily agrarian economy make it more likely that PRF interventions will have a greater impact than China if they are designed to target climate-sensitive factors specifically. However, a one-size-fits-all approach is not feasible due to the differences between India and China in terms of their level of exposure. Therefore, it is important for the development of effective PRF interventions to take into account the contextual and climate-sensitive factor of the country in order to maximize their potential. PRF interventions should be tailored to the unique needs and conditions of both India and China in order to maximize their potential for increasing PAR productivity. In India, interventions should focus on specific climate-sensitive factors such as technology and infrastructural development, while in China, interventions should take into account the country’s level of exposure to both climate-sensitive and non-climate sensitive factors.
PRF interventions have demonstrated success in improving PAR productivity, but their effectiveness is ultimately contingent upon the degree to which they are tailored to each country’s distinct set of circumstances. In this way, PRF interventions can have a real and lasting impact on PAR productivity if implemented in a way that is able to capitalize on their unique strengths and address their unique challenges in unprecedented ways.

3.5.4. Contributions of Climate Change, Urban Expansion, and Photosynthetic Residual Factor to Changes in PAR under Various Scenarios

Last but not least, in China and India, respectively, the entire emission scenarios, climate change, urbanization, and residual PAR factors contributed 0.89%, 49.47%, and 49.64% of the total respectively. Overall, India’s contribution to PAR productivity from climate change is higher (13.79%) than China’s (0.89%), while China’s (49.47%) impacts from urbanization outweigh India’s (28.41%). However, India (57.79%) and China (49.64%) both contribute significantly more to the residual PAR factor, which could be thought of as the unperturbed intercepted surface downwelling PAR.
This demonstrates unequivocally that while factors such as climate change, urbanization, and the residual PAR factor have affected PAR productivity in both China and India, their effects are very different in each nation. Therefore, it is important to consider the unique contributions of climate change, urbanization, and the residual PAR factor to each country’s respective PAR productivity figures in order to comprehend the complexities and implications of PAR productivity between China and India.
Researchers and policymakers in India and China need to gain a better understanding of the complex interactions between climate change, urban expansion, and residual PAR factors on the two countries’ respective PAR productivity figures in order to develop strategies that would effectively address the discrepancies between India and China in terms of PAR productivity. Overall, the contribution of climate change to PAR productivity is higher in India than China, while the contribution of urban expansion impacts is greater in China compared to India. This could be attributed to India’s position relative to the sun, its latitude, and other terrestrial ecosystem carbon cycles that favor India in terms of climate change and urban expansion impacts. Both countries should strive towards developing policies that reduce these discrepancies and ensure equitable growth across the two countries in order to ensure a prosperous future for the citizens of both countries.

4. Conclusions

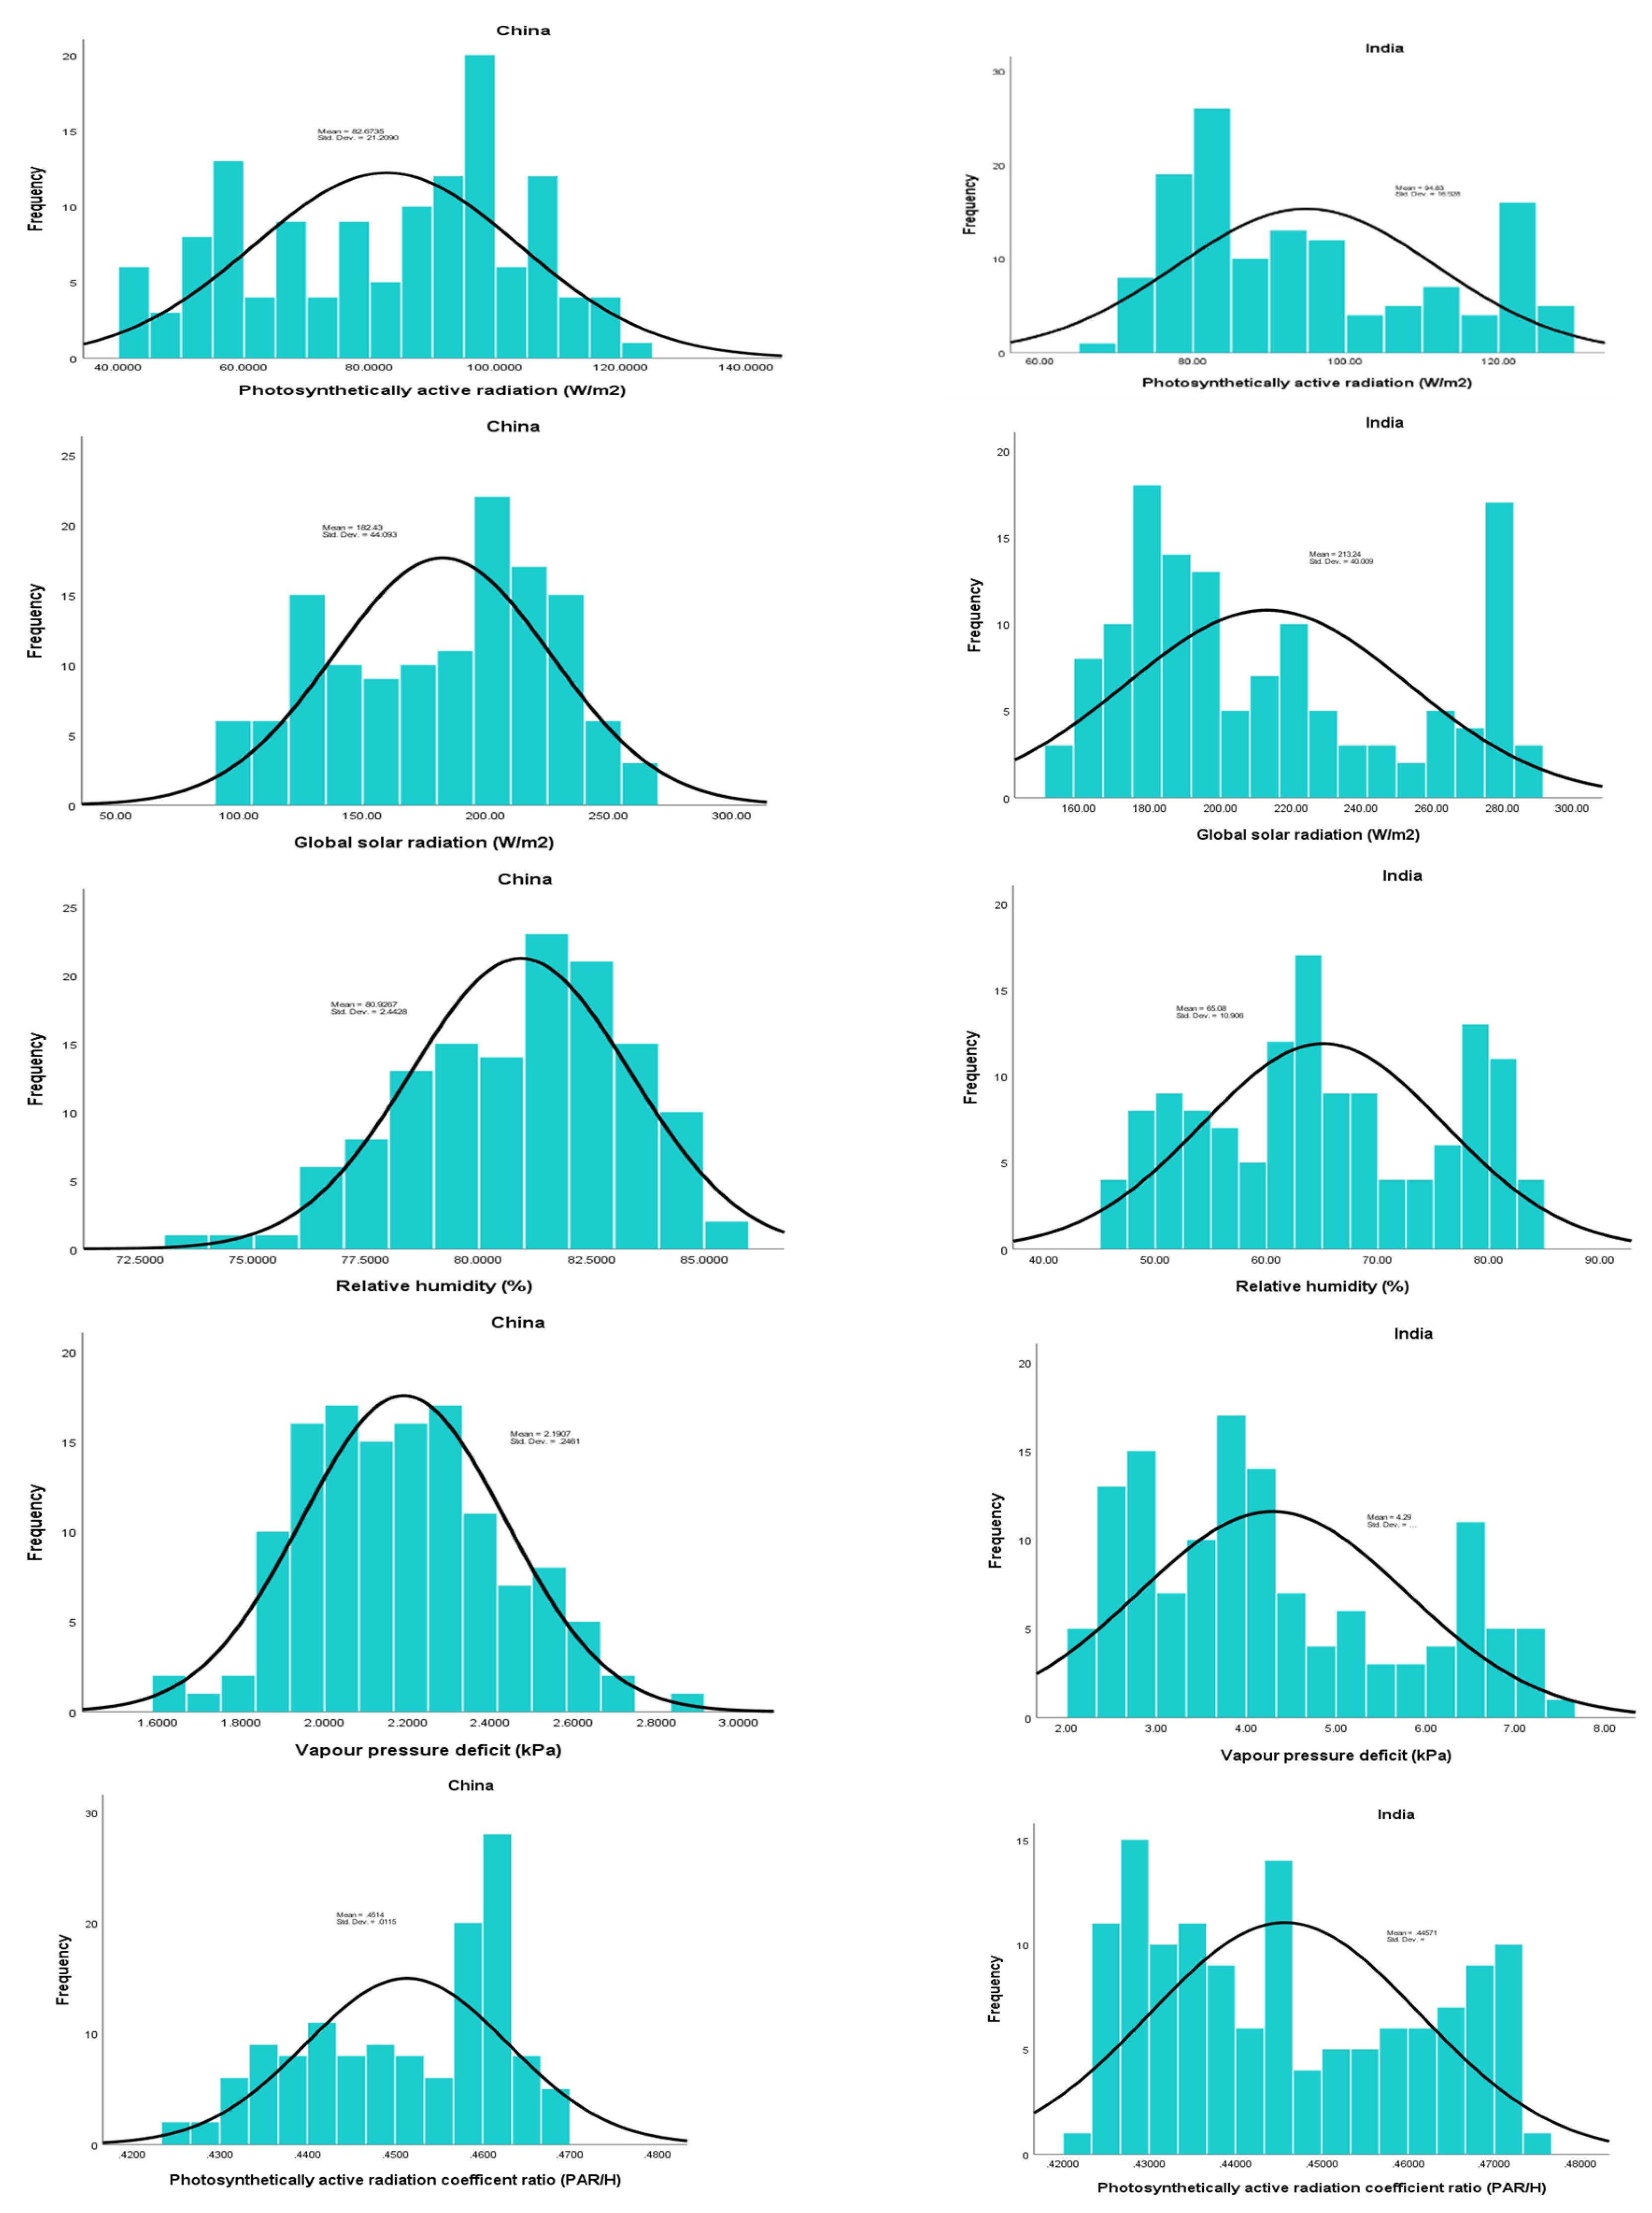
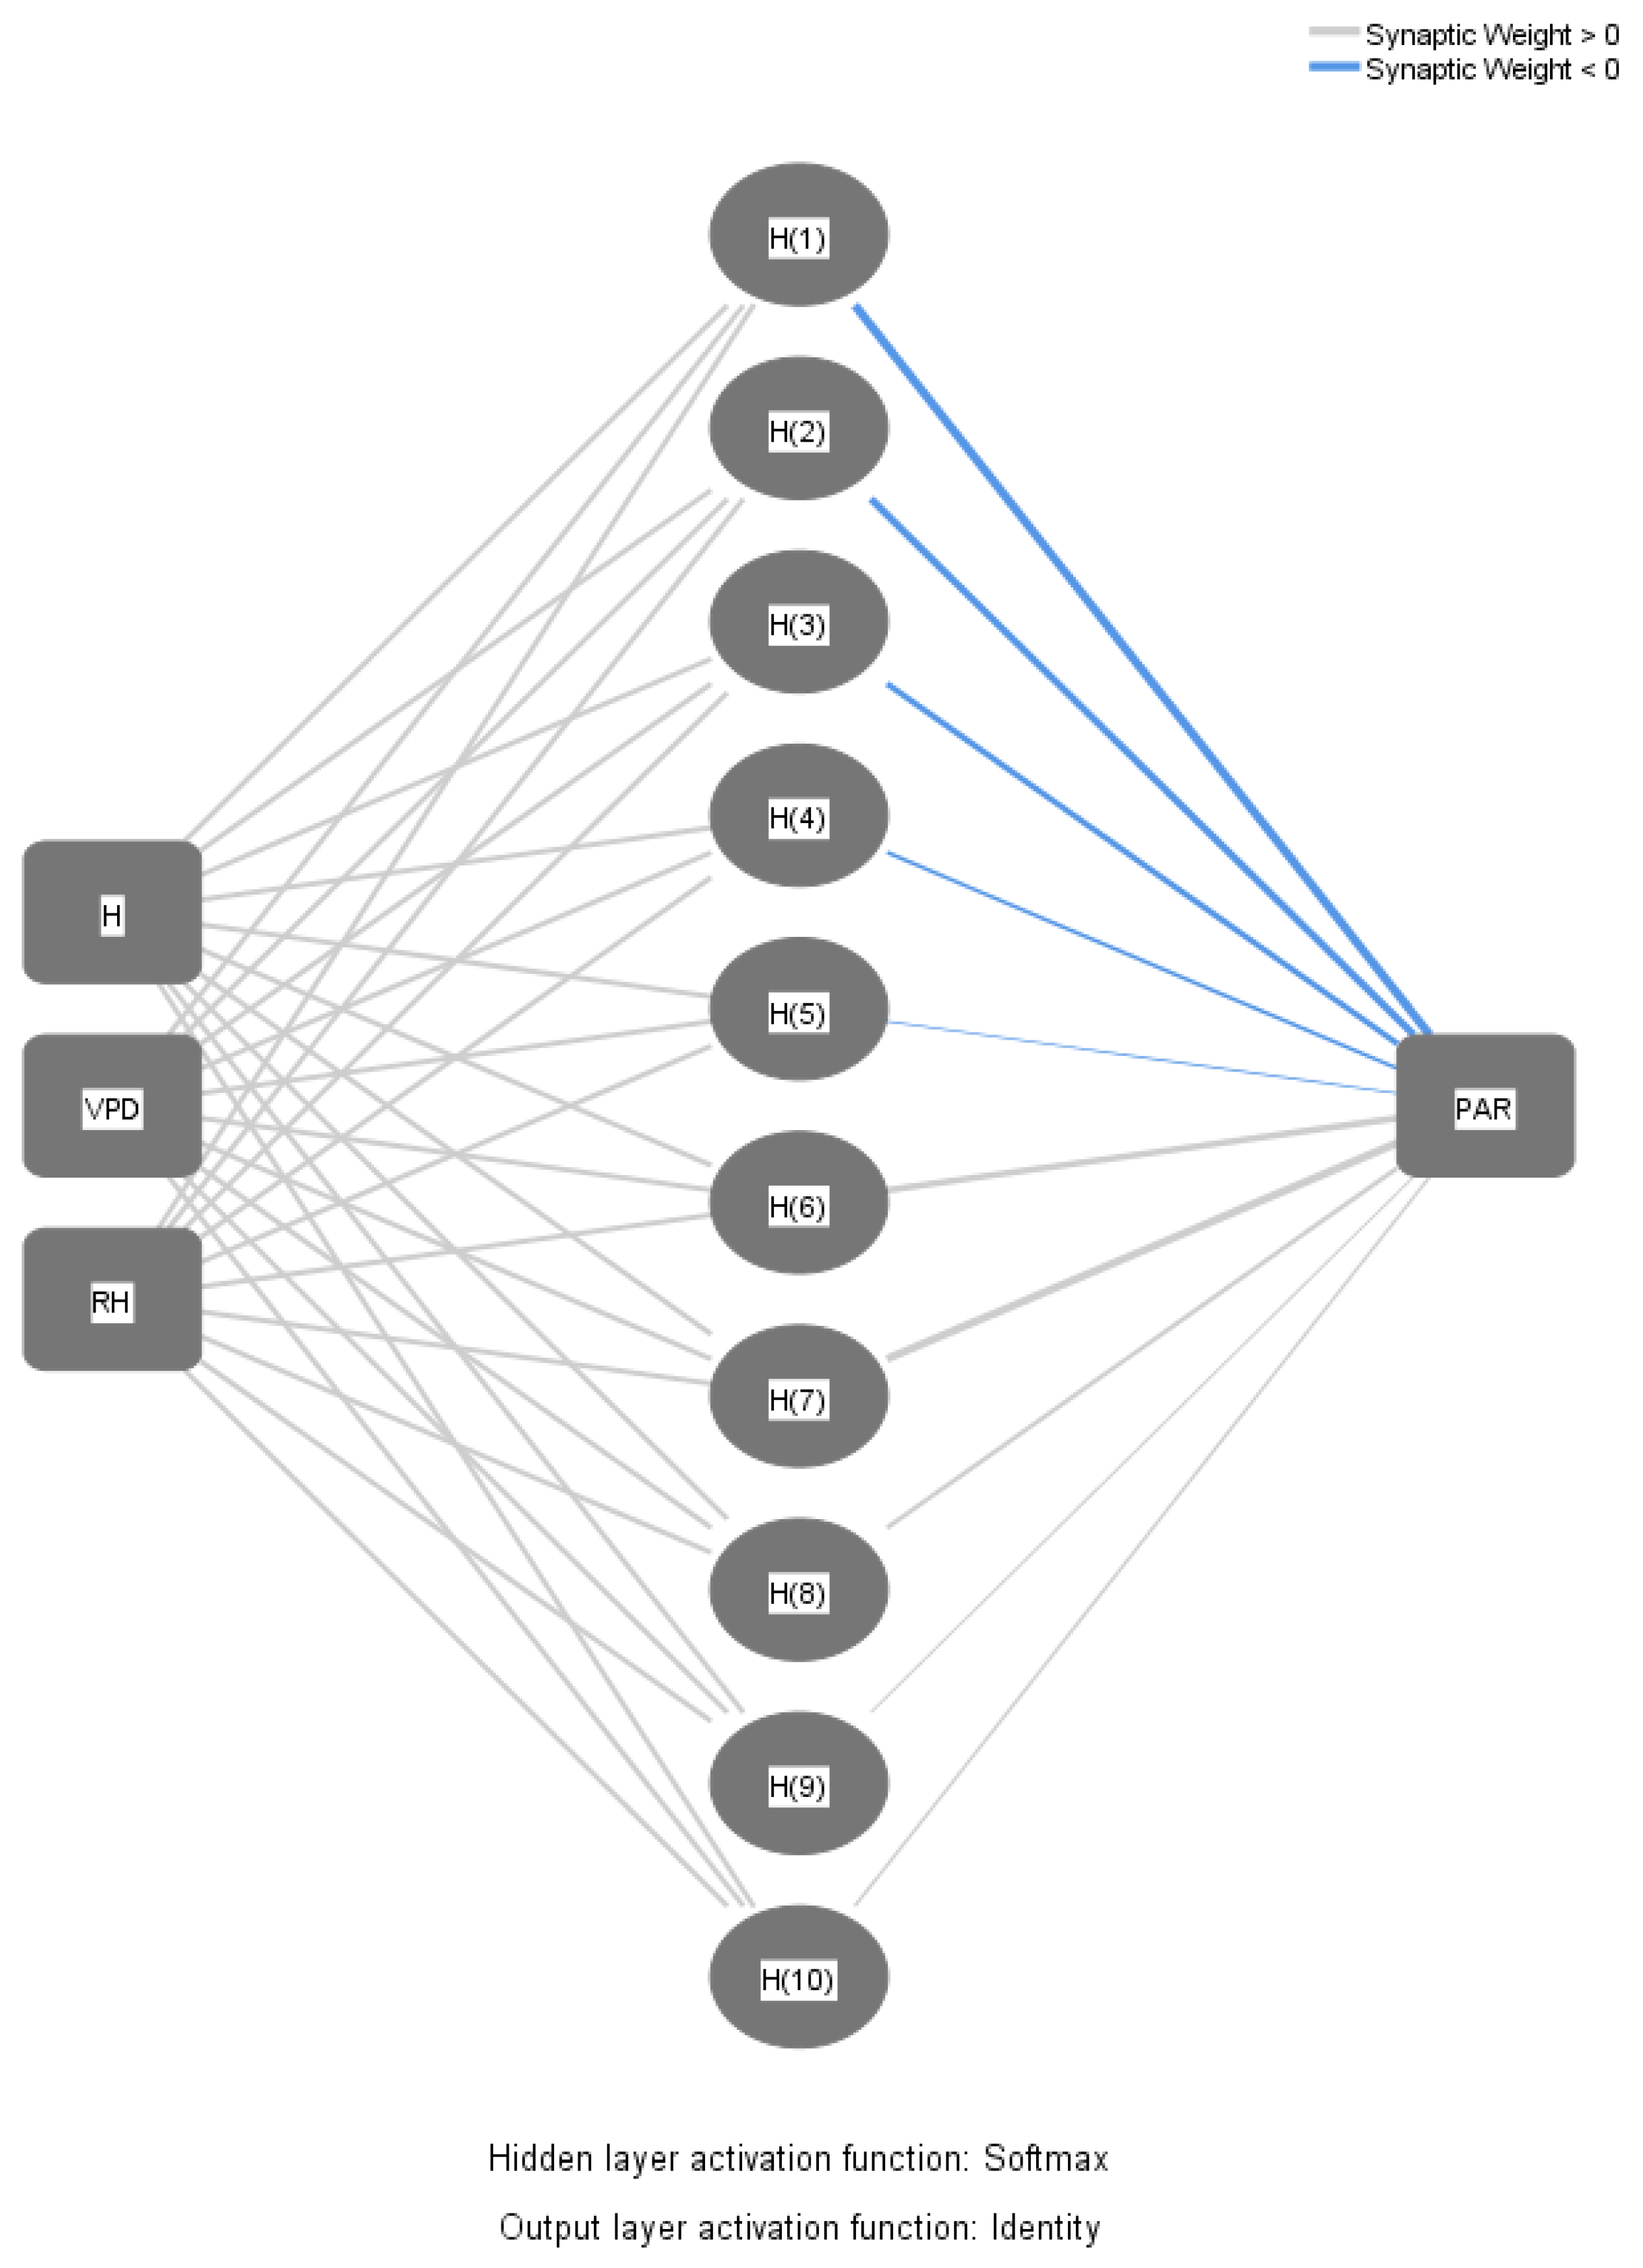
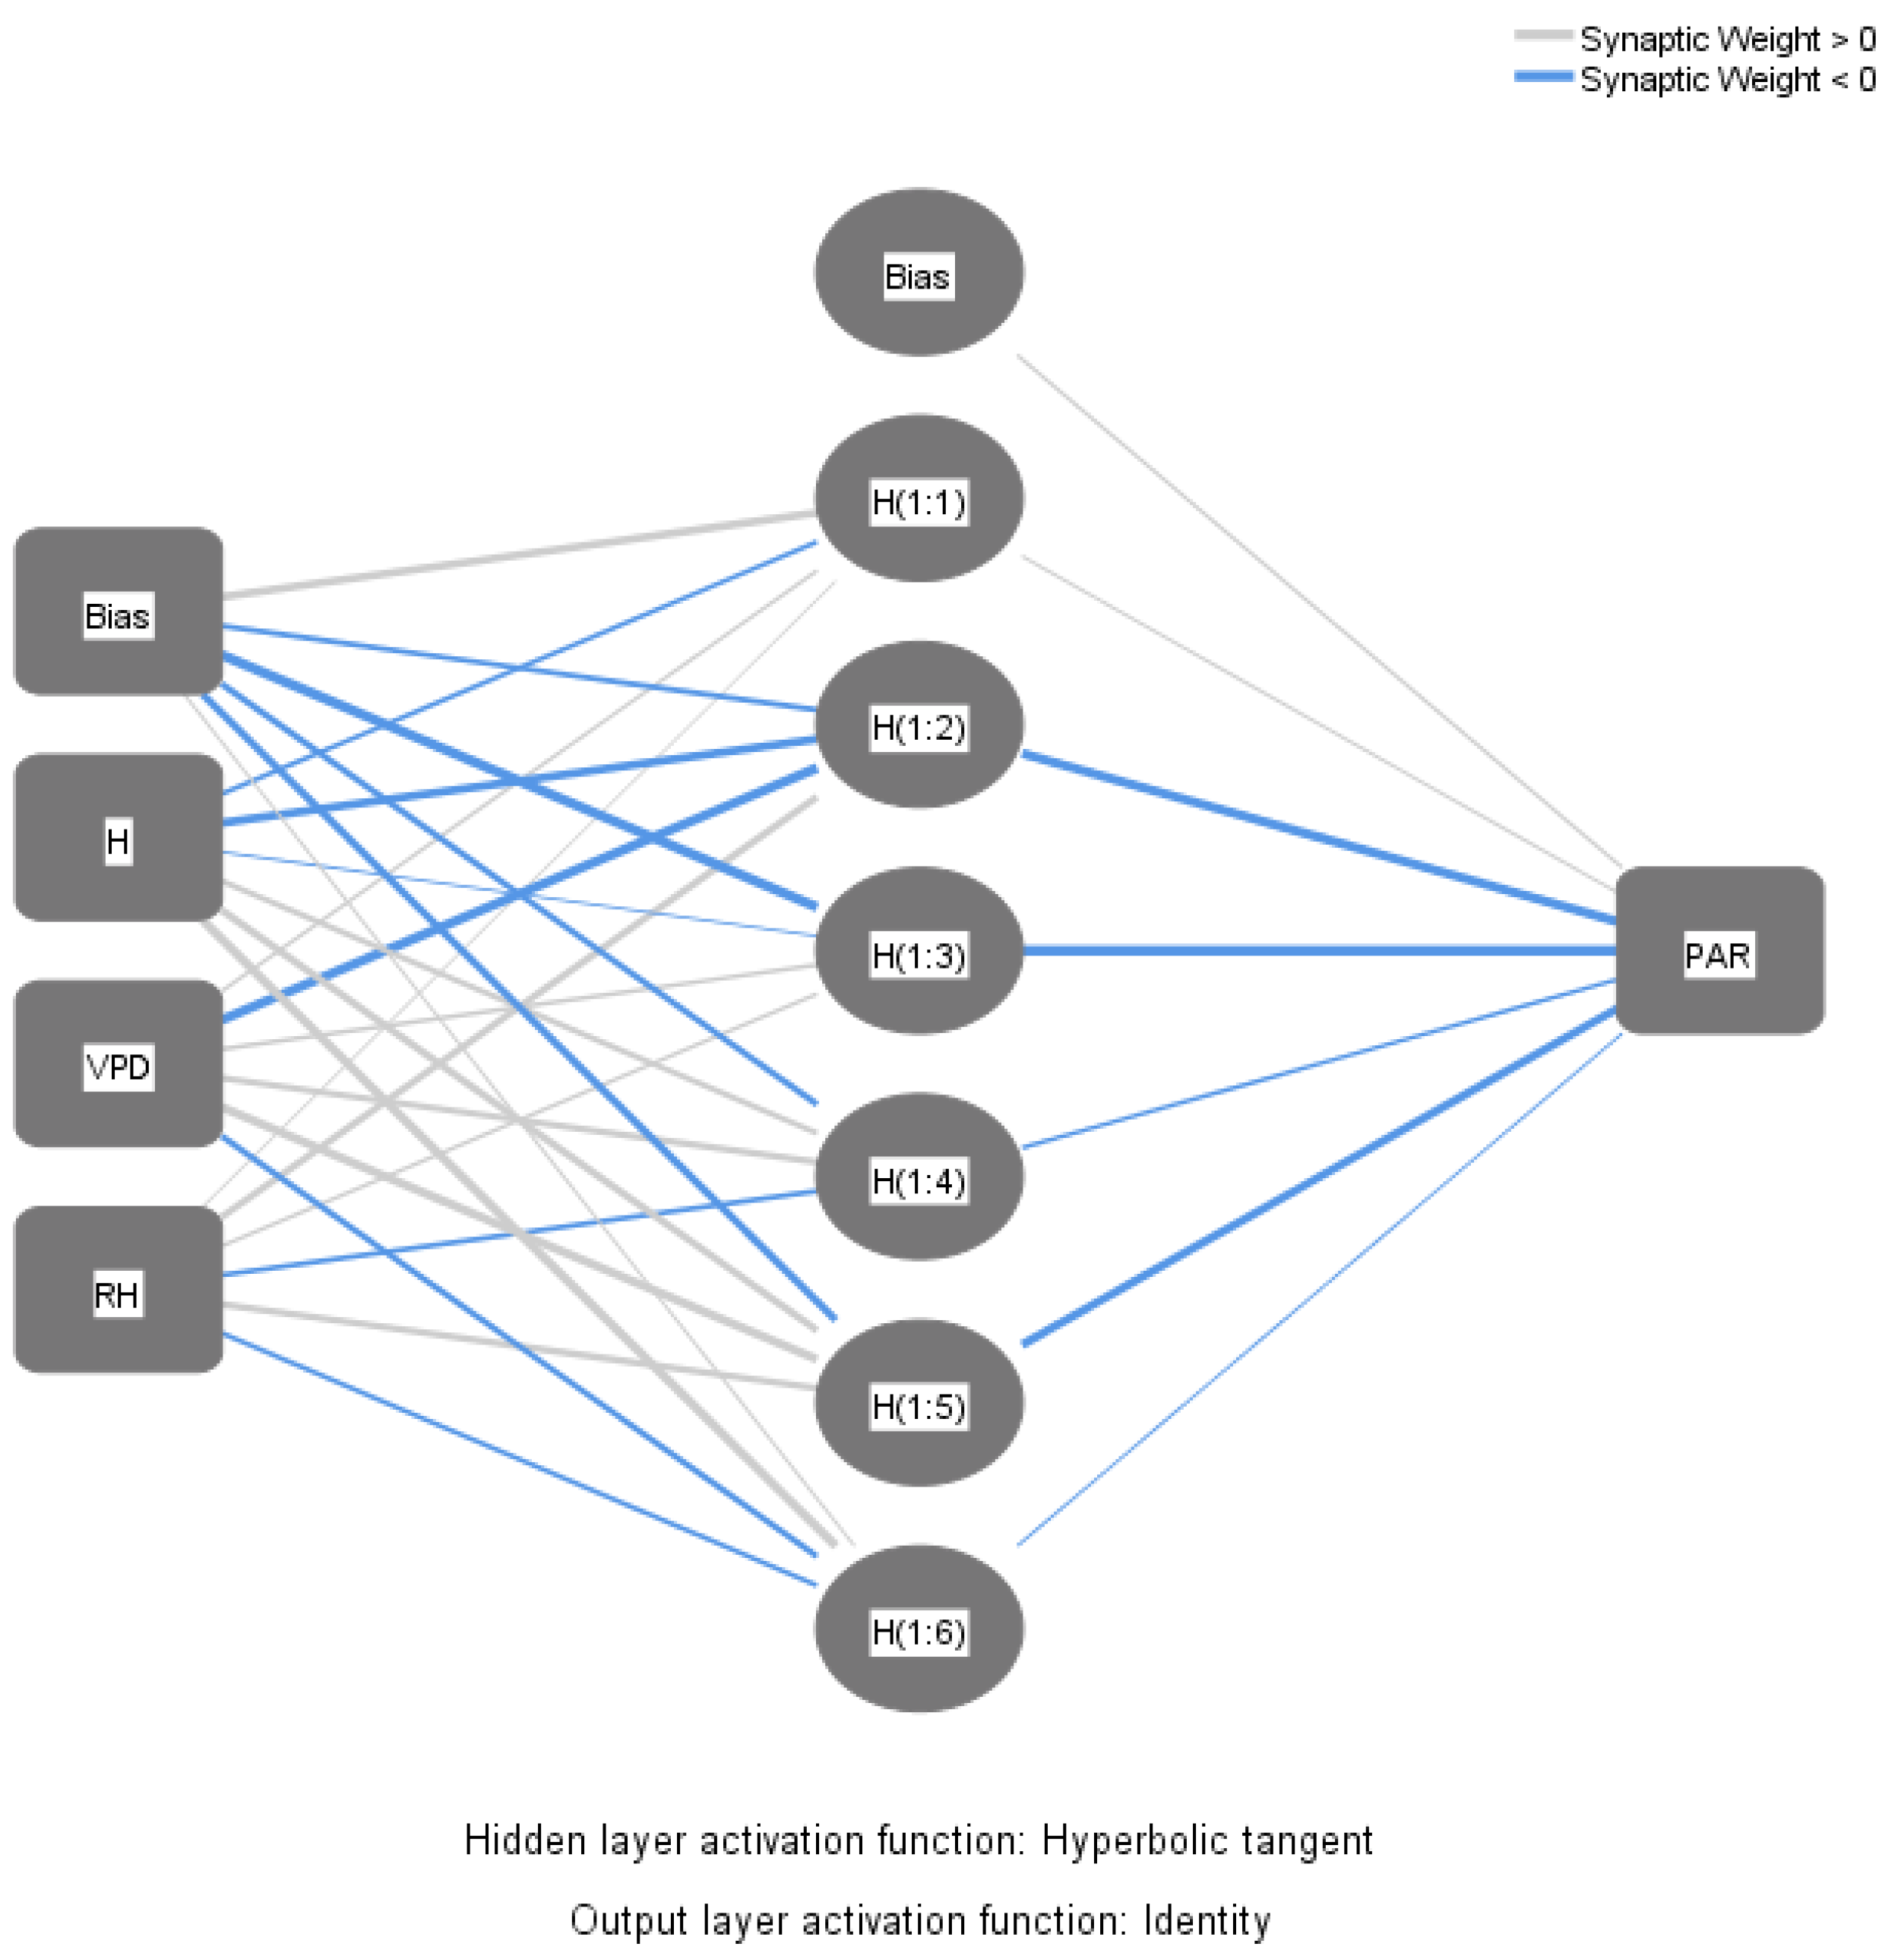
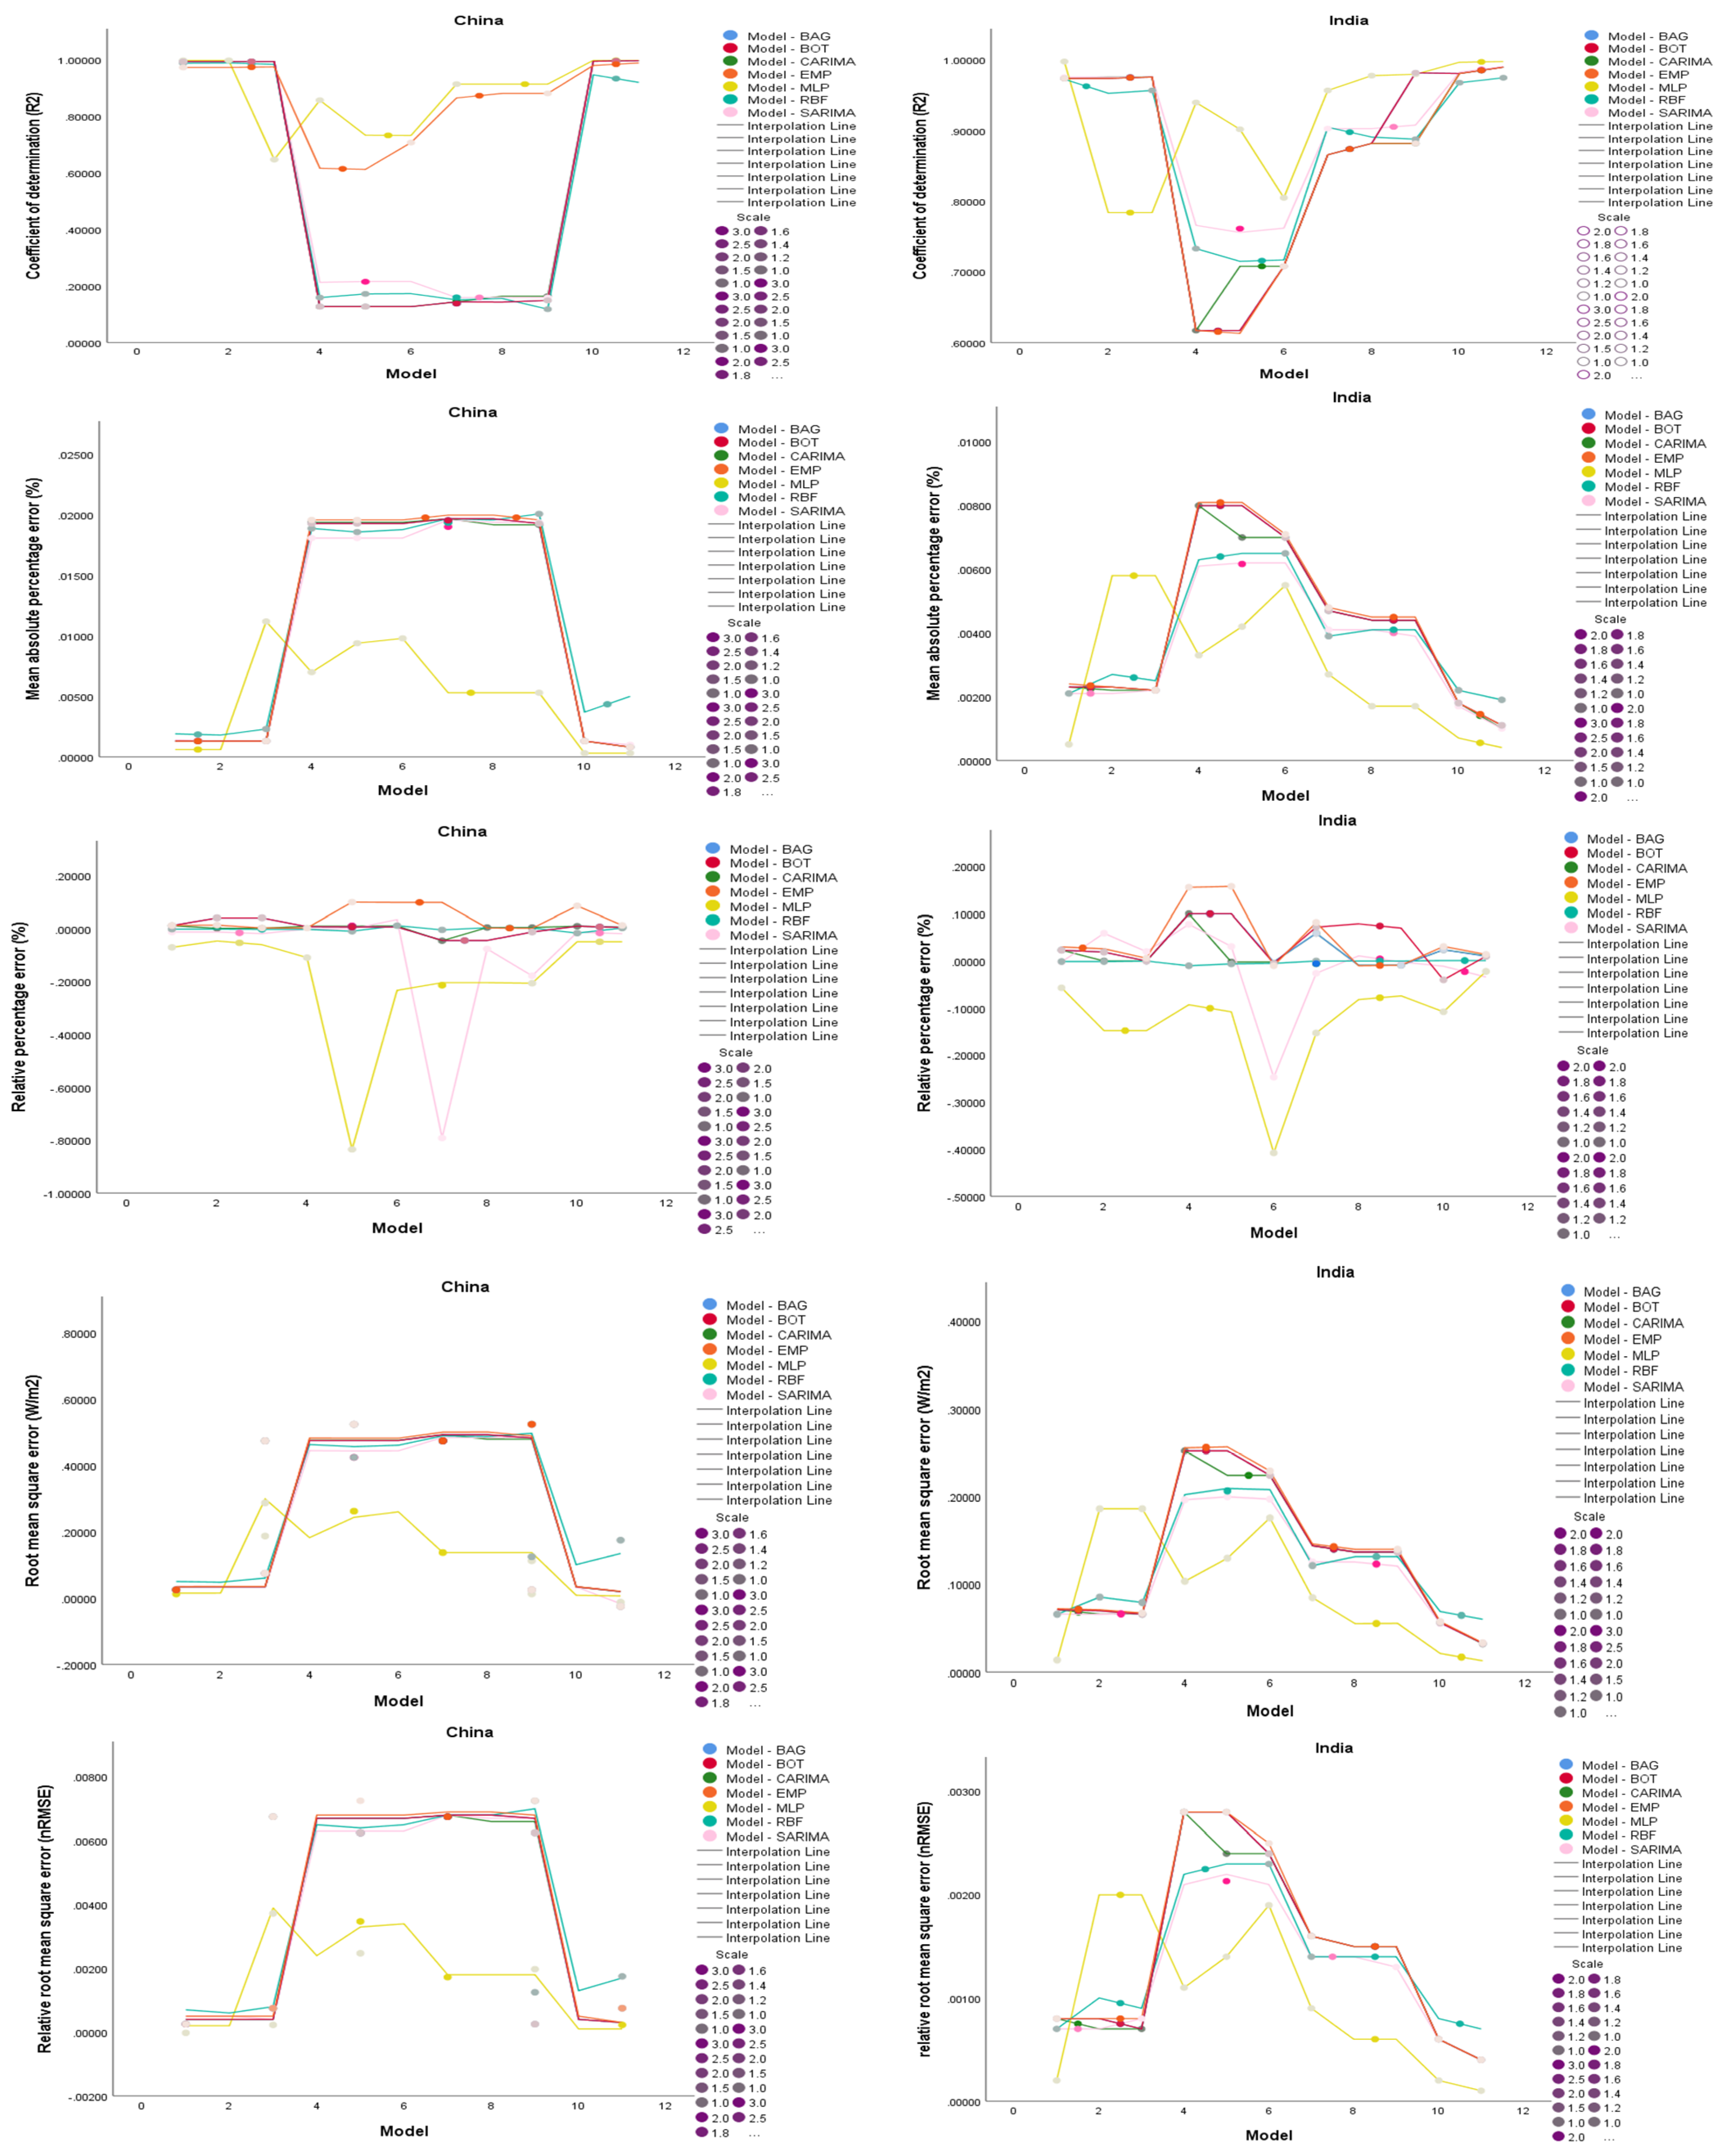
According to the predictions of PAR fluxes obtained in China and India, the MLP-CARIMA-GPM model with the input configuration combination elements H, RH, and VPD is better suited for predicting more accurate PAR data. However, when time and resource consumption are taken into account, particularly in this era of global sustainability, the PAR coefficient ratio model (PCR) may be suggested to be the best balance of performance, resources, and time utilized in China and India, as well as other locations with comparable geographical and climatological characteristics to China and India. China reported an annual average PAR flux range of 40.89–122.50 W/m2 with a corresponding mean value of 82.67 W/m2, while India reported an annual average PAR flux range of 69.85–128.73 W/m2 with a corresponding mean value of 94.83 W/m2. Additionally, China’s annual average PAR ratio had a mean value of 0.4514 and a range of 0.4234 to 0.4695. India was reported to have a range from 0.4215 to 0.4753 and a corresponding mean value of 0.4457.
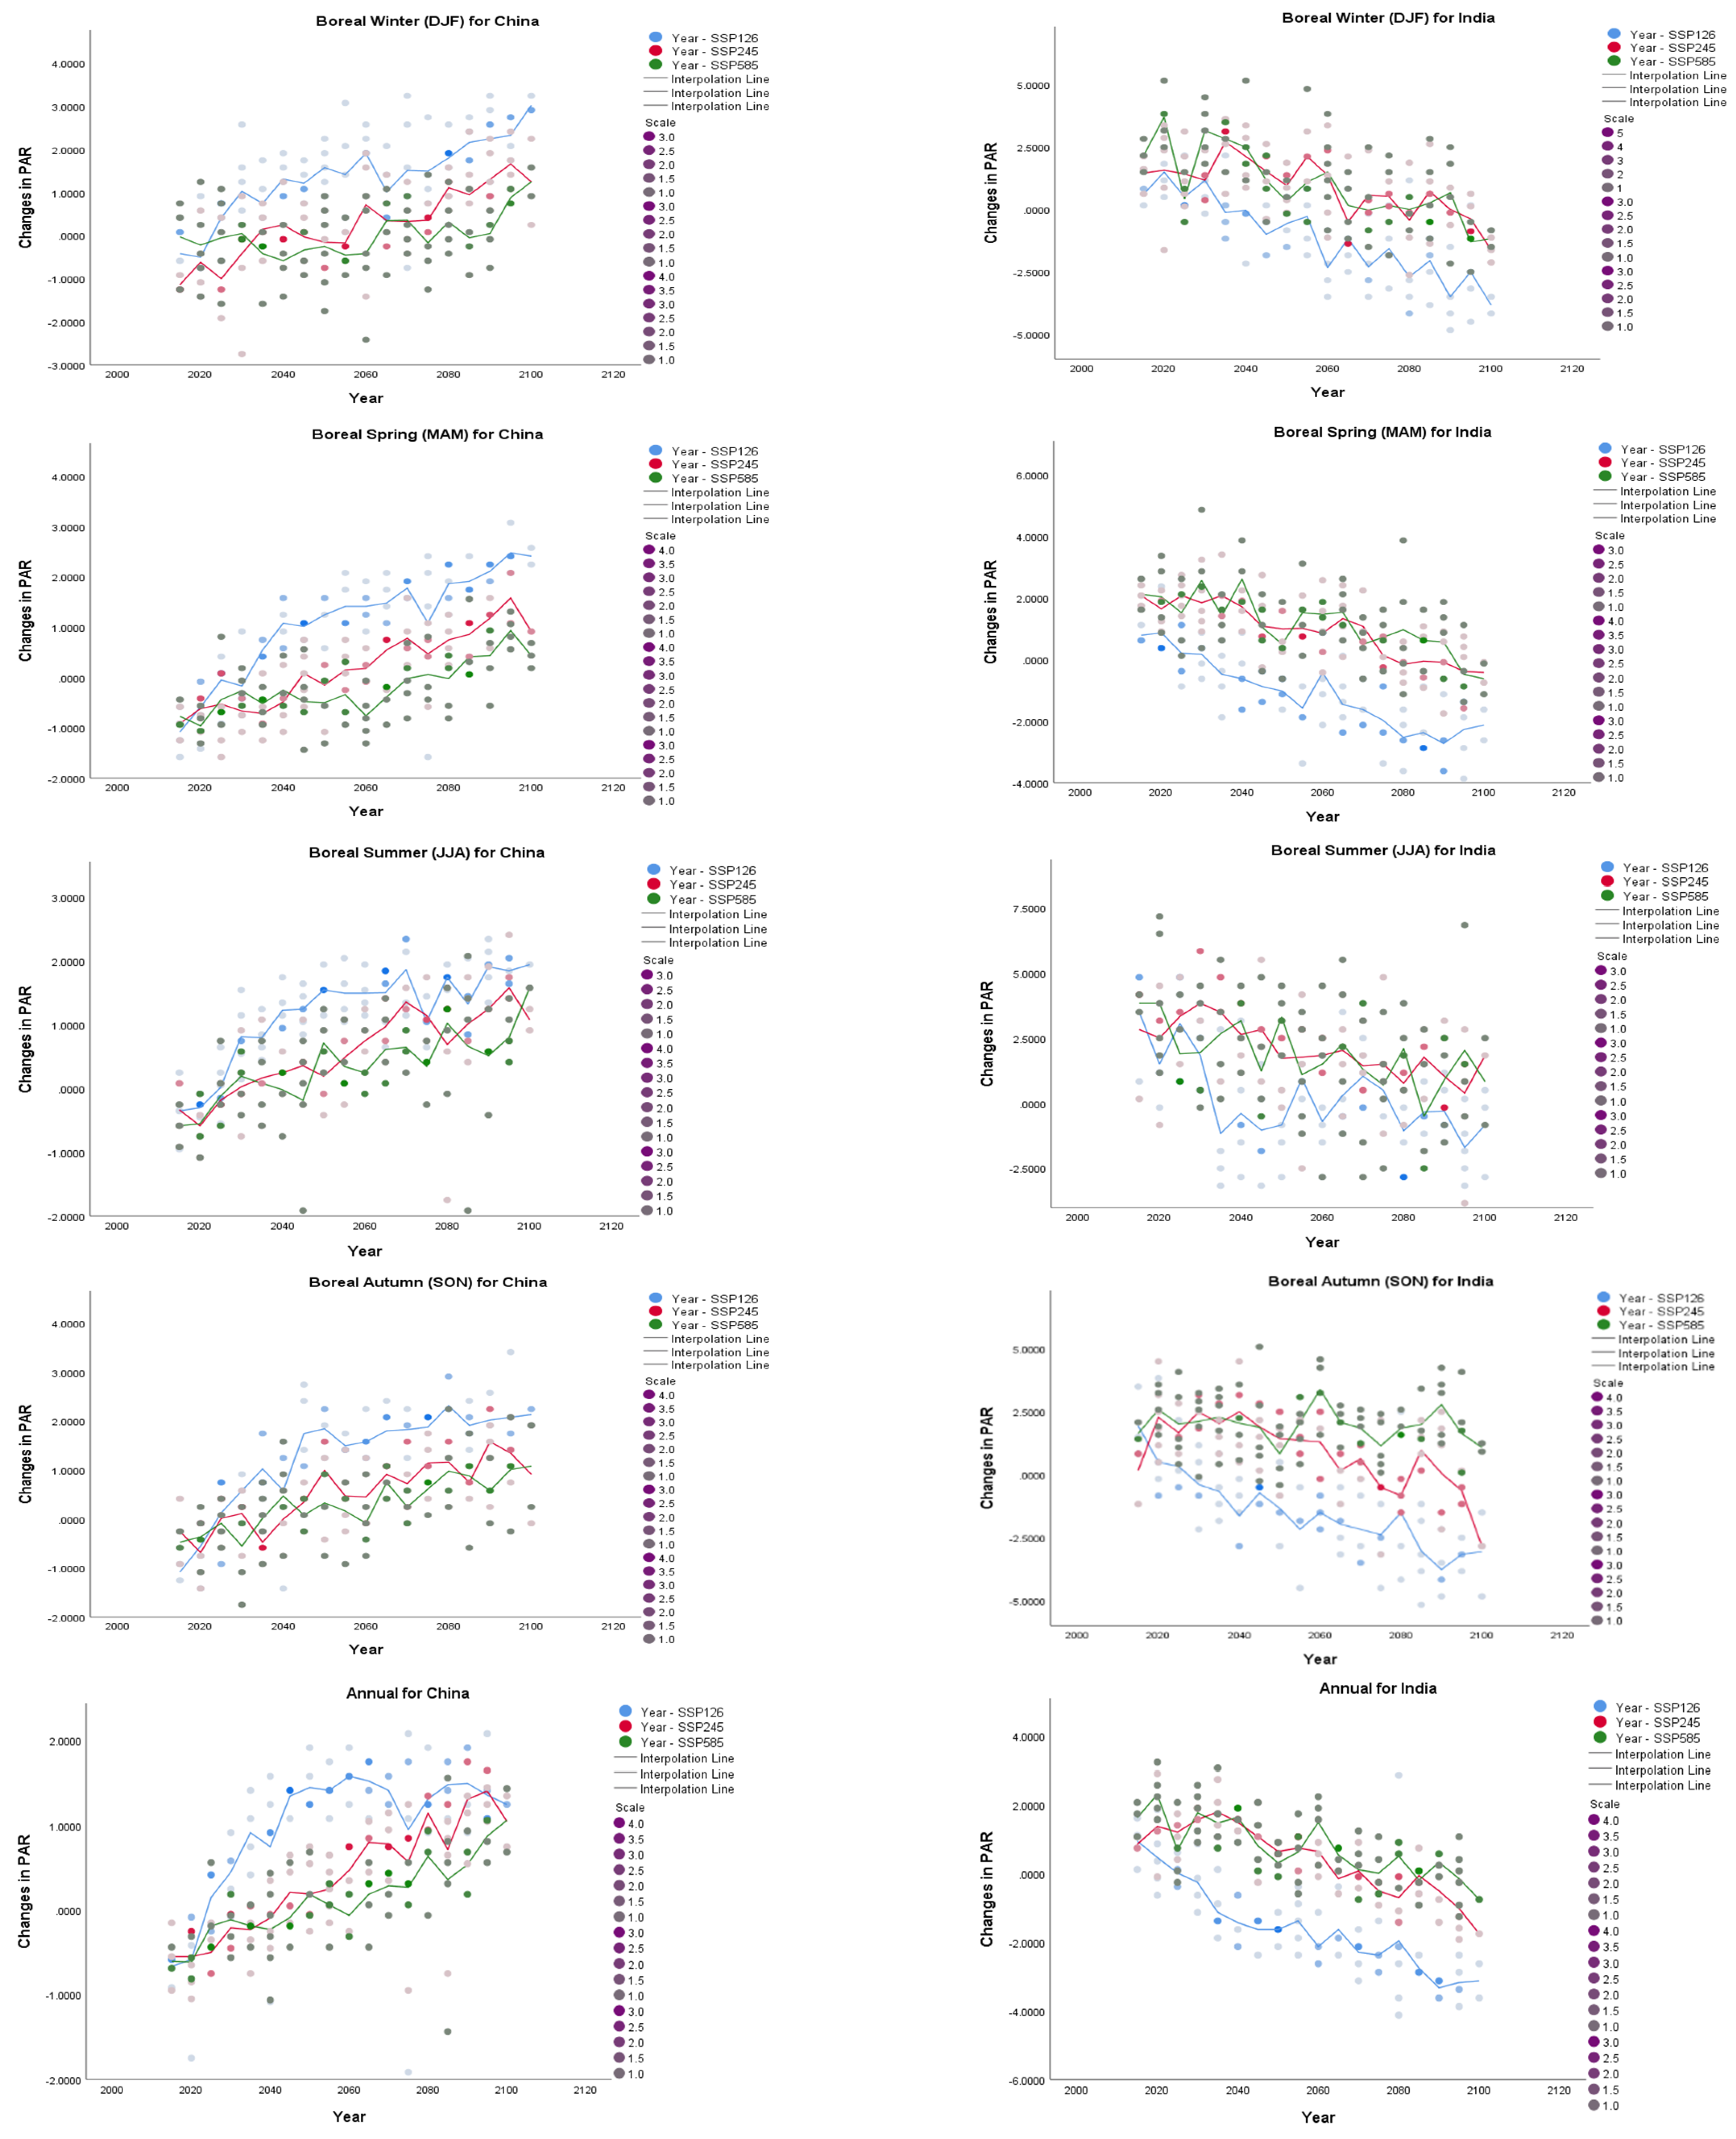
The results of the analysis of the effects of climate change on the PAR fluxes in China and India indicate that these fluxes could change under all scenarios, at all sequencing times, and on an annual basis, depending on whether the effects of climate change on the PAR fluxes are positive or negative. For instance, the potential of PAR productivity in China and India is expected to increase by 0.001 to 2.077% and 0.002 to 6.737%, respectively, on a seasonal and annual basis if the Earth’s circulation system is kept warm by 1.5 °C from now until the end of this century. The potential changes in PAR productivity for China and India could decrease by 0.001 to 0.917% and 0.127 to 2.007%, respectively, if the global warming temperature exceeds 1.5 °C. This indicates that, both seasonally (short-term) and annually (long-term), the effects of climate change on PAR fluxes are predicted to have had only a moderately negative impact (less than 1% on the solar PAR fluxes in China), whereas India is predicted to experience more severe negative impacts of climate change (greater than 2% on the solar PAR fluxes in India) under the same conditions.
Last but not least, under the average emission scenario, China’s climate change, urbanization, and residual PAR productivity factors contributed 0.89%, 49.47%, and 49.64%, respectively, of the total. Overall, India’s contributions to PAR fluxes from climate change were higher (13.79%) than China’s (0.89%), while China’s (49.47%) impacts from urban expansion outweigh India’s (28.41%). However, India’s (57.79%) and China’s (49.64%) both contributed significantly more to the PAR residual factor, which could be thought of as the unperturbed intercepted surface downwelling PAR. Overall, India and China have different contributions from climate change to PAR fluxes, with China having a larger impact from urbanization than India.

Author Contributions

Conceptualization, S.C.N., N.P., E.L.M. and C.C.A.; methodology, S.C.N., N.P., E.L.M. and C.C.A.; software, S.C.N.; validation, S.C.N. and N.P.; formal analysis, S.C.N.; investigation, S.C.N., N.P., E.L.M. and C.C.A.; resources, S.C.N., N.P., E.L.M. and C.C.A.; data curation, S.C.N.; writing—original draft preparation, S.C.N.; writing—review and editing S.C.N., N.P., E.L.M. and C.C.A.; visualization, S.C.N., N.P., E.L.M. and C.C.A.; supervision, S.C.N., N.P., E.L.M. and C.C.A.; project administration, E.L.M.; funding acquisition, N.P. All authors have read and agreed to the published version of the manuscript.

Funding

The manuscript did not receive a grant from any organization.

Institutional Review Board Statement

Not applicable.

Informed Consent Statement

Not applicable.

Data Availability Statement

The European Centre for Medium-Range Weather Forecasts (ECMWF, https://www.ecmwf.int/en/forecasts/datasets/reanalysis-datasets/era5) (accessed on 14 March 2023) provided the historical and projected climate datasets used in this study. The National Aeronautics and Space Administration atmospheric science data center (NASA) provided the historical datasets of photosynthetically active radiation used in this study at: https://power.larc.nasa.gov/data-access-viewer/ (accessed on 14 March 2023).

Acknowledgments

The authors are grateful to the National Aeronautics and Space Administration (NASA) atmospheric science data center, and the European Centre for Medium-Range Weather Forecasts (ECMWF), for providing the data used in this research.

Conflicts of Interest

The authors declare no conflict of interest.

References

  1. Kumn, M.; Nolle, L.; Stahl, F.; Ahlem Jemai, O.Z. On an Artificial Neural Network Approach for Predicting Photosynthetically Active Radiation in the Water Column. In Artificial Intelligence XXXIX; Springer: Berlin/Heidelberg, Germany, 2022; pp. 112–123. [Google Scholar]
  2. Wane, O.; Ramírez Ceballos, J.A.; Ferrera-Cobos, F.; Navarro, A.A.; Valenzuela, R.X.; Zarzalejo, L.F. Comparative Analysis of Photosynthetically Active Radiation Models Based on Radiometric Attributes in Mainland Spain. Land 2022, 11, 1868. [Google Scholar] [CrossRef]
  3. Yang, S.; Zhang, X.; Xu, J.; Feng, C.; Guan, S.; Yao, Y.; Jia, K. Quantification of the Urbanization Impacts on Solar Dimming and Brightening over China. Environ. Res. Lett. 2022, 17, 084001. [Google Scholar] [CrossRef]
  4. Obiwulu, A.U.; Erusiafe, N.; Olopade, M.A.; Nwokolo, S.C. Modeling and Estimation of the Optimal Tilt Angle, Maximum Incident Solar Radiation, and Global Radiation Index of the Photovoltaic System. Heliyon 2022, 8, e09598. [Google Scholar] [CrossRef] [PubMed]
  5. Proutsos, N.; Alexandris, S.; Liakatas, A.; Nastos, P.; Tsiros, I.X. PAR and UVA Composition of Global Solar Radiation at a High Altitude Mediterranean Forest Site. Atmos. Res. 2022, 269, 106039. [Google Scholar] [CrossRef]
  6. Proutsos, N.; Liakatas, A.; Alexandris, S. Ratio of Photosynthetically Active to Total Incoming Radiation above a Mediterranean Deciduous Oak Forest. Theor. Appl. Clim. 2019, 137, 2927–2939. [Google Scholar] [CrossRef]
  7. Proutsos, N.D.; Liakatas, A.; Alexandris, S.G.; Tsiros, I.X.; Tigkas, D.; Halivopoulos, G. Atmospheric Factors Affecting Global Solar and Photosynthetically Active Radiation Relationship in a Mediterranean Forest Site. Atmosphere 2022, 13, 1207. [Google Scholar] [CrossRef]
  8. Nwokolo, S.C.; Ogbulezie, J.C.; Kabele, T.C.; Alwell, J.S. Estimations of Photosynthetically Active Radiation over Different Climatic Zones in Nigeria. SPC J. Energy 2018. [Google Scholar] [CrossRef]
  9. Proutsos, N.; Solomou, A.; Karetsos, G.; Tsagari, K.; Mantakas, G.; Kaoukis, K.; Bourletsikas, A.; Lyrintzis, G. The Ecological Status of Juniperus Foetidissima Forest Stands in the Mt. Oiti-Natura 2000 Site in Greece. Sustainability 2021, 13, 3544. [Google Scholar] [CrossRef]
  10. Obiwulu, A.U.; Chendo, M.A.C.; Erusiafe, N.; Nwokolo, S.C. Implicit Meteorological Parameter-Based Empirical Models for Estimating Back Temperature Solar Modules under Varying Tilt-Angles in Lagos, Nigeria. Renew. Energy 2020, 145, 442–457. [Google Scholar] [CrossRef]
  11. Obiwulu, A.U.; Erusiafe, N.; Olopade, M.A.; Nwokolo, S.C. Modeling and Optimization of Back Temperature Models of Mono-Crystalline Silicon Modules with Special Focus on the Effect of Meteorological and Geographical Parameters on PV Performance. Renew. Energy 2020, 154, 404–431. [Google Scholar] [CrossRef]
  12. Nwokolo, S.C. A Comprehensive Review of Empirical Models for Estimating Global Solar Radiation in Africa. Renew. Sustain. Energy Rev. 2017, 78, 955–995. [Google Scholar] [CrossRef]
  13. Nwokolo, S.C.; Ogbulezie, J.C. A Qualitative Review of Empirical Models for Estimating Diffuse Solar Radiation from Experimental Data in Africa. Renew. Sustain. Energy Rev. 2018, 92, 353–393. [Google Scholar] [CrossRef]
  14. Nwokolo, S.; Ogbulezie, J.C. Modeling the Influence of Relative Humidity on Photosynthetically Active Radiation from Global Horizontal Irradiation in Six Tropical Ecological Zones in Nigeria. N. Y. Sci. J. 2016, 9, 40–55. [Google Scholar] [CrossRef]
  15. Nwokolo, S.C.; Ogbulezie, J.C. A Quantitative Review and Classification of Empirical Models for Predicting Global Solar Radiation in West Africa. Beni-Suef. Univ. J. Basic Appl. Sci. 2018, 7, 367–396. [Google Scholar] [CrossRef]
  16. Agbor, M.; Udo, S.; Ewona, I.; Nwokolo, S.; Ogbulezie, J.; Amadi, S.; Billy, U. Effects of Angstrom-Prescott and Hargreaves-Samani Coefficients on Climate Forcing and Solar PV Technology Selection in West Africa. Trends Renew. Energy 2023, 9, 78–106. [Google Scholar] [CrossRef]
  17. Agbor, M.; Udo, S.; Ewona, I.; Nwokolo, S.; Ogbulezie, J.A. Potential Impacts of Climate Change on Global Solar Radiation and PV Output Using the CMIP6 Model in West Africa. Clean. Eng. Technol. 2023, in press. [Google Scholar]
  18. Hassan, M.A.; Bailek, N.; Bouchouicha, K.; Nwokolo, S.C. Ultra-Short-Term Exogenous Forecasting of Photovoltaic Power Production Using Genetically Optimized Non-Linear Auto-Regressive Recurrent Neural Networks. Renew. Energy 2021, 171, 191–209. [Google Scholar] [CrossRef]
  19. Hassan, M.A.; Bailek, N.; Bouchouicha, K.; Ibrahim, A.; Jamil, B.; Kuriqi, A.; Nwokolo, S.C. Evaluation of Energy Extraction of PV Systems Affected by Environmental Factors under Real Outdoor Conditions. Theor. Appl. Clim. 2022, 150, 715–729. [Google Scholar] [CrossRef]
  20. Liang, S.; Zhao, X.; Liu, S.; Yuan, W.; Cheng, X.; Xiao, Z.; Zhang, X.; Liu, Q.; Cheng, J.; Tang, H.; et al. A Long-Term Global LAnd Surface Satellite (GLASS) Data-Set for Environmental Studies. Int. J. Digit. Earth 2013, 6, 5–33. [Google Scholar] [CrossRef]
  21. Ryu, Y.; Jiang, C.; Kobayashi, H.; Detto, M. MODIS-Derived Global Land Products of Shortwave Radiation and Diffuse and Total Photosynthetically Active Radiation at 5 Km Resolution from 2000. Remote Sens. Environ. 2018, 204, 812–825. [Google Scholar] [CrossRef]
  22. Frouin, R.; Murakami, H. Estimating Photosynthetically Available Radiation at the Ocean Surface from ADEOS-II Global Imager Data. J. Oceanogr. 2007, 63, 493–503. [Google Scholar] [CrossRef]
  23. Apeh, O.O.; Meyer, E.L.; Overen, O.K. Contributions of Solar Photovoltaic Systems to Environmental and Socioeconomic Aspects of National Development—A Review. Energies 2022, 15, 5963. [Google Scholar] [CrossRef]
  24. Nwokolo, S.C.; Obiwulu, A.U.; Ogbulezie, J.C. Machine Learning and Analytical Model Hybridization to Assess the Impact of Climate. Phys. Chem. Earth 2023, 120, 103389. [Google Scholar] [CrossRef]
  25. Meyer, E.L.; Overen, O.K. Towards a Sustainable Rural Electrification Scheme in South Africa: Analysis of the Status Quo. Energy Rep. 2021, 7, 4273–4287. [Google Scholar] [CrossRef]
  26. Apeh, O.O.; Overen, O.K.; Meyer, E.L. Monthly, Seasonal and Yearly Assessments of Global Solar Radiation, Clearness Index and Diffuse Fractions in Alice, South Africa. Sustainability 2021, 13, 2135. [Google Scholar] [CrossRef]
  27. Overen, O.K.; Meyer, E.L. Solar Energy Resources and Photovoltaic Power Potential of an Underutilised Region: A Case of Alice, South Africa. Energies 2022, 15, 4646. [Google Scholar] [CrossRef]
  28. Proutsos, N.; Liakatas, A.; Alexandris, S.; Tsiros, I. Carbon Fluxes above a Deciduous Forest in Greece. Atmosfera 2017, 30, 311–322. [Google Scholar] [CrossRef] [Green Version]
  29. Amadi, S.; Dike, T.; Nwokolo, S. Global Solar Radiation Characteristics at Calabar and Port Harcourt Cities in Nigeria. Trends Renew. Energy 2020, 6, 101–120. [Google Scholar] [CrossRef]
  30. Nwokolo, S.; Otse, C. Impact of Sunshine Duration and Clearness Index on Diffuse Solar Radiation Estimation in Mountainous Climate. Trends Renew. Energy 2019, 5, 307–332. [Google Scholar] [CrossRef]
  31. Wang, C.; Du, J.; Liu, Y.; Chow, D. A Climate-Based Analysis of Photosynthetically Active Radiation Availability in Large-Scale Greenhouses across China. J. Clean. Prod. 2021, 315, 127901. [Google Scholar] [CrossRef]
  32. Dee, D.P.; Uppala, S.M.; Simmons, A.J.; Berrisford, P.; Poli, P.; Kobayashi, S.; Andrae, U.; Balmaseda, M.A.; Balsamo, G.; Bauer, P.; et al. The ERA-Interim Reanalysis: Configuration and Performance of the Data Assimilation System. Q. J. R. Meteorol. Soc. 2011, 137, 553–597. [Google Scholar] [CrossRef]
  33. Gitelson, A.; Arkebauer, T.; Viña, A.; Skakun, S.; Inoue, Y. Evaluating Plant Photosynthetic Traits via Absorption Coefficient in the Photosynthetically Active Radiation Region. Remote Sens. Environ. 2021, 258, 112401. [Google Scholar] [CrossRef]
  34. Hao, D.; Asrar, G.R.; Zeng, Y.; Zhu, Q.; Wen, J.; Xiao, Q.; Chen, M. Estimating Hourly Land Surface Downward Shortwave and Photosynthetically Active Radiation from DSCOVR/EPIC Observations. Remote Sens. Environ. 2019, 232, 111320. [Google Scholar] [CrossRef]
  35. Hao, D.; Asrar, G.R.; Zeng, Y.; Zhu, Q.; Wen, J.; Xiao, Q.; Chen, M. DSCOVR/EPIC-Derived Global Hourly and Daily Downward Shortwave and Photosynthetically Active Radiation Data at 0.1° × 0.1° Resolution. Earth Syst. Sci. Data 2020, 12, 2209–2221. [Google Scholar] [CrossRef]
  36. Moon, P. Proposed Standard Solar-Radiation Curves for Engineering Use. J. Franklin Inst. 1940, 230, 583–617. [Google Scholar] [CrossRef]
  37. Nwokolo, S.C.; Amadi, S.O. A Global Review of Empirical Models for Estimating Photosynthetically Active Radiation. Trends Renew. Energy 2018, 4, 236–327. [Google Scholar] [CrossRef] [Green Version]
  38. Zhen, S.; Bugbee, B. Far-Red Photons Have Equivalent Efficiency to Traditional Photosynthetic Photons: Implications for Redefining Photosynthetically Active Radiation. Plant Cell Environ. 2020, 43, 1259–1272. [Google Scholar] [CrossRef]
  39. Tang, W.; Qin, J.; Yang, K.; Niu, X.; Min, M.; Liang, S. An Efficient Algorithm for Calculating Photosynthetically Active Radiation with MODIS Products. Remote Sens. Environ. 2017, 194, 146–154. [Google Scholar] [CrossRef]
  40. Oliphant, A.J.; Stoy, P.C. An Evaluation of Semiempirical Models for Partitioning Photosynthetically Active Radiation into Diffuse and Direct Beam Components. J. Geophys. Res. Biogeosci. 2018, 123, 889–901. [Google Scholar] [CrossRef]
  41. Kobayashi, S.; Ota, Y.; Harada, Y.; Ebita, A.; Moriya, M.; Onoda, H.; Onogi, K.; Kamahori, H.; Kobayashi, C.; Endo, H.; et al. The JRA-55 Reanalysis: General Specifications and Basic Characteristics. J. Meteorol. Soc. Jpn. 2015, 93, 5–48. [Google Scholar] [CrossRef] [Green Version]
  42. Zhao, M.; Running, S.W.; Nemani, R.R. Sensitivity of Moderate Resolution Imaging Spectroradiometer (MODIS) Terrestrial Primary Production to the Accuracy of Meteorological Reanalyses. J. Geophys. Res. Biogeosci. 2006, 111, 111. [Google Scholar] [CrossRef] [Green Version]
  43. Lozano, I.L.; Sánchez-Hernández, G.; Guerrero-Rascado, J.L.; Alados, I.; Foyo-Moreno, I. Analysis of Cloud Effects on Long-Term Global and Diffuse Photosynthetically Active Radiation at a Mediterranean Site. Atmos. Res. 2022, 268, 106010. [Google Scholar] [CrossRef]
  44. Lozano, I.L.; Sánchez-Hernández, G.; Guerrero-Rascado, J.L.; Alados, I.; Foyo-Moreno, I. Aerosol Radiative Effects in Photosynthetically Active Radiation and Total Irradiance at a Mediterranean Site from an 11-Year Database. Atmos. Res. 2021, 255, 105538. [Google Scholar] [CrossRef]
  45. Vindel, J.M.; Valenzuela, R.X.; Navarro, A.A.; Zarzalejo, L.F.; Paz-Gallardo, A.; Souto, J.A.; Méndez-Gómez, R.; Cartelle, D.; Casares, J.J. Modeling Photosynthetically Active Radiation from Satellite-Derived Estimations over Mainland Spain. Remote Sens. 2018, 10, 849. [Google Scholar] [CrossRef] [Green Version]
  46. Foyo-Moreno, I.; Alados, I.; Alados-Arboledas, L. A New Empirical Model to Estimate Hourly Diffuse Photosynthetic Photon Flux Density. Atmos. Res. 2018, 203, 189–196. [Google Scholar] [CrossRef] [Green Version]
  47. Alados-Arboledas, L.; Olmo, F.J.; Alados, I.; Pérez, M. Parametric Models to Estimate Photosynthetically Active Radiation in Spain. Agric. For. Meteorol. 2000, 101, 187–201. [Google Scholar] [CrossRef]
  48. Rogers, C.; Chen, J.M.; Croft, H.; Gonsamo, A.; Luo, X.; Bartlett, P.; Staebler, R.M. Daily Leaf Area Index from Photosynthetically Active Radiation for Long Term Records of Canopy Structure and Leaf Phenology. Agric. For. Meteorol. 2021, 304–305, 108407. [Google Scholar] [CrossRef]
  49. Nyamsi, W.W.; Blanc, P.; Augustine, J.A.; Arola, A.; Wald, L. A New Clear-Sky Method for Assessing Photosynthetically Active Radiation at the Surface Level. Atmosphere 2019, 10, 219. [Google Scholar] [CrossRef] [Green Version]
  50. Zeng, K.; Zheng, G.; Ma, L.; Ju, W.; Pang, Y. Modelling Three-Dimensional Spatiotemporal Distributions of Forest Photosynthetically Active Radiation Using UAV-Based Lidar Data. Remote Sens. 2019, 11, 2806. [Google Scholar] [CrossRef] [Green Version]
  51. Zheng, Y.; Shen, R.; Wang, Y.; Li, X.; Liu, S.; Liang, S.; Chen, J.M.; Ju, W.; Zhang, L.; Yuan, W. Improved Estimate of Global Gross Primary Production for Reproducing Its Long-Term Variation, 1982–2017. Earth Syst. Sci. Data 2020, 12, 2725–2746. [Google Scholar] [CrossRef]
  52. Khorasanizadeh, H.; Mohammadi, K. Diffuse Solar Radiation on a Horizontal Surface: Reviewing and Categorizing the Empirical Models. Renew. Sustain. Energy Rev. 2016, 53, 338–362. [Google Scholar] [CrossRef]
  53. Nwokolo, S.C.; Amadi, S.O.; Obiwulu, A.U.; Ogbulezie, J.C.; Eyibio, E.E. Prediction of Global Solar Radiation Potential for Sustainable and Cleaner Energy Generation Using Improved Angstrom-Prescott and Gumbel Probabilistic Models. Clean. Eng. Technol. 2022, 6, 100416. [Google Scholar] [CrossRef]
  54. Nwokolo, S.C.; Obiwulu, A.U.; Ogbulezie, J.C.; Amadi, S.O. Hybridization of Statistical Machine Learning and Numerical Models for Improving Beam, Diffuse and Global Solar Radiation Prediction. Clean. Eng. Technol. 2022, 9, 100529. [Google Scholar] [CrossRef]
  55. Nwokolo, S.C.; Ogbulezie, J.C.; Obiwulu, A.U. Impacts of Climate Change and Meteo-Solar Parameters on Photosynthetically Active Radiation Prediction Using Hybrid Machine Learning with Physics-Based Models. Adv. Sp. Res. 2022, 70, 3614–3637. [Google Scholar] [CrossRef]
  56. Noriega Gardea, M.M.A.; Corral Martínez, L.F.; Anguiano Morales, M.; Trujillo Schiaffino, G.; Salas Peimbert, D.P. Modelling Photosynthetically Active Radiation: A Review. Atmósfera 2020, 34, 357–370. [Google Scholar] [CrossRef]
  57. Akitsu, T.K.; Nasahara, K.N.; Ijima, O.; Hirose, Y.; Ide, R.; Takagi, K.; Kume, A. The Variability and Seasonality in the Ratio of Photosynthetically Active Radiation to Solar Radiation: A Simple Empirical Model of the Ratio. Int. J. Appl. Earth Obs. Geoinf. 2022, 108, 102724. [Google Scholar] [CrossRef]
  58. Smith, S.J.; Rothwell, A. Carbon Density and Anthropogenic Land-Use Influences on Net Land-Use Change Emissions. Biogeosciences 2013, 10, 6323–6337. [Google Scholar] [CrossRef] [Green Version]
  59. Udo, S.O.; Aro, T.O. Technical Note Measurement of Global Solar Global Photosynthetically-Active and Downward Infrared Radiations at Ilorin, Nigeria. Renew. Energy 1999, 17, 113–122. [Google Scholar] [CrossRef]
  60. Udo, S.O.; Aro, T.O. Global PAR Related to Global Solar Radiation for Central Nigeria. Agric. For. Meteorol. 1999, 97, 21–31. [Google Scholar] [CrossRef]
  61. Udo, S.O.; Aro, T.O.; Akpabio, L.E. Characteristics of Diurnal Pattern of Global Photosynthetically-Active Radiation at Ilorin, Nigeria. Niger. J. Phys. 2007, 18, 223–226. [Google Scholar] [CrossRef] [Green Version]
  62. Wang, L.; Gong, W.; Li, C.; Lin, A.; Hu, B.; Ma, Y. Measurement and Estimation of Photosynthetically Active Radiation from 1961 to 2011 in Central China. Appl. Energy 2013, 111, 1010–1017. [Google Scholar] [CrossRef]
  63. Hu, B.; Yu, Y.; Liu, Z.; Wang, Y. Analysis of Photosynthetically Active Radiation and Applied Parameterization Model for Estimating of PAR in the North China Plain. J. Atmos. Chem. 2016, 73, 345–362. [Google Scholar] [CrossRef]
  64. Peng, S.; Du, Q.; Lin, A.; Hu, B.; Xiao, K.; Xi, Y. Observation and Estimation of Photosynthetically Active Radiation in Lhasa (Tibetan Plateau). Adv. Sp. Res. 2015, 55, 1604–1612. [Google Scholar] [CrossRef]
  65. Niu, Z.; Wang, L.; Niu, Y.; Hu, B.; Zhang, M.; Qin, W. Spatiotemporal Variations of Photosynthetically Active Radiation and the Influencing Factors in China from 1961 to 2016. Theor. Appl. Clim. 2019, 137, 2049–2067. [Google Scholar] [CrossRef]
  66. Mizoguchi, Y.; Yasuda, Y.; Ohtani, Y.; Watanabe, T.; Kominami, Y.; Yamanoi, K. A Practical Model to Estimate Photosynthetically Active Radiation Using General Meteorological Elements in a Temperate Humid Area and Comparison among Models. Theor. Appl. Clim. 2014, 115, 583–589. [Google Scholar] [CrossRef]
  67. Zhu, Z.; Wang, L.; Gong, W.; Xiong, Y.; Hu, B. Observation and Estimation of Photosynthetic Photon Flux Density in Southern China. Theor. Appl. Clim. 2015, 120, 701–712. [Google Scholar] [CrossRef]
  68. Etuk, S.; Nwokolo, S.C.; Agbasi, O.; John-Jaja, S.A. Analysis of Photosynthetically Active Radiation over Six Tropical Ecological Zones in Nigeria. J. Geogr. Environ. Earth Sci. Int. 2016, 7, 1–15. [Google Scholar] [CrossRef]
  69. Etuk, S.; Agbasi, O.; Nwokolo, S.C. Modelling and Estimating Photosynthetically Active Radiation from Measured Global Solar Radiation at Calabar, Nigeria. Phys. Sci. Int. J. 2016, 12, 1–12. [Google Scholar] [CrossRef]
  70. Akitsu, T.; Kume, A.; Hirose, Y.; Ijima, O.; Nasahara, K.N. On the Stability of Radiometric Ratios of Photosynthetically Active Radiation to Global Solar Radiation in Tsukuba, Japan. Agric. For. Meteorol. 2015, 209–210, 59–68. [Google Scholar] [CrossRef]
  71. Akitsu, T.; Nasahara, K.N.; Hirose, Y.; Ijima, O.; Kume, A. Quantum Sensors for Accurate and Stable Long-Term Photosynthetically Active Radiation Observations. Agric. For. Meteorol. 2017, 237–238, 171–183. [Google Scholar] [CrossRef]
  72. Tsubo, M.; Walker, S. Relationships between Photosynthetically Active Radiation and Clearness Index at Bloemfontein, South Africa. Theor. Appl. Clim. 2005, 80, 17–25. [Google Scholar] [CrossRef]
  73. Aguiar, L.J.G.; Fischer, G.R.; Ladle, R.J.; Malhado, A.C.M.; Justino, F.B.; Aguiar, R.G.; da Costa, J.M.N. Modeling the Photosynthetically Active Radiation in South West Amazonia under All Sky Conditions. Theor. Appl. Clim. 2012, 108, 631–640. [Google Scholar] [CrossRef]
  74. Finch, D.A.; Bailey, W.G.; McArthur, L.J.B.; Nasitwitwi, M. Photosynthetically Active Radiation Regimes in a Southern African Savanna Environment. Agric. For. Meteorol. 2004, 122, 229–238. [Google Scholar] [CrossRef]
  75. Howell, T.A.; Meek, D.W.; Hatfield, J.L. Relationship of Photosynthetically Active Radiation to Shortwave Radiation in the San Joaquin Valley. Agric. Meteorol. 1983, 28, 157–175. [Google Scholar] [CrossRef]
  76. Ituen, E.E.; Esen, N.U.; Nwokolo, S.C.; Udo, E.G. Prediction of Global Solar Radiation Using Relative Humidity, Maximum Temperature and Sunshine Hours in Uyo, in the Niger Delta Region, Nigeria. Adv. Appl. Sci. Res. 2012, 3, 1923–1937. [Google Scholar]
  77. Papaioannou, G.; Nikolidakis, G.; Asimakopoulos, D.; Retails, D. Photosynthetically Active Radiation in Athens. Agric. For. Meteorol. 1996, 81, 287–298. [Google Scholar] [CrossRef]
  78. Nagaraja Rao, C.R. Photosynthetically Active Components of Global Solar Radiation: Measurements and Model Computations. Arch. Meteorol. Geophys. Bioclimatol. Ser. B 1984, 34, 353–364. [Google Scholar] [CrossRef]
  79. Rodríguez-López, L.; González-Rodríguez, L.; Duran-Llacer, I.; García, W.; Cardenas, R.; Urrutia, R. Assessment of the Diffuse Attenuation Coefficient of Photosynthetically Active Radiation in a Chilean Lake. Remote Sens. 2022, 14, 4568. [Google Scholar] [CrossRef]
  80. Foyo-Moreno, I.; Alados, I.; Alados-Arboledas, L. A New Conventional Regression Model to Estimate Hourly Photosynthetic Photon Flux Density under All Sky Conditions. Int. J. Climatol. 2017, 37, 1067–1075. [Google Scholar] [CrossRef] [Green Version]
  81. Wang, L.; Gong, W.; Ma, Y.; Hu, B.; Zhang, M. Photosynthetically Active Radiation and Its Relationship with Global Solar Radiation in Central China. Int. J. Biometeorol. 2014, 58, 1265–1277. [Google Scholar] [CrossRef]
  82. García-Rodríguez, A.; Granados-López, D.; García-Rodríguez, S.; Díez-Mediavilla, M.; Alonso-Tristán, C. Modelling Photosynthetic Active Radiation (PAR) through Meteorological Indices under All Sky Conditions. Agric. For. Meteorol. 2021, 310, 108627. [Google Scholar] [CrossRef]
  83. Zempila, M.M.; Taylor, M.; Bais, A.; Kazadzis, S. Modeling the Relationship between Photosynthetically Active Radiation and Global Horizontal Irradiance Using Singular Spectrum Analysis. J. Quant. Spectrosc. Radiat. Transf. 2016, 182, 240–263. [Google Scholar] [CrossRef]
  84. Nwokolo, S.; Ogbulezie, J. Modeling the Influence of Cloudiness on Diffuse Horizontal Irradiation under Various Sky Conditions in Nigeria. Int. J. Phys. Res. 2017, 5, 91. [Google Scholar] [CrossRef] [Green Version]
  85. Ogbulezie, J.C.; Ogri, J.U.; Nwokolo, S.C. A Review of Regression Models Employed for Predicting Diffuse Solar Radiation in North-Western Africa. Trends Renew. Energy 2017, 3, 160–206. [Google Scholar] [CrossRef] [Green Version]
  86. Wang, L.; Kisi, O.; Zounemat-Kermani, M.; Salazar, G.A.; Zhu, Z.; Gong, W. Solar Radiation Prediction Using Different Techniques: Model Evaluation and Comparison. Renew. Sustain. Energy Rev. 2016, 61, 384–397. [Google Scholar] [CrossRef]
  87. Ferrera-Cobos, F.; Vindel, J.M.; Valenzuela, R.X.; González, J.A. Models for Estimating Daily Photosynthetically Active Radiation in Oceanic and Mediterranean Climates and Their Improvement by Site Adaptation Techniques. Adv. Sp. Res. 2020, 65, 1894–1909. [Google Scholar] [CrossRef]
  88. López, G.; Rubio, M.A.; Martínez, M.; Batlles, F.J. Estimation of Hourly Global Photosynthetically Active Radiation Using Artificial Neural Network Models. Agric. For. Meteorol. 2001, 107, 279–291. [Google Scholar] [CrossRef]
  89. Jacovides, C.P.; Tymvios, F.S.; Boland, J.; Tsitouri, M. Artificial Neural Network Models for Estimating Daily Solar Global UV, PAR and Broadband Radiant Fluxes in an Eastern Mediterranean Site. Atmos. Res. 2015, 152, 138–145. [Google Scholar] [CrossRef]
  90. Zhang, F.; Zhou, G.; Nilsson, C. Remote Estimation of the Fraction of Absorbed Photosynthetically Active Radiation for a Maize Canopy in Northeast China. J. Plant Ecol. 2013, 8, 429–435. [Google Scholar] [CrossRef] [Green Version]
  91. Janjai, S.; Wattan, R.; Sripradit, A. Modeling the Ratio of Photosynthetically Active Radiation to Broadband Global Solar Radiation Using Ground and Satellite-Based Data in the Tropics. Adv. Sp. Res. 2015, 56, 2356–2364. [Google Scholar] [CrossRef]
  92. Escobedo, J.F.; Gomes, E.N.; Oliveira, A.P.; Soares, J. Modeling Hourly and Daily Fractions of UV, PAR and NIR to Global Solar Radiation under Various Sky Conditions at Botucatu, Brazil. Appl. Energy 2009, 86, 299–309. [Google Scholar] [CrossRef]
  93. Yu, X.; Guo, X. Hourly Photosynthetically Active Radiation Estimation in Midwestern United States from Artificial Neural Networks and Conventional Regressions Models. Int. J. Biometeorol. 2016, 60, 1247–1259. [Google Scholar] [CrossRef] [PubMed]
  94. Zhong, J.; Liu, J.; Jiao, L.; Lian, X.; Xu, Z.; Zhou, Z. Assessing the Comprehensive Impacts of Different Urbanization Process on Vegetation Net Primary Productivity in Wuhan, China, from 1990 to 2020. Sustain. Cities Soc. 2021, 75, 103295. [Google Scholar] [CrossRef]
  95. Zhao, A.; Zhu, X.; Liu, X.; Pan, Y.; Zuo, D. Impacts of Land Use Change and Climate Variability on Green and Blue Water Resources in the Weihe River Basin of Northwest China. Catena 2016, 137, 318–327. [Google Scholar] [CrossRef]
  96. Liu, X.; Pei, F.; Wen, Y.; Li, X.; Wang, S.; Wu, C.; Cai, Y.; Wu, J.; Chen, J.; Feng, K.; et al. Global Urban Expansion Offsets Climate-Driven Increases in Terrestrial Net Primary Productivity. Nat. Commun. 2019, 10, 5558. [Google Scholar] [CrossRef] [Green Version]
  97. Jia, W.; Zhao, S.; Liu, S. Vegetation Growth Enhancement in Urban Environments of the Conterminous United States. Glob. Chang. Biol. 2018, 24, 4084–4094. [Google Scholar] [CrossRef] [PubMed]
  98. Zhong, Q.; Ma, J.; Zhao, B.; Wang, X.; Zong, J.; Xiao, X. Assessing Spatial-Temporal Dynamics of Urban Expansion, Vegetation Greenness and Photosynthesis in Megacity Shanghai, China during 2000–2016. Remote Sens. Environ. 2019, 233, 111374. [Google Scholar] [CrossRef]
  99. Zhou, Y.; Xing, B.; Ju, W. Assessing the Impact of Urban Sprawl on Net Primary Productivity of Terrestrial Ecosystems Using a Process-Based Model-A Case Study in Nanjing, China. IEEE J. Sel. Top. Appl. Earth Obs. Remote Sens. 2015, 8, 2318–2331. [Google Scholar] [CrossRef]
  100. Wu, W.; Zhao, S.; Zhu, C.; Jiang, J. A Comparative Study of Urban Expansion in Beijing, Tianjin and Shijiazhuang over the Past Three Decades. Landsc. Urban Plan. 2015, 134, 93–106. [Google Scholar] [CrossRef]
  101. Yang, Y.; Nan, Y.; Liu, Z.; Zhang, D.; Sun, Y. Direct and Indirect Losses of Natural Habitat Caused by Future Urban Expansion in the Transnational Area of Changbai Mountain. Sustain. Cities Soc. 2020, 63, 102487. [Google Scholar] [CrossRef]
  102. Chakraborty, S.; Maity, I.; Patel, P.P.; Dadashpoor, H.; Pramanik, S.; Follmann, A.; Novotný, J.; Roy, U. Spatio-Temporal Patterns of Urbanization in the Kolkata Urban Agglomeration: A Dynamic Spatial Territory-Based Approach. Sustain. Cities Soc. 2021, 67, 102715. [Google Scholar] [CrossRef]
  103. Deng, X.; Huang, J.; Rozelle, S.; Zhang, J.; Li, Z. Impact of Urbanization on Cultivated Land Changes in China. Land Use Policy 2015, 45, 1–7. [Google Scholar] [CrossRef]
  104. Guan, X.; Shen, H.; Li, X.; Gan, W.; Zhang, L. A Long-Term and Comprehensive Assessment of the Urbanization-Induced Impacts on Vegetation Net Primary Productivity. Sci. Total Environ. 2019, 669, 342–352. [Google Scholar] [CrossRef]
  105. Jiao, L.; Liu, J.; Xu, G.; Dong, T.; Gu, Y.; Zhang, B.; Liu, Y.; Liu, X. Proximity Expansion Index: An Improved Approach to Characterize Evolution Process of Urban Expansion. Comput. Environ. Urban Syst. 2018, 70, 102–112. [Google Scholar] [CrossRef]
  106. Li, J.; Wang, Z.; Lai, C.; Wu, X.; Zeng, Z.; Chen, X.; Lian, Y. Response of Net Primary Production to Land Use and Land Cover Change in Mainland China since the Late 1980s. Sci. Total Environ. 2018, 639, 237–247. [Google Scholar] [CrossRef]
  107. Sun, Y.; Xie, S.; Zhao, S. Valuing Urban Green Spaces in Mitigating Climate Change: A City-Wide Estimate of Aboveground Carbon Stored in Urban Green Spaces of China’s Capital. Glob. Chang. Biol. 2019, 25, 1717–1732. [Google Scholar] [CrossRef] [PubMed]
  108. Liu, Y.; Xu, Y.; Weng, F.; Zhang, F.; Shu, W. Impacts of Urban Spatial Layout and Scale on Local Climate: A Case Study in Beijing. Sustain. Cities Soc. 2021, 68, 102767. [Google Scholar] [CrossRef]
  109. Pei, F.; Li, X.; Liu, X.; Lao, C.; Xia, G. Exploring the Response of Net Primary Productivity Variations to Urban Expansion and Climate Change: A Scenario Analysis for Guangdong Province in China. J. Environ. Manag. 2015, 150, 92–102. [Google Scholar] [CrossRef]
Figure 1. Descriptive statistics of input and output parameters for China (left hand column) and India (right hand column).
Atmosphere 14 00687 g001
Figure 2. Schematic diagram of the best-performing model (model 11) using radial basis function (RBF).
Atmosphere 14 00687 g002
Figure 3. Schematic diagram of the best-performing model (model 11) using multi-layer perceptron (MLP).
Atmosphere 14 00687 g003
Figure 4. Performance analysis based on the error metrics of machine learning and empirical model fittings for China (left column) and India (right column).
Atmosphere 14 00687 g004
Figure 5. Impacts of climate change (represented by changes in PAR (in percent)) on PAR productivity under various global warming scenarios, seasons, and annual time scales in China (left column) and India (right column).
Atmosphere 14 00687 g005
Table 1. Descriptive statistics of the input and output parameters in China and India.
CountryNMinimumMaximumMeanStd. Deviation
ChinaPAR40.89122.5082.6721.21
PARnH0.42340.46950.45140.0115
H93.46267.03182.4344.09
RH73.4085.9780.932.44
VPD1.592.872.190.25
Tave14.0027.3021.933.90
kt0.40690.75990.55820.0752
Tdew32.2834.3133.530.58
SVP9.2813.2511.571.18
AVP7.0810.969.381.13
Ho179.90473.90336.57103.83
IndiaPAR69.85128.7394.8316.93
H154.30291.09213.2440.01
kt0.34070.70120.56400.1059
AT16.1030.3724.284.19
RH45.0783.2965.0810.91
Td31.1634.2532.760.92
AVP5.4410.828.011.65
SVP9.8414.3112.311.31
VPD2.147.614.291.49
PARnH0.42160.47530.44570.0157
Where PAR is the photosynthetically active radiation (W/m2), H is the global solar radiation (W/m2), kt is the clearness index, AT is the ambient temperature (°C), RH is the relative humidity (%), Td is the dewpoint (°C), AVP is the actual vapour pressure (kPa), SVP is the saturated vapour pressure (kPa), and VPD is the vapour pressure deficits (kPa).
Table 2. Summary of the two Global Climate Model (GCM) from Coupled Model Intercomparison Project Phase 6 (CMIP6).
Grid Size (Long × Lat)/Spatial ResolutionTemporal Resolution
ModelCentreHistoricalFuture
GFDL-ESM4National Oceanic and Atmospheric Administration, Geophysical Fluid Dynamics Laboratory288 × 180 (1.25° × 1.00°)288 × 180 (1.25° × 1.00°)Monthly
HadGEM3-GC31National Centre for Meteorological Research, France1024 × 768 (0.35° × 0.23°)432 × 324 (0.83° × 0.55°)Monthly
EC-Earth3EC-Earth Consortium, Europe1024 × 512 (0.35° × 0.35°)1024 × 512 (0.70° × 0.70°)Monthly
IITM-ESM4Centre for Climate Research, Indian Institute of Tropical Meteorology, India288× 180 (1.87° × 1.91°)288× 180 (1.87° × 1.91°)Monthly
BCC-CSM2Beijing Climate Center Climate System Model2.8125° × 2.8125°2.8125° × 2.8125°Monthly
Table 3. Input and output parameters of developed models for different configurations.
#Input Element NotationsParameterMethodOutput
1HGlobal solar radiationCARIMA, SARIMA, BAGGING, BOOSTING, MLP, RBF, and EMPIRICAL P A R
2H, (H)1.1Global solar radiationCARIMA, SARIMA, BAGGING, BOOSTING, MLP, RBF, and EMPIRICAL P A R
3H, (H)1.1, (H)1.2Global solar radiationCARIMA, SARIMA, BAGGING, BOOSTING, MLP, RBF, and EMPIRICAL P A R
4RHRelative humidityCARIMA, SARIMA, BAGGING, BOOSTING, MLP, RBF, and EMPIRICAL P A R
5RH, (RH)1.1Relative humidityCARIMA, SARIMA, BAGGING, BOOSTING, MLP, RBF, and EMPIRICAL P A R
6RH, (RH)1.1, (RH)1.2Relative humidityCARIMA, SARIMA, BAGGING, BOOSTING, MLP, RBF, and EMPIRICAL P A R
7VPDVapour pressure deficitCARIMA, SARIMA, BAGGING, BOOSTING, MLP, RBF, and EMPIRICAL P A R
8VPD, (VPD)1.1Vapour pressure deficitCARIMA, SARIMA, BAGGING, BOOSTING, MLP, RBF, and EMPIRICAL P A R
9VPD, (VPD)1.1, (VPD)1.2Vapour pressure deficitCARIMA, SARIMA, BAGGING, BOOSTING, MLP, RBF, and EMPIRICAL P A R
10H, VPDHybridCARIMA, SARIMA, BAGGING, BOOSTING, MLP, RBF, and EMPIRICAL P A R
11H, VOD, RHHybridCARIMA, SARIMA, BAGGING, BOOSTING, MLP, RBF, and EMPIRICAL P A R
Table 4. Fitted empirical models for predicting PAR productivity in China and India.
CountryModelEstimate
China1 P A R = 4.866 + 0.480 H
China2 P A R = 2.224 + 0.306 H + 0.094 H 1.1
China3 P A R = 2.484 + 0.394 H + 0.0001 H 1.1 + 0.025 H 1.2
China4 P A R = 167.365 + 3.090 R H
China5 P A R = 144.827 + 0.001 R H + 1.812 R H 1.1
China6 P A R = 126.044 + 0.0001 R H + 0.0001 R H 1.1 + 1.071 R H 1.2
China7 P A R = 11.140 + 32.654 V P D
China8 P A R = 17.833 + 0.001 V P D + 27.348 V P D 1.1
China9 P A R = 298.135 + 878.540 V P D + 0.0001 V P D 1.1 + 601.510 V P D 1.2
China10 P A R = 1.767 + 0.484 H 1.735 V P D
China11 P A R = 114.736 + 0.439 H + 9.029 V P D + 1.2051 R H
India1 P A R = 5.802 + 0.417 H
India2 P A R = 14.044 + 0.000 H + 0.221 H 1.1
India3 P A R = 58.231 1.028 H + 0.000 H 1.1 + 0.409 H 1.2
India4 P A R = 174.176 1.219 R H
India5 P A R = 166.880 + 0.000 R H 0.728 R H 1.1
India6 P A R = 487.448 30.699 R H + 0.000 R H 1.1 + 10.665 R H 1.2
India7 P A R = 49.469 + 10.561 V P D
India8 P A R = 85.985 83.492 V P D + 73.477 V P D 1.1
India9 P A R = 82.796 36.361 V P D + 0.000 V P D 1.1 + 28.856 V P D 1.2
India10 P A R = 6.792 + 0.552 H 3.728 V P D
India11 P A R = 61.402 + 0.451 H + 3.590 V P D + 0.685 R H
Table 5. Fitted CARIMA models for predicting PAR productivity in China and India.
Country ModelEstimate
China1 P A R = 4.866 + 0.480 H
China2 P A R = 2.224 + 0.306 H + 0.094 H 1.1
China3 P A R = 2.224 + 0.306 H + 0.094 H 1.1 0.0000119 H 1.2
China4 P A R = 167.365 + 3.090 R H
China5 P A R = 167.371 + 3.090 R H + 0.0001 R H 1.1
China6 P A R = 167.377 + 3.090 R H + 0.00001688 R H 1.1 + 0.0001 R H 1.2
China7 P A R = 11.140 + 32.654 V P D
China8 P A R = 325.220 + 1719 V P D 1416.354 V P D 1.1
China9 P A R = 298.135 + 878.539 V P D + 0.001 V P D 1.1 + 601.511 V P D 1.2
China10 P A R = 1.767 + 0.484 H 1.735 V P D
China11 P A R = 118.308 + 0.438 H + 9.109 V P D + 1.249 R H
India 1 P A R = 5.802 + 0.417 H
India2 P A R = 62.979 2.470 H + 1.529 H 1.1
India3 P A R = 62.979 2.470 H + 1.529 H 1.1 + 0.0000049 H 1.2
India4 P A R = 174.176 1.219 R H
India5 P A R = 515.215 60.026 R H + 35.228 R H 1.1
India6 P A R = 515.215 60.026 R H + 35.228 R H 1.1 0.000023 R H 1.2
India7 P A R = 49.469 + 10.561 V P D
India8 P A R = 85.985 83.492 V P D + 73.477 V P D 1.1
India9 P A R = 85.970 83.479 V P D + 73.491 V P D 1.1 0.020 V P D 1.2
India10 P A R = 6.792 + 0.552 H 3.728 V P D
India11 P A R = 60.781 + 0.451 H + 3.556 V P D + 0.680 R H
Table 6. Fitted best performing models for predicting PAR productivity hybrid models for China and India.
CountryApproachEstimate
ChinaMLP-CARIMA-GPM P A R = 117.768 + 0.4360 H + 9.067 V P D + 1.243 R H
IndiaMLP-CARIMA-GPM P A R = 60.504 + 0.4489 H + 3.539 V P D + 0.677 R H
Table 7. Details of the statistical indicators.
S/NAbbreviationStatistical TestExpressionIdea Value
1.R2Coefficient of determination R 2 = 1 i = 1 n O i P i 2 i = 1 n O i O a v e 2 One
2.RMSERoot mean square error R M S E = 1 n i = 1 n O i P i 2 Zero
3.nRMSENormalized root mean square error n R M S E = R M S E i = 1 n H Zero
4.RPERelative percentage error R E = i = 1 n O i P i P i × 100 Zero
5.MAPEMean absolute percentage error M A P E = 1 n i = 1 n O i P i Zero
Table 10. Impacts of climate change on photosynthetically active radiation output in China and India.
ScenarioPeriodPAR (W/m2)Change in PAR (%)
Country DJFMAMJJASONANNDJFMAMJJASONANN
ChinaSSP1262015–210056.1999.32105.8269.2782.651.3381.0121.2211.2601.186
SSP1262015–205055.4597.82104.4067.5781.310.6580.2900.6460.1250.434
SSP1262051–210056.71100.41106.8470.5083.621.8271.5331.6352.0771.727
SSP2452015–210054.7597.60103.9568.1981.12−0.0010.1870.4640.5370.328
SSP2452015–205054.4396.16102.7967.2780.16−0.295−0.507−0.004−0.075−0.210
SSP2452051–210054.9798.65104.7868.8581.810.2100.6870.8000.9780.716
SSP5852015–210054.7496.47103.2967.8680.59−0.006−0.3550.1960.3220.031
SSP5852015–205054.4395.30102.3667.2079.82−0.292−0.917−0.183−0.116−0.399
SSP5852051–210054.9697.32103.9668.3381.140.1990.0500.4690.6370.341
IndiaSSP1262015–210092.99127.37101.5392.67103.64−1.092−1.1580.231−1.311−1.628
SSP1262015–205091.57125.76100.7291.51102.390.178−0.1270.829−0.354−0.637
SSP1262051–210094.02128.54102.1193.51104.55−2.007−1.899−0.200−2.000−2.342
SSP2452015–210088.45105.04119.18128.49127.280.8660.9462.0340.9350.420
SSP2452015–205088.45105.04119.18128.49127.281.6681.7342.9521.9561.303
SSP2452051–210088.45105.04119.18128.49127.280.2890.3801.3740.199−0.216
SSP5852015–210090.58123.6599.3088.65100.541.0221.1981.8771.9980.755
SSP5852015–205089.26122.7398.2388.6299.712.1841.7762.6602.0241.408
SSP5852051–210091.53124.30100.0688.68101.140.1850.7821.3131.9790.285
Table 11. Impacts of land use change on photosynthetically active radiation output in China and India.
CountryPeriodContribution of Each FactorScenario
SSP126SSP245SSP585Average
China2015–2099Climate change1.190.850.620.89
China2015–2099Land use change50.1848.1350.1149.47
China2015–2099Residual factor48.6351.0249.2749.64
India2015–2099Climate change7.24818.41615.7113.79
India2015–2099Land use change11.75335.70037.7928.41
India2015–2099Residual factor80.99945.8846.5057.79
Disclaimer/Publisher’s Note: The statements, opinions and data contained in all publications are solely those of the individual author(s) and contributor(s) and not of MDPI and/or the editor(s). MDPI and/or the editor(s) disclaim responsibility for any injury to people or property resulting from any ideas, methods, instructions or products referred to in the content.

