Article

Nonlinear Three-Dimensional Simulations of the Gradient Drift and Secondary Kelvin–Helmholtz Instabilities in Ionospheric Plasma Clouds

1
Kevin T. Crofton Department of Aerospace and Ocean Engineering, Virginia Tech, Blacksburg, VA 24061, USA
2
Bradley Department of Electrical and Computer Engineering, Virginia Tech, Blacksburg, VA 24061, USA
*
Author to whom correspondence should be addressed.
Atmosphere 2023, 14(4), 676; https://doi.org/10.3390/atmos14040676
Submission received: 8 February 2023 / Revised: 25 March 2023 / Accepted: 28 March 2023 / Published: 3 April 2023
(This article belongs to the Special Issue Ionospheric Science and Ionosonde Applications)

Abstract

:
A newly developed three-dimensional electrostatic fluid model solving continuity and current closure equations aims to study phenomena that generate ionospheric turbulence. The model is spatially discretized using a pseudo-spectral method with full Fourier basis functions and evolved in time using a four-stage, fourth-order Runge Kutta method. The 3D numerical model is used here to investigate the behavior and evolution of ionospheric plasma clouds. This problem has historically been used to study the processes governing the evolution of the irregularities in the F region of the ionosphere. It has been shown that these artificial clouds can become unstable and structure rapidly (i.e., cascade to smaller scales transverse to the ambient magnetic field). The primary mechanism which causes this structuring of ionospheric clouds is the E × B , or the gradient drift instability (GDI). The persistence and scale sizes of the resulting structures cannot be fully explained by a two-dimensional model. Therefore, we suggest here that the inclusion of three-dimensional effects is key to a successful interpretation of mid-latitude irregularities, as well as a prerequisite for a credible simulation of these processes. We investigate the results of 2D and 3D nonlinear simulations of the GDI and secondary Kelvin–Helmholtz instability (KHI) in plasma clouds for three different regimes: highly collisional (≈200 km ), collisional (≈300 km ), and inertial (≈450 km ). The inclusion of inertial effects permits the growth of the secondary KHI. For the three different regimes, the overall evolution of structuring of plasma cloud occurs on longer timescales in 3D simulations. The inclusion of three-dimensional effects, in particular, the ambipolar potential in the current closure equation, introduces an azimuthal “twist“ about the axis of the cloud (i.e., the magnetic field B ). This azimuthal “twist” is observed in the purely collisional regime, and it causes the perturbations to have a non-flute-like character ( k 0 ). However, for the 3D inertial simulations, the cloud rapidly diffuses to a state in which the sheared azimuthal flow is substantially reduced; subsequently, the cloud becomes unstable and structures, by retaining the flute-like character of the perturbations ( k = 0 ).

1. Introduction

The study of the evolution of plasma clouds in the near-Earth space environment has historically been of great interest to the space physics community. Experiments involving releases of metallic vapors, molecular vapors, and plasma into the ionosphere have been used as diagnostic methods to measure atmospheric parameters, plasma flows, and parallel electric fields. Long-range coupling to the environment is one of the most important aspects of the plasma releases, which concern the understanding of the formation of the ubiquitous striations and deformations of the plasma clouds. In addition, other experiments have been conducted in the ionosphere in order to induce natural large-scale ionospheric instabilities [1]. For example, barium clouds can become ionized due to photoionization [2] and exhibit development of striations and distortions [3,4]. The primary mechanism which causes this structuring of ionospheric clouds is the E × B , or the gradient drift instability (GDI) [5,6]. Therefore, in this work, we investigate the dynamics of three-dimensional plasma clouds using a newly developed three-dimensional electrostatic fluid code.
The gradient drift instability (GDI) is a collisional interchange instability that occurs when the neutral wind acts as an inertial force opposite to the density gradient and it depends on certain geometric conditions of the electric field, magnetic field, and density gradient. For the F region, which is the focus of our work, each of these must have components orthogonal to each other. Small perturbations along the density gradient interface can lead to the development of charge separation. This results in a perturbed electric field which undergoes a perturbed E × B drift with no immediate damping mechanism. This instability is a common mechanism by which irregular structures in the F region break down into smaller ones [7,8].
A 3D finite difference model by Refs. [9,10] is employed to demonstrate the nature of meso-scale (i.e., medium scales ranging of 0.1 km to a few kms ) structuring in mid- and high-latitude plasma patches through a combination of primary gradient drift and secondary Kelvin–Helmholtz instabilities. The Kelvin–Helmholtz instability (KHI) is a fluid instability of a plasma. It is a shear-driven instability, where the existence of a velocity difference across an interface causes a small perturbation to growth, leading to vortex formation. A classic example is the generation of water waves by wind blowing over the surface of the water. Other work including 3D models [6] studied the evolution of purely collisional plasma clouds and showed that finite plasma temperatures, combined with fully three-dimensional plasma dynamics, provide a stabilizing effect on plasma clouds agreeing with analytical theory. This stability is associated with sheared azimuthal ion flows in the vicinity of the plasma cloud surface [6,11]. Previous three-dimensional models have limitations that are addressed by this work. For example, some of the neglected aspects of the 3D simulation of plasma clouds in Ref. [6] can be remedied by the inclusion of the ion inertia effects, as well as the ion–electron collision frequency. Thus, with the combined 3D effects in the potential equation (neglecting electron parallel dynamics in the continuity) and inertial effects, a better understanding and interpretation of plasma turbulence processes can be achieved than offered by 2D numerical models [12,13,14]. The objective of this work is to study the evolution of ionospheric plasma clouds in the F region using a nonlinear three-dimensional fluid model, motivated by the study of mid-latitude ionospheric disturbances relevant to space weather radar observations. Section 2 provides a summary of the mathematical framework and numerical model. Section 3 discusses the numerical results and the differences between the 2D and 3D models. Section 4 provides an in-depth discussion of the results and compares them to the literature. Finally, Section 5 has concluding remarks and discusses possible future work directions.

2. Materials and Methods

2.1. Basic Assumption and Equations

The ambient magnetic field (i.e., geomagnetic field) is assumed to be purely in the z ^ direction and the background neutral wind is in the x ^ direction. Both the electrons and ions are assumed to be warm (i.e., T e = T i = 1000   K or ≈ 0.1 eV ). The plasma is assumed to be quasi-neutral ( n i = n e = n ) and we consider the electrostatic limit (i.e., the divergence of the current is zero · J = 0 ), where T and n are the temperature and number density. We consider three regimes: highly collisional, collisional, and inertial. The collisional cases correspond to the lower F region and the inertial case corresponds to the high F region. We characterize the effect of collisions by the collisional dimensionless parameter R, which is defined as R = ν i n / Ω c i ν e n / Ω c e , where ν α n is the collision frequency between species α (ions or electrons) and neutral particles, and Ω c α is the cyclotron frequency of the species α . The dimensionless parameter R can be calculated as a function of altitude using data from the IRI, NRLMSISE-00, and IGRF modules [15,16,17]. In particular, we reference Figure 7 from Ref. [13], which was used here to calculate the corresponding altitudes for each of the three different regimes (i.e., highly collisional, collisional, and inertial) for the 2D and 3D simulations.
The numerical model is primarily concerned with a large-scale motion of the convection of plasma (i.e., such things as plasma frequency, gyrofrequency are not resolved); therefore, it resolves timescales associated with the E × B and diamagnetic drifts. The model considers the equations representing continuity (mass conservation), energy, and current closure (charge conservation). These equations form a system of nonlinear partial differential equations which are discretized in space using the pseudo-spectral method, and time integrated using the Runge–Kutta method [13,14,18]. For simplicity, the full 3D non-linear model considers all Fourier basis functions (i.e., all periodic directions). Thus, our three-dimensional equations for a warm plasma cloud in a uniform magnetic field B = B z ^ and uniform background neutral wind are given by
n t ϕ × B B 2 · n = D 2 n ,
3 2 n α k B T α t + 3 2 n α k B V α · T α + n α k B T α · V α = 0 ,
· n ϕ t KHI Development = 1 Ω c i + 1 Ω c e 1 [ ν i n e Ω c i 2 P i + ν e n e Ω c e 2 P e Asymmetry + ν i n Ω c i + ν e n Ω c e u × B · n · [ n ϕ ] GDI Development ] · n V E × B · ϕ KHI Development ,
where n is the number density, D is the numerical diffusion constant, u is the neutral wind speed, P is pressure, V is velocity, k B is the Boltzmann constant, and ν α n is the collision frequency defined above. The artificial diffusion, D, is necessary to deal with numerical errors and chosen to be as small as possible to have minimal physical impact on the results. The electric field is defined as E = ϕ . The energy equation, Equation (2), is included in the numerical model; however, it has a negligible impact on the development of the GDI in this particular regime. In Equation (3), a physical description of each term is shown. Terms indicated by “KHI Development” represent the evolution of secondary KHI or any sort of inertial effect. The term indicated by “GDI Development” represents the evolution of the GDI in our regime. Finally, the term indicated by “asymmetry” is the reason behind our asymmetry in the domain due to pressure/temperature effects (discussed in further detail later in our results). Note, this is not the sole role behind each term in Equation (3); however, for our specific problem, this represents the importance of each term.
For Equation (3), we can rewrite = + , where represents the direction perpendicular to the magnetic field (i.e., x ^ and y ^ ), while = z represents the direction parallel to to the magnetic field (i.e., z ^ ). The geometry for this numerical model is the following: x ^ is north, y ^ is east, and z ^ is down or vertical, as shown in Figure 1. Additionally, it is beneficial to set x ^ to be along the direction of neutral wind, since it is the direction of motion of the plasma cloud, thus determining which interface will be unstable to the GDI (the interface at which the GDI will grow).

2.2. Initial Conditions

The density was initialized such that there is a plasma cloud of high density surrounded by a lower density background plasma. This configuration is unstable to the GDI on the right interface of the x y plane (i.e., the leading edge of the cloud). The density was modeled using a Gaussian-type function and can be expressed in 3D as:
n ( x , y , z ) = n 0 a exp x x 0 r 0 2 + y y 0 r 0 2 + z z 0 r 0 2 p + d ,
where d = 1 , a = 5 (i.e., the cloud-to-background density ratio is 5 to 1), and p is the power on the Gaussian argument. The cloud’s radius is defined by the value r 0 . The parameters were chosen to be similar to case B1 in the work by Ref. [6]; thus, for our spherical cloud, the radius was set to 100 m . Additionally, the density was initialized with a random noise perturbation of ± 0.07 n 0 , where n 0 = 10 11 m 3 .
The Gaussian exponent, p, determines how steep the density gradient is, which in turn determines how strong the GDI is. For the simulations presented here, these values were chosen as the following: p = 3 , r 0 = 100 , x 0 = y 0 = z 0 = 320 .

3. Results

3.1. 2D Simulations of Nonlinear Evolution of the GDI and the KHI

In this section, we investigate the results of the gradient drift instability (GDI) in a plasma cloud using our previously developed two-dimensional fluid numerical model [8,13]. We consider three regimes: highly collisional, collisional, and inertial. Figure 2 shows a 2D simulation of a plasma enhancement cloud for a highly collisional regime with an ion-neutral collision frequency of ν i n = 29.6 Hz , which corresponds to an altitude of approximately 200 km . Due to the direction of the density gradient and its interaction with the neutral wind in the x ^ direction, the plasma cloud drifts to the right, as shown in Figure 2b. There are no signs of the trailing edge rolling up into themselves. Instead, a smooth tail extends out because of the high collisionality. In Figure 2c, the leading edge (i.e., right side) becomes unstable to the GDI and begins to bifurcate as a nested finger-like structure extends outwards. Figure 2d shows the continued growth and extension of the nested secondary finger-like structure. The leading edges begin to bifurcate further as a secondary GDI-induced bifurcation forms, as shown in Figure 2e,f. Due to the fast neutral wind, a tail is observed to grow over time. Therefore, it is clear that the GDI dominates the structuring of a plasma cloud in the highly collisional regime. Additionally, it is worth noting here that for these simulations, the boundary conditions are double periodic, since the cloud leaves the domain on the right side and will loop around to reappear on the left side.
Figure 3 shows the results of a 2D plasma enhancement cloud simulation in a collisional regime with n n = 10 16 m 3 , ν i n = 2.96 Hz , and that corresponds to an altitude of approximately 300 km . As the cloud moves further to the right, the leading edge of the cloud becomes unstable to the GDI, and a finger-like structure begins to form, as seen in Figure 3c. Figure 3d shows the continued growth of the GDI. The trailing edges begin to curl into themselves, indicating the onset of secondary KHI. Further in time, the finger-like structure emerges from the middle of the cloud that represents the fastest growing mode from a random noise perturbation. Figure 3e,f shows the tip of the center finger-like structure develops into a secondary KHI, as evidenced by the mushroom-like structure. Compared to the previous 2D simulation in Figure 2, it is clear that the primary GDI still dominates the structuring of a plasma cloud in the collisional regime, even with the presence of secondary KHI.
Figure 4 shows the simulation of a 2D plasma enhancement cloud in the inertial regime with n n = 10 15 m 3 , ν i n = 0.296 Hz , which corresponds to a higher altitude of approximately 450 km . Figure 4b shows the plasma cloud moving to the right as the trailing edges begin turning in on themselves into the start of a vortex. Figure 4c shows the initial formation of a finger-like structure emerging from the center of the the leading edge of the cloud indicating a GDI. Figure 4d,e shows the continued development of the trailing edge of the cloud to form vortices. The GDI begins to roll in on itself due to a secondary KHI, as seen in Figure 4f as the trailing edge vortices continue to roll up. Additionally, Figure 4f shows the increasing growth of the secondary KHI of the primary GDI. Due to the low collisionality in the inertial regime, this leads to no tail development (i.e., cloud is not elongated along the x ^ direction). Rather, the trailing edge vortices dominate the tail structure. Therefore, the plasma cloud structure is dominated by the development of the KHI in the inertial regime.

3.2. 3D Simulations of Nonlinear Evolution of the GDI and the KHI

In this section, we investigate the gradient drift instability (GDI) in a plasma cloud using the nonlinear 3D fluid model discussed in Sec. 1.1. All figures in this section represent simulations that are taken at the exact time frames of the 2D simulations. Initially, the 2D slices taken in the mid-plane of z ^ shown in Figure 5a,b exhibit a very similar trend to the 2D simulation results for the high-collisionality case in Figure 2. However, the results start deviating starting from Figure 5c. Similar to Figure 2b, Figure 5b shows the entire cloud moving smoothly along the x ^ direction with no curling edges due to high ion-neutral collision frequency. As the x y plane leading edge becomes unstable to the GDI, the cloud begins to bifurcate initially as it drifts along the x ^ direction, only for the finger-like structures to start curving around or show a distinct “twist” of the x y plane leading edge fingers. Compared to 2D simulation results from Figure 2, the inclusion of the 3D effects plays a role in the evolution of the 3D plasma cloud in a highly collisional regime. Likewise, for the 3D simulation results for the highly collisional regime, it is clear that the GDI dominates the evolution of the plasma cloud, as evident by the elongated very smooth cloud along the x ^ direction.
To further understand the difference in the observed behaviour of the plasma cloud in a highly collisional regime when the 3D effects are taken into account, we can look at a 2D slice taken in the mid-plane of y ^ shown in Figure 6. In Figure 6c, finger-like structures begin to form on the x z leading edge of the cloud, and as time progresses, the structuring leads to formation of the very fine scaled fingers shown in Figure 6d,e. These elongated fingers have a larger scale length in the x ^ direction than that in the z ^ direction, as observed in Figure 6f.
Figure 7 shows the results of 2D slices in the x y plane taken at the mid-plane of z ^ in a collisional regime with n n = 10 16 m 3 , ν i n = 2.96 Hz , and at an altitude of ≈300 km . Compared to the 2D simulations results in the collisional regime, Figure 7b follows a similar trend as the plasma cloud drifts along the x ^ direction, as the trailing edge rolls up to form vortices in the x y plane. In Figure 7c,d, we can see the emergence of the GDI as a finger extending outward from the leading edge of the plasma cloud in the the x y plane. In comparison to results from Figure 3, there is a much more pronounced bifurcation that can be seen in Figure 7e induced by the primary GDI extending in the x ^ direction. Figure 7f shows the beginning of the formation of a secondary KHI at the tip of the finger-like structure. Generally, we notice the GDI growing more slowly compared to the results of Figure 3. Similarly, the GDI dominates the structuring development of the cloud in the collisional regime despite the early signs of secondary KHI in Figure 7f.
Figure 8 shows the results of 2D slices in the x y plane at the mid-plane of z ^ in the inertial regime with n n = 10 15 m 3 , and ν i n = 0.296 Hz , and an altitude of ≈450 km . Figure 8a,b shows the initial plasma cloud as it begins drifting along the x ^ direction in the x y plane, which is very similar to the 2D results in Figure 4. These results are also similar to those of the 2D simulations in the inertial regime with the exception of the growth rate, which is observed to be slower than Figure 4, even more so in the inertial regime compared to the collisional one. The 3D simulations of the inertial regime show that the KHI dominates the structure development of the plasma cloud as expected due to low ion-neutral collisions. For all of the 2D and 3D simulation results presented here, there is some asymmetry being observed, particularly in the trailing edge of the plasma cloud. This asymmetry is observed in the collisional and inertial regimes, and it is due to temperature (pressure) effects in our current closure equation Equation (3). In particular, an ambipolar potential develops that balances the electron pressure along the magnetic field. This ambipolar field causes the cloud to spin around its axis along B. The pressure term in Equation (3) is axisymmetric (which is also midplane symmetrical); however, the other terms have midplane antisymmetry and not axisymmetry. Then, when all terms are added together, this results in an asymmetry all around that we observe.

4. Discussion

In 
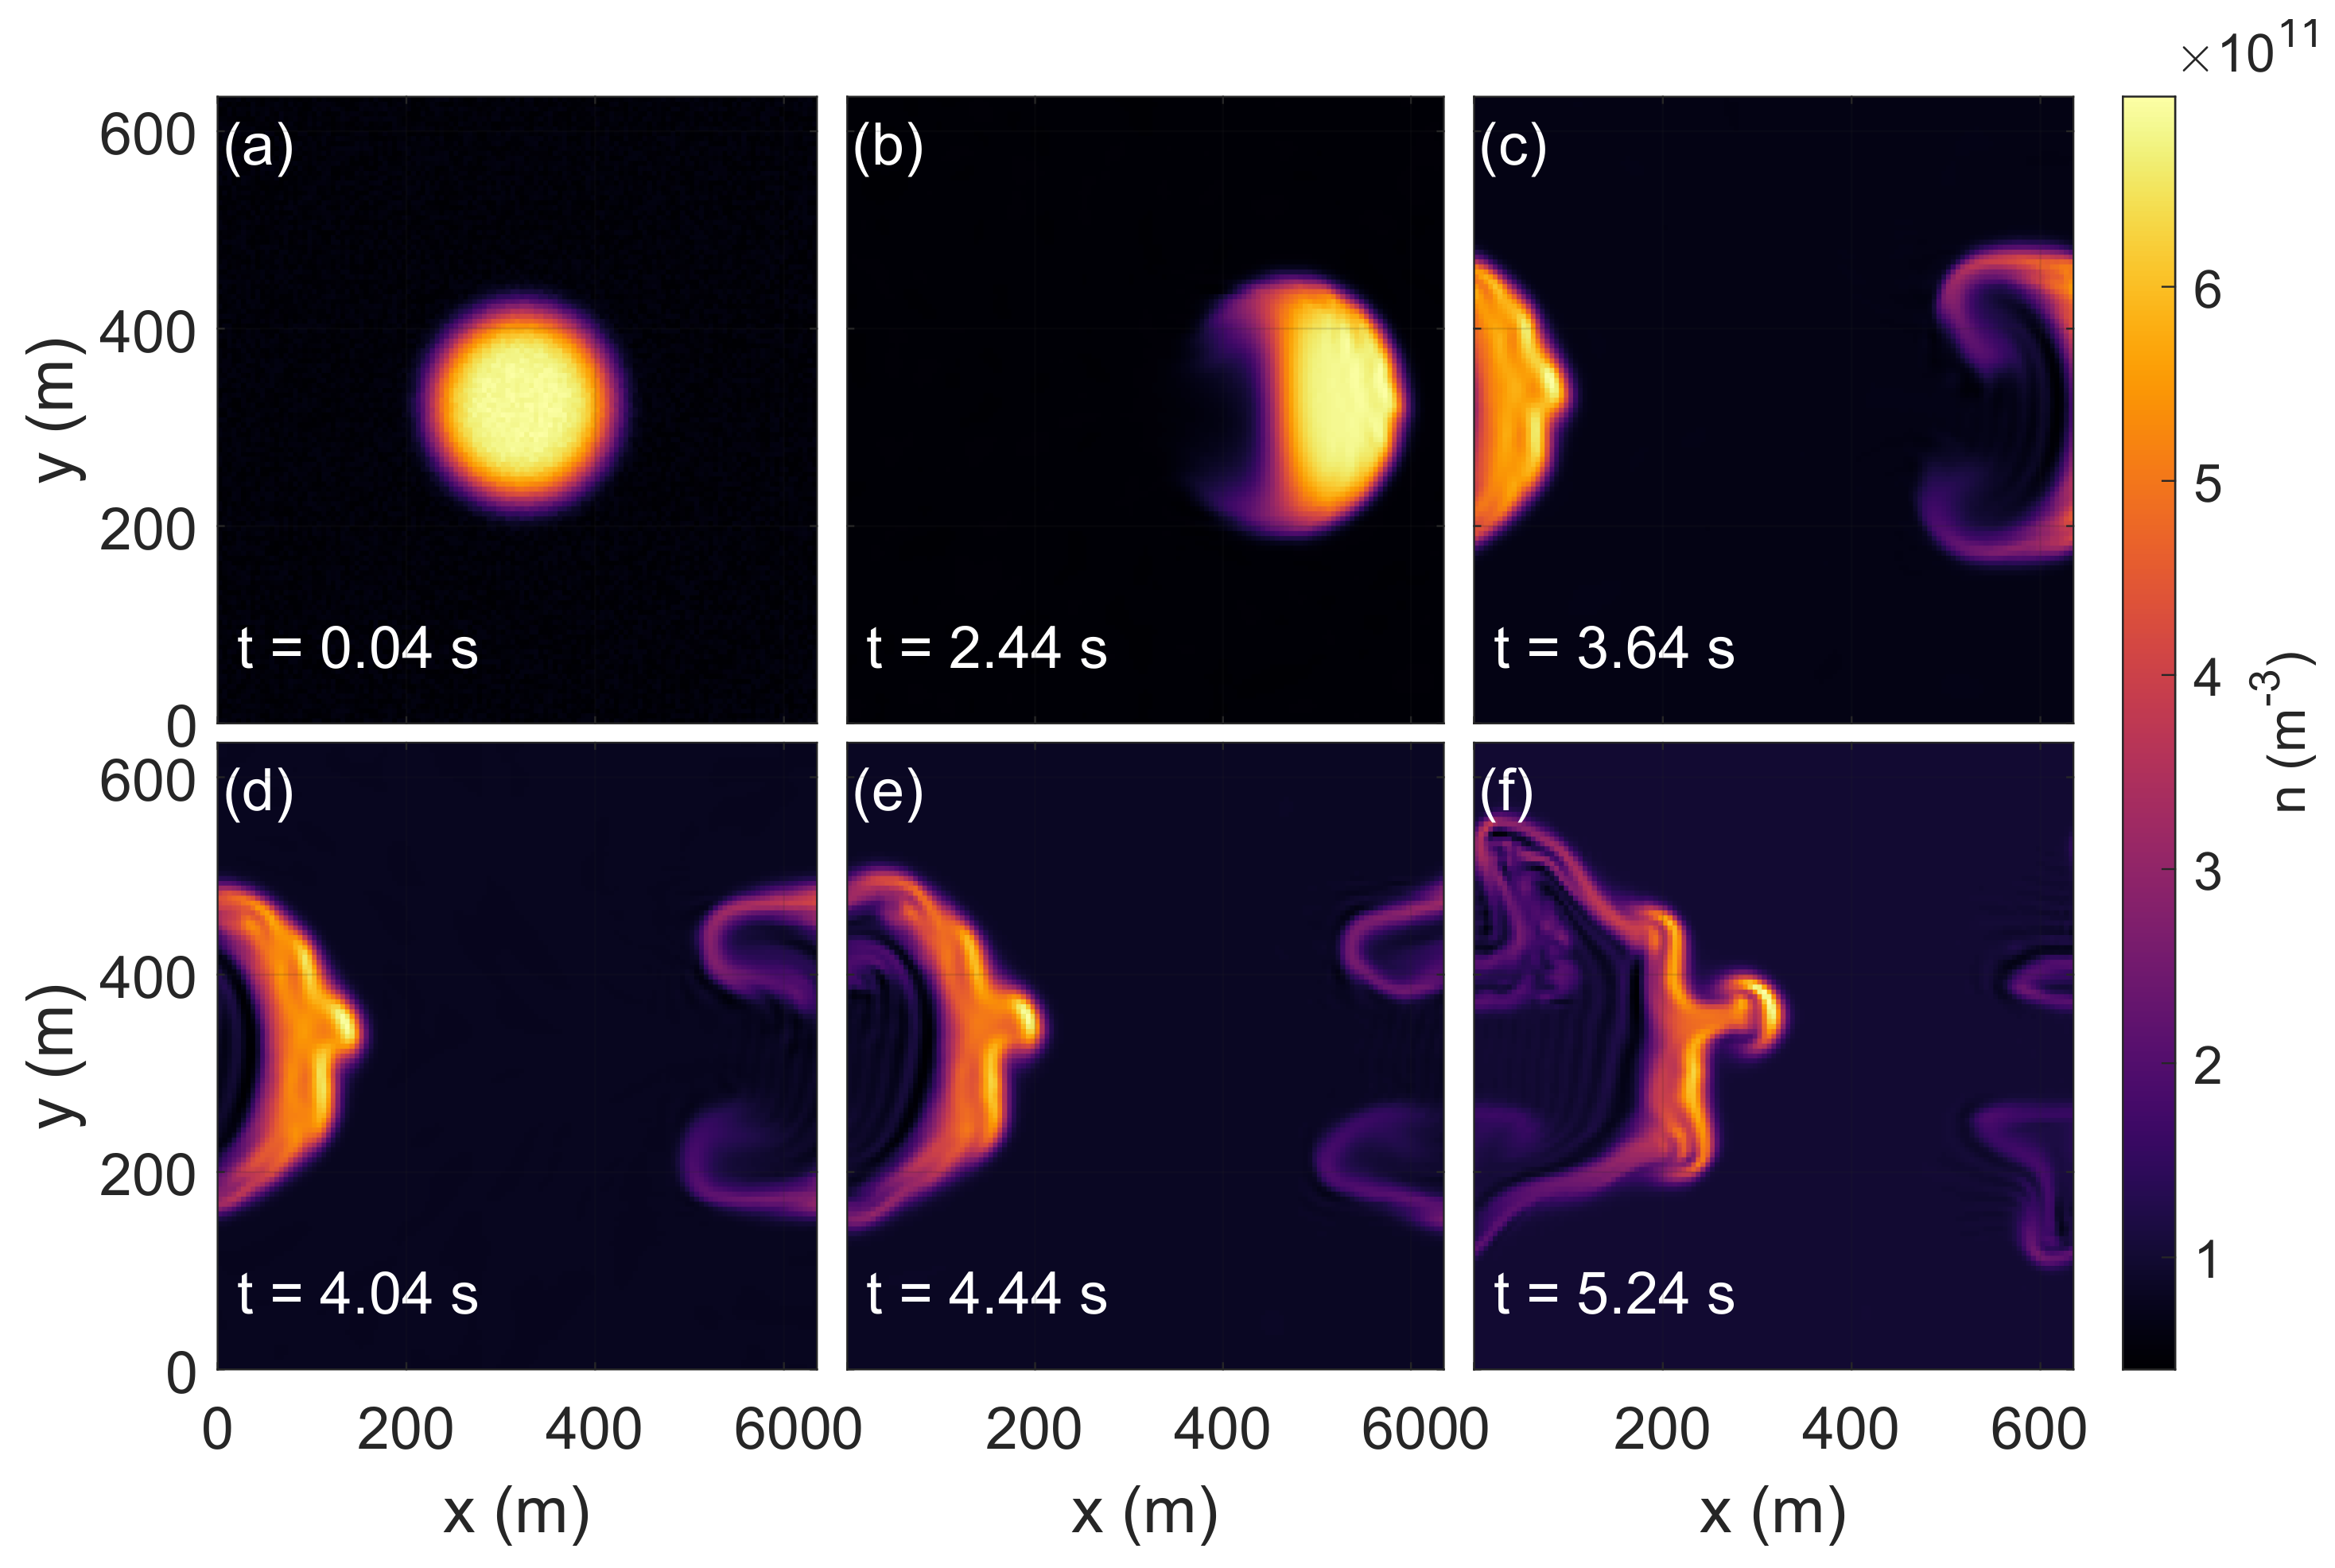
Section 2, we present both nonlinear two-dimensional and three-dimensional simulations of the GDI and KHI, applicable to the plasma enhancement cloud. For the three-dimensional highly collisional simulation, at an early time in the evolution of the cloud, structures exhibit a “twist” as they develop, shown in Figure 5c. This is because of the ambipolar potential produced by the first term in Equation (3) (i.e., electron pressure terms parallel to B in the potential equation) causing the cloud to rotate about its center field-aligned axis, which is aligned with the magnetic field in z ^ . The rotation rate varies with the position along the length of the cloud (along B ), meaning the propagation rate is not uniform and it increases away from the mid-plane of z ^ ; therefore, this “shears” the cloud into a twist or “barber pole configuration” [6].
This shear in the azimuthal rotation observed in Figure 5c,d can force the GDI, which is primarily an electrostatic flute mode (i.e., generates perturbation in the density transverse to the magnetic field B ( k = 0 )), to have a finite k [19]. This result is consistent with previous 3D simulations of purely collisional plasma clouds [6] and with the behaviour described by Ref. [11]. Over time-scales of seconds, longer wavelength phenomena which are also propagating around the cloud start to dominate and eventually produce the bifurcation of the cloud shown in Figure 5f. This is different from the 2D highly collisional results where the finger-like structure emerges from the GDI-induced bifurcation unconstrained by azimuthal “shears“, as shown in Figure 2c.
Figure 9 illustrates the azimuthal “twist” for the 3D simulations for each of the three regimes: highly collisional, collisional, and inertial. These plots demonstrate the evolution of the cloud particularly at early times, before any structuring dominates the cloud evolution. The density value is chosen close to the surface of the cloud, since the numerical simulations of Ref. [6] observe azimuthal flows in the vicinity of the cloud surface. In the highly collisional regime, we observe the azimuthal “twist”, and as we move further away from (above) the mid-plane of z ^ (black dashed line), the rotation becomes more prominent and it alters the flute-like character of the GDI, as evident by the narrow finger-like structures growing in the x z plane, indicating a finite k in Figure 6. However, for the collisional and inertial simulations, there is little to no azimuthal rotation observed at the early times of the simulations. Instead, much later in time (not shown here), at the non-linear stage where the secondary KHI dominates the structuring, we observe some azimuthal “twisting” in that phase, particularly in the trailing edges. However, this azimuthal rotation is not significant enough to introduce a non-flute-like character in our structuring process (i.e., k = 0 ). Similarly, for the collisional 3D simulations, the presence of ion inertia, even when not fully dominating the structuring process, still plays a role in the reduction in the azimuthal “shear” that we observe in the highly collisional case. Additionally, Figure 10 shows the counter-clockwise azimuthal twist for the highly collisional simulations at three different times, as we move away from the mid-plane of z ^ before any structuring dominates and the cloud bifurcates.
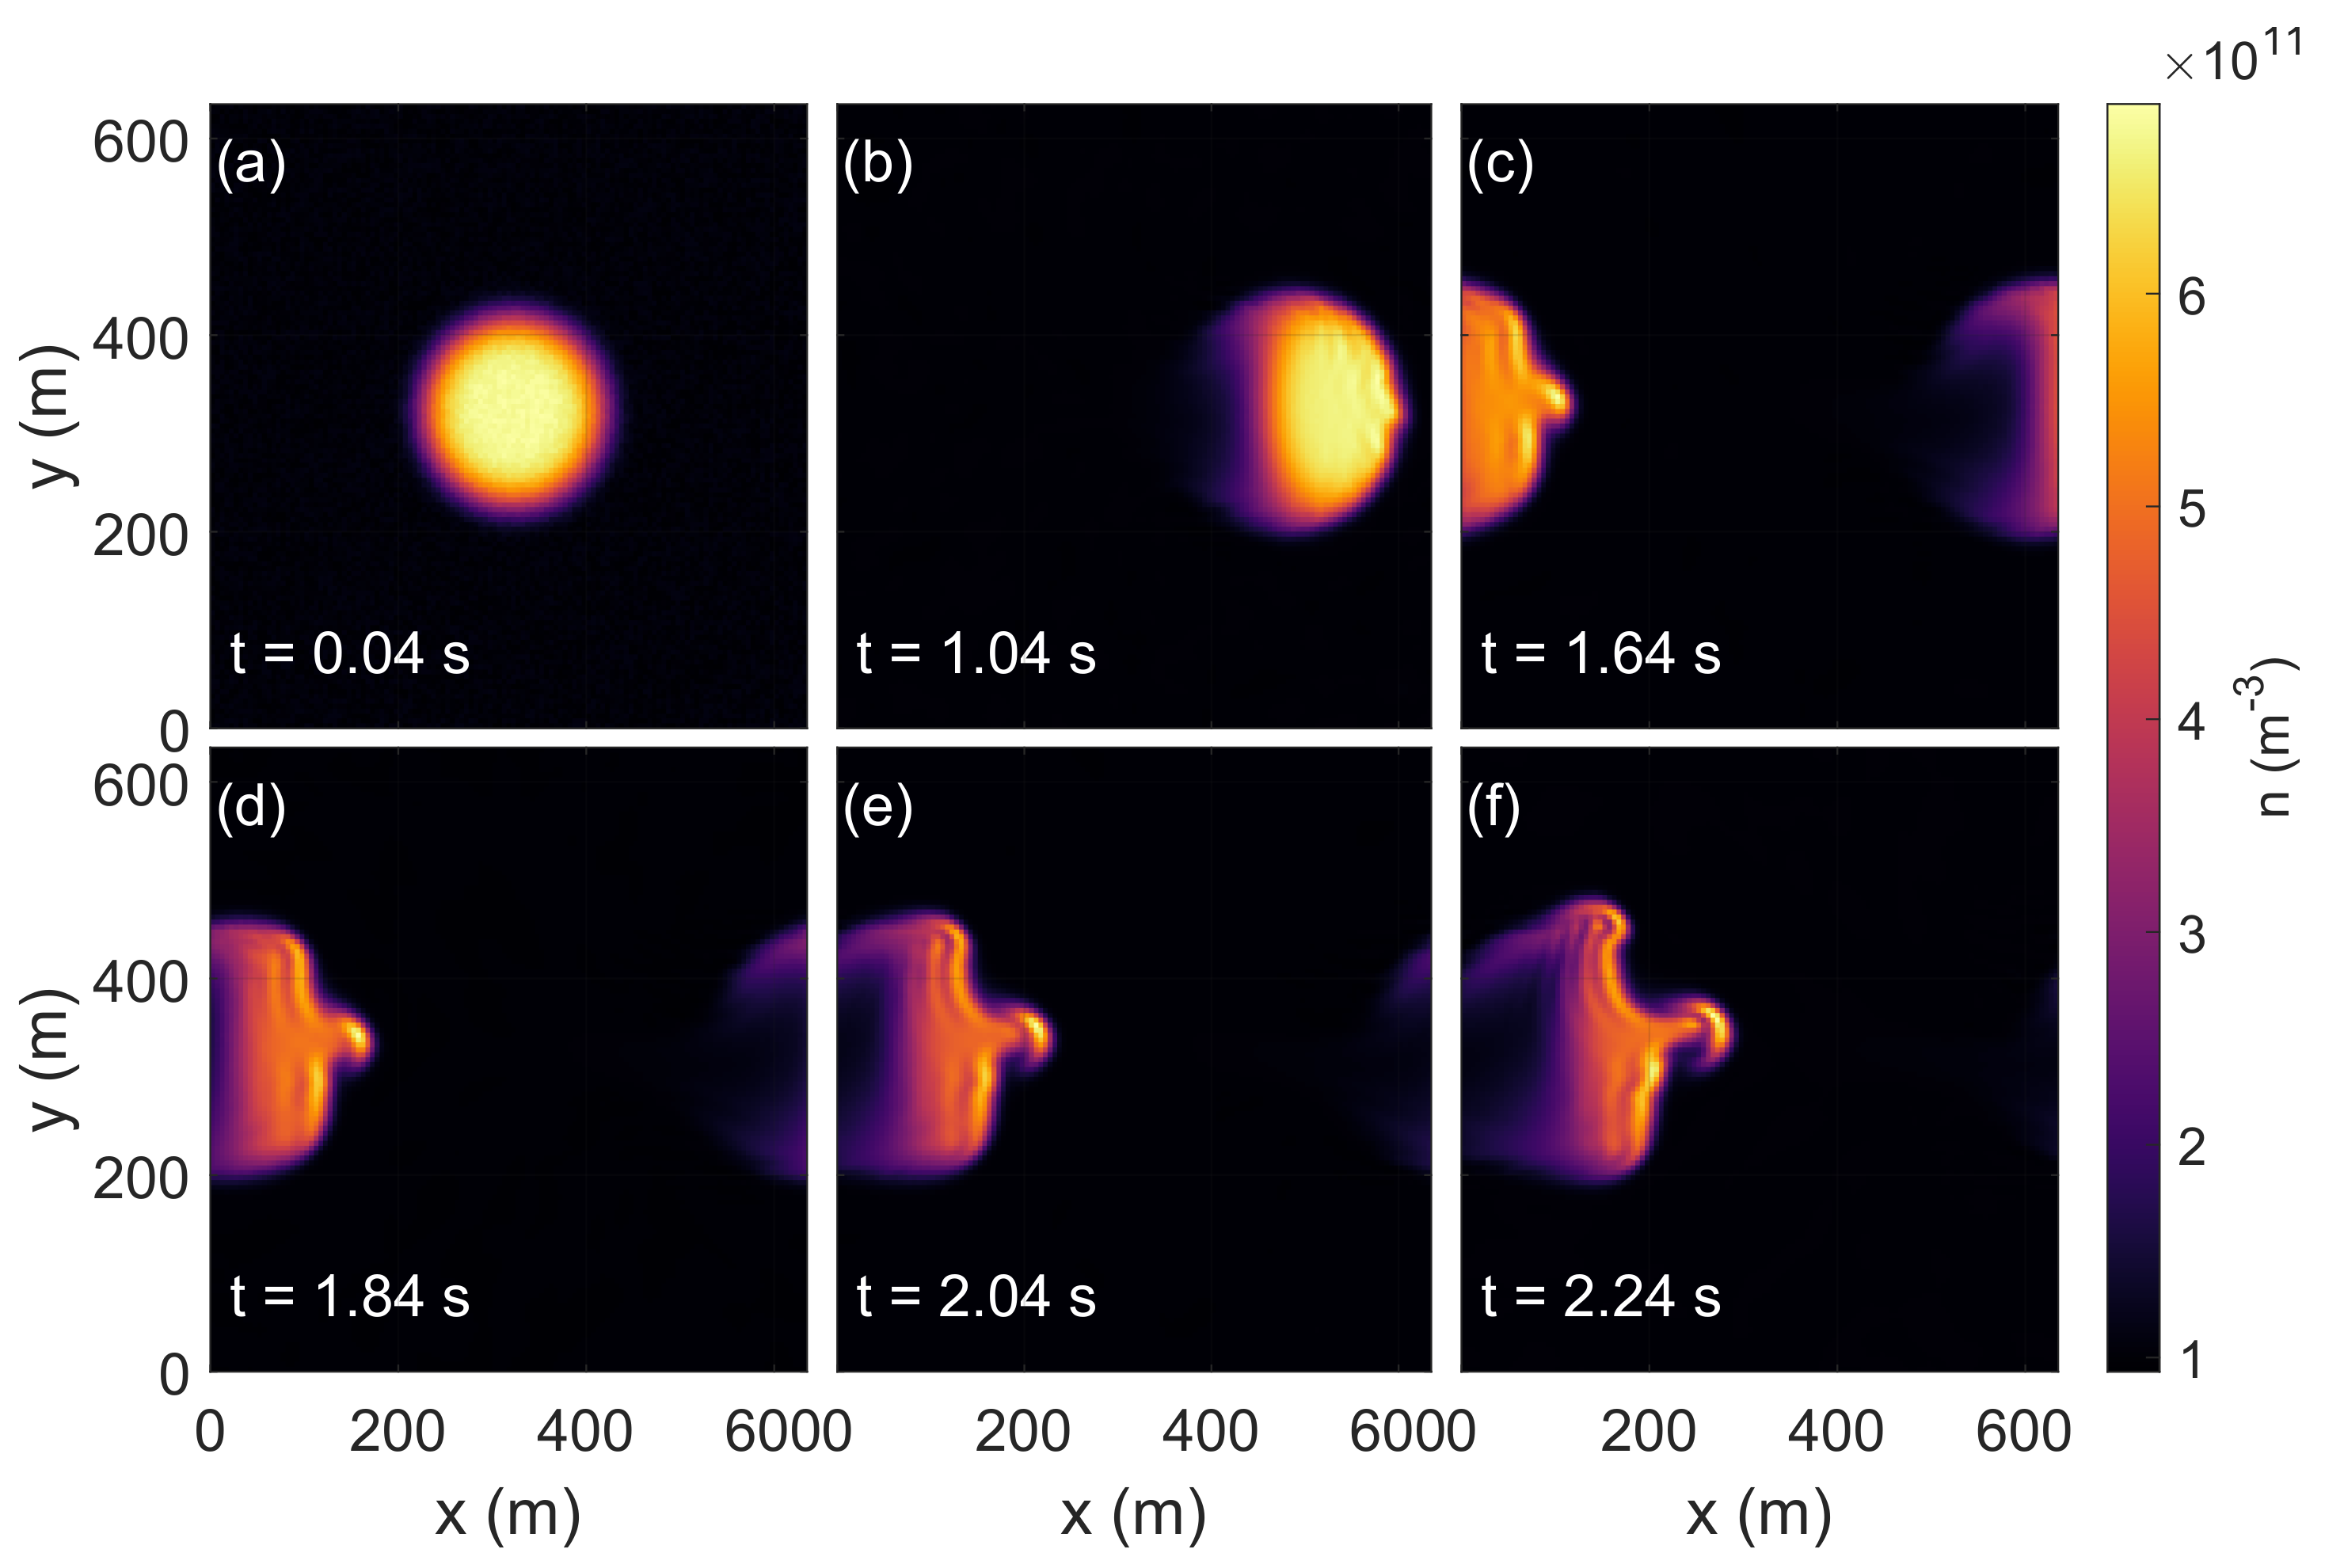
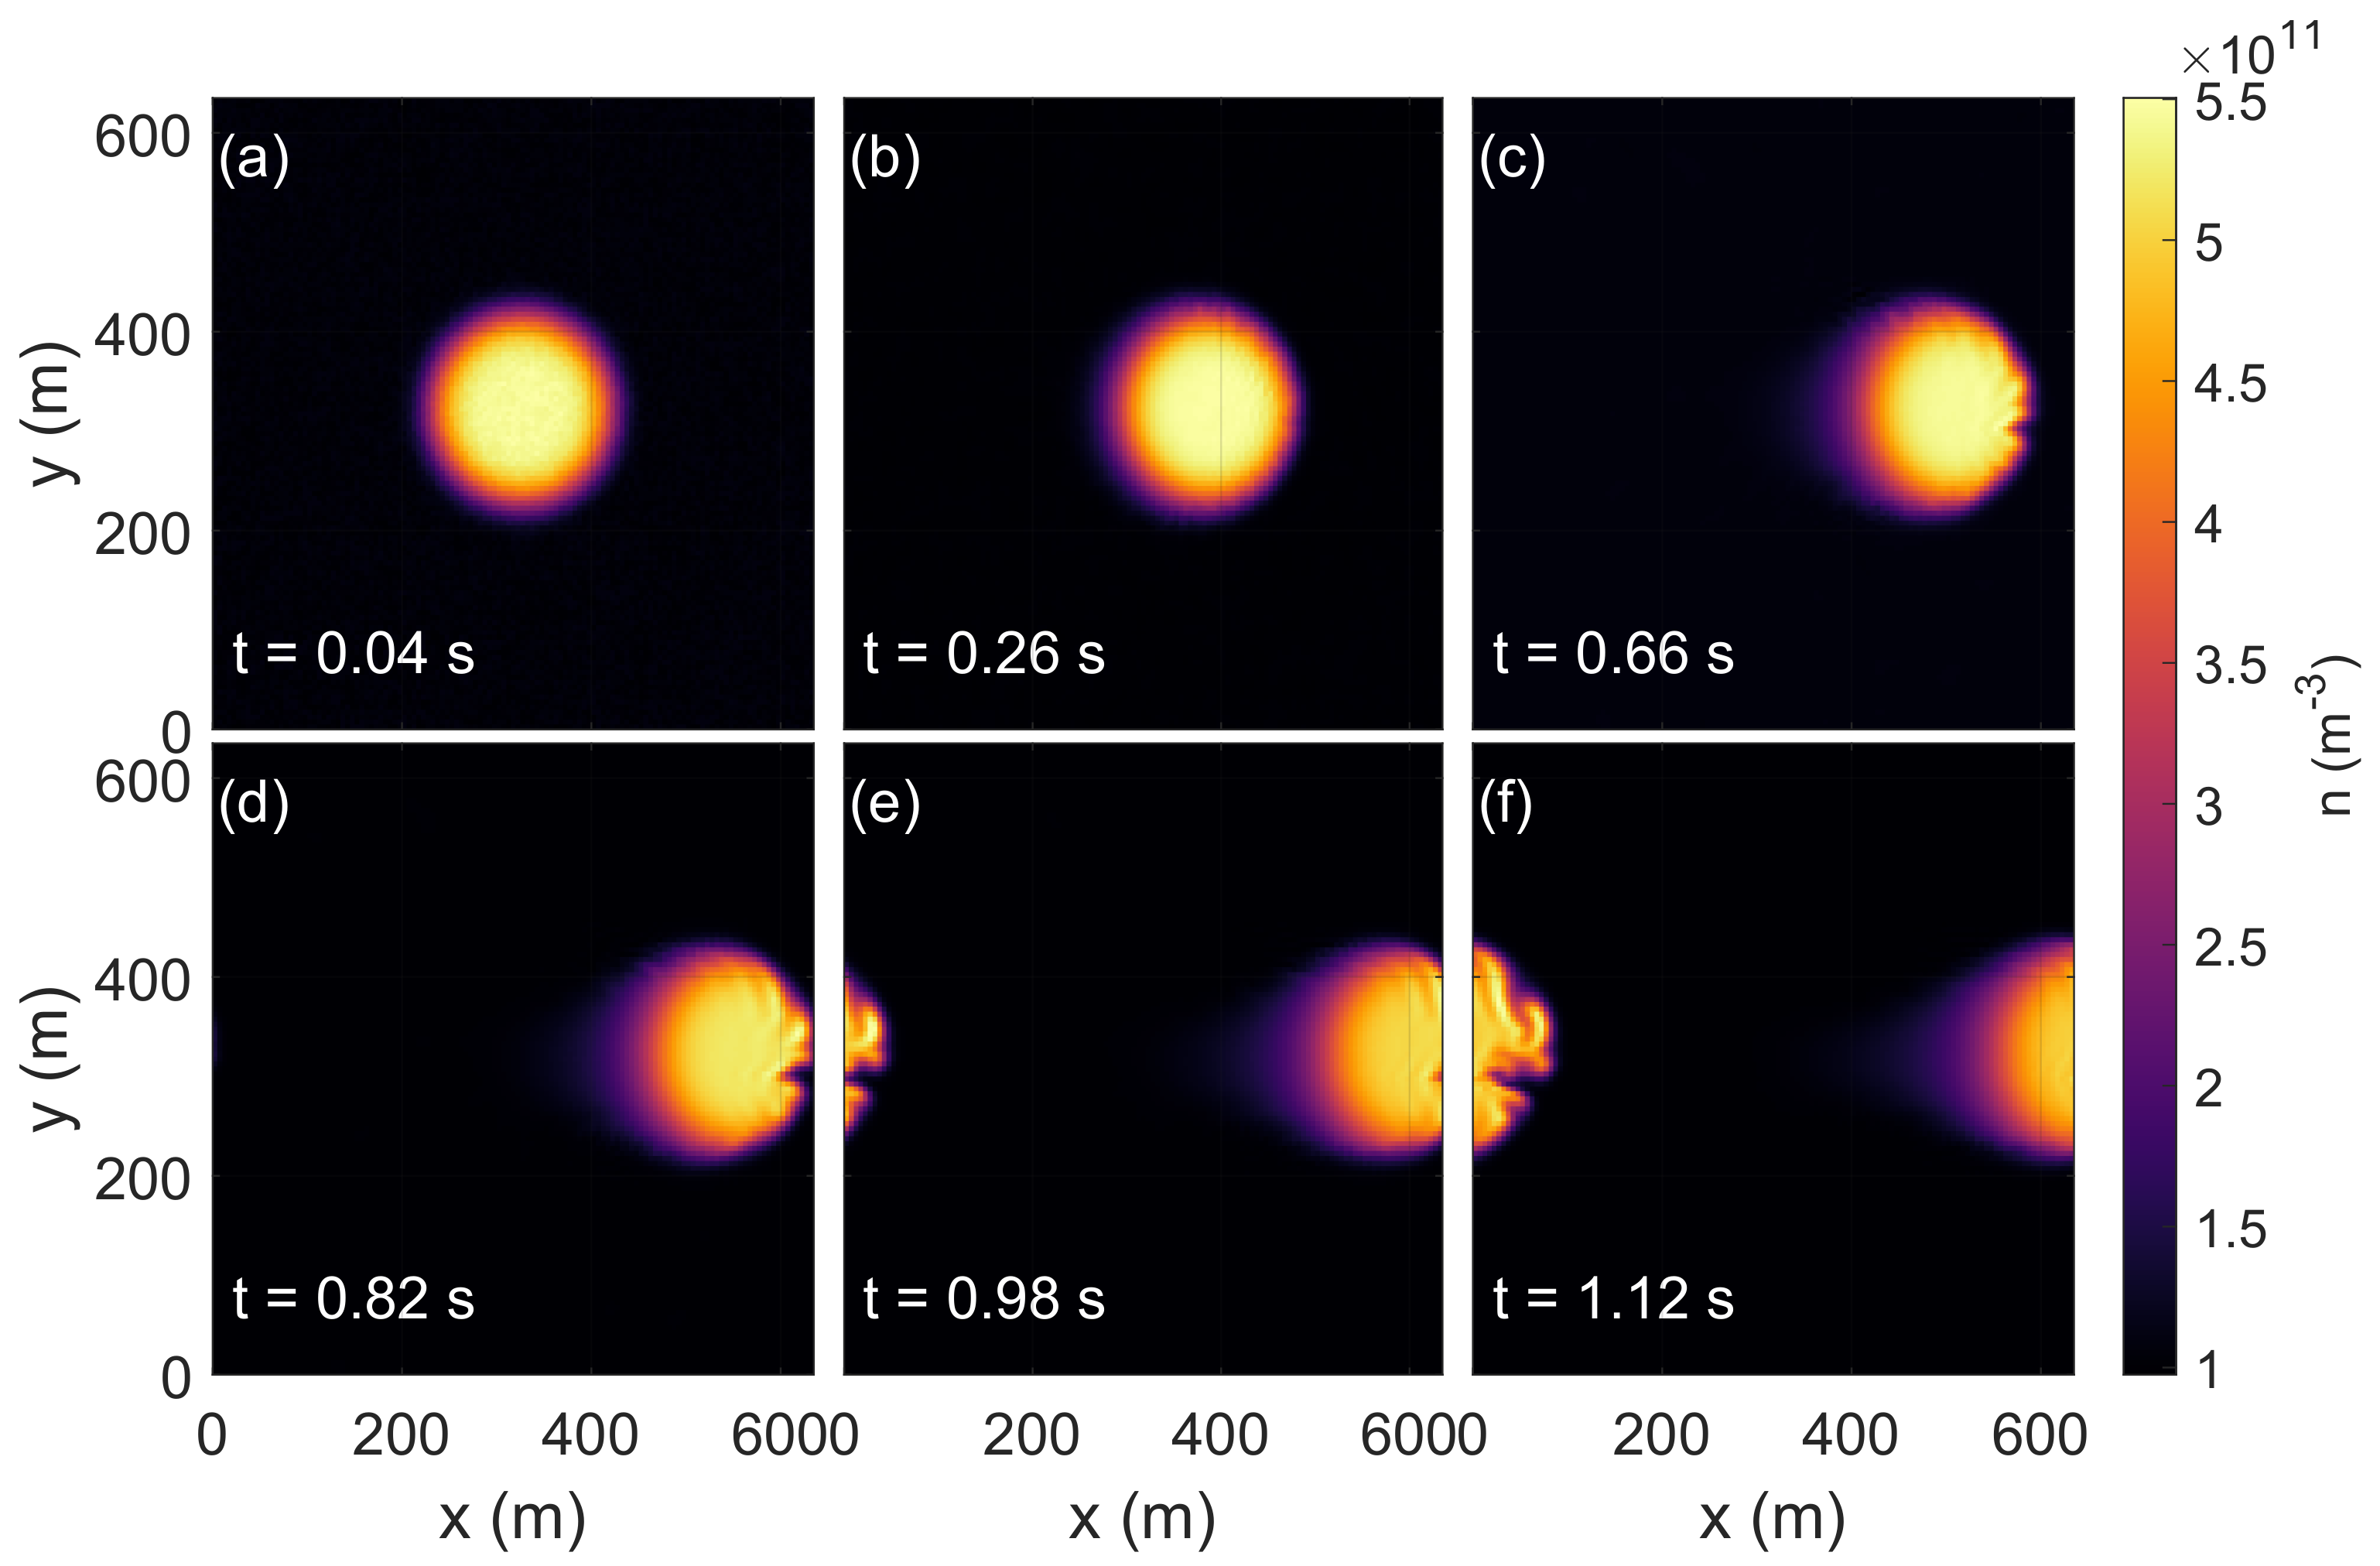
In the collisional two-dimensional simulations, we notice that early in the nonlinear stage, a leading edge finger structure has formed. The high-density finger grows outward into the low-density plasma. Subsequent nonlinear evolution involves the elongation of the finger structure. The behavior of the plasma and structure evolution for the inertial regime is very different from that of the collisional regime, as the finger-like structure forms mushroom heads that tend to thicken. The finger structure in the inertial regime is wider (i.e., undergoing an inverse cascade in the y direction), seen in Figure 4e for 2D simulations, and Figure 8f for 3D simulations. This is in contrast to the 2D and 3D simulation results in the collisional case (Figure 3d,e), where no inverse cascade is observed.
Finally, for the two-dimensional collisional plasma enhancement cloud simulation, the structuring occurs on a much faster timescale, which is consistent with previous work [20], as shown in Figure 3, compared to three-dimensional collisional simulations where the structuring develops slower, as seen in Figure 7. In particular, for the 3D simulations for the inertial regime, the slowing down of the structuring process is more pronounced, as seen in Figure 8f, compared to 2D inertial results in Figure 4f. In other previous two-dimensional simulations, results have shown that the structuring of a plasma patch occurs on faster timescales that lead to the patch disintegrating into small-scale structures [12]. In 2D simulations, there is a rapid structuring process in the nonlinear phase that can be explained as follows. As the perturbation develops, very steep localized density gradients develop in the finger structure. Since the growth rate of the instability is inversely proportional to the density gradient scale length, the structuring proceeds faster. In contrast, the inclusion of three-dimensional effects leads to some reduction in the growth rates for the GDI, as observed from our results in Section 2. This can be further investigated in the future by including parallel dynamics, which is known to produce a significant slowing down of the structuring process in 3D simulations due to the parallel electric field shorting out the transverse electric field caused by the instability [10,20,21].

5. Conclusions

A nonlinear fully three-dimensional numerical model was used to investigate the GDI and KHI associated with the evolution of ionospheric plasma clouds. These results were presented and then contrasted to our two-dimensional fluid model, as well as other previous similar three-dimensional simulations [6,19,20]. Three different regimes were taken in consideration, a highly collisional (i.e., altitude ≈ 200 km ), collisional (i.e., altitude ≈ 300 km ), and an inertial regime (i.e., altitude ≈ 450 km ). The two-dimensional simulations of both collisional and inertial regimes were as expected and in agreement with previous studies that show that the behavior of plasma clouds have a dependence on the altitude due to the collisionality [7,12,22]. However, for the three-dimensional simulation results, we generally observed slower growth rates, particularly in the inertial regime. Additionally, we showed that the inclusion of three-dimensional effects without the parallel dynamics (in the continuity equation) still plays a role in the evolution of plasma clouds. This is further highlighted in the 3D highly collisional simulation results, where the ambipolar potential causes the cloud and surrounding plasma to rotate around the axis of the cloud which is aligned with B . This azimuthal rotation or “shear” is also consistent with previous work that shows that the inclusion of the parallel electron pressure term in the potential equation impacts the purely collisional 3D plasma cloud. Additionally, in our 3D simulations, for a spherical plasma cloud, we observe that the local perturbations propagate in the azimuthal direction and that the propagation depends strongly on the latitude above or below the mid-plane of z ^ . In particular, the propagation rate is small at the mid-plane, and it increases sharply above and below. As a consequence, the structures are convected into a “barber pole configuration” and lose their flute-like character (i.e., k 0 ). We also investigate the azimuthal flow in collisional and inertial regimes to find that the inclusion of ion-inertial effects significantly reduces the azimuthal “twist” and retains the flute-like characters of the GDI. Future work will include other additional effects, such as electron parallel dynamics in the continuity equation, as well as the calculations of the ion and electron transport coefficients. Additionally, a better understanding of the local linear theory analysis is needed to investigate the growth rates for the gradient drift instability (GDI) with finite k z [21]. In order to obtain higher spatial resolution simulations for proper comparison to experimental observations, a full parallelization must be implemented to the current 3D numerical model. The results presented here offer a form of validation to our nonlinear 3D model by comparing our results to previously understood benchmark problems, such as the evolution of plasma clouds. However, the ultimate goal is to apply our model to study mid-latitude ionospheric phenomena, such as Subauroral polarization streams (SAPS), Polar Cap Patches, and mid-latitude ionospheric disturbances relevant to space weather radar observations.

Author Contributions

Writing—original draft, L.A.; Writing—review & editing, C.S., W.S. and B.S. All authors have read and agreed to the published version of the manuscript.

Funding

This work was supported by NASA under Grant Number NASAMAG16_2-0050, the National Science Foundation CAREER award under Grant No. PHY-1847905, the National Science Foundation Award Number 2048422, and the Bradley Department of Electrical Engineering at Virginia Tech.

Institutional Review Board Statement

Not applicable.

Informed Consent Statement

Not applicable.

Data Availability Statement

Not applicable.

Conflicts of Interest

The authors declare no conflict of interest.

References

  1. Haerendel, G. Experiments with plasmas artificially injected into near-Earth space. Front. Astron. Space Sci. 2019, 6, 29. [Google Scholar] [CrossRef] [Green Version]
  2. Armstrong, E. Observations of luminous clouds produced in the upper atmosphere by exploding grenades—I. Atomic emissions. Planet. Space Sci. 1963, 11, 733–742. [Google Scholar] [CrossRef]
  3. Haerendel, G.; Lüst, R. Artificial plasma clouds in space. Sci. Am. 1968, 219, 80–95. [Google Scholar] [CrossRef]
  4. Haerendel, G.; Lüst, R.; Rieger, E. Motion of artificial ion clouds in the upper atmosphere. Planet. Space Sci. 1967, 15, 1–18. [Google Scholar] [CrossRef]
  5. Linson, L.M.; Workman, J.B. Formation of striations in ionospheric plasma clouds. J. Geophys. Res. 1970, 75, 3211–3219. [Google Scholar] [CrossRef]
  6. Zalesak, S.; Drake, J.; Huba, J. Three-dimensional simulation study of ionospheric plasma clouds. Geophys. Res. Lett. 1990, 17, 1597–1600. [Google Scholar] [CrossRef]
  7. Rathod, C. Examining Plasma Instabilities as Ionospheric Turbulence Generation Mechanisms Using Pseudo-Spectral Methods. Doctoral Dissertation, Virginia Tech, Blacksburg, VA, USA, 2021. [Google Scholar]
  8. Almarhabi, L.; Skolar, C.R.; Scales, W.; Srinivasan, B. Investigating the impact of the latitudinal velocity profile on nonlinear gradient drift instability development in the subauroral ionosphere. Radiat. Eff. Defects Solids 2022, 177, 2–14. [Google Scholar] [CrossRef]
  9. Gondarenko, N.; Guzdar, P. Gradient drift instability in high latitude plasma patches: Ion inertial effects. Geophys. Res. Lett. 1999, 26, 3345–3348. [Google Scholar] [CrossRef]
  10. Gondarenko, N.; Guzdar, P. Density and electric field fluctuations associated with the gradient drift instability in the high-latitude ionosphere. Geophys. Res. Lett. 2004, 31, L11802. [Google Scholar] [CrossRef]
  11. Drake, J.; Huba, J. Dynamics of three-dimensional ionospheric plasma clouds. Phys. Rev. Lett. 1987, 58, 278. [Google Scholar] [CrossRef] [PubMed]
  12. Mitchell Jr, H.; Fedder, J.; Keskinen, M.; Zalesak, S. A simulation of high latitude F-layer instabilities in the presence of magnetosphere-ionosphere coupling. Geophys. Res. Lett. 1985, 12, 283–286. [Google Scholar] [CrossRef]
  13. Rathod, C.; Srinivasan, B.; Scales, W. Modeling the dominance of the gradient drift or Kelvin–Helmholtz instability in sheared ionospheric E× B flows. Phys. Plasmas 2021, 28, 052903. [Google Scholar] [CrossRef]
  14. Rathod, C.; Srinivasan, B.; Scales, W.; Kunduri, B. Investigation of the gradient drift instability as a cause of density irregularities in subauroral polarization streams. J. Geophys. Res. Space Phys. 2021, 126, e2020JA029027. [Google Scholar] [CrossRef]
  15. Bilitza, D. IRI the International Standard for the Ionosphere. Adv. Radio Sci. 2018, 16, 1–11. [Google Scholar] [CrossRef] [Green Version]
  16. Picone, J.; Hedin, A.; Drob, D.P.; Aikin, A. NRLMSISE-00 empirical model of the atmosphere: Statistical comparisons and scientific issues. J. Geophys. Res. Space Phys. 2002, 107, SIA 15-1–SIA 15-16. [Google Scholar] [CrossRef]
  17. Thébault, E.; Finlay, C.C.; Beggan, C.D.; Alken, P.; Aubert, J.; Barrois, O.; Bertrand, F.; Bondar, T.; Boness, A.; Brocco, L.; et al. International geomagnetic reference field: The 12th generation. Earth Planets Space 2015, 67, 1–19. [Google Scholar] [CrossRef] [Green Version]
  18. Hirsch, C. Numerical computation of internal and external flows. In Computational Methods for Inviscid and Viscous Flows; Elsevier: Amsterdam, The Netherlands, 1990; Volume 2. [Google Scholar]
  19. Drake, J.; Mulbrandon, M.; Huba, J. Three-dimensional equilibrium and stability of ionospheric plasma clouds. Phys. Fluids 1988, 31, 3412–3424. [Google Scholar] [CrossRef]
  20. Guzdar, P.; Gondarenko, N.; Chaturvedi, P.; Basu, S. Three-dimensional nonlinear simulations of the gradient drift instability in the high-latitude ionosphere. Radio Sci. 1998, 33, 1901–1913. [Google Scholar] [CrossRef]
  21. Chaturvedi, P.; Huba, J. The interchange instability in high-latitude plasma blobs. J. Geophys. Res. Space Phys. 1987, 92, 3357–3366. [Google Scholar] [CrossRef] [Green Version]
  22. Lloyd, K.; Haerendel, G. Numerical modeling of the drift and deformation of ionospheric plasma clouds and of their interaction with other layers of the ionosphere. J. Geophys. Res. 1973, 78, 7389–7415. [Google Scholar] [CrossRef]
Figure 1. A diagram illustrating the geometry of a 3D plasma cloud in a background plasma with labeled axes and important vectors. The density inside the cloud is high, while the background plasma has a low density. The magnetic field is in the z ^ (i.e., vertical) direction. The neutral wind is in the x ^ direction (i.e., north). This configuration is unstable to the GDI on the leading edge of the cloud (i.e., along the neutral wind direction). The density was modeled using Equation (4).
Atmosphere 14 00676 g001
Figure 2. Density color plots of the 2D simulations showing the evolution of a plasma enhancement cloud in a highly collisional regime. The trough of the GDI-induced bifurcation becomes unstable to a secondary GDI. Panels (e,f) show the continuation of the secondary instability development emerging from the center of the plasma cloud. Note that since the neutral wind is fast, the cloud elongates in the x ^ direction as the tail gets longer further in time. In the highly collisional regime, the plasma cloud structure is dominated by the development of the GDI.
Atmosphere 14 00676 g002
Figure 3. Density color plots of the 2D simulations showing the evolution of a plasma enhancement cloud in a collisional regime. Panel (a) shows the initial cloud. Panel (b) shows the cloud moving to the right. A finger-like structure extends from the center of the cloud, as seen in Panels (c,d). In Panels (e,f), a GDI-induced bifurcation begins to form as the tip of the finger-like structure curls into itself into a secondary KHI indicated by the “mushroom heads”.
Atmosphere 14 00676 g003
Figure 4. Density color plots of the 2D simulations showing the evolution of a plasma enhancement cloud in an inertial regime. Panel (a) shows the initial cloud. In panel (b) the cloud begins moving to the right with the trailing edge rolling up. Panels (c,d) show the beginning of a GDI developing as the finger-like structure starts forming on the leading edge. Panel (e) shows the continued growth of the GDI, as well as the trailing edge vortices continuing to roll up. Panel (f) shows the continued vortex mixing, as well as the onset of a secondary KHI.
Atmosphere 14 00676 g004
Figure 5. Density color plots of 2D slices at the mid-plane of z ^ showing the evolution of a 3D plasma enhancement cloud simulation in a highly collisional regime. Panels (c,d), show the x y leading edge becomes unstable and starts to bifurcate. Panels (e,f), show the continual growth of the bifurcation as finger-like structures curl up along the y ^ direction. Note that the cloud elongates in the x ^ direction as the tail grows, as seen in Figure 2.
Atmosphere 14 00676 g005
Figure 6. Density color plots of 2D slices at the mid-plane of y ^ showing the evolution of a 3D plasma enhancement cloud simulation in a highly collisional regime in the x z plane. Panel (b) shows the cloud drifting along the x ^ direction. Panels (c,d) show the formation of leading edge fingers in the x z plane. Panels (e,f) show the continued growth of these finger-like structures as the cloud elongates along the x ^ direction.
Atmosphere 14 00676 g006
Figure 7. Density color plots of 2D slices at the mid-plane of z ^ showing the evolution of a 3D plasma enhancement cloud simulation in a collisional regime. Panel (a) shows the initial cloud. Panel (b) shows the cloud then begins to move to the right, with the trailing edges slightly rolling up. In panels (d,e), a bifurcation begins as a finger-like structure extends from the plasma cloud. In Panel (f), the tip of the finger-like structure curls into itself, forming a secondary KHI.
Atmosphere 14 00676 g007
Figure 8. Density color plots of 2D slices at the mid-plane of z ^ showing the evolution of a 3D plasma enhancement cloud simulation in an inertial regime. Panel (a) shows the initial cloud. Panel (b) shows the cloud then begins to move to the right. A finger-like structure extends from the center of the cloud, as seen in Panel (c,d). In Panel (e,f), a GDI-induced bifurcation begins to form as the tips of the finger-like structure curl itself into a secondary KHI indicated by the “mushroom heads”. In the inertial regime, the plasma cloud structure is dominated by the development of the KHI.
Atmosphere 14 00676 g008
Figure 9. Contour plots of different latitudes above the mid-plane of z ^ at a single density value, for each of the three regimes: highly collisional (i.e., ν i n = 29.6 Hz ), collisional (i.e., ν i n = 2.96 Hz ), and inertial (i.e., ν i n = 0.296 Hz ).
Atmosphere 14 00676 g009
Figure 10. Early time evolution of contour plots of different latitudes above the mid-plane of z ^ at a single density value, showing the highly collisional regime (i.e., ν i n = 29.6 Hz ) with a counter-clockwise azmithal twist.
Atmosphere 14 00676 g010
Disclaimer/Publisher’s Note: The statements, opinions and data contained in all publications are solely those of the individual author(s) and contributor(s) and not of MDPI and/or the editor(s). MDPI and/or the editor(s) disclaim responsibility for any injury to people or property resulting from any ideas, methods, instructions or products referred to in the content.

