Communication

Reduction in the Arctic Surface Warm Bias in the NCAR CAM6 by Reducing Excessive Low-Level Clouds in the Arctic

1
Department of Earth Environmental System Sciences, Major of Environmental Atmospheric Sciences, Pukyong National University, Busan 48513, Republic of Korea
2
Faculty of Earth System and Environmental Sciences, Chonnam National University, Gwangju 61186, Republic of Korea
*
Author to whom correspondence should be addressed.
Atmosphere 2023, 14(3), 522; https://doi.org/10.3390/atmos14030522
Submission received: 5 January 2023 / Revised: 20 February 2023 / Accepted: 27 February 2023 / Published: 8 March 2023
(This article belongs to the Section Atmospheric Techniques, Instruments, and Modeling)

Abstract

:
High-latitude low clouds in the Northern winter have been known to be closely related to the Arctic surface air temperature by controlling downward longwave radiation, but Earth system models often fail to accurately simulate this relationship. In this study, we conducted a series of model experiments to examine the role of winter high-latitude low-level clouds in determining the Arctic surface temperature. Our findings show that low-level clouds play a significant role in regulating the Arctic surface temperature. We used the NCAR CAM6 model and compared the results of an unforced simulation run with those of an experiment using an empirical low-level cloud scheme to alleviate the typical overestimation of the low cloud fraction of state-of-the-art general circulation models at high latitudes. The unforced simulation exhibited excessive downward longwave radiation in the Arctic, resulting in a significant warm bias compared to reanalysis data. On the other hand, the experiment using a modified scheme more closely resembled the reanalysis data in terms of low-level cloud simulation. Overall, our study underscores the importance of accurately representing low-level clouds in high-latitude regions to reduce surface temperature bias in the model.

1. Introduction

The Arctic is unique in the sense that the temperature increases, under the influence of anthropogenic forcing, outpace other regions, and the rate is at least four times faster than the globally averaged temperature [1,2,3]. This is largely due to the acceleration of Arctic climate feedback, especially in recent decades. The decline of snow and ice cover in the Arctic and the adjacent high-latitude continents is a key driver of Arctic amplification. Several studies have investigated the role of snow and ice feedback mechanisms, such as the albedo feedback, in amplifying warming in the Arctic. These studies have shown that the decline of snow and ice cover can lead to increased absorption of solar radiation, which in turn, further contributes to warming in the Arctic [4,5]. The Arctic Ocean is also known to play a key role in Arctic amplification by transporting heat from lower latitudes to the Arctic. Studies have investigated the changes in ocean circulation and heat transport in response to Arctic amplification and the impacts of these changes on the Arctic climate. Atmospheric moisture transport also plays a critical role in Arctic amplification by providing the Arctic with moisture. The transport of moisture from the lower latitudes to the Arctic leads to an increase in precipitation and cloud cover. The increased cloud cover in the Arctic can further enhance warming by trapping longwave radiation and reducing the outgoing longwave radiation from the Arctic surface.
The warming of the Arctic affects a variety of meteorological phenomena, including the expansion of the jet stream center and the occurrence of blocking activities in the mid-latitudes [3]. This suggests that changes in the Arctic caused by global warming can affect the entire globe, not just the Arctic [3]. However, most global climate models (GCMs) do not simulate the Arctic climate well.
Models participating in the Coupled Model Intercomparison Project Phase 6 (CMIP6) exhibit a general tendency to overestimate Arctic clouds both in fraction and amount [6]. Excessive cloudiness increases the surface temperature by increasing downward longwave radiation (DLR) [7]. Especially in winter, cloud feedback is an essential contributing factor to Arctic warming because there is little or no solar insolation at high latitudes [8]. Incorrect Arctic climate simulations can lead to uncertainty in future climate projections [9]. The climate equilibrium sensitivities of the models participating in CMIP6 are distributed in a wider range, 1.8–5.7 °C, compared to those obtained from CMIP5, and this result is largely contributed by several particularly high-sensitivity models in the CMIP6 [10]. Community Earth System Model version 2 (CESM2), the latest model developed by the National Center for Atmospheric Research (NCAR), is one of the high-sensitivity models among the models participating in CMIP6. CESM2 exhibits a strong Arctic temperature increase, partly because of overly excessive high-latitude clouds [6,11]. Baek et al. reported that Community Atmospheric Model version 6 (CAM6), a CESM2 atmospheric model, overestimates cloud fraction and the amount of cloud liquid over the northern high latitudes, which leads to excessive warm bias in winter.
This study examines the effect of high-latitude clouds in winter by adding the freeze-dry cloud scheme to the existing cloud parameterization in CAM6. The freeze-dry cloud scheme is the method proposed in an earlier version (CAM3) to alleviate the overestimation of low cloud fraction in high latitudes [12]. Section 2 provides the data, model, and detailed explanation of the freeze-dry cloud scheme used in the study. Section 3 describes the experimental results of Arctic clouds and climate simulations according to the empirical low cloud scheme. Section 4 provides a summary and discussion.

2. Data and Methods

2.1. Data

For the data analysis, climate variables such as zonal wind, temperature, and DLR from the European Center for Medium-Range Weather Forecasts Reanalysis-Interim (ERA-Interim) from 1979 to 2014 are utilized. The ERA-Interim data originally had a 1.5° × 1.5° horizontal resolution and 37 vertical levels, but it was regridded into a 2.5° × 1.875° grid to enable a comparison with the output from the CAM6 model.
The CALIPSO satellite directly measures cloud quantity and phase using the backscattered and depolarized returned lidar signal [13]. CALIPSO, an active remote-sensing satellite, has an advantage for observing clouds with low optical depth; lower, sparse clouds, such as shallow cumulus; and clouds within the first 2 km above the surface [13]. Thus, CALIPSO–GOCCP currently provides the best satellite observations of high-latitude clouds because it can detect optically thin clouds without relying on albedo or thermal contrast [13,14]. The CALIPSO-GOCCP is used to compare with the low cloud fraction simulated by the model.

2.2. Model

The Community Atmosphere Model version 6 (CAM6) is a state-of-the-art climate model developed by the National Center for Atmospheric Research (NCAR). It simulates the physical processes that control the Earth’s climate, including atmospheric dynamics, radiative transfer, cloud formation, and chemical reactions. In order to assess the sensitivity of the Arctic surface temperature to changes in low-level cloud cover in CAM6 simulations, we conducted Atmospheric Model Intercomparison Project (AMIP) simulations from January 1979 to February 2015. These simulations utilized a horizontal resolution of 2.5° × 1.875° in longitude and had 30 vertical layers. In the simulation, SST and sea ice concentration were prescribed by HadISST observation data provided by Met Office [15]. Representation of aerosol–cloud interactions and other critical physical processes at the available resolution of GCMs is complex, resulting in significant uncertainties [16].
When directly comparing satellite observation cloud data and model cloud data, there may be a difference caused by this uncertainty. Therefore, to minimize the uncertainty of the model when compared with the satellite observation data, the model’s cloud was calculated using the lidar simulator of the CFMP (Cloud Feedback Model Intercomparison Project) Observation Simulator Package (COSP) diagnostic model. COSP is a flexible software tool that enables the simulation of model variables of data from several satellite-borne active and passive sensors [17]. For the CALIPSO-GOCCP dataset, CAM6-COSP provides statistical diagnostics using the histograms which are a function of cloud height and lidar scattering ratio [14]. Thus, COSP outputs include a variety of cloud properties and cloud fraction diagnostics that enable consistent observation–model comparisons. For a detailed description of the COSP diagnostic model, see Bodas-Scalcedo et al. (2011) [17].

2.3. Freeze-Dry Cloud Scheme
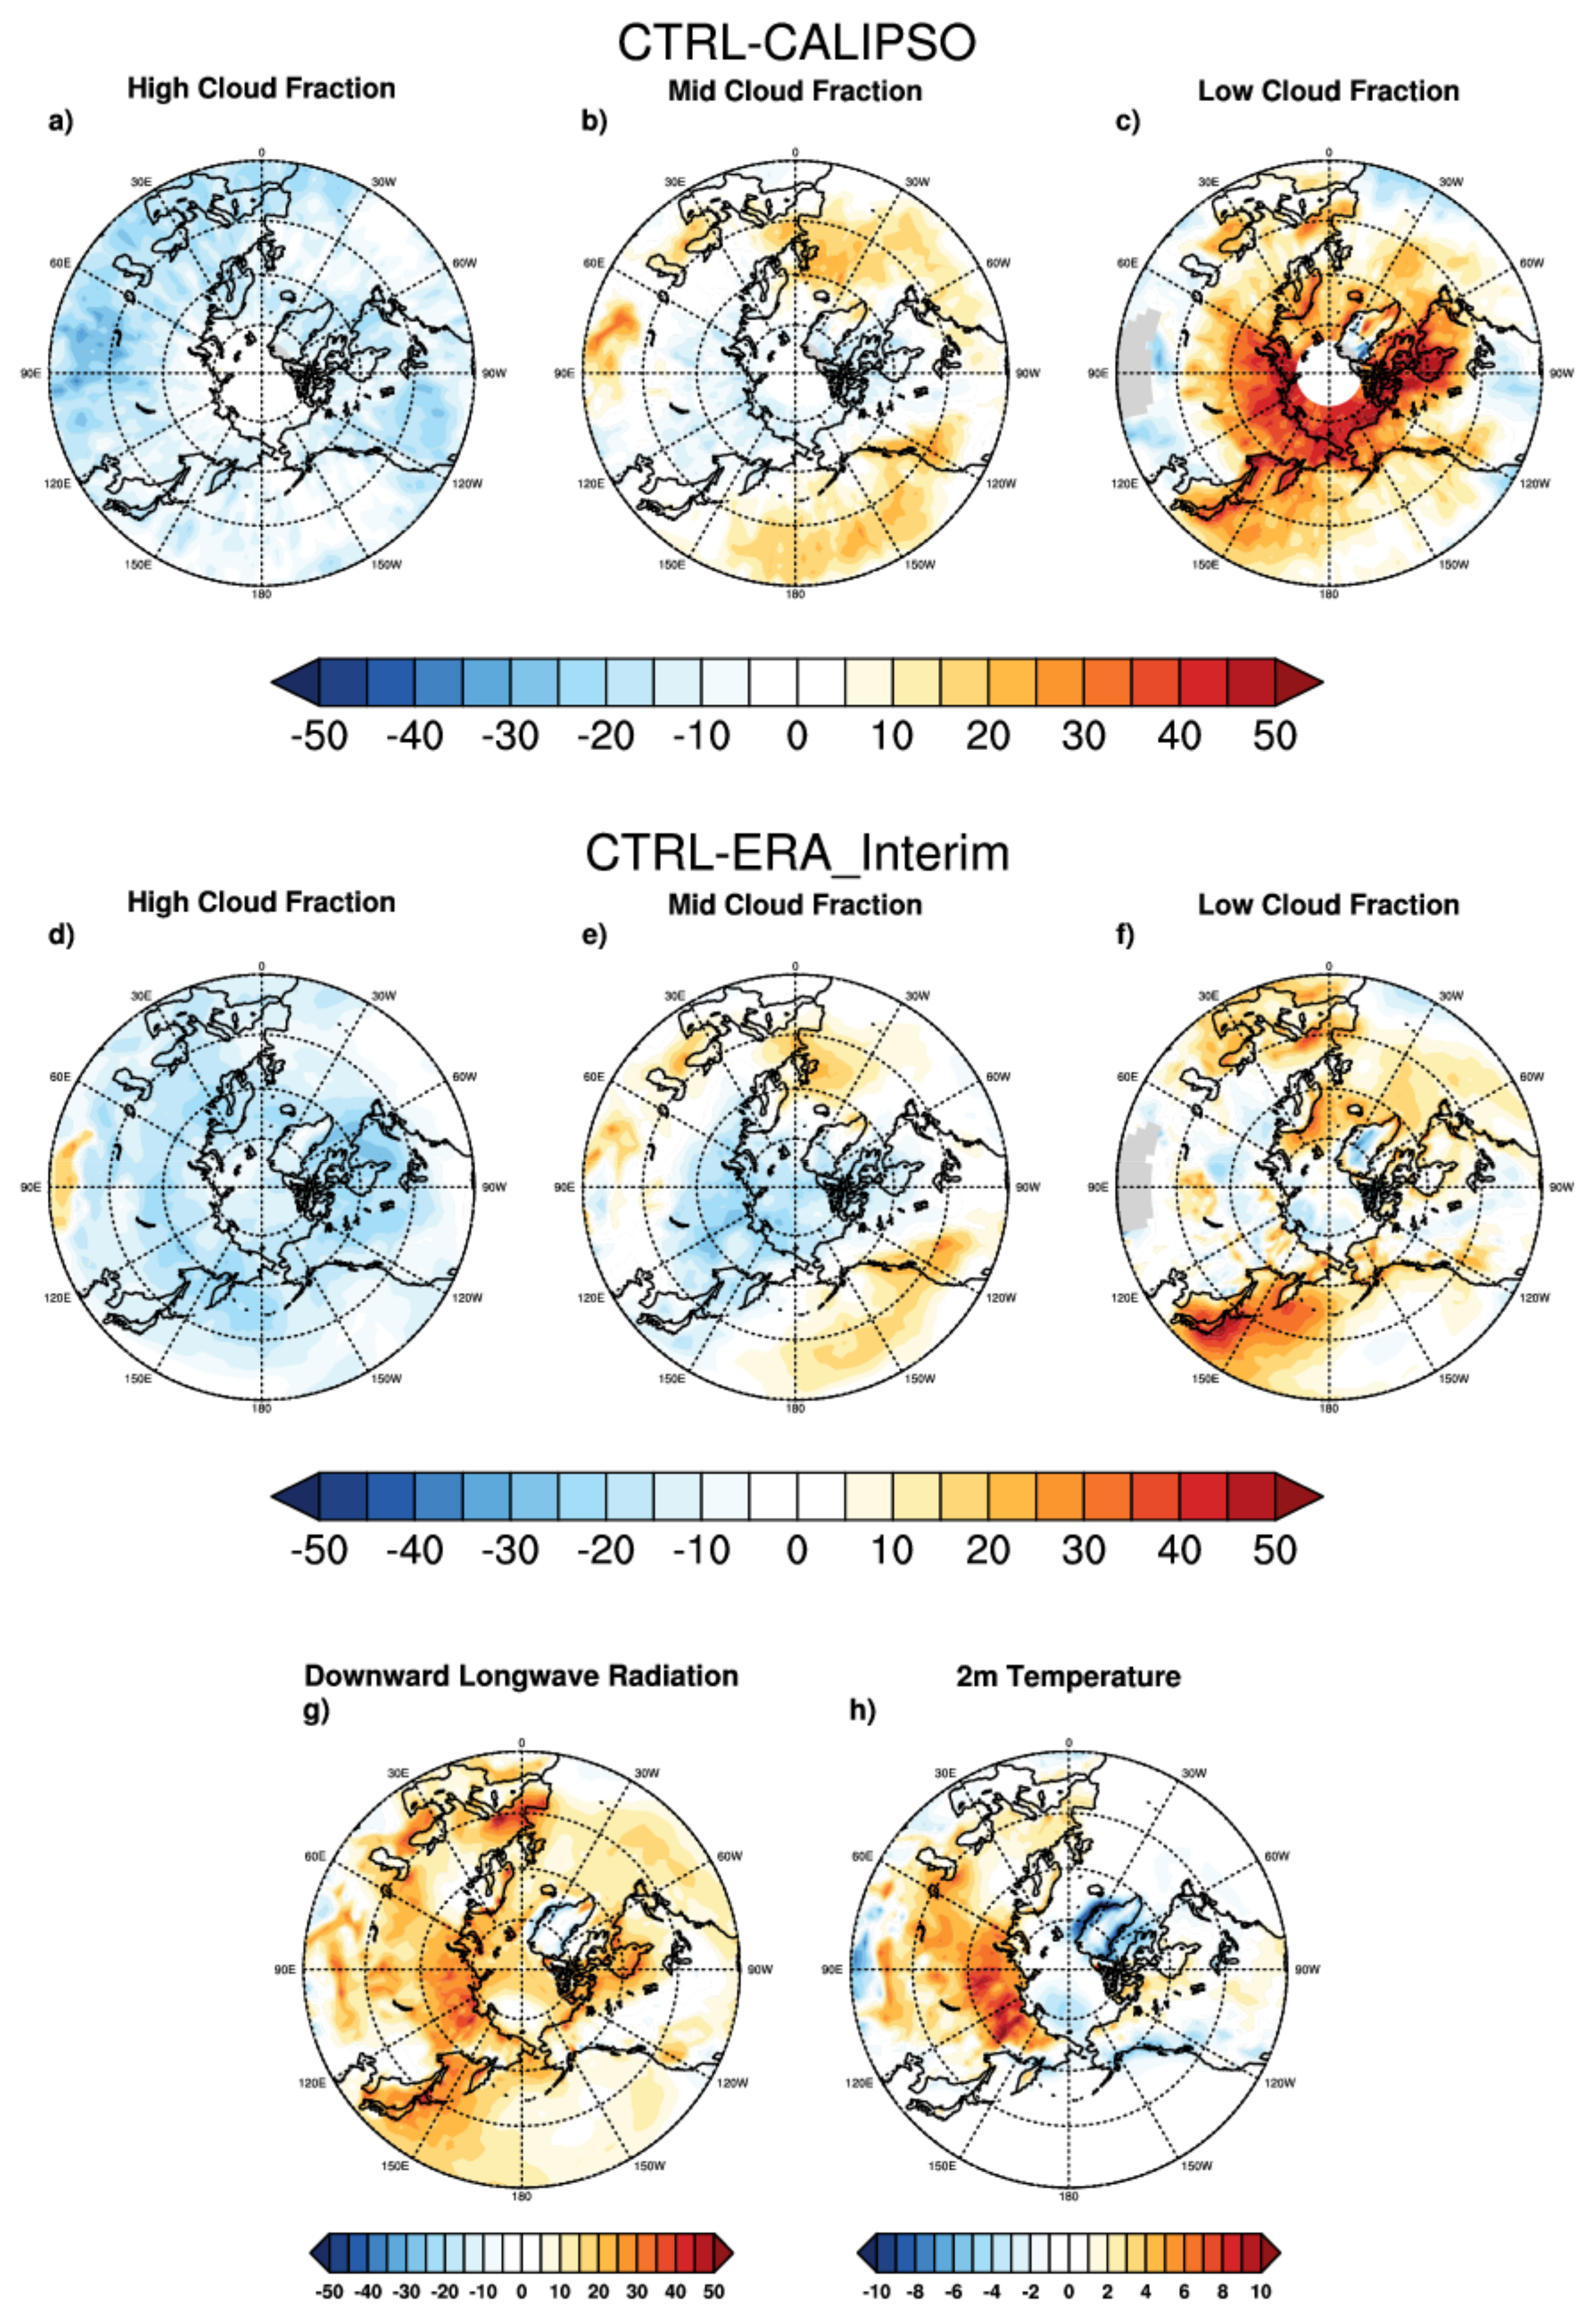
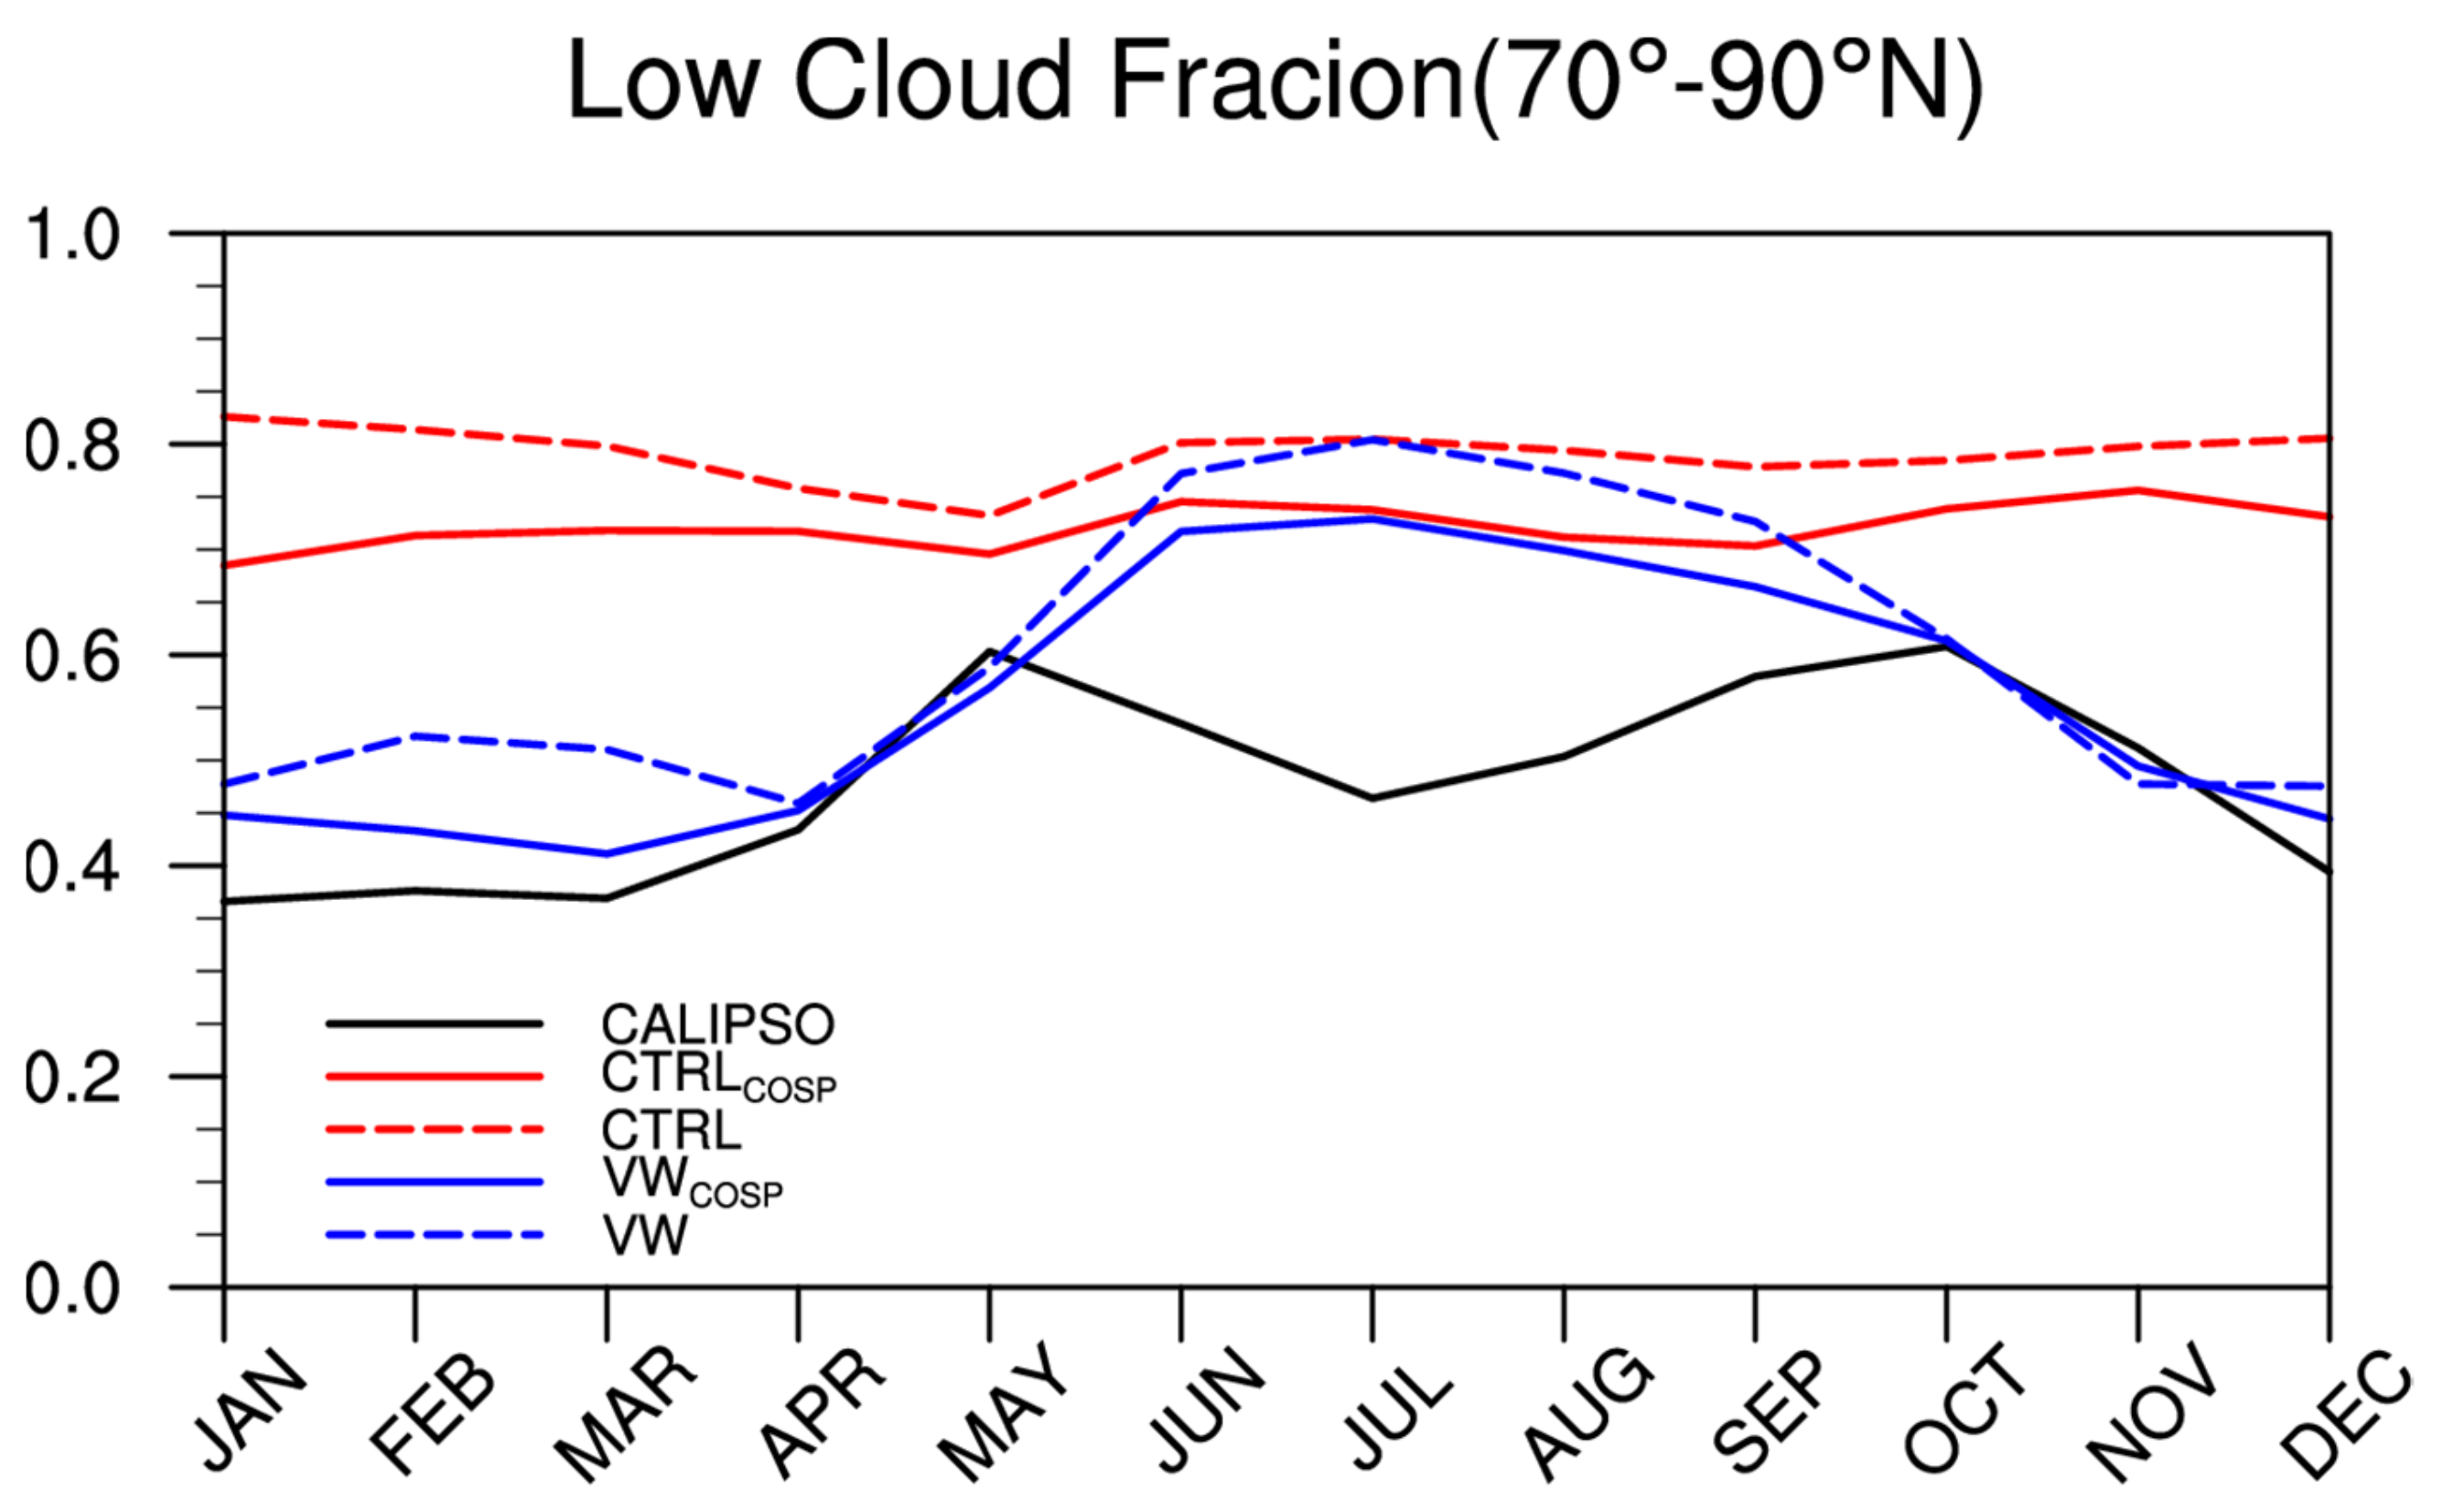
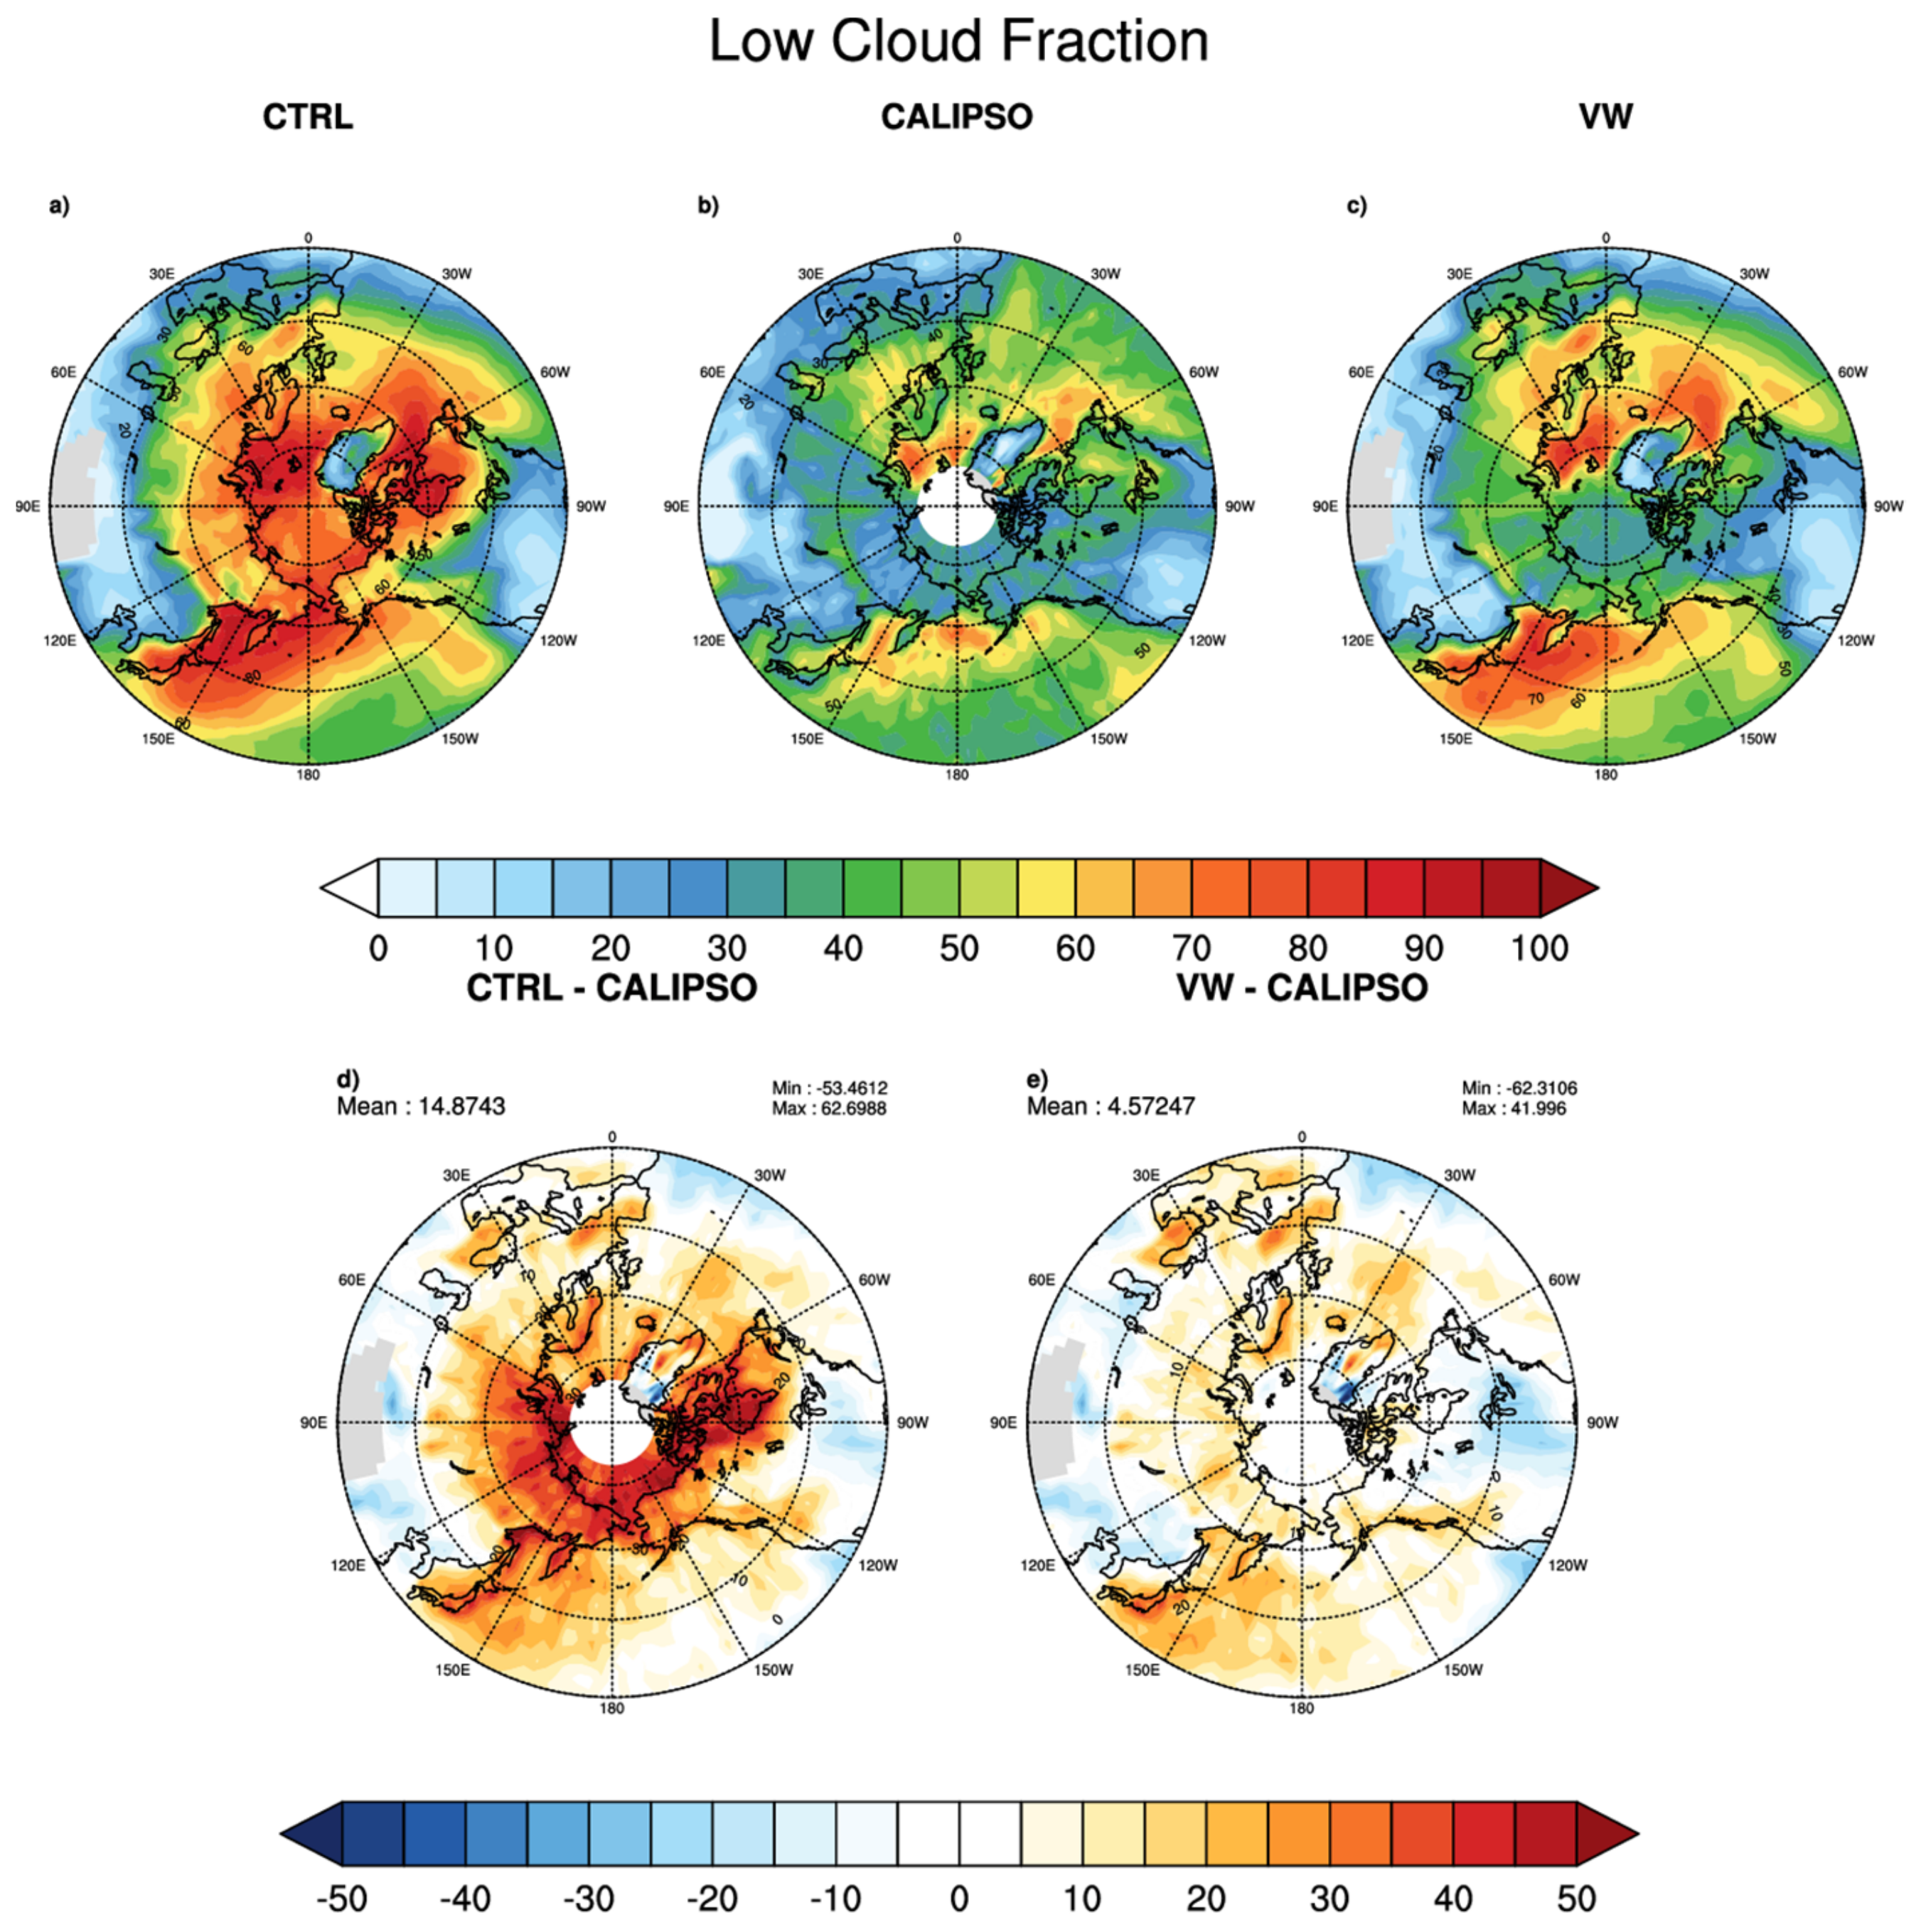
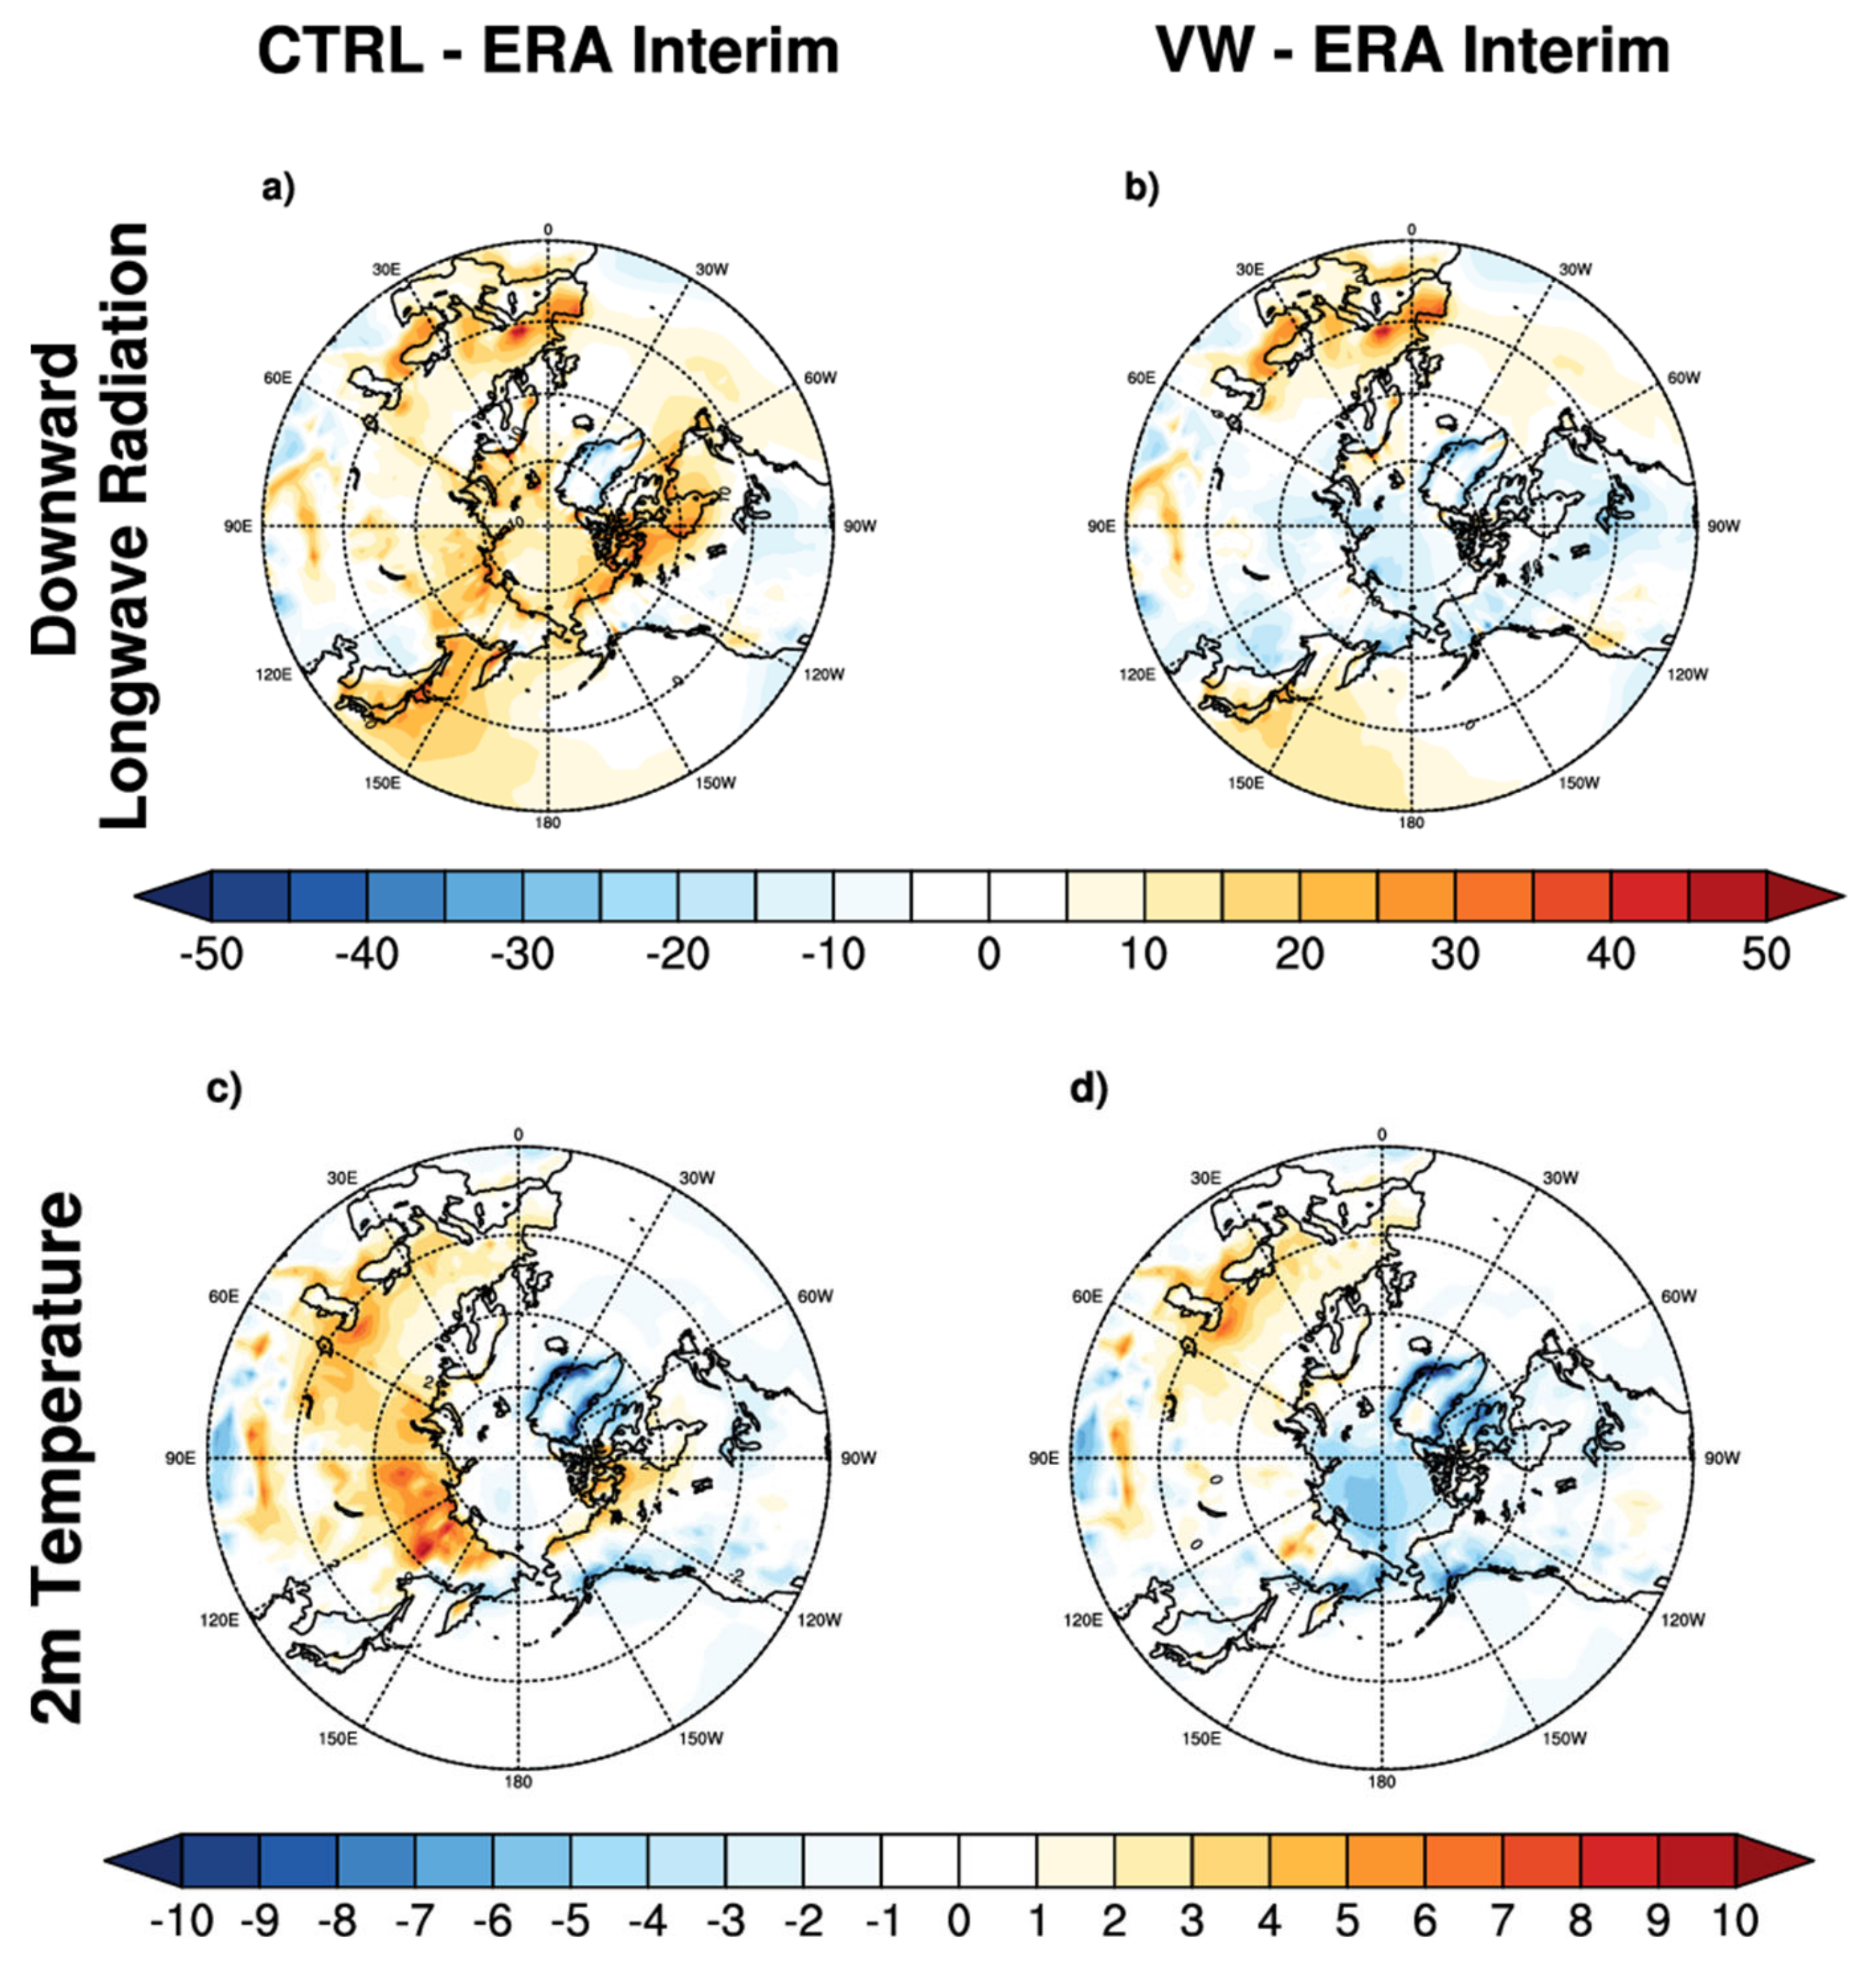
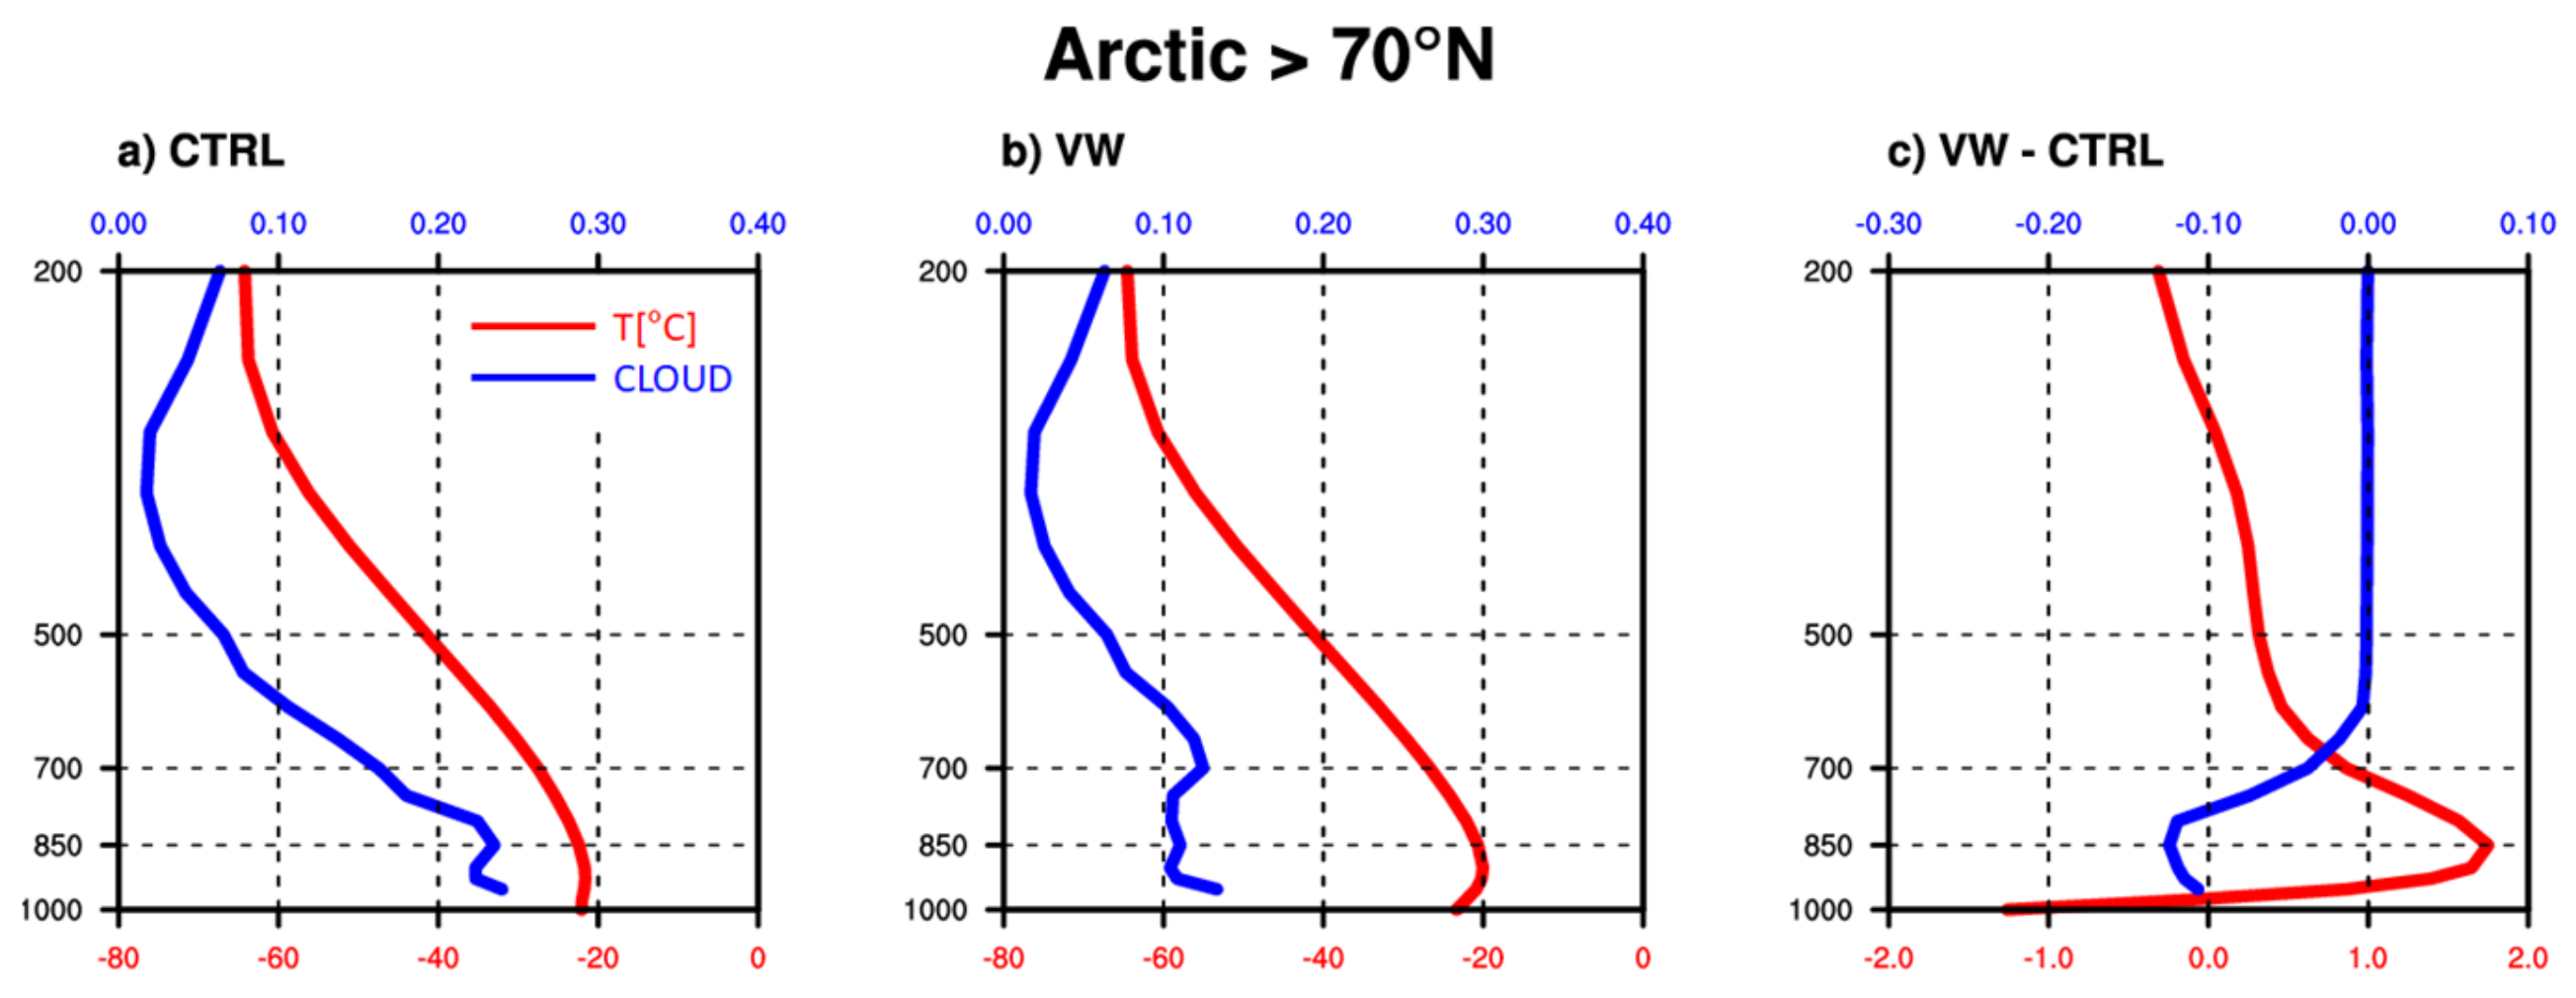
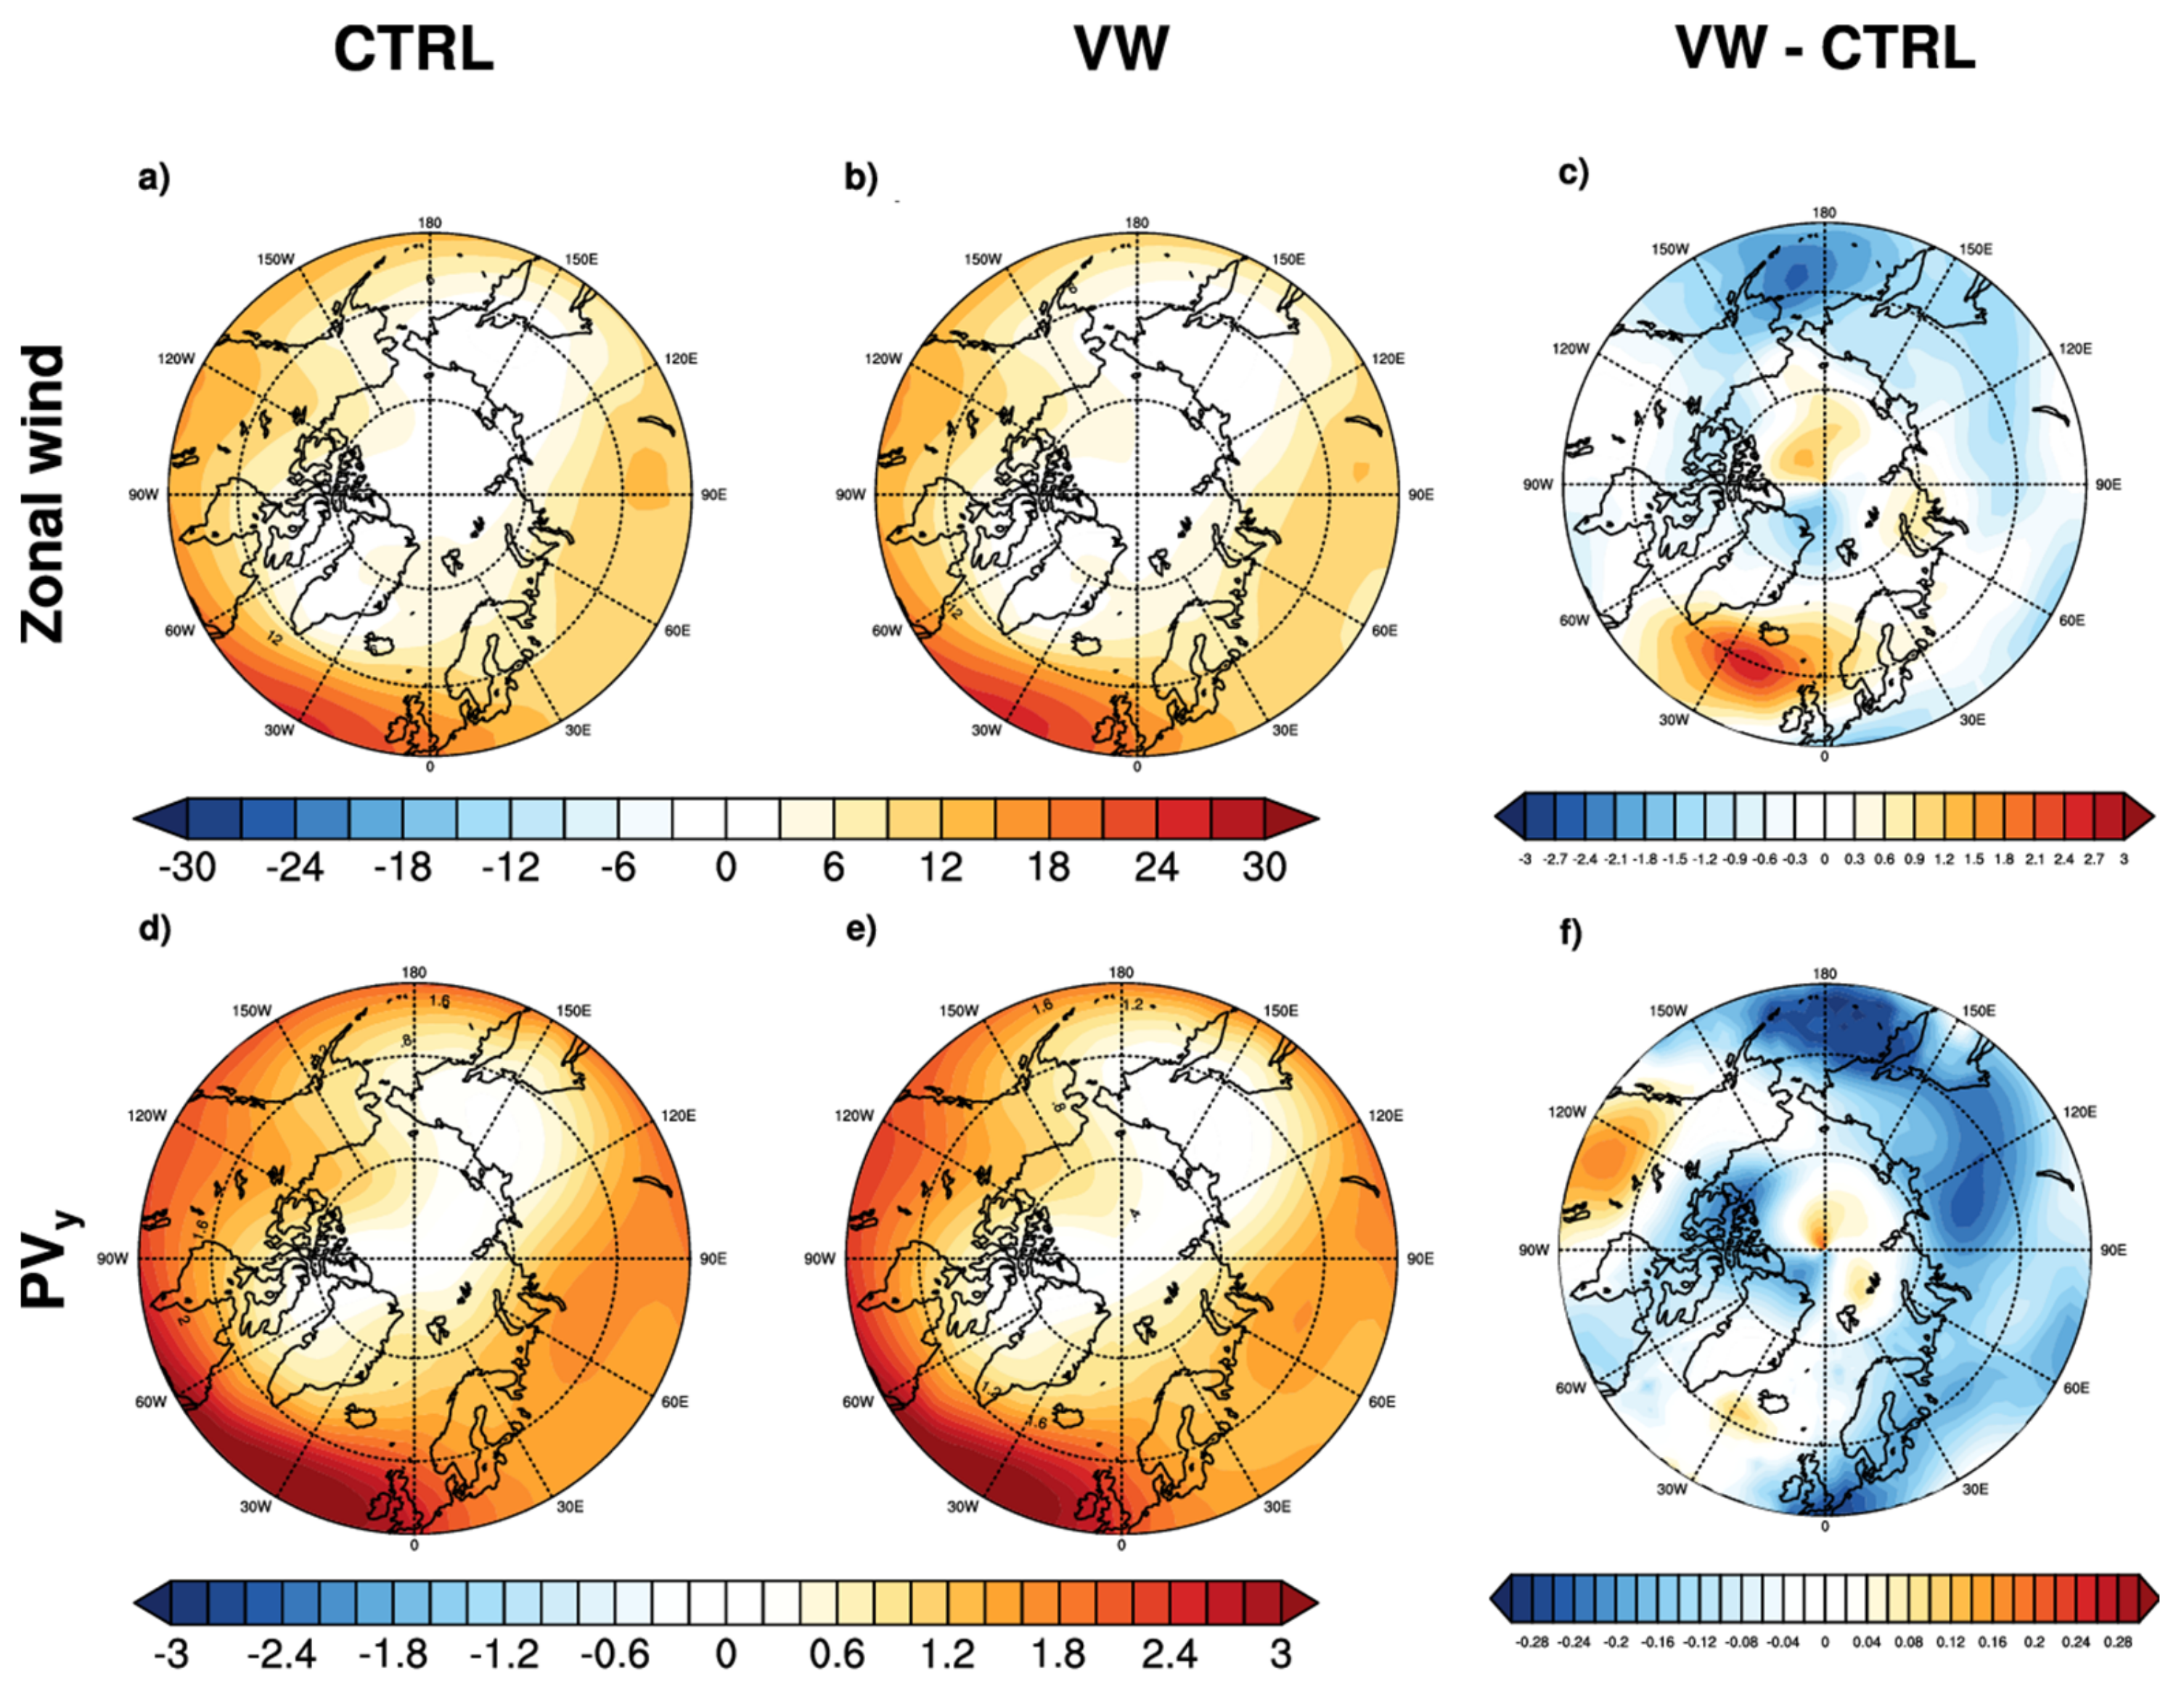
The cloud fraction calculation in CAM6 is represented in a unified turbulence scheme, Cloud Layer Unified By Binormals (CLUBB) [18,19]. CLUBB explicitly accounts for the transfer of heat, momentum, and moisture between the boundary layer and the cloud-topping boundary layer, and it is designed to simulate the diurnal cycle of clouds and boundary-layer processes. CLUBB calculates cloud condensation and fraction using a new simple multivariate binormal probability density function (PDF) that accounts for subgrid-scale changes in temperature, humidity, and vertical velocity [20]. CLUBB replaces the cloudy turbulent layer, cloud macrophysics, and shallow convection of the previous version, CAM5.
The PDF for calculating the cloud fraction in CLUBB used the grid-mean mixing ratio ( ω ¯ ) and the saturation mixing ratio ( ω s ) of the liquid water temperature ( T l ) [21].
μ = ω ¯ ω s T l ¯ 1 + α L c p
σ s = ω 2 ¯ 2 α 1 θ l ω ¯ + α 1 2 θ l 2 ¯ 1 2 1 + α L σ p
ζ = μ σ s
f ¯ = 1 2 1 + e r f ζ 2
Here, α is the gradient of saturated water vapor at T l [ α = 0.622 L ω s T l R d T l 2 ], and L is the latent heat of water vapor. R d is the gas constant of dry air and c p is the specific heat of static pressure for the mixed gas. α 1 = α θ T , where θ is potential temperature and θ l is the potential temperature of liquid water. The cloud fraction calculated in CLUBB may be overestimated in relatively cold and dry atmospheres, i.e., Arctic and Antarctic regions. In fact, many previous studies reported the overestimation of low-level cloud fraction over the polar region in CESM2/CAM6 [6,22].
In order to reduce the excessive cloud bias, in this study, we revised the calculation of the cloud fraction using the method proposed by Vavrus and Waliser (2008) [12] as follows:
f = f × m a x 0.15 , m i n 1.0 , q 0.003 , below   700   hPa
f is the cloud fraction and q is the specific humidity. This revision is adopted only in dry atmospheric environments (i.e., when q is under 0.003 kg kg−1) at lower atmospheres, i.e., polar regions in winter. It can reduce the cloud fraction by up to 85%. Since the scheme is designed to apply to cold and dry regions only, the scheme is often called a ‘freeze-dry’ cloud scheme. Equation (5) is added at the end of the cloud fraction calculation in CLUBB. The experiment in which the freeze-dry cloud scheme is applied to CAM6 is called “VW” and the control experiment of CAM6 is called CTRL.

3. Results

Over the mid and high latitudes, CAM6 exhibits sizeable cloud fraction biases (Figure 1). Over the high-latitude region (60° N) on which this study focuses, the cloud fraction biases of high and mid cloud fractions are negligibly small because the absolute cloud amounts are small over the high-latitude region. However, a sizeable positive bias of the low-level cloud is observed in the Arctic region (Figure 1c). Compared to the reanalysis, CAM6 has a negative bias of low cloud fraction (Figure 1f). There is no consistent positive bias of downward longwave radiation (DLR) (Figure 1g). Cloud fraction has a lot of uncertainty in reanalysis datasets because of a lack of data assimilation related to clouds [23]. We compared cloud fraction to CALPISO-GOCCP. Since there is little or no solar energy input at high latitudes during winter, downward longwave radiation (DLR) from the cloud bottom is an important energy source for surface energy balance. Over the Arctic region, DLR bias (Figure 1g) is consistent with the significant positive bias of low cloud bias depicted in Figure 1c. Confirming the important role of low clouds in the surface energy budget over the Arctic, the 2 m air temperature bias also resembles those of low clouds and DLR (Figure 1h).
When averaged over the high-latitude regions where the low cloud fraction exhibits positive bias, CTRL simulates the low cloud fraction up to twice as much as the CALIPSO satellite-based estimation (Figure 2). The low cloud fraction corrected by COSP is essentially not different but shows slightly less bias. On the other hand, VW shows significantly reduced low cloud bias at high latitudes to a similar level of CALIPSO. Since the cloud adjustment scheme is designed to apply to the dry and cold region only, i.e., winter high-latitude Arctic region, the summer high-latitude low clouds are still overly simulated.
Figure 3 shows the impact of the freeze-dry scheme. The low clouds simulated by VW significantly reduce the low clouds compared to CTRL (Figure 3a–c). Compared with the CALIPSO-GOCCP, VW has quite similar low cloud distributions compared to CTRL, though there is still some overestimation. In particular, low-level clouds over high-latitude continental regions are significantly reduced, and by this, the pattern and the amount of low cloud bias are effectively reduced. Note that the warm bias of up to 10 K over Eurasia and North America in CTRL was reduced by up to 7 K in VW. Therefore, this suggests the reduction in low clouds in the model is an effective way to reduce cloud biases in the high-latitude Arctic (Figure 3d,e). In the case of the CTRL that excessively simulates the low cloud fraction, DLR also shows a positive bias. In VW, which reduced the low clouds in winter, DLR was significantly reduced compared to the CTRL (Figure 4a,b). Reduced DLR leads to a decrease in surface air temperature (Figure 4c,d).
As the low cloud fraction decreases, the vertical structure of the temperature also changes (Figure 5). As expected, VW reduced the cloud fraction in the lower troposphere (lower than 700 hPa) by up to 12%. The reduction in the low cloud fraction caused a decrease in surface air temperature and increased the temperature in the low troposphere (Figure 5c). As a result, the strength of the inversion layer at high latitudes has strengthened in VW compared to CTRL. It is worth noting that the low cloud change is limited to lower than 700 hPa, but the increase in tropospheric temperature extends toward above 700 hPa (Figure 5c). This is possibly due to the increase in temperature in the low troposphere and the associated decrease in the thermal radiation from the low clouds. Low tropospheric warming reduces static stability above 700 hPa, facilitating additional vertical heat transfer. These changes play an essential role in how a low cloud fraction simulates an arctic climate.
Interestingly, the impacts of low-level clouds in the Arctic do not remain in the Arctic. The resultant warmer high-latitude tropospheric temperature weakens the north–south temperature gradient regionally. The weakened temperature gradient also weakens the zonal wind and meridional potential vorticity (PV) gradient (Figure 6). Note that previous studies revealed that the weakened zonal wind and its changes in meridional distribution alter the potential vorticity gradient locally, and the weakened PV gradient indicating the weakened PV gradient is a necessary condition for the blocking [24].

4. Summary and Discussions

Many GCMs have difficulty predicting the climate of Northern winter high-latitude regions. As suggested by previous studies, this is presumably associated with the positive DLR bias associated with excessive high-latitude low-level clouds in the model. We tackled this issue by carefully looking into the role of winter high-latitude low-level clouds in determining Arctic surface temperature using the NCAR CAM6 model. We compared the high-latitude low clouds and various climate variables in the two AMIP simulations: with and without cloud reduction parameterization (VW). Compared to the control simulation, the model with VW simulated winter high-latitude low clouds much like the reanalysis. Consequently, the reduced DLR resulted in the reduction in the warm bias of Arctic surface air temperature, leading to better simulation results.
Our results suggest that accurately representing low-level clouds in high-latitude regions brings a noticeable reduction in surface temperature bias in the model. The modified low cloud scheme reduced the warm bias of Arctic surface air temperature and enhanced the high-latitude low- and upper-level temperature.
The VW scheme used in this study has some limitations. Most of all, it arbitrarily gets rid of moisture in the climate system and, therefore, causes inevitable mass imbalances. Furthermore, it only works under arid and icy conditions by design, leading to an overestimation of summer high-latitude low-level clouds. Therefore, we emphasize that our study does not provide a simple solution to the Arctic cloud bias problem. Efforts on the development of better cloud parameterization in the Arctic region is needed.
In our study, we also showed that the impacts of modification of low-level clouds in the Arctic also influence remote regions outside of the Arctic. The resultant warmer high-latitude tropospheric temperature weakens the north–south temperature gradient regionally, which weakens the zonal wind and meridional potential vorticity gradient and could affect blocking events. Therefore, we suggest accurate representation of high-latitude low-level clouds in Earth system models is crucial for predicting the climate of northern winter in both high-latitude and mid-latitude regions. For further assessment of the possible impacts, future studies are needed.

Author Contributions

Project administration, B.-M.K.; formal analysis, J.B. and E.-H.B.; Investigation, E.-H.B.; Writing—review & editing, H.-J.S., J.-H.C. and H.-J.L. All authors have read and agreed to the published version of the manuscript.

Funding

This work funded by the Korea Meteorological Administration (KMA2020-02212).

Institutional Review Board Statement

Not applicable.

Informed Consent Statement

Not applicable.

Data Availability Statement

The data presented in this study are available on request from the corresponding author.

Acknowledgments

This work was carried out through the R&D project “Development of a Next-Generation Numerical Weather Prediction Model by the Korea Institute of Atmospheric Prediction Systems (KIAPS)”.

Conflicts of Interest

The authors declare no conflict of interest.

References

  1. Rantanen, M.; Karpechko, A.Y.; Lipponen, A.; Nordling, K.; Hyvärinen, O.; Ruosteenoja, K.; Vihma, T.; Laaksonen, A. The Arctic Has Warmed Nearly Four Times Faster than the Globe since 1979. Commun. Earth Environ. 2022, 3, 168. [Google Scholar] [CrossRef]
  2. Cowtan, K.; Way, R.G. Coverage Bias in the HadCRUT4 Temperature Series and Its Impact on Recent Temperature Trends. Q. J. R. Meteorol. Soc. 2014, 140, 1935–1944. [Google Scholar] [CrossRef] [Green Version]
  3. Cohen, J.; Screen, J.A.; Furtado, J.C.; Barlow, M.; Whittleston, D.; Coumou, D.; Francis, J.; Dethloff, K.; Entekhabi, D.; Overland, J.; et al. Recent Arctic Amplification and Extreme Mid-Latitude Weather. Nat. Geosci. 2014, 7, 627–637. [Google Scholar] [CrossRef] [Green Version]
  4. Stroeve, J.; Holland, M.M.; Meier, W.; Scambos, T.; Serreze, M. Arctic Sea Ice Decline: Faster than Forecast. Wiley Online Libr. 2007, 34, 9501. [Google Scholar] [CrossRef]
  5. Screen, J.A.; Simmonds, I. The central role of diminishing sea ice in recent Arctic temperature amplification. Nature 2010, 464, 1334–1337. [Google Scholar] [CrossRef] [PubMed] [Green Version]
  6. Vignesh, P.P.; Jiang, J.H.; Kishore, P.; Su, H.; Smay, T.; Brighton, N.; Velicogna, I. Assessment of CMIP6 Cloud Fraction and Comparison with Satellite Observations. Earth Sp. Sci. 2020, 7, e2019EA000975. [Google Scholar] [CrossRef] [Green Version]
  7. Wu, D.L.; Lee, J.N. Arctic Low Cloud Changes as Observed by MISR and CALIOP: Implication for the Enhanced Autumnal Warming and Sea Ice Loss. J. Geophys. Res. Atmos. 2012, 117, 7107. [Google Scholar] [CrossRef] [Green Version]
  8. Intrieri, J.M.; De Boer, G.; Shupe, M.D.; Spackman, J.R.; Wang, J.; Neiman, P.J.; Wick, G.A.; Hock, T.F.; Hood, R.E. Global Hawk Dropsonde Observations of the Arctic Atmosphere Obtained during the Winter Storms and Pacific Atmospheric Rivers (WISPAR) Field Campaign. Atmos. Meas. Tech. 2014, 7, 3917–3926. [Google Scholar] [CrossRef] [Green Version]
  9. Hodson, D.L.R.; Keeley, S.P.E.; West, A.; Ridley, J.; Hawkins, E.; Hewitt, H.T. Identifying Uncertainties in Arctic Climate Change Projections. Clim. Dyn. 2013, 40, 2849–2865. [Google Scholar] [CrossRef] [Green Version]
  10. Cai, Z.; You, Q.; Wu, F.; Chen, H.W.; Chen, D.; Cohen, J. Arctic Warming Revealed by Multiple CMIP6 Models: Evaluation of Historical Simulations and Quantification of Future Projection Uncertainties. J. Clim. 2021, 34, 4871–4892. [Google Scholar] [CrossRef]
  11. Gettelman, A.; Hannay, C.; Bacmeister, J.T.; Neale, R.B.; Pendergrass, A.G.; Danabasoglu, G.; Lamarque, J.F.; Fasullo, J.T.; Bailey, D.A.; Lawrence, D.M.; et al. High Climate Sensitivity in the Community Earth System Model Version 2 (CESM2). Geophys. Res. Lett. 2019, 46, 8329–8337. [Google Scholar] [CrossRef]
  12. Vavrus, S.; Waliser, D. An Improved Parameterization for Simulating Arctic Cloud Amount in the CCSM3 Climate Model. J. Clim. 2008, 21, 5673–5687. [Google Scholar] [CrossRef]
  13. Cesana, G.; Chepfer, H. How well do climate models simulate cloud vertical structure? A comparison between CALIPSO-GOCCP satellite observations and CMIP5 models. Geophys. Res. Lett. 2012, 39, L20803. [Google Scholar] [CrossRef] [Green Version]
  14. Kay, J.E.; Hillman, B.R.; Klein, S.A.; Zhang, Y.; Medeiros, B.; Pincus, R.; Gettelman, A.; Eaton, B.; Boyle, J.; Marchand, R.; et al. Exposing Global Cloud Biases in the Community Atmosphere Model (CAM) Using Satellite Observations and Their Corresponding Instrument Simulators. J. Clim. 2012, 25, 5190–5207. [Google Scholar] [CrossRef]
  15. Titchner, H.A.; Rayner, N.A. The Met Office Hadley Centre Sea Ice and Sea Surface Temperature Data Set, Version 2: 1. Sea Ice Concentrations. J. Geophys. Res. 2014, 119, 2864–2889. [Google Scholar] [CrossRef]
  16. Shaw, J.K.; McGraw, Z.; Bruno, O.; Storelvmo, T.; Hofer, S. Using Satellite Observations to Evaluate Model Representation of Arctic Mixed-Phase Clouds. Authorea 2022. Preprint. [Google Scholar] [CrossRef]
  17. Bodas-Salcedo, A.; Webb, M.J.; Bony, S.; Chepfer, H.; Dufresne, J.L.; Klein, S.A.; Zhang, Y.; Marchand, R.; Haynes, J.M.; Pincus, R.; et al. COSP: Satellite simulation software for model assessment. Bull. Am. Meteorol. Soc. 2011, 92, 1023–1043. [Google Scholar] [CrossRef]
  18. Evans, K.F.; Walter, S.J.; Heymsfield, A.J.; McFarquhar, G.M. Submillimeter-Wave Cloud Ice Radiometer: Simulations of Retrieval Algorithm Performance. J. Geophys. Res. Atmos. 2002, 107, AAC-2. [Google Scholar] [CrossRef]
  19. Larson, V.E. CLUBB-SILHS: A Parameterization of Subgrid Variability in the Atmosphere. arXiv 2017, arXiv:1711.03675. [Google Scholar] [CrossRef]
  20. Bogenschutz, P.A.; Gettelman, A.; Morrison, H.; Larson, V.E.; Craig, C.; Schanen, D.P. Higher-Order Turbulence Closure and Its Impact on Climate Simulations in the Community Atmosphere Model. J. Clim. 2013, 26, 9655–9676. [Google Scholar] [CrossRef]
  21. Lewellen, W.S.; Yoh, S. Binormal Model of Ensemble Partial Cloudiness. J. Atmos. Sci. 1993, 50, 1228–1237. [Google Scholar] [CrossRef]
  22. Baek, E.-H.; Bae, J.; Sung, H.-J.; Jung, E.; Kim, B.-M.; Jeong, J.-H.; Bhatt, S.; Wang, M.; Baek, E.-H.; Bae, J.; et al. Characteristics of High-Latitude Climate and Cloud Simulation in Community Atmospheric Model Version 6 (CAM6). Atmosphere 2022, 13, 936. [Google Scholar] [CrossRef]
  23. Yao, B.; Liu, C.; Yin, Y.; Liu, Z.; Shi, C.; Iwabuchi, H.; Weng, F. Evaluation of Cloud Properties from Reanalyses over East Asia with a Radiance-Based Approach. Atmos. Meas. Tech. 2020, 13, 1033–1049. [Google Scholar] [CrossRef] [Green Version]
  24. Luo, D.; Chen, X.; Overland, J.; Simmonds, I.; Wu, Y.; Zhang, P. Weakened Potential Vorticity Barrier Linked to Recent Winter Arctic Sea Ice Loss and Midlatitude Cold Extremes. J. Clim. 2019, 32, 4235–4261. [Google Scholar] [CrossRef]
Figure 1. The bias of control simulation (CTRL) for the cloud fractions and the associated variables during DJF: (a) high, (b), mid, (c) low cloud fraction (%) against the CALIPSO-GOCCP observation, and (d) high, (e) mid, (f) low cloud fraction (%), (g) downward longwave radiation (W/m2) and (h) 2 m air temperature against ERA-Interim reanalysis.
Atmosphere 14 00522 g001
Figure 2. Annual cycles of the low cloud fraction averaged over the Arctic from CALIPSO-GOCCP observation (black), CTRL (red), VW (blue) The values were averaged from June 2007 to February 2010. Model variable is dotted lines, COSP variable is solid lines.
Atmosphere 14 00522 g002
Figure 3. Low cloud Fraction of (a) CTRL, (b) CALIPSO, (c) VW and the biases of (d) CTRL and (e) VW against CALIPSO-GOCCP observation during winter from 2007 to 2010.
Atmosphere 14 00522 g003
Figure 4. Biases of (a,b) DLR and (c,d) surface air temperature against ERA-interim reanalysis during winter obtained from (left) CTRL and (right) VW.
Atmosphere 14 00522 g004
Figure 5. Vertical profiles of temperature (red) and COSP cloud fraction (blue) averaged over the Arctic during winter obtained from (a) CTRL, (b) VW, and (c) difference between VW and CTRL.
Atmosphere 14 00522 g005
Figure 6. DJF-mean 500 hPa Zonal winds ( ms 1 ; (ac)) and meridional potential vorticity gradient ( 10 6   Km 2 kg 1 s 1 ; (df)) on the 315 K isentropic surface during winter without ural blocking days ± 10.
Atmosphere 14 00522 g006
Disclaimer/Publisher’s Note: The statements, opinions and data contained in all publications are solely those of the individual author(s) and contributor(s) and not of MDPI and/or the editor(s). MDPI and/or the editor(s) disclaim responsibility for any injury to people or property resulting from any ideas, methods, instructions or products referred to in the content.

