Article

Species-Specific Contribution to Atmospheric Carbon and Pollutant Removal: Case Studies in Two Italian Municipalities

1
Council for Agricultural Research and Economics (CREA), Research Centre for Forestry and Wood, 00166 Rome, Italy
2
National Research Council of Italy (CNR), Institute of Bioeconomy (IBE), 00185 Rome, Italy
3
ARIANET Srl, 20159 Milano, Italy
4
National Research Council of Italy (CNR), Institute for Agriculture and Forestry Systems in the Mediterranean, 80055 Portici, Italy
*
Author to whom correspondence should be addressed.
Atmosphere 2023, 14(2), 285; https://doi.org/10.3390/atmos14020285
Submission received: 30 December 2022 / Revised: 23 January 2023 / Accepted: 29 January 2023 / Published: 31 January 2023
(This article belongs to the Section Biosphere/Hydrosphere/Land–Atmosphere Interactions)

Abstract

:
In order to maximize ecosystem services (ES), a proper planning of urban green areas is needed. In this study, the urban greenery of two Italian cities (Milan and Bologna) exposed to high levels of atmospheric pollutants was examined. Vegetation maps were developed through a supervised classification algorithm, trained over remote sensing images, integrated by local trees inventory, and used as input for the AIRTREE multi-layer canopy model. In both cities, a large presence of deciduous broadleaves was found, which showed a higher capacity to sequestrate CO2 (3,953,280 g m2 y−1), O3 (5677.76 g m2 y−1), and NO2 (2358.30 g m2 y−1) when compared to evergreen needle leaves that, on the other hand, showed higher performances in particulate matter removal (14,711.29 g m2 y−1 and 1964.91 g m2 y−1 for PM10 and PM2,5, respectively). We identified tree species with the highest carbon uptake capacity with values up to 1025.47 g CO2 m2 y−1 for Celtis australis, Platanus x acerifolia, Ulmus pumila, and Quercus rubra. In light of forthcoming and unprecedent policy measures to plant millions of trees in the urban areas, our study highlights the importance of developing an integrated approach that combines modelling and satellite data to link air quality and the functionality of green plants as key elements in improving the delivery of ES in cities.

1. Introduction

Air pollution is the main environmental health risk in Europe and is associated with heart disease, stroke, lung disease, and lung cancer [1]. It is estimated that exposure to air pollution causes more than 400,000 premature deaths per year in the EU [2,3,4]. Urban green areas can provide multiple environmental benefits, such as the amelioration of air quality by removing CO2 and pollutants from the atmosphere, climate micro-regulation, noise reduction, rainwater drainage, and conservation of biodiversity [5,6,7]; for an extensive list of ecosystem services provision, see Samson et al. [8].
The capacity to provide ecosystem services is a species-specific trait generally attributed based on the size and shape of the canopy and other specific plant traits [7]. Indeed, as reported by Bodnaruk [9] and Conte et al. [10], there are plants that are better suited to be used in environments with strong anthropic pressure. Bearing this in mind, it is therefore necessary to assess the best combination of species according to their ecophysiological characteristics [10,11] in light of the environment in which they are to be placed [12,13].
The urban forest ecosystem is complex and multifaceted; understanding how it works requires new types of data at appropriate spatial and temporal scales to explain forest dynamics, and remote sensing can fill this gap [14,15]. In an urban environment, remote sensing can support the evaluation of land use and tree cover [16,17,18,19,20]. Detailed information on tree species characteristics can be produced with the support of remotely sensed products. For instance, vegetation indexes such as Leaf Area Index (LAI), and phenological indicators may strongly support management and planning of urban green infrastructures and/or support parameterization of the models used to evaluate ecosystem services provided by urban vegetation [11,21]. Nowadays, forest management problems are multiscale and intricately linked to society’s need to measure and preserve multiple forest values [22]. Considering this, it is necessary to build green inventories and maps to quantify such benefits and, at the same time, to better manage the planning of green areas inside and outside the cities.
In this study, the AIRTREE model [11] was applied for the first time to the urban context of Milan and Bologna, two cities located in the Po River basin, one of the areas exposed to the highest air pollution levels in Europe and characterized by different size, population density, and geographic location. The model was parameterized with modelled atmospheric pollutants and species-specific biometric data combined with georeferenced maps. By using microclimatic, physiological, and morphological characteristics of each species inventoried by the municipalities, we adopted a spatially explicit method to generate vegetation maps with the goal to identify the tree species with the higher performances in sequestrating carbon and pollutants from the atmosphere and estimate the capacity of the overall greenery within each municipality to provide such relevant ES.

2. Materials and Methods

2.1. Local Climate and Study Area

In Italy, the average temperature value in 2015 (the reference year for this study) was the highest of the entire series since 1961, just above that of 2014 [23]. The average annual anomaly was +1.58 °C and was attributable to all four seasons, with the most marked anomaly in summer (+2.53 °C). In particular, the average annual temperature anomaly was +2.07 °C in the north of Italy with the warmest month compared to the mean in July (+4.31 °C). (https://www.isprambiente.gov.it/it (accessed on 26 January 2022)).

2.1.1. Milan

The Municipality of Milan occupies an area of 367.67 km2 in the west of Lombardy, located 25 km east of the Ticino River, 25 km west of the Adda river, 35 km north of the Po River, and 50 km south of Lake Como. It is therefore located to the west of the Po Valley basin and is characterized by a Cfa type climate (humid subtropical) [24,25] that is the typically temperate climate of the middle latitudes with a significant annual temperature range (hot summer and cold winter).
Like all big cities, temperatures are higher than in the surrounding countryside. In the center of Milan, annual average temperatures is around 3.5 °C in winter, 14 °C in spring, and 25 °C in summer. The average temperature range on a sunny day is about 10 to 13 degrees. Winters are colder than in the coastal cities, although the more southern latitude and the protection of the Alpine chain prevent the extremes of central Europe. Summers are hot and muggy, with very frequent thunderstorms mitigating the heat (reference period 1981–2010).
In January 2015, average temperatures and solar radiation were just above the norm for the period. The same was true for February and April. In contrast, the summer (June, July, and August in particular) was characterized by much higher-than-normal temperatures and irradiation, up to 34 °C. Rainfall was only slightly lower than the normal average of 40 mm (annual average value). Towards September, the temperature returned towards the normal average of 25 °C, and rainfall increased more than normal for this month. Between October and December, the temperature fell back to the average and went from 17 °C to 9 °C (monthly averages). The precipitation increased in October but was not manifested between November and December (http://www.arpalombardia.it (accessed on 26 January 2022)).

2.1.2. Bologna

The Municipality of Bologna covers an area of 277.22 km2 and is in the southern Po Valley, close to the foothills of the Tuscan-Emilian Apennines and between the mouths of the valleys of the Reno River and the Savena stream, which longitudinally bathe it to the west and east, respectively. The altimetry of the municipal territory ranges from 29 to about 390 m above sea level.
Bologna has a Cfa type climate (same classification as Milan) [24,25] with a humid temperate climate with very hot and humid summers and rather cold and wet winters.
Generally, the average temperature in winter is around 4 °C, in spring around 13 °C, and in summer around 26 °C. Rainfall is moderate, amounting for 670 mm per year. Rainfall is well distributed throughout the year, although there are two highs in spring and autumn and two relative lows in winter and summer (reference period 1981–2010).
During winter 2015, temperatures far above the general climate (+3.2 degrees) were recorded (this is one of the highest anomalies recorded). In particular, the winter was particularly mild in December (+3.1 degrees) and especially in January (a good +5.7 degrees above the climatic average); February was more average, with maximum temperatures of +0.9 °C above the climate. The average minimum temperatures were also higher than the long-term average: the seasonal minimum temperatures were 2 °C degrees above the climatic average.
The abundance of precipitation confirmed the anomalous nature of the winter of 2015 (with 197 mm reached in the month of February alone).

2.2. Meteorological and Air Pollutant Concentration Modelling

The air quality modelling system used for simulations in Milano and Bologna is AMS-MINNI [26,27], which includes a meteorological prognostic model (WRF v3.9.1.1-Weather Research and Forecasting) [28] and a chemical transport model (FARM—Flexible Air Quality Regional Model) [29]. Three nested domains with (approximately) 10 km, 4 km, and 1 km spatial resolution, respectively, were used to perform the simulations needed in this project, from European to city scale, to account not only the pollutant emissions located within the city but also for the effect of advection from outside the target domains. Meteorology and air quality has been reconstructed for Bologna and Milan areas with a 1 km spatial resolution and hourly temporal resolution.
Details on model configurations, urban vegetation treatment, and scenarios simulated are described in the VEG-GAP project document available from the project web site (https://www.lifeveggap.eu/filesharer/documents/VEG-GAP%20Guides (accessed on 26 January 2022)) and in de la Paz et al. (2022) [30]. Meteorological and air quality model simulation results are available for browsing and download from the VEG-GAP Information Platform (https://veggap.adamplatform.eu/ (accessed on 15 May 2022)) supported by the ENEA CRESCO computational facility (http://www.cresco.enea.it/ (accessed on 26 January 2022)). This meant that all vegetation maps were resampled to 1 km resolution in order to work consistently.
To obtain a primary understanding of the effect of vegetation on urban heat and air quality patterns, a simulation with no urban vegetation has been carried out as part of the activities foreseen in the VEG-GAP project. This scenario has been produced assuming bare soil conditions in all the presently vegetated areas located inside the administrative boundaries of the city. No change has been imposed over agricultural areas located inside the municipalities. Model simulations covered the whole year 2015 coherently with anthropogenic emission inventories and urban vegetation inventories that all refer to that particular year.

2.3. Tree Cover Maps

A land cover classification was carried out to identify the tree cover using the cloud computing platform of Google Earth Engine. The land cover classification was required because the public tree inventory (provided by the municipalities for the construction of these maps) does not account for private gardens, thus underestimating the overall urban green.
Municipal administrations of many European cities developed detailed digital vegetation inventories to support urban green maintenance. They contain the geographic location, species, and the main features of each single tree located along the roads and within public gardens and parks. This information is available through an institutional web geoportal, such as for the Milan Municipality (https://geoportale.comune.milano.it/sit/patrimonio-del-verde/ (accessed on 26 January 2022)). Inventories have been provided as vector type data by Bologna and Milan municipalities to support the VEG-GAP project activity. Since tree crown diameter was not available for Bologna, it has been estimated following Hemery et al. [31] providing “crown diameter–stem diameter ratios” estimates for different species of broadleaved trees. Since the list is referred to the year 2015, for the sake of completeness of the data, this year was chosen as a reference year to carry out this study.
The classification legend adopted (Table 1) is based on the Modis Land Cover Type 2 scheme [32]; the classes that were not present in the study areas were filtered out from the scheme.
The support vector machine was applied for land-cover characterization to a Sentinel 2 time-series [33]. A total of 485 ground truth areas were delimited by on-screen digitalization based on Google and Bing imagery and ancillary data, i.e., Corine Landcover, the city tree database and Copernicus Street tree layer. The ground truths were randomly divided as follows: 30% to train the algorithm and 70% to validate the classification for each legend class.
Sentinel-2 imagery was filtered to remove the clouds using the Sentinel-2 quality layer. The imagery was selected in the leaf-off period of winter 2018/2019 and in the leaf-on period of 2019. Since previous satellite imagery was not available, we assumed no relevant changes between 2015 and 2018/2019 in the spatial pattern of vegetation within each municipality. For each period, the multi-temporal dataset was reduced to a single image using a median filter, thus minimizing the noise from remaining reflectance artifacts, e.g., shadows. Each image was composed of 8 bands shown in Table 2.
For classification purposes, the infrared bands were upscaled to the resolution of 10 m using the nearest neighbor method. This resolution was required to catch as much of the isolated tree crowns as possible in the urban context. The classification was finally carried out merging the bands of the two images, one for the leaf-on and one for the leaf-off period, to better gauge the difference between evergreen and deciduous trees.
The classification accuracy was tested using Cohen’s Kappa score [34] because it is more representative of the classification accuracy for the study areas that presented an unbalanced data distribution among the classes. The classification validation resulted in a Kappa of 0.77 and 0.71 for Bologna and Milano, respectively.
Tree cover masks were generated separately for deciduous broadleaf, evergreen broadleaf, and needleleaf treed areas. A visual assessment of these masks showed that the tree cover for small trees was not identified, especially when isolated trees were not centered on a pixel. To minimize this issue, we merged these masks with others, obtaining and rasterizing the public tree geodatabase of the city at same resolution (10 m) for the three classes. The resulting masks had a value of 1 when either or both the classification and the tree database masks had a value of 1.
The computation of the tree cover ratio for the three classes (dataset A) was carried out using a mobile square window with a side of 500 m over the mask. For each iteration, the ratio between the number of pixels of each land cover class and the total number of pixels in the mobile window was computed. The results were assigned to a pixel having the same location and dimension of the mobile window.
To assess the ecosystem services through the AIRTREE model, we further required to have information of the tree cover for each tree species. We assumed that within a squared area having a side of 500 m, the tree species percent composition was the same for private and for public properties. Using the public tree geodatabase, we first rasterized the tree cover mask for each species at the resolution 10 m. As a second step, we rasterized the tree cover masks for the three land cover classes at the resolution of 10 m and downscaled the masks obtained at a resolution of 500 m. Such a method allowed us to compute the species percent composition (dataset B) with a moving window using the methodology explained above.
Finally, the tree cover for each tree species was computed multiplying the dataset A by dataset B. The resolution of 500 m was later downscaled to 1 km to match the resolution of climate and pollutant data.

2.4. The AIRTREE Model

The AIRTREE (Aggregated Interpretation of the Energy Balance and Water Dynamics for Ecosystem Services Assessment) model [11] is a one-dimensional multilayer model that couples soil, plants, and atmospheric processes to predict exchanges of carbon dioxide (CO2), water vapor (H2O), tropospheric ozone (O3), particulate matter (PM10 and PM2.5), and nitrogen dioxide (NO2) between leaves and the atmosphere and integrates them across five layers to obtain fluxes at the canopy level. The model allows the estimation of stomatal conductance (gs) and photosynthesis (An) by coupling the Farquhar-Von Caemmerer-Berry photosynthesis model (FvCB model) and the Ball, Woodrow, and Berry stomatal conductance (BWB) [35] model at different levels from the canopy top-down model [36]. Oxidative limitations to An and gs were accounted accordingly to Keenan [37] and Lombardozzi et al. [38,39,40] for drought and O3 stress, respectively. A detailed description of the formulation above mentioned was extensively described in Fares et al. [11] and in Conte et al. [41]. Gross primary productivity (GPP) was calculated by integrating the photosynthetic flux of each layer. Finally, Net Primary Productivity (NPP) was calculated as the difference between GPP and the autotrophic respiration (see Fares et al. [11] for details). Particulate Matter and NO2 fluxes calculation were extensively described in Conte [10] and in Fares [11,21].
In this study, the AIRTREE model was applied on the vegetation maps of the two cities described above. A model simulation was performed for each species in a pixel that was identified by the supervised classification. Biometric parameters, such as tree height (m), diameter at breast height (dbh), and canopy diameter (m) from the tree inventories, were used to define the tree structures while data regarding ecophysiological parameters, such as leaf area index (LAI) and carboxylation velocity (Vcmax), were retrieved from the literature and available from past field studies [10,11]. Phenology was calculated using the Phenological Maps extracted from NASA Visible Infrared Imaging Radiometer Suite (VIIRS) Global Land Surface Phenology (GLSP), with a daily temporal resolution, which was used to identify the beginning and end of the vegetation period. The meteorological and air quality data for each pixel were extracted from the modelled data (1 km spatial resolution maps in netCDF as stored on CRESCO and made available through VEG-GAP Information Platform and integrated in hourly datasets (1,004,679 and 21,390 pixels for Milan and Bologna, respectively).
The Radar Plots (Figure 1) were obtained from the AIRTREE outputs (expressed in g m2 y−1). In this case, the values obtained for the sequestration of each pollutant were cumulated according to Macrotype. Subsequently, the data were normalized for the maximum value.
The percent presence of each species in the pixel data was also cumulated to obtain occupancy maps (Figure 2). To get the total sequestration of CO2, O3, PM, and NO2 of each single pixel, results of each species were multiplied for their relative occupancy (squared kilometers in each pixel, Figure 3) and cumulated. Results were finally used to develop maps showing the spatial sequestration of CO2 and the deposition of PM10 pollutants.

3. Results and Discussion

3.1. Species-Specific Performances in Carbon and Pollutant Removal

Taking into consideration the list of species of Milano and Bologna, the different frequency of the various species was analyzed using the Pareto criterion (criterion 80/20) [42]. Table 3 and Table 4 show the 30 most abundant species in Milano and Bologna that are representing 80% of the variety of street trees and public parks in these two cities. The complete list of all species for both cities is shown in Table S1 (Milan) and Table S2 (Bologna) of the Supplementary File.
In total, the Municipality of Milan reports 264,558 individuals while that of Bologna is 66,216.
Table 3 and Table 4 present the average values (considering the whole year) of the sequestration of CO2 and pollutants (O3, PM10, PM2.5, NO2) for each species for both cities.
The tree family that seems to sequestrate the higher amount of CO2 in Milan, considering it is the most abundant species (Table 3), is the Platanus family with values of 1025.470 g CO2 m2 y−1. High sequestration values are also reached by Ulmus pumila and Quercus rubra with values of 1024.465 g CO2 m2 y−1 and 1023.284 g CO2 m2 y−1, respectively. Similar values were found by Fares et al. [21] when simulating ES for the Valentino urban park in the city center of Turin. Interestingly, while in Milan these species showed the highest carbon uptake capacity (Table 3), in Turin they were not even in the top three of the performance classes. This might be explained as different planting choices. While in urban parks, ornamental trees that can reach high canopies and LAI can represent the most occurring choice, this might not be true for a tree-lined row [43]. Platanus x acerifolia (also called “London Plane”), indeed, well tolerates cold and heat, and its high resistance to air pollution has contributed to its spread as a road tree [44]. This species can tolerate severe pruning compared to other street trees, though in the long term, this can result in wood decay and stability issues [45]. Interestingly, although scarcely used (only 772 individual censed in the city of Milan, representing only 0.3% of the total) (Table S1), Cupressus arizonica is one of the trees that shows the highest carbon sequestration (3272.828 g CO2 m2 y−1), followed immediately by Cedrus libani and atlantica (representing the 0.9% of the total with 2831.016 g CO2 m2 y−1 of average sequestration) and Taxodium (representing the 0.1% of the total trees with 2565.978 g CO2 m2 y−1 sequestration). These results are consistent with those seen in the Valentino urban park in the city of Turin [21], and the values for Cupressus are in the same order of magnitude of González-Cásares et al. [46]. In Bologna, on the other hand, the highest carbon uptake when considering the most abundant species (Table 4) was provided by Cedrus atlantica and deodara with values of 2581.468 g CO2 m2 y−1 and 2594.612 g CO2 m2 y−1, respectively. Similar values were found by Fares et al. [21] for Cedrus deodara, thus suggesting that this species is particularly suitable for CO2 sequestration because it can reach a high dimension and LAI, sequestrating carbon almost all year long.
Surprisingly, Celtis australis, between the top two most frequent trees in both cities (together with Platanus x acerifolia), showed poor capacity to sequestrate CO2 when compared to Platanus x acerifolia (about half), probably due to the lower dimension of the canopy and LAI (one of the most important parameters for the AIRTREE model) [11]. Although Celtis is generally used successfully in street trees and city parks for its resistance to urban pollution and for the dense shading canopy [43], our estimates suggest that other species could be more indicated for the urban environment [44,45]. Indeed, although among the least used tree in Bologna (Table S2), the tree that provides the higher carbon uptake (3938.288 g CO2 m2 y−1) is also a cypress, in particular Cupressus lutisanica, which is indeed large (so called “monumental tree”) but is present in only three individuals in the whole city.
In this work, we have focused our attention on PM since the latter is the pollutant regulated by European legislation (UNI EN12341/2014) with the greatest health concerns. Particularly worrying is the fact that in 2015, the limit for annual average concentration of PM10 (equal to 40 µg/m3) was exceeded in Milan (an average of 42 µg/m3). Moreover, from 25 November to 30 December, the average daily PM10 concentrations remained constantly above 50 µg/m3 for a total of 36 consecutive days of the year 2015, on which the legal limit for daily average concentration was exceeded. The exceedances of the limits in 2015 is related to the strong and prolonged atmospheric stability and low rainfall in the winter season, particularly in the last months of the year, but certainly also to intensive traffic. (https://www.arpalombardia.it/ (accessed on26/01/2022)). Bologna, on the other hand, exceeded this limit for an average of measuring stations of about 20 days in 2015. (https://www.arpae.it/ (accessed on 26/01/2022)).
Focusing on sequestration of particles (PM10 in particular), species-specific values remain homogeneous among the most present species in the city of Milan (Table 3) with an average of 2.164 g PM10 m2 y−1, with peaks of sequestration by species with large canopies, such as Platanus (2.921 g PM10 m2 y−1). Regarding the most present species in the city of Bologna (Table 4), however, the PM10 and PM2,5 sequestration peaks relate to species like Cedrus deodara, Cedrus atlantica, and Cupressus sempervirens. These trees are examples of large, evergreen trees with dense needle foliage, well maintained and often occurring in historic villas, which explains the high sequestration of PM and other pollutants (Table 4).
The highest performance in PM10 sequestration was observed for Evergreen trees (Tables S1 and S2) in both Milan and Bologna. In Milano (Table S1), the highest performance was showed by Cedrus libani (31.060 g PM10 m2 y−1), Pinus jeffreyi (27.318 g PM10 m2 y−1), and Taxodium distichum (27.305 g PM10 m2 y−1). In Bologna (Table S2), the highest performance is from Taxodium distichum (14.536 g PM10 m2 y−1) and Cupressus lusitanica (12.865 g PM10 m2 y−1). This is because these trees have large and dense canopies (high values of LAI) with a needle leaf previously described as suitable vegetated surfaces for particulate sequestration [47,48,49,50,51]. Our results are also in line with a study performed in the Italian city of Florence with a climate (Cfb) near the one of Bologna (Cfa) by Bottalico et al. [52].
After PM, O3 is the air pollutant that, due to its toxicity and the concentration levels that can be reached, has the greatest impact on human health. Italian Legislative Decree 155/2010 defines an information threshold (180 µg/m3) and an alert threshold (240 µg/m3) for O3 for the protection of human health. Milan and Bologna both exceed the alert threshold for the year 2015 for more than 25 days. (https://www.arpae.it/ (accessed on 26 January 2022); https://www.arpalombardia.it/ (accessed on 26 January 2022)). As seen above, 2015 was a particularly warm year. The strong sunlight favors the photochemical reactions that generate O3. For this reason, this pollutant is particularly critical during the summer period, especially during the hottest hours of the day, or it occurs massively throughout the year if temperatures remain higher in winter. The criticality of O3 is therefore closely linked to the meteorology that characterizes each year [53].
O3 is also very evenly sequestered by trees. Platanus x acerifolia and Populus nigra take the lead in O3 sequestration in both cities when considering the most frequent species (Table 3 and Table 4) [54].
Looking instead at the less frequent species, it is very interesting to see how in Bologna (Table S2), deciduous broadleaf sequester the most O3 (1.459 g m2 y−1), followed then by Evergreen Needleleaf, and finally Evergreen Broadleaf. Cupressus lusitanica (1.692 g m2 y−1) and Taxodium distichum (1.461 g m2 y−1), however, show a high O3 sequestration capacity, but this is always attributable to the size of these trees (i.e., large and dense canopies with high LAI). In general, the data on the Deciduous Broadleaf is well explained by the AIRTREE model formalism: dry deposition is driven by stomata, and therefore, the same species that have a high capacity to sequester CO2 (with high stomatal conductance) also tend to have a higher stomatal deposition. It is also interesting to note that some tree species are sensitive to O3 exposure. In particular, accounting for O3 stress in AIRTREE formalisms led to a mismatch between O3 and carbon sequestration for ozone-sensitive species. A typical example is the genus Populus, which has a high sequestration of O3 (P. deltoides is 1.010 g m2 y−1 in Milan and P. nigra is 1.211 g m2 y−1 in Bologna), but a low sequestration of CO2 (808.820 g m2 y−1 in Milan and 862.381 g m2 y−1 in Bologna, respectively). Other trees showing the same behavior are among conifers, Pinus and Abies, while other broadleaf trees are Acer, Cercis, Fraxinus, Platanus, Quercus, and Fagus. All these species are in fact sensitive to O3, and the damage they receive from it affects their ability to sequester CO2 [55]. For example, Pinus has an average of 0.803 g m2 y−1 of sequestrated O3 and an average of 989.325 g m2 y−1 of sequestrated CO2 in Milan and an average of 0.986 g m2 y−1 for O3 and 1081.858 g m2 y−1 for CO2 in Bologna. Regarding the broadleaf, the same evidence can be found in Cercis, which has an average of 0.627 g m2 y−1 of sequestered O3 and 272.766 g m2 y−1 of sequestered CO2 in Milan and 0.787 g m2 y−1 for O3 and 223.370 g m2 y−1 for CO2 in Bologna.
As regards NO2, Legislative Decree 155/2010 sets an hourly limit value (200 µg/m3 not to be exceeded more than 18 times in a year) and an annual limit value (40 µg/m3) for the protection of human health. In Bologna, the annual limit value is exceeded, but not the hourly limit value, while in Milan both were exceeded. (https://www.arpae.it/ (accessed on 26 January 2022); https://www.arpalombardia.it/ (accessed on 26 January 2022)).
NO2 sequestration by urban vegetation is homogeneous in both cities. This is probably because most of the trees are Deciduous Broadleaf. As such, these trees have a broadleaf, hence a greater stomatal density and cuticle thickness and consequently a greater capacity to absorb pollutants in a gaseous state when compared with a needleleaf [53].
On average, we found that, in Milan, the evergreen seems to be the most indicated species in sequestration of PM (mean of 15.9 g m2 y−1) and even for gases whose deposition is affected by plants stomata (O3 mean of 1.06 g m2 y−1; CO2 mean of 1.5 g m2 y−1; NO2 mean of 0.46 g m2 y−1). Conversely, in Bologna the pollutant sequestration of O3 and NO2 between conifers and broadleaf trees is roughly equal. This implies that, in light of species selection for a new forest plantation, the choice of the tree may go towards needleleaf trees, but attention should be paid to the emission of Biogenic Volatile Organic Compounds (BVOCs), which are emitted in particular by needleleaf trees and may cause local episodes of pollution [30].

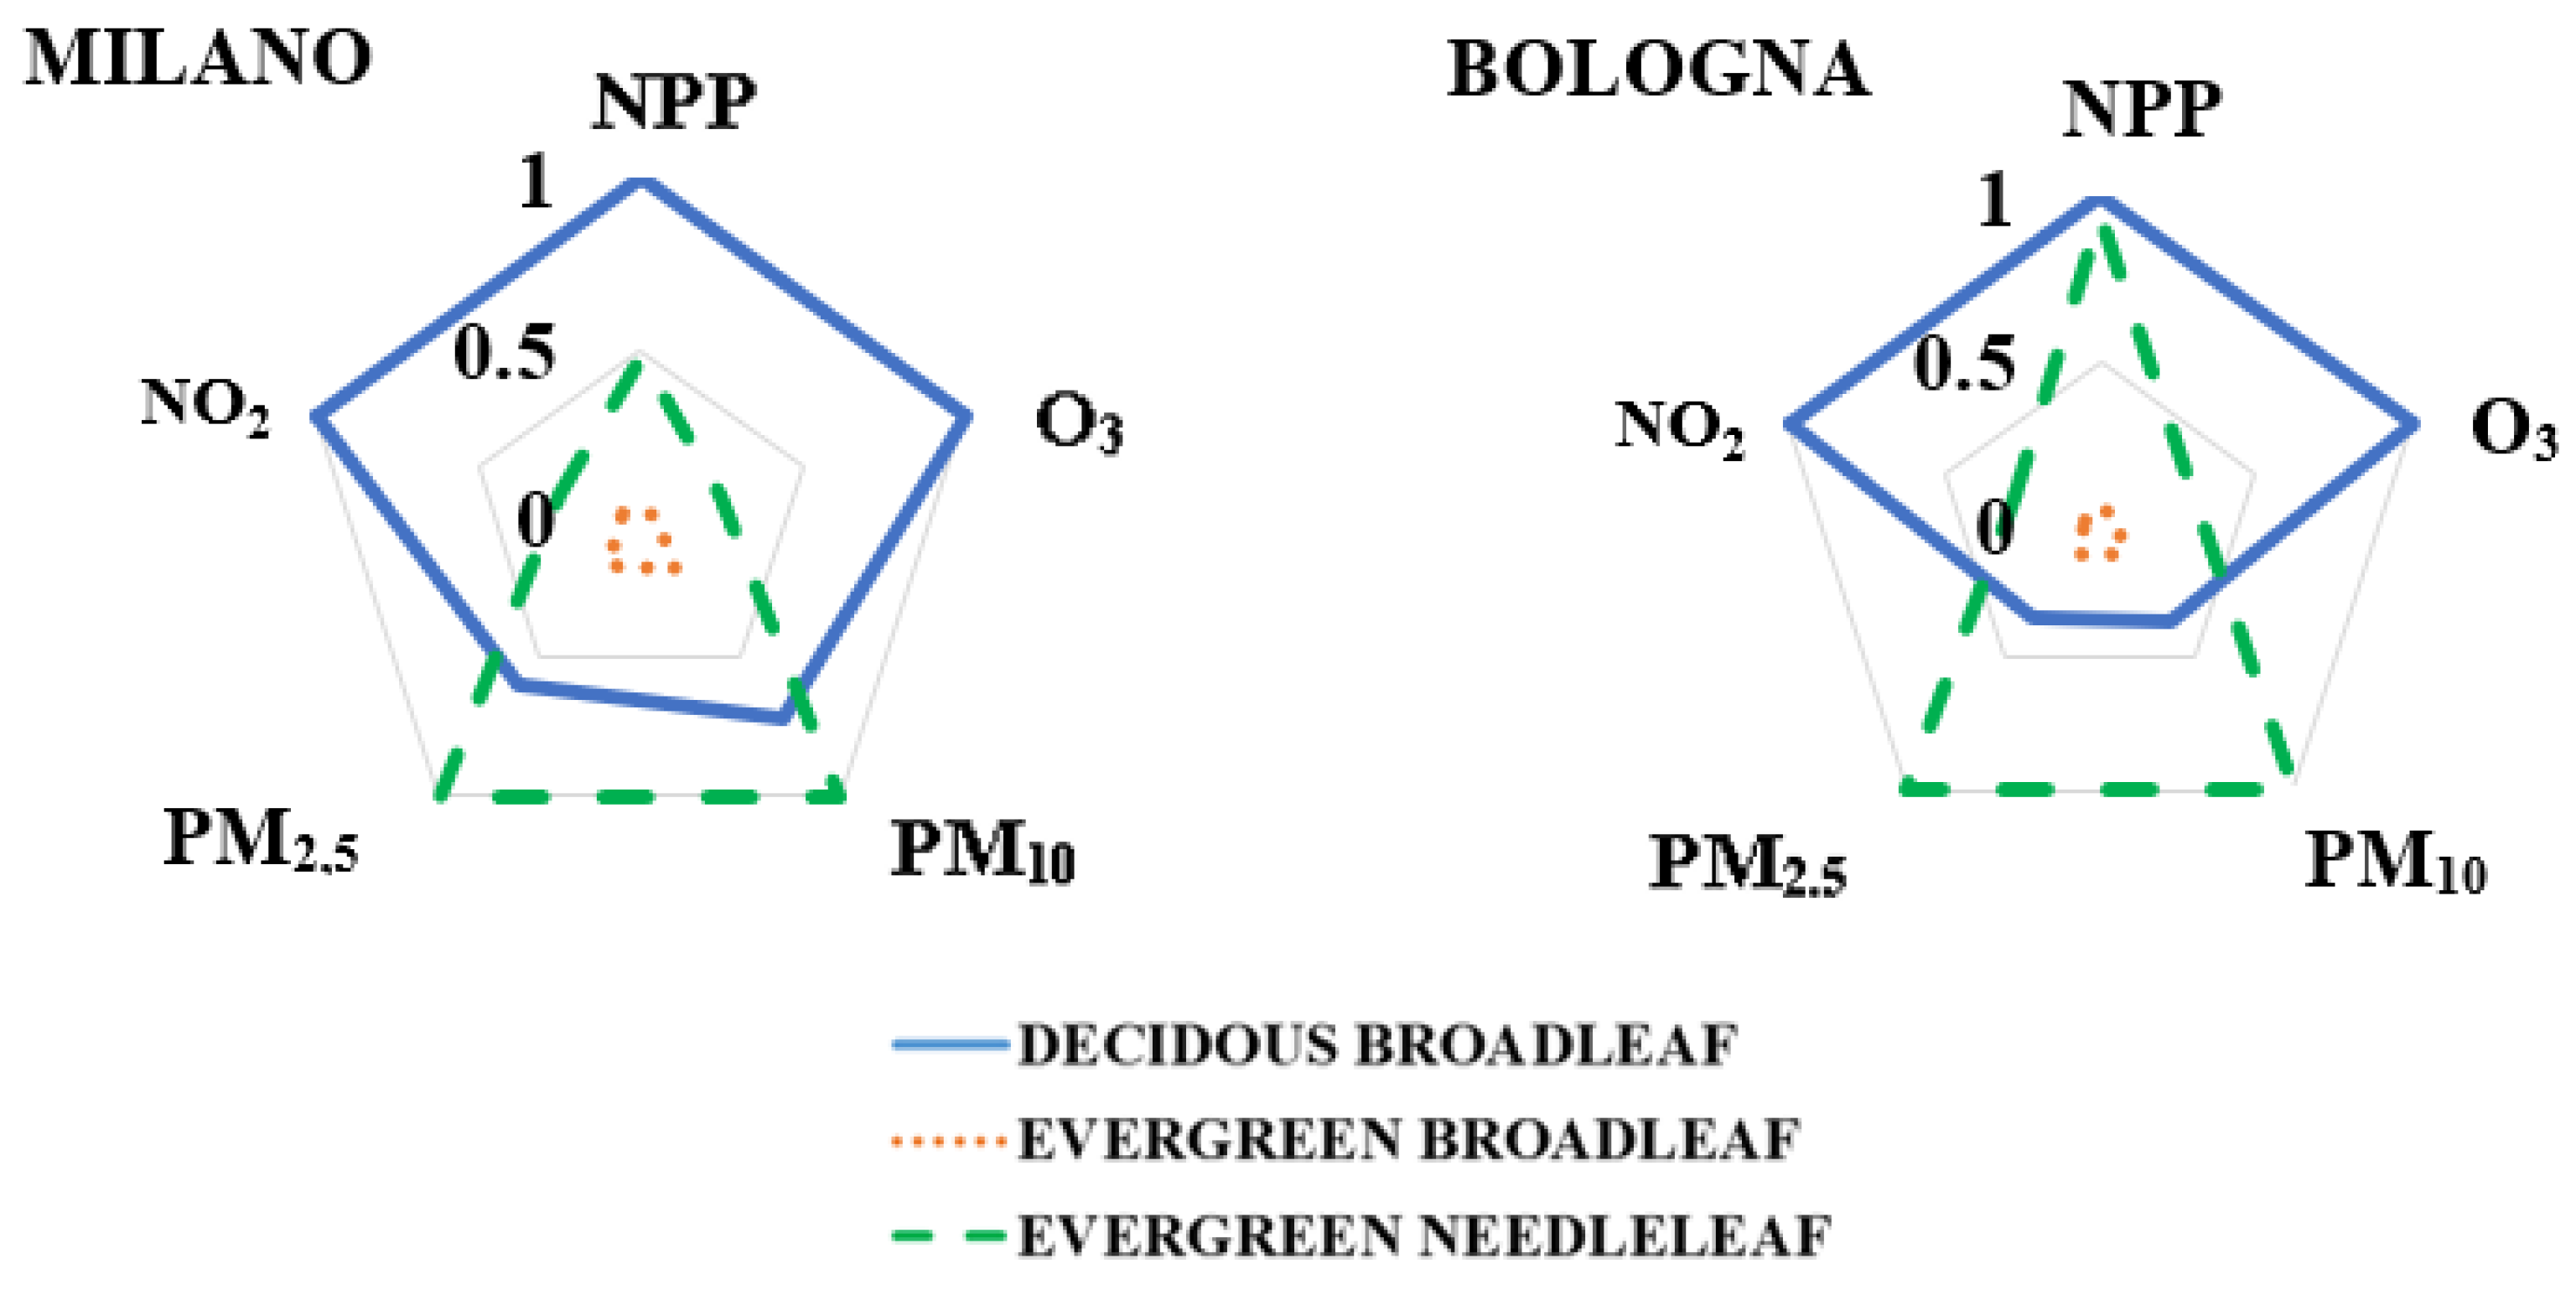
3.2. Differences in Pollutant Sequestration Depending on Macrotype

The radar graphs (Figure 1) show the normalized overall sequestration of pollutants by each macrotype in the two cities. Regarding the relative abundance of the various macrotypes, the reference is the list provided by the municipalities, excluding the species that AIRTREE does not have in its inventory. The most present macrotype is Deciduous Broadleaf (240,965 and 59,489 individuals in Milan and Bologna, respectively), followed by Evergreen Needleleaf (15,059 and 5343 in Milan and Bologna, respectively), and finally Evergreen Broadleaf (4263 and 1189 in Milan and Bologna, respectively).
The ability of plants to reduce pollutants depends on the deposition rate and the pollutant capture efficiency, which are species-specific parameters [51]. For example, a high sequestration of gaseous pollutants is provided by trees with large leaves, as the greater the number of stomata, the greater the potential to absorb gaseous pollutants [51]. For this reason, in both cities, the evergreen needleleaf trees display a reduced capacity for CO2 sequestration (0.483 and 0.946 in Milan and Bologna, respectively), and this numerical difference could be due to the relative abundance of conifers, the latter previously described as a poor CO2 sequestration capacity [56]. On the other side, our results confirm previous findings showing that conifers are more efficient at intercepting particulate matter than broadleaf trees due to their greater leaf area and structural complexity [57]. We found that conifers have a very high sequestration capacity for dust (PM10 and PM2.5) and a low impact on sequestration capacity for NO2 (0.250 in Milan and 0.274 in Bologna) and O3 (0.241 in Milan and 0.299 in Bologna).
Vice versa, broadleaf trees recorded the maximum sequestration for NO2, O3, and CO2, although in Milan they alre also efficient to sequestrate PM10 (0.717).
Evergreen broadleaf trees behave very similarly in both municipalities and, because of their limited abundance in both cities, their contribution on overall sequestration was negligible.
Figure 1. Radar Plot showing the sum performance of the different macrotype in sequestrating pollutants in the city of Milano and Bologna. The values (expressed in g m2 y−1 for O3, NO2 and particulate matter; and g CO2 m2 y−1 for NPP) were normalized for the maximum value. The maximum values (which equals 1 in the normalization) are for NPP: 3953 kg m2 y−1; O3 5677 g m2 y−1; PM10: 20,491 g m2 y−1; PM2.5: 3261 g m2 y−1; NO2: 2358 g m2 y−1.
Atmosphere 14 00285 g001

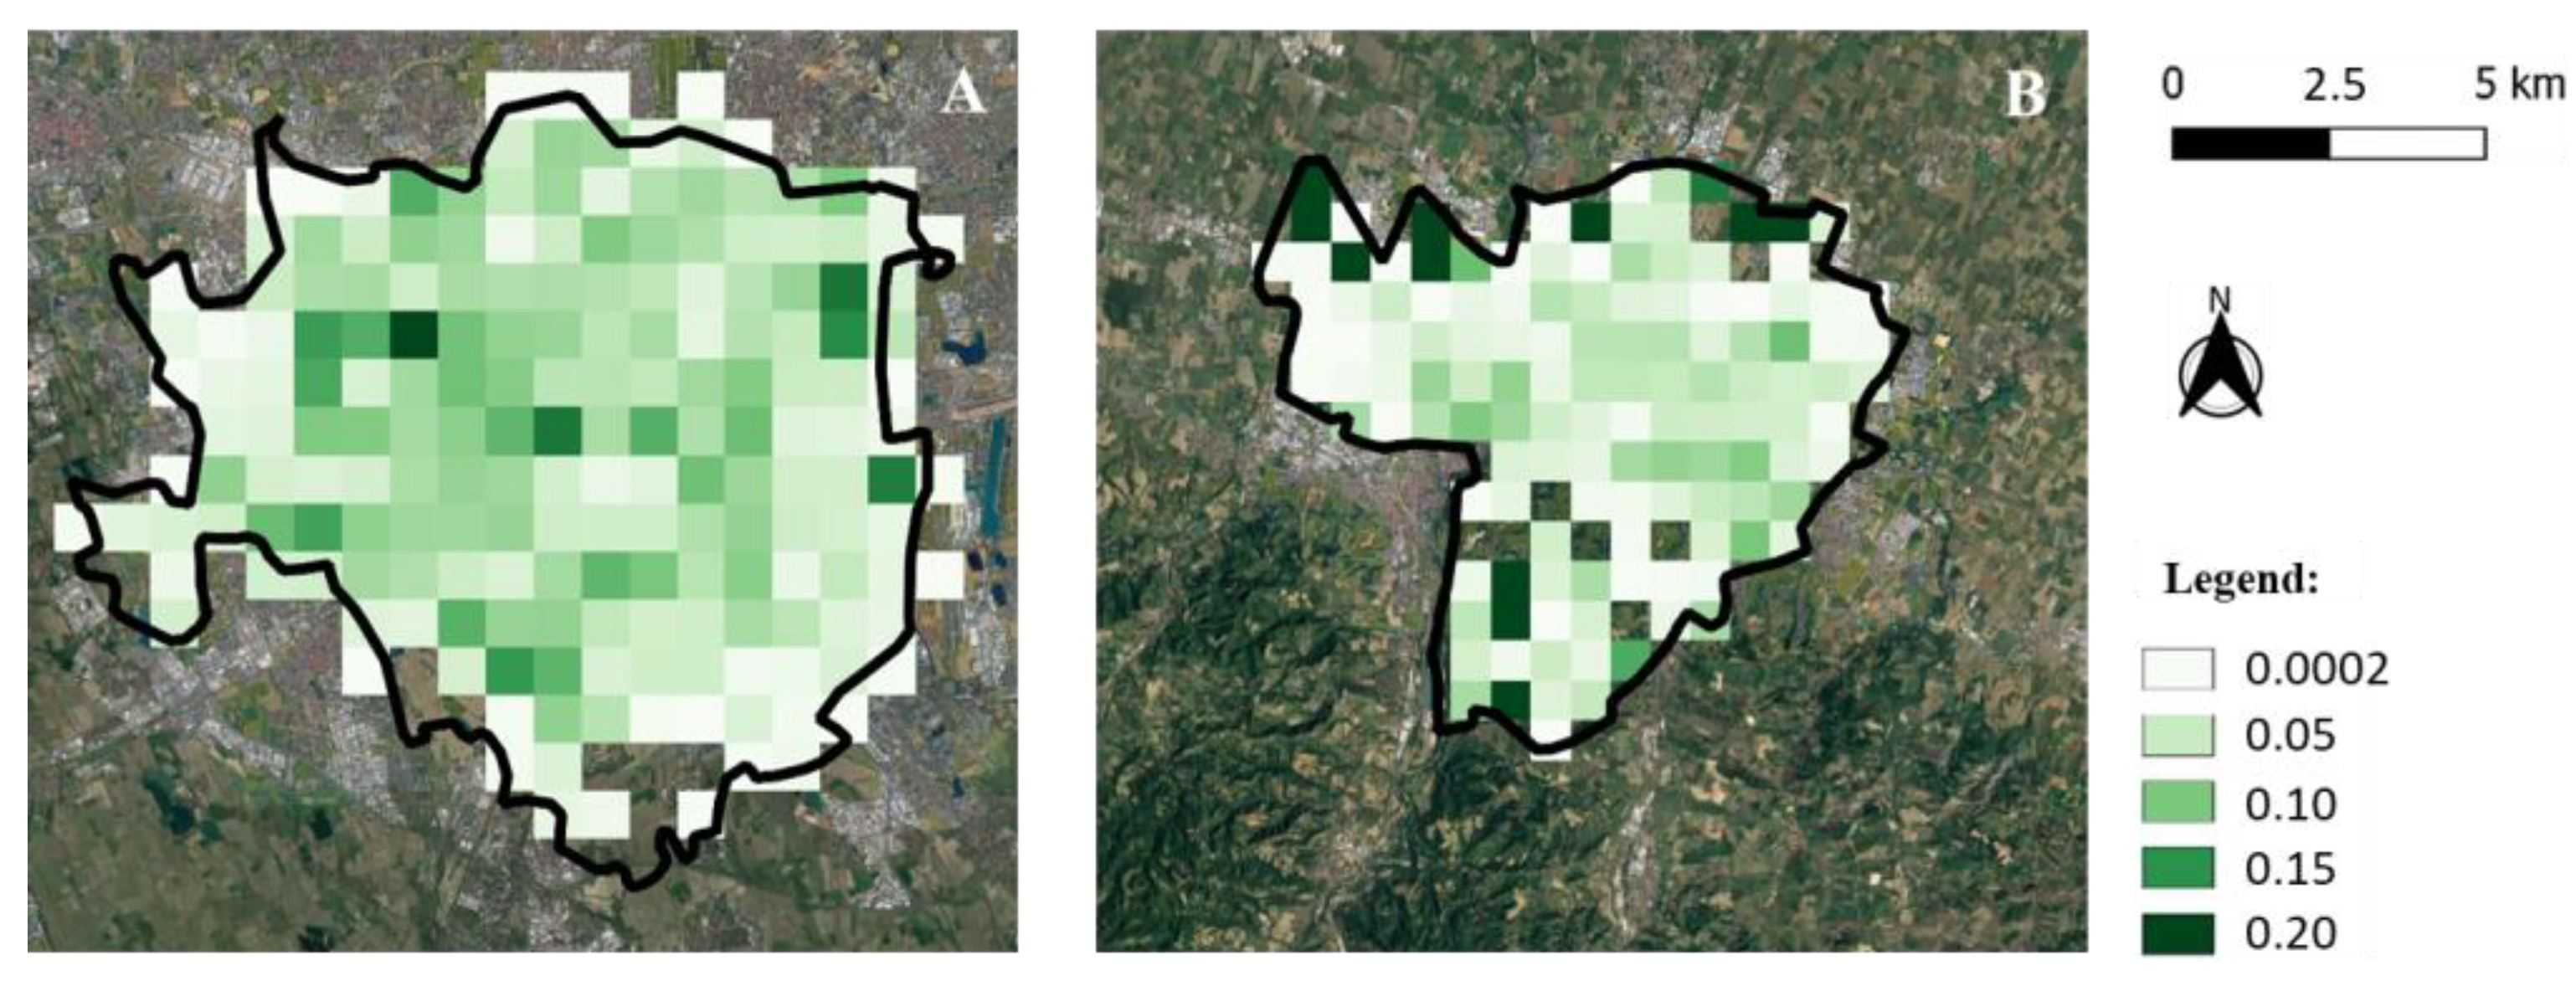
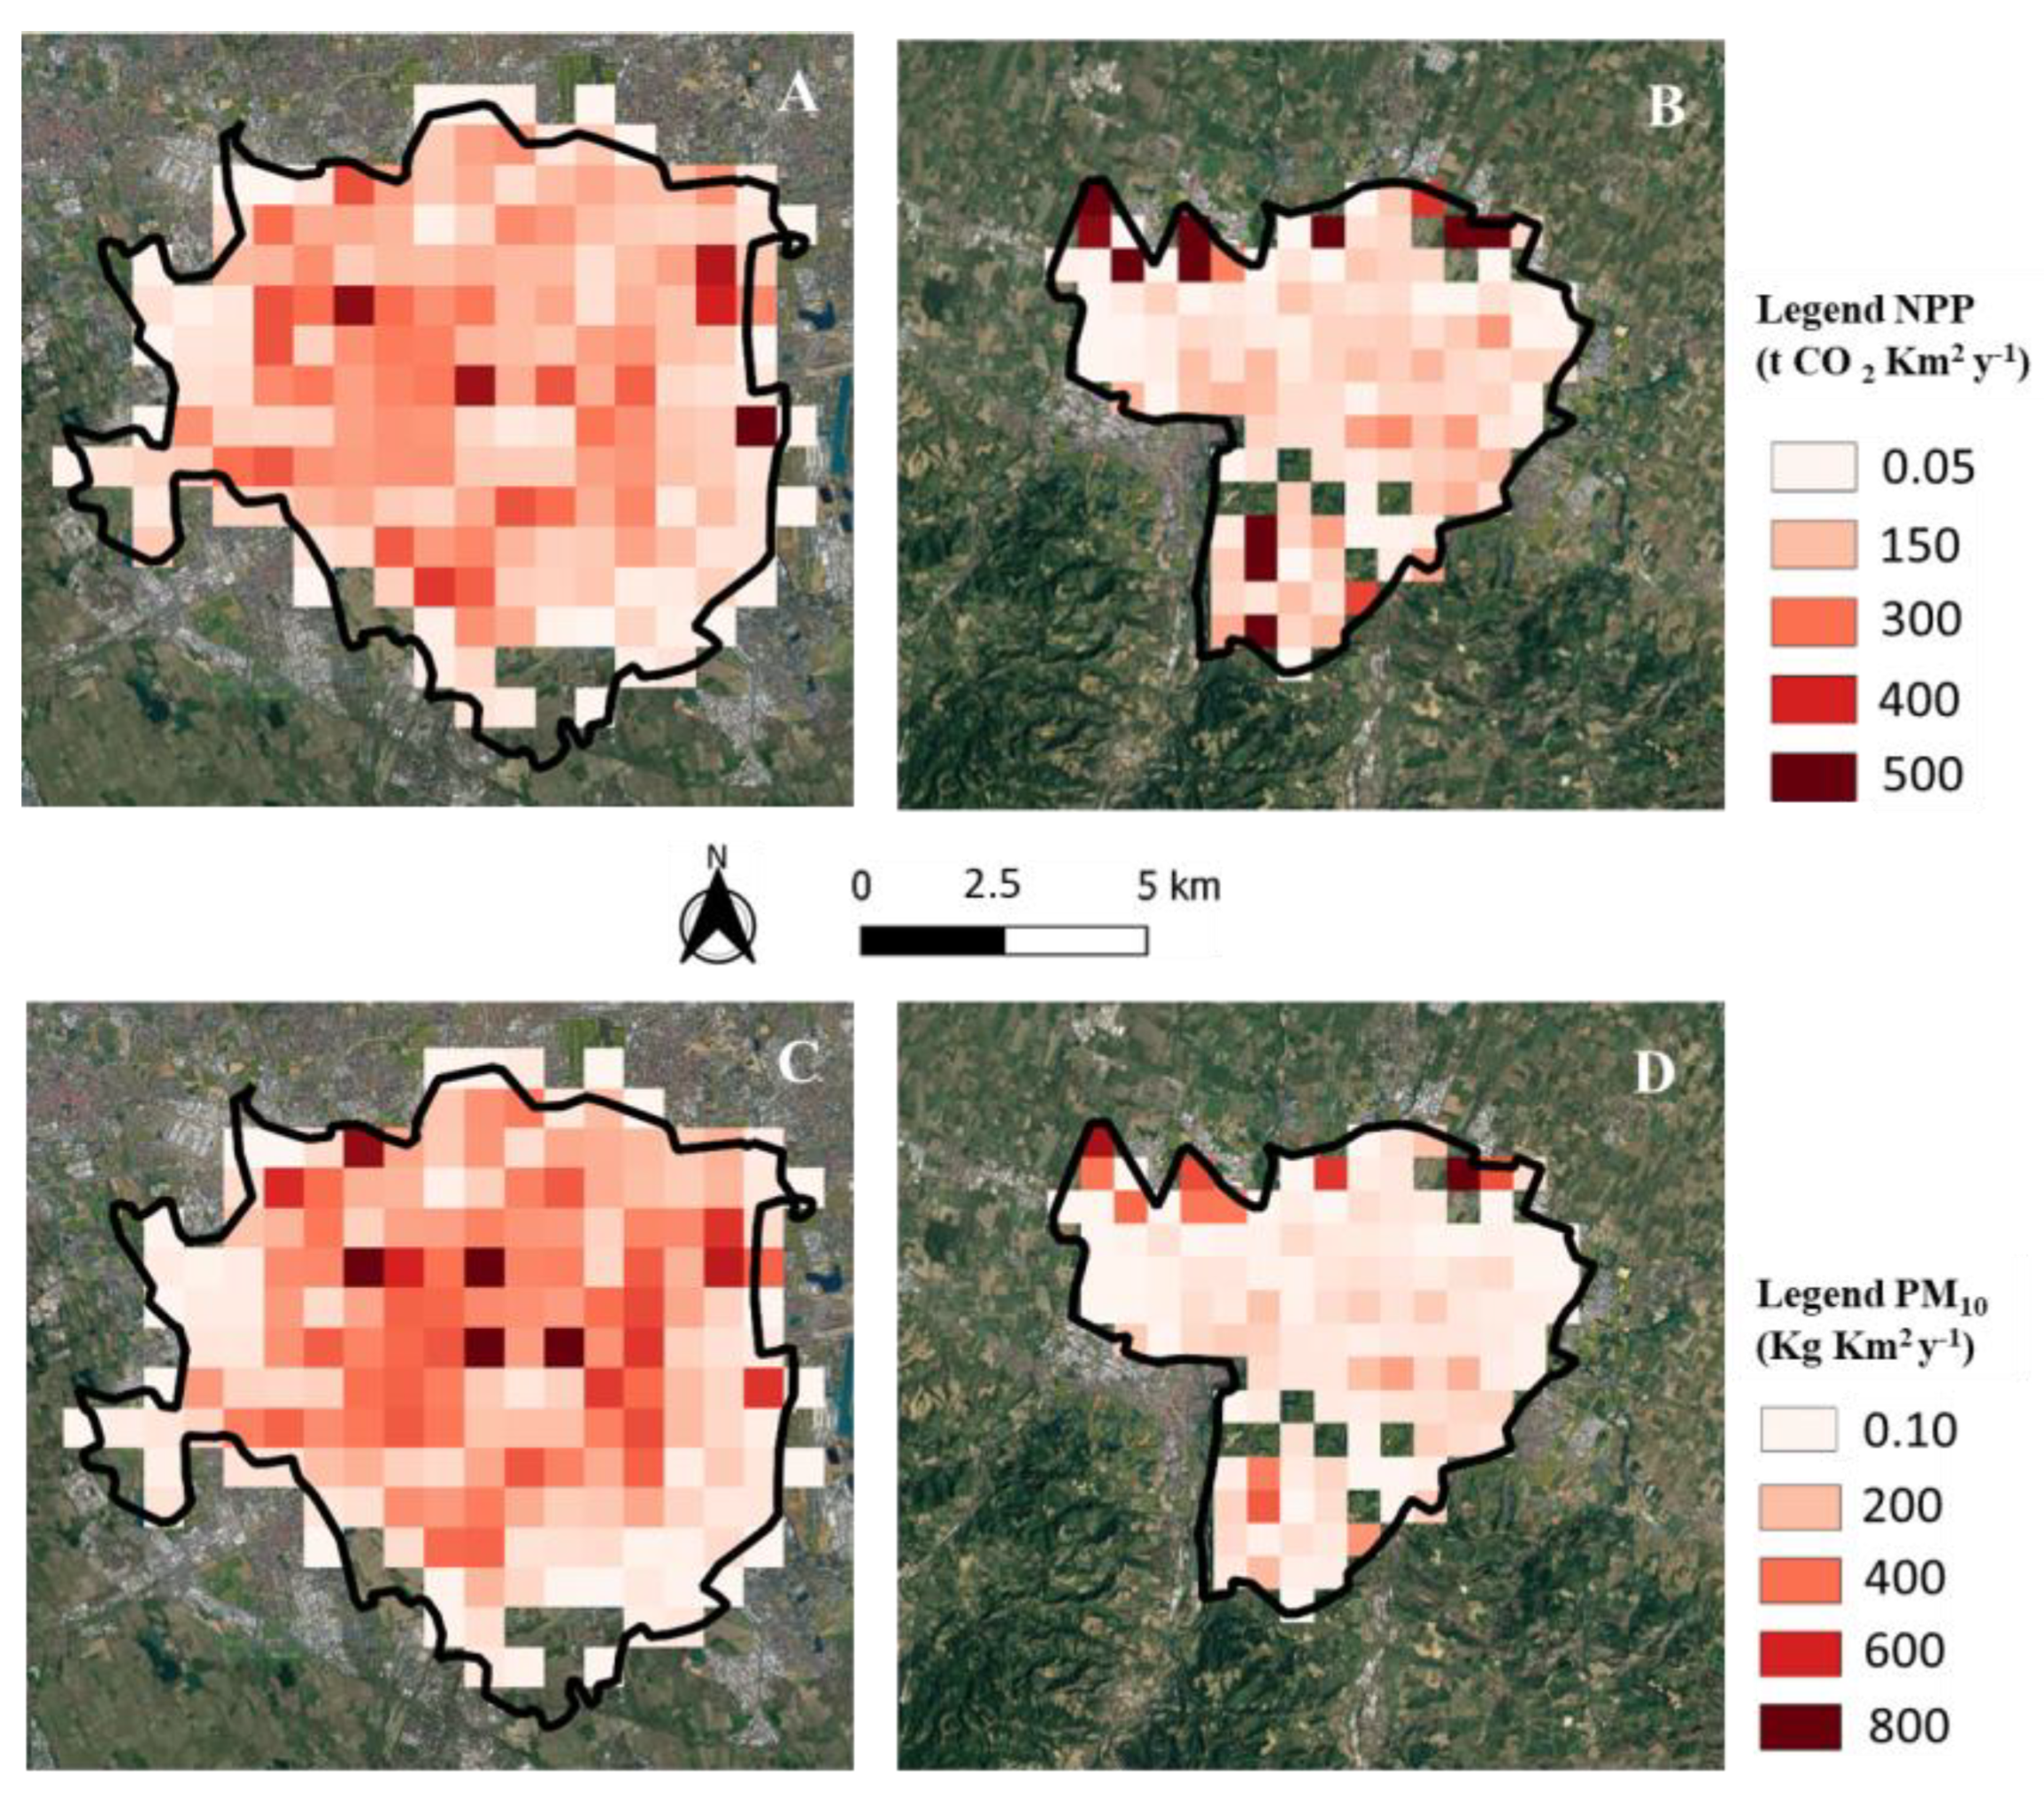
3.3. Sequestration of Carbon Dioxide and Particulate Matter at the Municipality Scale

The generation of georeferenced maps allowed us to make important considerations about city pollution and the distribution of trees in the city. Figure 2A,B shows the percent fraction of the city occupied by trees (1 km resolution) and their distribution over the city. In addition, in Tables S3 and S4 of the Supplementary Files, the list of species present in each pixel can be consulted.
Figure 2. (A,B): Fraction of tree occupancy per square kilometer in the city of Milan (A) and in the city of Bologna (B) for the year 2015. Each pixel is the size of a square kilometer. In the legend, the fraction of green goes from the lightest color (less presence of green) to the darkest color (more presence of green).
Atmosphere 14 00285 g002
Concerning Milan, it can be noted how the distribution of green spaces is homogeneous towards the city center (this is also due to the large parks of the city where there is up to 20% green coverage in a single pixel) while in the suburbs (with a green coverage of only 0.02%), less treed areas are due to agricultural fields (Milan boasts a significant agricultural territory) or industrial zones. In the case of Bologna, on the other hand, vegetation is homogeneous in the city center (remaining around a percentage of green presence between 10% and 15%) but abundant in the suburban areas surrounding the city.
As for Milan, for the estimation and updating of the regional inventory of atmospheric emissions, the INventario EMissioni Aria (IN.EM.AR) system has been used for years. The IN.EM.AR was developed under the Regional Air Quality Plan (PRQA) and managed since 2003 by the U.O. “Atmospheric Modeling and Inventories of ARPA Lombardia.” (https://www.arpalombardia.it/ (accessed on 26 January 2022)), and it is useful to chart the pollution levels of all pollutants in the city’s ai year by year.
Due to the higher-than-normal summer temperatures in 2015, there was a large accumulation of PM in Milan during that period. The strong solar radiation and the greenhouse effect due to the status of an urban metropolis also facilitated the formation of O3 [58]. The winter, as usual, favored the use of heaters and cars and thus an increase in CO2 and NO2 emissions (https://www.arpalombardia.it/ (accessed on 26 January 2022)).
As far as Bologna is concerned, according to ARPA data (https://www.arpae.it/ (accessed on 26 January 2022)), the year 2015 was characterized by an overall worsening of air quality compared to the previous year. This worsening is said to be attributable to the marked differences between the meteorological conditions that occurred in the two years, with more frequent situations favorable to the accumulation of particulate material in autumn/winter 2015 and more days characterized by good weather, ideal for the formation of O3 in summer 2015 [59].
ARPA Emilia Romagna also adopts the INEMAR inventory, the two emission inventories were therefore constructed applying the same methodology.
In Bologna, moreover, the winter–fall seasons of 2015 had 68% of days particularly favorable to the accumulation of atmospheric particulate matter and was, therefore, a year with particularly critical weather conditions (high percentage of days without rain and poor ventilation, high use of heating and cars) while in the period April-September, the percentage of days with maximum temperatures above 29 °C was over 35%, conditions that promote O3 formation.
The average background concentration of PM and O3 in the city of Bologna depends, in part, on the large-scale pollution typical of the Po Valley [60]. On a more local scale, road traffic and non-industrial combustion (heating) are the main sources of emissions related to direct dust pollution (PM10 and PM2.5), followed by the transport of other mobile sources (e.g., aircraft) and industry. Nitrogen oxides (NOx), which are also an important precursor to the formation of secondary particulate matter and O3, are contributed by road transport and other mobile sources, as well as combustion in industry and energy production (11% and 9%, respectively). In contrast, 32% of CO2 is produced by road transport, both light and heavy (https://www.arpae.it/ (accessed on 26 January 2022)).
Figure 3A–D shows the CO2 and PM10 sequestrations in the two cities. In particular, Figure 3A,B show the NPP (t CO2 km2) of Milan and Bologna, respectively, during the year 2015. Figure 3C,D show the PM10 (kg km2) during the same year.
In line with tree coverage, PM deposition and CO2 sequestration is highest in the center of Milan (reaching values as high as 800 Kg PM10 Km2 y−1 and 500 t CO2 Km2 y−1), which may be justified by the presence of urban parks in those areas but also by the higher emissions in winter for combustion processes [61].
Figure 3. (AD): CO2 and PM10 sequestrations in the two Municipalities of Milano and Bologna. (A) shows Milan’s NPP expressed in tonnes of CO2 captured per pixel (per square kilometer) during the year 2015. (B) shows the same but for Bologna. The legend of the numerical values can be consulted alongside these two figures. (C) shows instead the PM10 particulate sequestration per pixel (per square kilometer) during the year 2015. (D) shows the same for Bologna. The legend of the numerical values can be consulted alongside these two figures.
Atmosphere 14 00285 g003
Assuming an average vehicle circulation of 10,000 Km y−1 and an emission of CO2 of 108.6 g y−1, we estimate that trees in Milan are able to sequester the CO2 emission of 460 vehicles per year (0.06% of the car fleet circulating in Milan in one year). For PM, on the other hand, assuming an emission of 0.005 g y−1, we estimate that trees in Milan abate the emissions of 16,000 vehicles per year (2.28% of the car fleet circulating in Milan in one year).
In Bologna, we observed an almost opposite trend, with PM deposition and NPP higher in the treed suburban areas (700 Kg PM10 Km2 y−1 and 550 t CO2 Km2 y−1) than in the city center (around 10 Kg PM10 Km2 y−1 and 150 t CO2 Km2 y−1). This effect is due to the highly concentrated peri-urban greenery on the borders of this municipality.

4. Conclusions

Throughout Europe, the Mediterranean region is facing many challenges, some of which can be addressed by nature-based solutions, such as urban forests and green spaces. However, there is still a poor amount of literature concerning detailed studies on tree composition and ES delivery in Mediterranean countries [62], with research more related to peri-urban forests [63,64] or parks in the city and few works related to the beneficial action of street trees and the effect of general greenery in the city [65]. People’s health and well-being are closely linked to the state of the environment [3]. A good quality natural environment meets basic needs for clean air, especially in cities where sources of pollution are abundant [66].
In the past, most of the urban green areas were designed and created for social and economic purposes, but it is very important to also take into consideration the environmental benefits that these green lungs can bring to city contexts. Knowledge of ES is essential, especially in the planning stages, to justify a choice and a consequent investment, which generally falls on public accounts. For example, carbon sequestration is very important because urban green area managers are considering whether tree planting projects in urban areas can be financed through the carbon market, especially since it is now an internationally accredited market. To this end, such an environmental challenge does not only concern individual cities, but is reflected on a larger scale, as stressed in the European Green Deal of the EU committed to plant 3 billion trees by 2030. This will increase forest area and tree cover in the EU, improve the resilience of forests and their role in reversing biodiversity loss, and mitigate and help adapt to climate change [67,68] (https://unfccc.int/ (accessed on 26 January 2022)).
These trees could also be planted in urban or peri-urban forests, and even if urban and peri-urban forests represent a very minor quota of available forests to mitigate climate changes, at the same time, they are close to the sources of city pollution and can therefore mitigate the effect of polluting emissions [69].
Above all, species and species associations must be chosen consistently and carefully to maximize ecosystem services and minimize disservices. With our study, we shed light on important ecosystem services provided by urban trees. In this study we have quantified some of the ES produced by the species present on urban parks and side roads, highlighting differences in their performances based on their biometric characteristics and eco-physiological properties. However, careful attention should be paid while selecting new species to plant in urban areas, since some of these species emit BVOCs, which were previously described as an ecosystem disservice when they are blended in the atmosphere with precursors like NOx to form O3 and aerosols [30].
Modifying future tree planting to favor lower-emitting species can further support a municipality in abating atmospheric pollutants. On this end, research is being addressed to evaluate the potential negative impact of biogenic emissions in our target cities. One tool to help in this is the VEG-GAP portal (https://www.lifeveggap.eu/ (accessed on 26 January 2022)), an information platform that evaluates the multiple services provided by plant ecosystems in an integrated manner through multi-scale and multi-pollutant approaches that resemble the real world as closely as possible.

5. Sitography (Accessed on 26 January 2022)

Supplementary Materials

The following supporting information can be downloaded at: https://www.mdpi.com/article/10.3390/atmos14020285/s1, Table S1: complete list of all species for the city of Milan; Table S2: complete list of all species for the city of Bologna; Table S3: list of species present in each pixel in the city of Milan; Table S4: list of species present in each pixel in the city of Bologna.

Author Contributions

Conceptualization, I.Z., A.C. and S.F. (Fares Silvano); methodology, I.Z., A.C., A.A. and S.F. (Fares Silvano); investigation, I.Z., S.F. (Fares Silvano) and A.C.; data curation, all authors; writing original draft preparation, all authors; supervision, S.F. (Fares Silvano) and A.C.; funding acquisition, S.F. (Fares Silvano). All authors have read and agreed to the published version of the manuscript.

Funding

The research was made possible thanks to the data from UE LIFE (LIFE18 PRE IT 003) VEG-GAP “Vegetation for Urban Green Air Quality Plans”, the project funded by the Ministry of Research n. 20173RRN2S_001; Regione Lazio: project n. 36388 TECNOVERDE: “Tecnologie geomatiche e ambientali di precisione per il monitoraggio e la valorizzazione dei servizi ecosistemici delle infra-strutture verdi urbane e peri-urbane”; 2021 @CNR project BIOCITY “Riforestazione urbana: nuovi strumenti conoscitivi e di supporto decisionale”; PRIN2020-MULTIFOR “Multiscale observations to predict Forest response to pollution and climate change”; Project “National Biodiversity Future Center—NBFC” (code CN_00000033), funded by the Italian Ministry of University and Research.

Informed Consent Statement

Informed consent was obtained from all subjects involved in the study.

Data Availability Statement

Not applicable.

Conflicts of Interest

The authors declare no conflict of interest.

References

  1. Lovasi, G.S.; Quinn, J.W.; Neckerman, K.M.; Perzanowski, M.S.; Rundle, A. Children living in areas with more street trees have lower prevalence of asthma. J. Epidemiol. Community Health 2008, 62, 647–649. [Google Scholar] [CrossRef] [PubMed] [Green Version]
  2. Lelieveld, J.; Evans, J.S.; Fnais, M.; Giannadaki, D.; Pozzer, A. The contribution of outdoor air pollution sources to premature mortality on a global scale. Nature 2015, 525, 367–371. [Google Scholar] [CrossRef] [PubMed]
  3. EEA. Air Quality in Europe. European Environment Agency. 2019. Available online: https://www.eea.europa.eu/publications/air-quality-ineurope-2019 (accessed on 26 January 2022).
  4. Psistaki, K.; Achilleos, S.; Middleton, N.; Paschalidou, A.K. Exploring the Impact of Particulate Matter on Mortality in Coastal Mediterranean Environments. Sci. Total Environ. 2023, 865, 161147. [Google Scholar] [CrossRef] [PubMed]
  5. Bolund, P.; Hunhammar, S. Ecosystem services in urban areas. Ecol. Econ. 1999, 29, 293–301. [Google Scholar] [CrossRef]
  6. Elmqvist, T.; Setälä, H.; Handel, S.N.; Van Der Ploeg, S.; Aronson, J.; Blignaut, J.N.; Gomez-Baggethun, E.; Nowak, D.J.; Kronenberg, J.; De Groot, R. Benefits of restoring ecosystem services in urban areas. Curr. Opin. Environ. Sustain. 2015, 14, 101–108. [Google Scholar] [CrossRef] [Green Version]
  7. Grote, R.; Samson, R.; Alonso, R.; Amorim, J.H.; Cariñanos, P.; Churkina, G.; Fares, S.; Le Thiec, D.; Niinemets, Ü.; Mikkelsen, T.N.; et al. Functional traits of urban trees: Air pollution mitigation potential. Front. Ecol. Environ. 2016, 14, 543–550. [Google Scholar] [CrossRef]
  8. Samson, R.; Ningal, T.F.; Tiwary, A.; Grote, R.; Fares, S.; Saaroni, H.; Hiemstra, J.A.; Zhiyanski, M.; Vilhar, U.; Cariñanos, P.; et al. Species-Specific Information for Enhancing Ecosystem Services. In The Urban Forest: Cultivating Green Infrastructure for People and the Environment; Pearlmutter, D., Calfapietra, C., Samson, R., O’Brien, L., Ostoić, S.K., Sanesi, G., del Amo, R.A., Eds.; Springer International Publishing: Cham, Switzerland, 2017; pp. 111–144. [Google Scholar] [CrossRef]
  9. Bodnaruk, E.W.; Kroll, C.N.; Yang, Y.; Hirabayashi, S.; Nowak, D.J.; Endreny, T.A. Where to plant urban trees? A spatially explicit methodology to explore ecosystem service tradeoffs. Landsc. Urban Plan. 2017, 157, 457–467. [Google Scholar] [CrossRef] [Green Version]
  10. Conte, A.; Zappitelli, I.; Fusaro, L.; Alivernini, A.; Moretti, V.; Sorgi, T.; Recanatesi, F.; Fares, S. Significant Loss of Ecosystem Services by Environmental Changes in the Mediterranean Coastal Area. Forests 2022, 13, 689. [Google Scholar] [CrossRef]
  11. Fares, S.; Alivernini, A.; Conte, A.; Maggi, F. Ozone and particle fluxes in a Mediterranean forest predicted by the AIRTREE model. Sci. Total. Environ. 2019, 682, 494–504. [Google Scholar] [CrossRef]
  12. Calfapietra, C.; Fares, S.; Manes, F.; Morani, A.; Sgrigna, G.; Loreto, F. Role of Biogenic Volatile Organic Compounds (BVOC) emitted by urban trees on ozone concentration in cities: A review. Environ. Pollut. 2013, 183, 71–80. [Google Scholar] [CrossRef]
  13. Anderegg, L.D.L.; Griffith, D.M.; Cavender-Bares, J.; Riley, W.J.; Berry, J.A.; Dawson, T.E.; Still, C.J. Representing plant diversity in land models: An evolutionary approach to make “Functional Types” more functional. Glob. Chang. Biol. 2022, 28, 2541–2554. [Google Scholar] [CrossRef] [PubMed]
  14. Recanatesi, F.; Giuliani, C.; Ripa, M.N. Monitoring Mediterranean Oak Decline in a Peri-Urban Protected Area Using the NDVI and Sentinel-2 Images: The Case Study of Castelporziano State Natural Reserve. Sustainability 2018, 10, 3308. [Google Scholar] [CrossRef] [Green Version]
  15. Kamenova, L.; Dimitrov, P. Evaluation of Sentinel-2 vegetation indices for prediction of LAI, fAPAR and fCover of winter wheat in Bulgaria. Eur. J. Remote Sens. 2021, 54, 89–108. [Google Scholar] [CrossRef]
  16. Huang, Y.; Yu, B.; Zhou, J.; Hu, C.; Tan, W.; Hu, Z.; Wu, J. Toward automatic estimation of urban green volume using airborne LiDAR data and high resolution Remote Sensing images. Front. Earth Sci. 2013, 7, 43–54. [Google Scholar] [CrossRef]
  17. Xu, X.; Xia, J.; Gao, Y.; Zheng, W. Additional focus on particulate matter wash-off events from leaves is required: A review of studies of urban plants used to reduce airborne particulate matter pollution. Urban For. Urban Green. 2020, 48, 126559. [Google Scholar] [CrossRef]
  18. Shahtahmassebi, A.R.; Li, C.; Fan, Y.; Wu, Y.; Lin, Y.; Gan, M.; Wang, K.; Malik, A.; Blackburn, G.A. Remote sensing of urban green spaces: A review. Urban For. Urban Green. 2021, 57, 126946. [Google Scholar] [CrossRef]
  19. Kowe, P.; Mutanga, O.; Dube, T. Advancements in the remote sensing of landscape pattern of urban green spaces and vegetation fragmentation. Int. J. Remote Sens. 2021, 42, 3797–3832. [Google Scholar] [CrossRef]
  20. Bai, H.; Li, Z.; Guo, H.; Chen, H.; Luo, P. Urban Green Space Planning Based on Remote Sensing and Geographic Information Systems. Remote Sens. 2022, 14, 4213. [Google Scholar] [CrossRef]
  21. Fares, S.; Conte, A.; Alivernini, A.; Chianucci, F.; Grotti, M.; Zappitelli, I.; Petrella, F.; Corona, P. Testing Removal of Carbon Dioxide, Ozone, and Atmospheric Particles by Urban Parks in Italy. Environ. Sci. Technol. 2020, 54, 14910–14922. [Google Scholar] [CrossRef]
  22. Remote Sensing for Sustainable Forest Management|Steven E. Franklin. Available online: https://www.taylorfrancis.com/books/mono/10.1201/9781420032857/remote-sensing-sustainable-forest-management-steven-franklin (accessed on 24 December 2022).
  23. Desiato, F.; Lena, F.; Baffo, F.; Suatoni, B.; Toreti, A. Indicatori del CLIMA in Italia Released by ISPRA. Available online: http://www.scia.isprambiente.it/wwwrootscia/Documentazione/Indicatori%20del%20clima%20in%20Italia.pdf (accessed on 26 January 2022).
  24. Koppen, W. Das geographische System der Klimat. Handb. Klimatol. 1936, 0, 46. Available online: https://cir.nii.ac.jp/crid/1573950399009743360 (accessed on 23 December 2022).
  25. Kottek, M.; Grieser, J.; Beck, C.; Rudolf, B.; Rubel, F. World Map of the Köppen-Geiger climate classification updated. Meteorol. Z. 2006, 15, 259–263. [Google Scholar] [CrossRef]
  26. Mircea, M.; Ciancarella, L.; Briganti, G.; Calori, G.; Cappelletti, A.; Cionni, I.; Costa, M.; Cremona, G.; D’Isidoro, M.; Finardi, S.; et al. Assessment of the AMS-MINNI system capabilities to simulate air quality over Italy for the calendar year 2005. Atmos. Environ. 2014, 84, 178–188. [Google Scholar] [CrossRef]
  27. Mircea, M.; Grigoras, G.; D’Isidoro, M.; Righini, G.; Adani, M.; Briganti, G.; Cremona, G.; Ciancarella, L.; Cappelletti, A.; Calori, G.; et al. Impact of Grid Resolution on Aerosol Predictions: A Case Study over Italy. Aerosol Air Qual. Res. 2016, 16, 1253–1267. [Google Scholar] [CrossRef] [Green Version]
  28. Skamarock, W.C.; Klemp, J.B. A time-split nonhydrostatic atmospheric model for weather research and forecasting applications. J. Comput. Phys. 2008, 227, 3465–3485. [Google Scholar] [CrossRef]
  29. Silibello, C.; Calori, G.; Brusasca, G.; Giudici, A.; Angelino, E.; Fossati, G.; Peroni, E.; Buganza, E. Modelling of PM10 concentrations over Milano urban area using two aerosol modules. Environ. Model. Softw. 2008, 23, 333–343. [Google Scholar] [CrossRef]
  30. De la Paz, D.; de Andrés, J.M.; Narros, A.; Silibello, C.; Finardi, S.; Fares, S.; Tejero, L.; Borge, R.; Mircea, M. Assessment of Air Quality and Meteorological Changes Induced by Future Vegetation in Madrid. Forests 2022, 13, 690. [Google Scholar] [CrossRef]
  31. Hemery, G.E.; Savill, P.S.; Pryor, S.N. Applications of the crown diameter–stem diameter relationship for different species of broadleaved trees. For. Ecol. Manag. 2005, 215, 285–294. [Google Scholar] [CrossRef]
  32. Sulla-Menashe, D.; Friedl, M.A. User Guide to Collection 6 MODIS Land Cover (MCD12Q1 and MCD12C1) Product; USGS: Reston, VA, USA, 2018.
  33. McHugh, M.L. Interrater reliability: The kappa statistic. Biochem. Med. 2012, 22, 276–282. Available online: https://hrcak.srce.hr/89395 (accessed on 24 December 2022). [CrossRef]
  34. Petropoulos, G.P.; Kalaitzidis, C.; Vadrevu, K.P. Support vector machines and object-based classification for obtaining land-use/cover cartography from Hyperion hyperspectral imagery. Comput. Geosci. 2012, 41, 99–107. [Google Scholar] [CrossRef]
  35. Ball, T.; Woodrow, I.E.; Berry, J.A. A Model Predicting Stomatal Conductance and its Contribution to the Control of Photosynthesis under Different Environmental Conditions. In Progress in Photosynthesis Research: Volume 4, Proceedings of the VIIth International Congress on Photosynthesis Providence, Rhode Island, USA, 10–15 August 1986; Biggins, J., Ed.; Springer: Dordrecht, The Netherlands, 1987; pp. 221–224. [Google Scholar] [CrossRef]
  36. Caldwell, M.; Pearce, R. Exploitation of Environmental Heterogeneity by Plants: Ecophysiological Processes Above- and Belowground; Academic Press: Cambridge, MA, USA, 2012. [Google Scholar]
  37. Keenan, T.; Sabate, S.; Gracia, C. Soil water stress and coupled photosynthesis–conductance models: Bridging the gap between conflicting reports on the relative roles of stomatal, mesophyll conductance and biochemical limitations to photosynthesis. Agric. For. Meteorol. 2010, 150, 443–453. [Google Scholar] [CrossRef]
  38. Lombardozzi, D.; Levis, S.; Bonan, G.; Sparks, J.P. Predicting photosynthesis and transpiration responses to ozone: Decoupling modeled photosynthesis and stomatal conductance. Biogeosciences 2012, 9, 3113–3130. [Google Scholar] [CrossRef] [Green Version]
  39. Lombardozzi, D.; Sparks, J.P.; Bonan, G. Integrating O3 influences on terrestrial processes: Photosynthetic and stomatal response data available for regional and global modeling. Biogeosciences 2013, 10, 6815–6831. [Google Scholar] [CrossRef]
  40. Lombardozzi, D.; Levis, S.; Bonan, G.; Hess, P.G.; Sparks, J.P. The Influence of Chronic Ozone Exposure on Global Carbon and Water Cycles. J. Clim. 2015, 28, 292–305. [Google Scholar] [CrossRef]
  41. Conte, A.; Otu-Larbi, F.; Alivernini, A.; Hoshika, Y.; Paoletti, E.; Ashworth, K.; Fares, S. Exploring new strategies for ozone-risk assessment: A dynamic-threshold case study. Environ. Pollut. 2021, 287, 117620. [Google Scholar] [CrossRef] [PubMed]
  42. Hochman, H.M.; Rodgers, J.D. Pareto Optimal Redistribution. Am. Econ. Rev. 1969, 59, 542–557. Available online: https://www.jstor.org/stable/1813216 (accessed on 27 December 2022).
  43. Street Trees in Italian Cities: Story, Biodiversity and Integration within the Urban Environment|SpringerLink. Available online: https://link.springer.com/article/10.1007/s12210-020-00907-9 (accessed on 23 December 2022).
  44. Li, Y.Y.; Wang, X.R.; Huang, C.L. Key street tree species selection in urban areas. Afr. J. Agric. Res. 2011, 15, 3539–3550. [Google Scholar] [CrossRef]
  45. Smithers, R.J.; Doick, K.J.; Burton, A.; Sibille, R.; Steinbach, D.; Harris, R.; Groves, L.; Blicharska, M. Comparing the relative abilities of tree species to cool the urban environment. Urban Ecosyst. 2018, 21, 851–862. [Google Scholar] [CrossRef]
  46. González-Cásares, M.; Pompa-García, M.; Vetnegas-González, A.; Domínguez-Calleros, P.; Hernández-Díaz, J.; Carrillo-Parra, A.; Tagle, M.A.G. Hydroclimatic variations reveal differences in carbon capture in two sympatric conifers in northern Mexico. PeerJ 2019, 7, e7085. [Google Scholar] [CrossRef]
  47. Muhammad, S.; Wuyts, K.; Samson, R. Species-specific dynamics in magnetic PM accumulation and immobilization for six deciduous and evergreen broadleaves. Atmos. Pollut. Res. 2022, 13, 101377. [Google Scholar] [CrossRef]
  48. Dzierżanowski, K.; Popek, R.; Gawrońska, H.; Sæbø, A.; Gawroński, S.W. Deposition of Particulate Matter of Different Size Fractions on Leaf Surfaces and in Waxes of Urban Forest Species. Int. J. Phytoremediat. 2011, 13, 1037–1046. [Google Scholar] [CrossRef]
  49. Speak, A.F.; Rothwell, J.J.; Lindley, S.J.; Smith, C.L. Urban particulate pollution reduction by four species of green roof vegetation in a UK city. Atmos. Environ. 2012, 61, 283–293. [Google Scholar] [CrossRef]
  50. Manes, F.; Marando, F.; Capotorti, G.; Blasi, C.; Salvatori, E.; Fusaro, L.; Ciancarella, L.; Mircea, M.; Marchetti, M.; Chirici, G.; et al. Regulating Ecosystem Services of forests in ten Italian Metropolitan Cities: Air quality improvement by PM10 and O3 removal. Ecol. Indic. 2016, 67, 425–440. [Google Scholar] [CrossRef]
  51. Beckett, K.P.; Freer-Smith, P.H.; Taylor, G. The Capture of Particulate Pollution by Trees at Five Contrasting Urban Sites. Arboric. J. 2000, 24, 209–230. [Google Scholar] [CrossRef]
  52. Bottalico, F.; Travaglini, D.; Chirici, G.; Garfì, V.; Giannetti, F.; De Marco, A.; Fares, S.; Marchetti, M.; Nocentini, S.; Paoletti, E.; et al. A spatially-explicit method to assess the dry deposition of air pollution by urban forests in the city of Florence, Italy. Urban For. Urban Green. 2017, 27, 221–234. [Google Scholar] [CrossRef]
  53. Baraldi, R.; Chieco, C.; Neri, L.; Facini, O.; Rapparini, F.; Morrone, L.; Rotondi, A.; Carriero, G. An integrated study on air mitigation potential of urban vegetation: From a multi-trait approach to modeling. Urban For. Urban Green. 2019, 41, 127–138. [Google Scholar] [CrossRef]
  54. Sanusi, R.; Livesley, S.J. London Plane trees (Platanus x acerifolia) before, during and after a heatwave: Losing leaves means less cooling benefit. Urban For. Urban Green. 2020, 54, 126746. [Google Scholar] [CrossRef]
  55. Coulston, J.W.; Smith, G.C.; Smith, W.D. Regional Assessment of Ozone Sensitive Tree Species Using Bioindicator Plants. Environ. Monit. Assess. 2003, 83, 113–127. [Google Scholar] [CrossRef]
  56. Ma, X.; Zou, Q.; Liu, M.; Li, J. Comparative Research on Typical Measure Methods of the Carbon Sequestration Benefits of Urban Trees Based on the UAV and the 3D Laser: Evidence from Shanghai, China. Forests 2022, 13, 640. [Google Scholar] [CrossRef]
  57. Variation in Tree Species Ability to Capture and Retain Airborne Fine Particulate Matter (PM2.5)|Scientific Reports. Available online: https://www.nature.com/articles/s41598-017-03360-1 (accessed on 24 December 2022).
  58. Paoletti, E. Ozone and urban forests in Italy. Environ. Pollut. 2009, 157, 1506–1512. [Google Scholar] [CrossRef]
  59. Nali, C.; Ferretti, M.; Pellegrini, M.; Lorenzini, G. Monitoring and Biomonitoring of Surface Ozone in Florence, Italy. Environ. Monit. Assess. 2001, 69, 159–174. [Google Scholar] [CrossRef]
  60. Raffaelli, K.; Deserti, M.; Stortini, M.; Amorati, R.; Vasconi, M.; Giovannini, G. Improving Air Quality in the Po Valley, Italy: Some Results by the LIFE-IP-PREPAIR Project. Atmosphere 2020, 11, 29. [Google Scholar] [CrossRef] [Green Version]
  61. Quah, A.K.; Roth, M. Diurnal and weekly variation of anthropogenic heat emissions in a tropical city, Singapore. Atmos. Environ. 2012, 46, 92–103. [Google Scholar] [CrossRef]
  62. Ostoić, S.K.; Salbitano, F.; Borelli, S.; Verlič, A. Urban forest research in the Mediterranean: A systematic review. Urban For. Urban Green. 2018, 31, 185–196. [Google Scholar] [CrossRef]
  63. Barbati, A.; Marchetti, M.; Chirici, G.; Corona, P. European Forest Types and Forest Europe SFM indicators: Tools for monitoring progress on forest biodiversity conservation. For. Ecol. Manag. 2014, 321, 145–157. [Google Scholar] [CrossRef] [Green Version]
  64. Bentsen, P.; Lindholst, A.C.; Konijnendijk, C.C. Reviewing eight years of Urban Forestry & Urban Greening: Taking stock, looking ahead. Urban For. Urban Green. 2010, 9, 273–280. [Google Scholar] [CrossRef]
  65. Gill, S.E.; Handley, J.F.; Ennos, A.R.; Pauleit, S. Adapting Cities for Climate Change: The Role of the Green Infrastructure. Built Environ. 1998, 33, 115–133. [Google Scholar] [CrossRef] [Green Version]
  66. Gualtieri, G.; Brilli, L.; Carotenuto, F.; Vagnoli, C.; Zaldei, A.; Gioli, B. Quantifying road traffic impact on air quality in urban areas: A Covid19-induced lockdown analysis in Italy. Environ. Pollut. 2020, 267, 115682. [Google Scholar] [CrossRef]
  67. Nespor, S. La Lunga Marcia Per Un Accordo Globale Sul Clima: Dal Protocollo Di Kyoto All’accordo Di Parigi. Riv. Trimest. Dirit. Pubblico 2016, 1, 81–121. [Google Scholar]
  68. Pilli, R.; Anfodillo, T.; Dalla Valle, E. Stima del Carbonio in foresta: Metodologie ed aspetti normativi. Pubblicazione del Corso di Cultura in Ecologia. Atti 2006, 42, 161–183. [Google Scholar]
  69. Romano, S. L’implementazione della Strategia Forestale Nazionale a livello locale: Un’opportunità importante, non facile da cogliere. For. J. Silvic. For. Ecol. 2020, 17, 58. [Google Scholar] [CrossRef]
Table 1. Land use map legend based on the Modis Land Cover Type 2.
Digital NumberName
1Barren or sparsely vegetated
2Croplands
3Deciduous Broadleaf treed areas
4Evergreen Broadleaf treed areas
5Evergreen Needleleaf treed areas
6Grasslands
7Shrubs
8Urban and built_up
9Water
Table 2. Sentinel 2 bands used in classification.
BandResolutionCentral WavelengthDescription
B210 m490 nmBlue
B310 m560 nmGreen
B410 m665 nmRed
B520 m705 nmVisible and Near Infrared (VNIR)
B620 m740 nmVisible and Near Infrared (VNIR)
B720 m783 nmVisible and Near Infrared (VNIR)
B810 m842 nmVisible and Near Infrared (VNIR)
B8a20 m865 nmVisible and Near Infrared (VNIR)
Table 3. Most abundant species presence in the city of Milan with number of individuals, diameter at breast height (dbh), height and average pollutant deposition. The dbh, heights, NPP and pollutants are species-specific average values, and have no correlation with the abundance or number of individuals of that species in the city.
SpeciesNumber of Individualsd.b.h.HeightMean NPPMean O3Mean PM10Mean PM2.5Mean NO2
cmmg CO2 m2 y−1g m2 y−1g m2 y−1g m2 y−1g m2 y−1
Platanus x acerifolia16,51051171008.4171.0182.6880.3560.395
Celtis australis12,6325315582.3440.9241.9270.2570.336
Acer platanoides12,3573210849.6970.8982.1130.2830.350
Carpinus betulus11,812258530.4090.7851.9350.2630.322
Robinia pseudoacacia11,1333310539.9930.8232.0880.2860.327
Populus nigra10,2496016810.6490.9712.5100.3420.375
Liquidambar styraciflua84922910674.7630.8552.1260.2840.342
Prunus cerasifera7332245249.0120.6131.4450.1930.282
Ulmus spp.68434114792.0590.9172.5150.3380.367
Fraxinus excelsior6837257503.2810.7691.7200.2330.315
Quercus rubra679839141023.2840.9782.4480.3290.376
Acer pseudoplatanus6750309598.5830.7962.0730.2750.331
Platanus spp.659948181025.4700.9972.9210.3760.405
Acer negundo58323610672.3430.8382.1460.2870.340
Tilia spp.57803914745.1380.9062.4690.3290.360
Quercus robur57603212874.5150.9142.3210.3120.359
Acer saccharinum56893510667.6150.8362.1420.2870.338
Prunus serrulata5567164.5142.1670.5711.3600.1800.272
Tilia cordata535238.2012694.8570.8782.2830.3060.347
Aesculus hippocastanum49054614715.9520.9052.5240.3340.364
Liriodendron tulipifera4751258487.1460.7691.9060.2540.319
Cercis siliquastrum4225306445.5500.6951.6530.2190.304
Ulmus pumila418346151024.4651.0062.7080.3560.399
Ailanthus altissima33454412654.7760.8642.3460.3140.350
Prunus avium2938246290.7940.6551.6550.2200.291
Platanus x hybrida279949171011.8620.9902.8530.3680.405
Prunus spp.259420.55209.6720.6071.4310.1910.276
Pyrus calleryana2585135148.1550.5841.5090.1990.277
Ulmus carpinifolia25664715808.9420.9192.6670.3560.381
Tilia americana25574313721.4770.8942.4490.3240.361
Table 4. Most abundant species presence in the city of Bologna with number of individuals, diameter at breast height (dbh), height and average pollutant deposition. The dbh, heights, NPP and pollutants are species-specific average values, and have no correlation with the abundance or number of individuals of that species in the city.
SpeciesNumber of Individualsd.b.h.HeightMean NPPMean O3Mean PM10Mean PM2.5Mean NO2
cmmg CO2 m2 y−1g m2 y−1g m2 y−1g m2 y−1g m2 y−1
Celtis australis813523.59337.9420.9080.4960.1020.323
Platanus x acerifolia64854019.51033.4461.2520.8620.1780.451
Tilia x intermedia485723.59492.7880.9780.6380.1310.353
Fraxinus excelsior40317.55244.0900.8450.4480.0930.318
Acer campestre38197.55216.2560.8100.4490.0930.313
Aesculus hippocastanum327023.59468.1900.9400.6510.1330.361
Populus nigra317780.4323.94862.3811.2110.9650.2000.477
Quercus robur23617.55302.8730.8510.4510.0930.324
Populus alba2222145221.5880.7970.4510.0930.326
Fraxinus angustifolia18177.55224.8880.7750.4620.0950.326
Cercis siliquastrum16437.55223.3700.7870.4580.0940.316
Styphonolobium japonicum164123.59335.3820.8760.7820.1620.358
Tilia platyphyllos15677.55182.1880.7720.4560.0940.315
Cedrus deodara14615919.52594.6121.25111.4762.5260.463
Tilia cordata14017.55184.0950.7720.4520.0930.308
Robinia pseudoacacia1345179386.9540.9660.6700.1390.358
Acer negundo118923.59529.7120.9340.6700.1380.372
Fraxinus ornus10757.55222.7080.7850.4620.0950.316
Carpinus betulus105812.59447.7570.9420.7160.1480.385
Acer pseudoplatanus89923.59541.0950.9750.6570.1350.357
Cupressus sempervirens88023.592244.1931.4326.1701.3590.453
Quercus ilex8737.55155.8460.6952.5880.5580.268
Ulmus carpinifolia86023.59521.6690.9620.6810.1410.365
Acer platanoides7707.55324.7860.8160.4520.0930.325
Morus nigra7077.55196.3030.6810.4550.0940.275
Cedrus atlantica7065919.52581.4681.33611.6302.5480.479
Pinus pinea6474091071.0291.0835.6141.2290.384
Prunus avium626145141.5200.7510.4740.0980.318
Pinus nigra58623.59979.2770.9085.0621.1090.351
Acer saccharinum47112.59441.5980.9270.6790.1400.389
Disclaimer/Publisher’s Note: The statements, opinions and data contained in all publications are solely those of the individual author(s) and contributor(s) and not of MDPI and/or the editor(s). MDPI and/or the editor(s) disclaim responsibility for any injury to people or property resulting from any ideas, methods, instructions or products referred to in the content.

