
Study on Barriers of Water Salt Transfers in Earthen Sites by Plastic-Coated Sand


School of Human Settlements and Civil Engineering, Xi’an Jiaotong University, Xi’an 710049, China
*
Author to whom correspondence should be addressed.
Atmosphere 2023, 14(2), 236; https://doi.org/10.3390/atmos14020236
Submission received: 7 January 2023
/
Revised: 21 January 2023
/
Accepted: 23 January 2023
/
Published: 25 January 2023
(This article belongs to the Special Issue Advances in Preservation Environment for Protection of Cultural Heritage Artefacts)
Abstract
:Under the action of unidirectional water migration, museum soil sites generally encounter erosion through dry cracking, salt enrichment, etc. In this paper, the earthen site of the Terra Cotta Warriors Museum of the First Emperor of Qin was used as the research object, and the “hydrophobic” property of coated sand was proposed to prevent water migration and salt accumulation. Through the soil column experiment of water salt migration and the HYDRUS software numerical simulation, the water salt migration law of the soil in the heritage site under different conditions and the characteristics of water and salt resistance of plastic-coated sand were studied. The results showed that the salt damage on the earthen ruins was mainly due to the horizontal and vertical migration of water and salt in soil. After embedding the coated sand layer into the soil environment under the earthen site, the vertical and horizontal migration of water and salt in the soil can be completely prevented due to precipitation and groundwater. The coated sand protection technology and method proposed in this paper use materials similar to those of the earthen, and provide a feasible method for the protection of cultural relics in our country.
1. Introduction
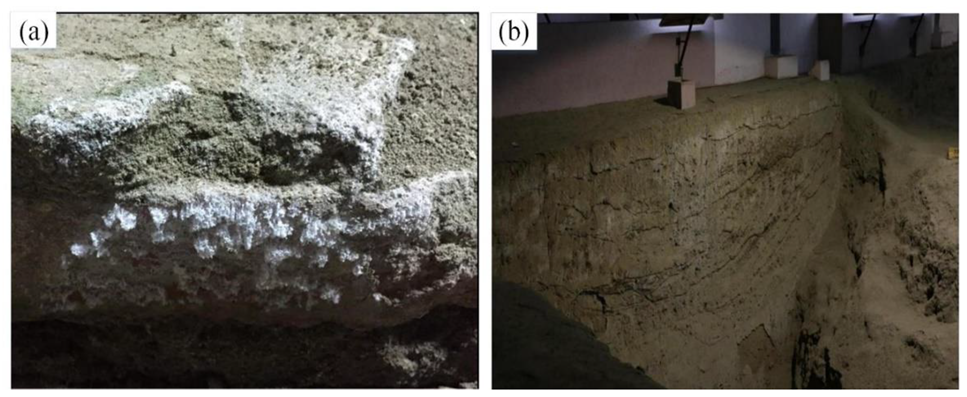
Earthen sites refer to ancient sites with historical, cultural, and scientific values that use soil as the main building material. There are many earthen sites in China, covering all provinces of the country. Among the 5058 national key cultural relics that have been announced, there are more than 370 earthen sites [1], such as the Terra Cotta Warriors burial pit earth site of the Qin Shihuang Mausoleum and Banpo site in Xi’an [2]. As earthen sites are attached to natural geographical environments and affected by climate change, human economic activities, geological disasters, and other factors, the occurrence environment is very complex, and they are generally threatened by various diseases such as dry cracking, crisp alkali, and collapse [3]. Among them, the accumulation of soluble salts on the surface of earthen sites caused by water migration and evaporation (as shown in Figure 1) is the common and most important cause of dry cracking and weathering damage of earthen sites and is an urgent problem that needs to be solved when protecting earthen sites [4,5].
The local enrichment of salt caused by water and salt migration can deteriorate earthen sites. Espinosa [6] found that when the water in the rock and soil mass increased, an increasing amount of salt dissolved and migrated with the movement of water. When the salt was enriched to a certain extent in a certain area and the water gradually decreased, the enrichment area would produce salt damage, which significantly affected the life and safety of the rock and soil mass. Steiger [7] assumed that the salt damage was mainly caused by the crystallization pressure generated by salt crystallization. Flatt [8] developed the theory of salt crystal growth in the pores of porous materials, and believed that salt crystals had a destructive effect, with sodium sulfate crystals having a greater destructive effect than that of sodium chloride. In addition, many researchers have carried out a variety of research works on the process of salt enrichment and destruction of earthen sites through experiments and numerical simulation. The research of Watt and Colston [9] and Zehnder [10] showed that the accumulation of salt plays a crucial role in the weathering of earthen sites on the surface of cultural relics. Qian et al. [11] found that the main factor causing the deformation and damage of soil structures was the salt swelling caused by the repeated crystallization of soluble salts after studying the diseases in the burial pits of Qin Shihuang Mausoleum. Liu Xiaoyu [4] studied the formation mechanism of salt damage in a burial pit of the Qin Shihuang Mausoleum, and found that Na2SO4 was very easy to crystallize on the surface of the soil and produced pantothenic alkali and crisp alkali disease, while the salting of NaCl and NaNO3 was weak, and crisp alkali disease did not easily form. Yan [12] studied the deterioration mechanism of soil cultural relics and the durability of materials in arid areas, and believed that the physical damage to soil structures caused by salt crystallization expansion was affected by the salt content, temperature and humidity, external environment, and other factors. Zhang [13] found that the inherent salt content in soil cultural relics had a certain cementation effect on the cultural relics without water, which improved the soil strength to a certain extent. Only when salt dissolved in water and migrated along with the water movement would it lead to the destruction of soil pore structures during recrystallization, thus leading to the occurrence of various types of salt damage. Therefore, the main cause of salt damage on the surface of earthen ruins is that salt is continuously transported to the surface for enrichment in the process of continuous one-way water movement.
At present, more work, such as structural restoration, salt damage prevention, and sacrificial layer protection of the earthen sites, has been carried out for the protection of earthen sites [14]. Taking the ancient city of Jiaohe in China as an example, Li [15] developed PS (potassium silicate) penetration and crack grouting technology, mud brick masonry repair technology, and suspended steel beam ceiling technology. By using these technologies, the degradation of the site has been effectively controlled; Chen [16] preliminarily studied the feasibility of using drilling grouting to study modified polyvinyl alcohol (SH) to protect soil sites. He found that when the dry density and pore diameter of these soil samples were less than 1.50 g/cm3 (pore ratio e > 0.779) and equal to 5 mm, respectively, the protection and permeability of SH were relatively good. Regarding the salt hazard prevention and control technology of earthen sites, Chen [17] found that when the sodium sulfate content was 1%, 2%, and 3%, the addition of diethylenetriamine pentamethylene phosphonic acid (DTPMP) could inhibit the crystallization of sodium sulfate in rammed soil. Qian [11] applied composite-starch-grafted acrylamide polymer (St PAM) to the K9901 burial pit of Qin Shihuang Mausoleum and the underground site of Hanyang Mausoleum. The results showed that the removal rate of Ca2+ and SO4− from the surface soil layer of the experimental area reached about 70% and 90%, respectively. Qian [18] believed that the process of using polymer desalination materials to desalt earthen sites needed to be developed. This method may change the original appearance of earthen sites and cause physical damage to the site surface while controlling the salt damage. Yang [19] analyzed the research progress of salting out inhibitors during the anti-weathering of earthen sites, and analyzed the mechanism of their inhibition of salt damage. They believed that the protective materials of earthen sites should not change the original appearance of earthen sites and should not block the material and energy exchange between the sites and the external environment. Regarding sacrificial layer protection technology, Wang [20] proposed the concept of the sacrificial layer according to the erosion characteristics of earthen sites and the living environment in arid and semi-arid areas; thus, a layer of mud coating covered the surface of earthen sites, similar to natural materials found in the sites, which would provide a protective layer for external damage and protect earthen sites at the same time. The results showed that the best proportion of hemp fiber, wheat bran, and soil was 0.5:1.25:100, respectively, which was the best sacrificial layer modification material. Zhang [21] discussed the desalination method of earthen sites and proposed a sacrificial soil layer method to redistribute the salt accumulated on the soil surface by using the characteristics of soil and groundwater. However, this method was feasible only when the salt accumulated on the soil surface is soluble.
Although the above protection methods can temporarily alleviate the salt damage of earthen sites because the salt in the earthen site mainly migrates with water, only by preventing the water carrying soluble salt from migrating to the surface of the earthen site can the formation of a water salt migration isolation zone completely eliminate the damage to the earthen site caused by salt enrichment. Coated sand is a hydrophobic material that forms an active membrane by coating the surface of quartz sand with organic polymer resin, and has a virtually unlimited lifespan [22]. It has excellent water repellent properties of a small permeability coefficient and low water conductivity [23]. At present, it has been widely used as a fracture proppant in oilfield development to prevent water migration. Yang [24] summarized the hydrophobic mechanism of the superhydrophobic surface and coating technology of material surfaces and prepared superhydrophobic-coated sand by coating superhydrophobic material on the surface of proppant. After calculating its water–oil resistance ratio, it was found that the proppant had the performance of preventing aqueous phase seepage. Zhang [25] carried the coated sand into the core fracture through the fracturing process to select the oil and water flow capacity of the coated sand, to achieve the characteristics of water plugging without oil plugging.
In this paper, the Terra Cotta Warriors Museum, which is a collection of earthen sites, was the research object. In view of the salt damage of earthen sites, it was proposed to use the hydrophobic characteristics of coated sand for water resistance and salt resistance protection. Moreover, combined with an indoor soil column experiment and numerical simulation, the water and salt migration law of earthen sites under different conditions and the water and salt resistance characteristics of coated sand were systematically studied to explore the preventive protection technology scheme of salt hazards of earthen sites.
2. Materials and Methods
2.1. Principle of Water and Salt Resistance of Coated Sand
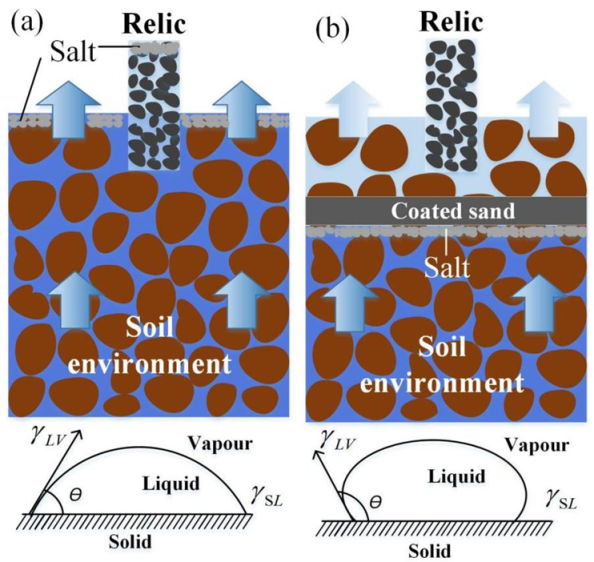
Water migration from earthen sites to air is a one-way spontaneous behavior [21], as shown in Figure 2a. When water migrates in earthen ruins, the contact angle between the solid–liquid interface and the gas–liquid interface through the liquid interior is an important parameter to measure water migration and surface tension. The contact angle and the interfacial tension can be calculated with Young’s Equation [26]:
where: —surface tension of solid–vapor interface; —surface tension of solid–liquid interface; —surface tension of liquid–vapor interface. According to the range of the contact angle θ, there are many situations of moisture migration, as shown in Table 1. When θ > 90°, the water transfer ability in the soil will decrease significantly, or even not transfer at all. Based on this result, arranging coated sand for water blocking in earthen sites was proposed in this paper by taking advantage of the sign that the contact angle between water and the surface of coated sand material is greater than 90 degrees. Thus, the earthen sites above the coated sand are not wet (as shown in Figure 2b), to prevent water from passing through the soil particle gap and achieve water resistance and salt resistance.
2.2. Experimental Setup of Water- and Salt-Resisting Soil Column with Coated Sand
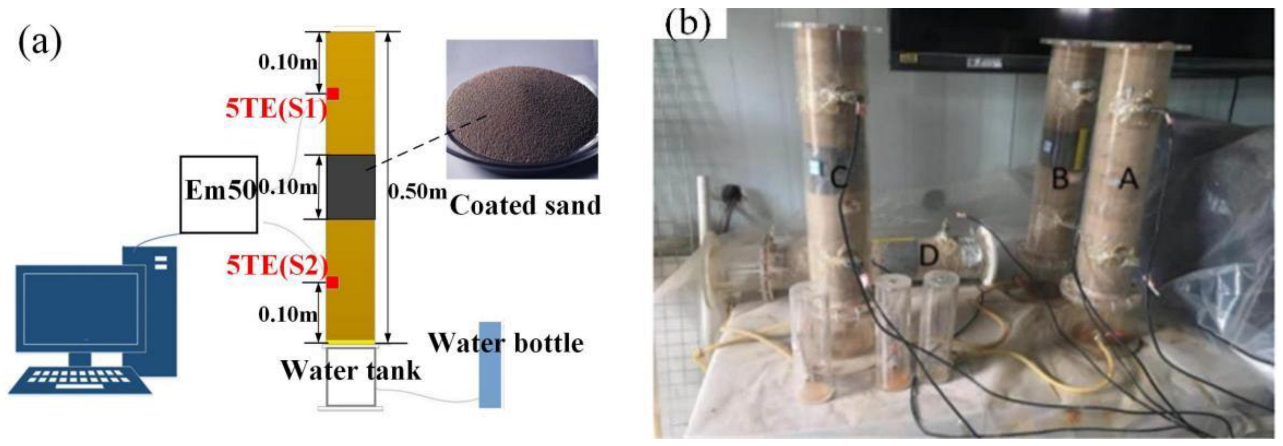
According to the principle of water and salt resistance of coated sand mentioned in Section 2.1, a soil column verification experiment and numerical simulation experiment of water and salt migration were carried out in this paper. The experimental system is shown in Figure 3. The experimental system consisted of an organic glass soil column, water bottle, 5TE sensor of soil water content and salt content, and Em50 data collector. The inner diameter of the organic glass soil column was 0.1 m, and the height was 0.5 m. The coated sand layer was located at 0.2~0.3 m of the organic glass soil column, and its particle size was 0.5 mm~1.0 mm. The inner diameter of the water storage bottle was 0.05 m and the height was 0.15 m. The soil used in the soil column experiment was taken from the deep original soil in Xi’an. After being collected, the soil was air-dried, screened, compacted, and then filled into the organic glass soil column with a filling density of 1300 kg/m3. In addition, Em50 is a 5-channel data collector and the core component of the soil moisture monitoring system. It can be connected to any type of sensor and can read the sensor data once a minute. The soil water content and salt content sensor adopted the 5TE sensor of Leiden Electronics to determine the water content by measuring the dielectric constant of the soil, and the specific range and accuracy are shown in Table 2 below. The interval between the data recorded by each sensor during the experiment was 10 min.
Based on the experimental system, four groups of experiments were designed in this study, A, B, C, and D, as shown in Figure 3b. Moreover, as shown in Figure 3a, the two 5TE sensors were located at 0.1 m and 0.4 m of the organic glass soil column, and S1 and S2 were used to refer to the upper and lower sensor positions, respectively. The four groups of experimental settings are shown in Table 3:
Experiment A: It is a control group experiment, which uses a small water storage bottle connected to the lower end of a vertical pure soil column to continuously replenish water, simulating the rising process of groundwater in the preserved soil sites of the museum.
Experiment B: A coated sand layer with a thickness of 0.1 m is inserted in the middle of the vertical soil column, and a small water storage bottle is connected at the lower end to continuously replenish water, simulating the process of coated sand preventing the vertical upward migration of groundwater.
Experiment C: A film-coated sand layer with a thickness of 0.1 m is inserted in the middle of the vertical soil column, without connecting small water storage bottles, and the actual rainfall is simulated by adding water above the soil column to simulate the process of coated sand preventing the vertical migration of precipitation.
Experiment D: Similar to the experimental setup of Group C, the vertical soil column is replaced with the horizontal soil column, and the coated sand is simulated to prevent the horizontal migration of precipitation.
During the experiment, the groundwater levels of Groups A, B, and D remained stable, and the make-up water was made up of ultrapure water after deionization treatment.
2.3. Setting of the Numerical Simulation Conditions for Water and Salt Resistance of Coated Sand
In this paper, the mathematical model of water and salt migration was further established, and the Terra Cotta Warriors burial pit structure earthen site was taken as an example to predict the effect of water and salt resistance of coated sand on the earthen site in the museum collection. The Terra Cotta Warriors in the Mausoleum of the First Emperor of Qin Dynasty, which are also facing the disease of dry cracking and salt accumulation in the earthen sites, have been approved by UNESCO to be included in the World Heritage List [27]. Figure 4a shows the exhibition hall of the Qin Terra Cotta Warriors Museum, with the tourist area around the cultural relics area. According to the shape of the exhibition hall, a schematic diagram of water and salt migration was established, as shown in Figure 4b. Considering the impact of horizontal and vertical migration of precipitation and groundwater, a layer of coated sand was established around the cultural relics area to resist water and salt. In order to better simulate the migration characteristics of precipitation and groundwater, as well as the blocking effect of coated sand on water and salt migration, a profile was cut along the span direction of the three-dimensional soil model, and L is the indoor geometric scale, which is the length of the area inside the museum in the upper boundary, as shown in Figure 4c. In this paper, HYDRUS-2D was used to establish the model shown in this figure, and simulation research was carried out on the water movement and solute movement of the soil sites.
2.3.1. Control Equation
The migration of water in earthen sites is described as water flow in porous media, which can be depicted by Richard’s equation [28]. The model assumes that all soil layers are homogeneous and isotropic and ignores the influence of meteorological factors. The expression is as follows:
where: —volume moisture content of soil mass/cm3·(cm3)−1; —negative pressure head of soil mass/cm; —unsaturated water content of soil mass/cm·h−1; —time/h; —spatial coordinates.
The soil moisture characteristic curve and unsaturated hydraulic conductivity can be described with the van Genuchten model formula [29]:
where: —saturated water content/cm3·(cm3)−1; —residual moisture content/cm3·(cm3)−1; —effective moisture content/cm3·(cm3)−1; —saturated hydraulic conductivity of soil mass/cm·h−1; —volumetric water content/cm3·(cm3)−1; , , —fitting parameters().
The solute transport in soil is dominated by three physical processes: convection, molecular (ion) diffusion, and mechanical dispersion, as well as a series of chemical, physical, and chemical processes occurring in the solute transport process. The solute in soil is affected by convection and hydrodynamic dispersion. The convection dispersion CED equation of soil solute transport established by Nielson and Biggar is widely used, and its expression is as follows [30]:
where: c— solute concentration/g·L−1; qi—flow flux/cm·h−1; Dij—diffusivity/cm2·h−1
where: —diffusion coefficient/cm2·h−1; —dispersion coefficient/cm2·h−1; —curvature; —diffusion coefficient of solute in free water/cm2·h−1; —dispersion/cm; —pore water velocity/cm·h−1.
There is an adsorption/desorption interaction between the solute concentration in the soil solution and the solute concentration adsorbed by the soil matrix, which is mainly affected by the exchange characteristics of the soil and the interaction of various types of solutes [31]. The expression is:
where: —solid-phase adsorption concentration of soil solute/g·g−1; —distribution coefficient; and —empirical parameters ( = 1, = 0 is linear equilibrium adsorption).
2.3.2. Simulated Working Conditions
Considering that the characteristics of water and salt migration in soil may be affected by different daily average precipitations, indoor geometric dimensions of museums, and underground water, we set five working conditions as shown in Table 4. Regarding the water and salt migration scenarios in the soil without coated sand, the effects of different precipitation, different indoor geometric scales, and the presence of groundwater on water and salt migration were simulated, respectively. Second, regarding coated sand for water and salt resistance, sandy soil (sand) in the model database was selected as the coated sand layer, and the indoor geometric length was set to 75 cm. In this simulation section, the coated sand was placed in the soil on the left side of the pit, and the soil on the right side was set as the control group without coated sand. The width of coated sand was 20 cm, and the indoor geometric scale L is shown in Figure 4c.
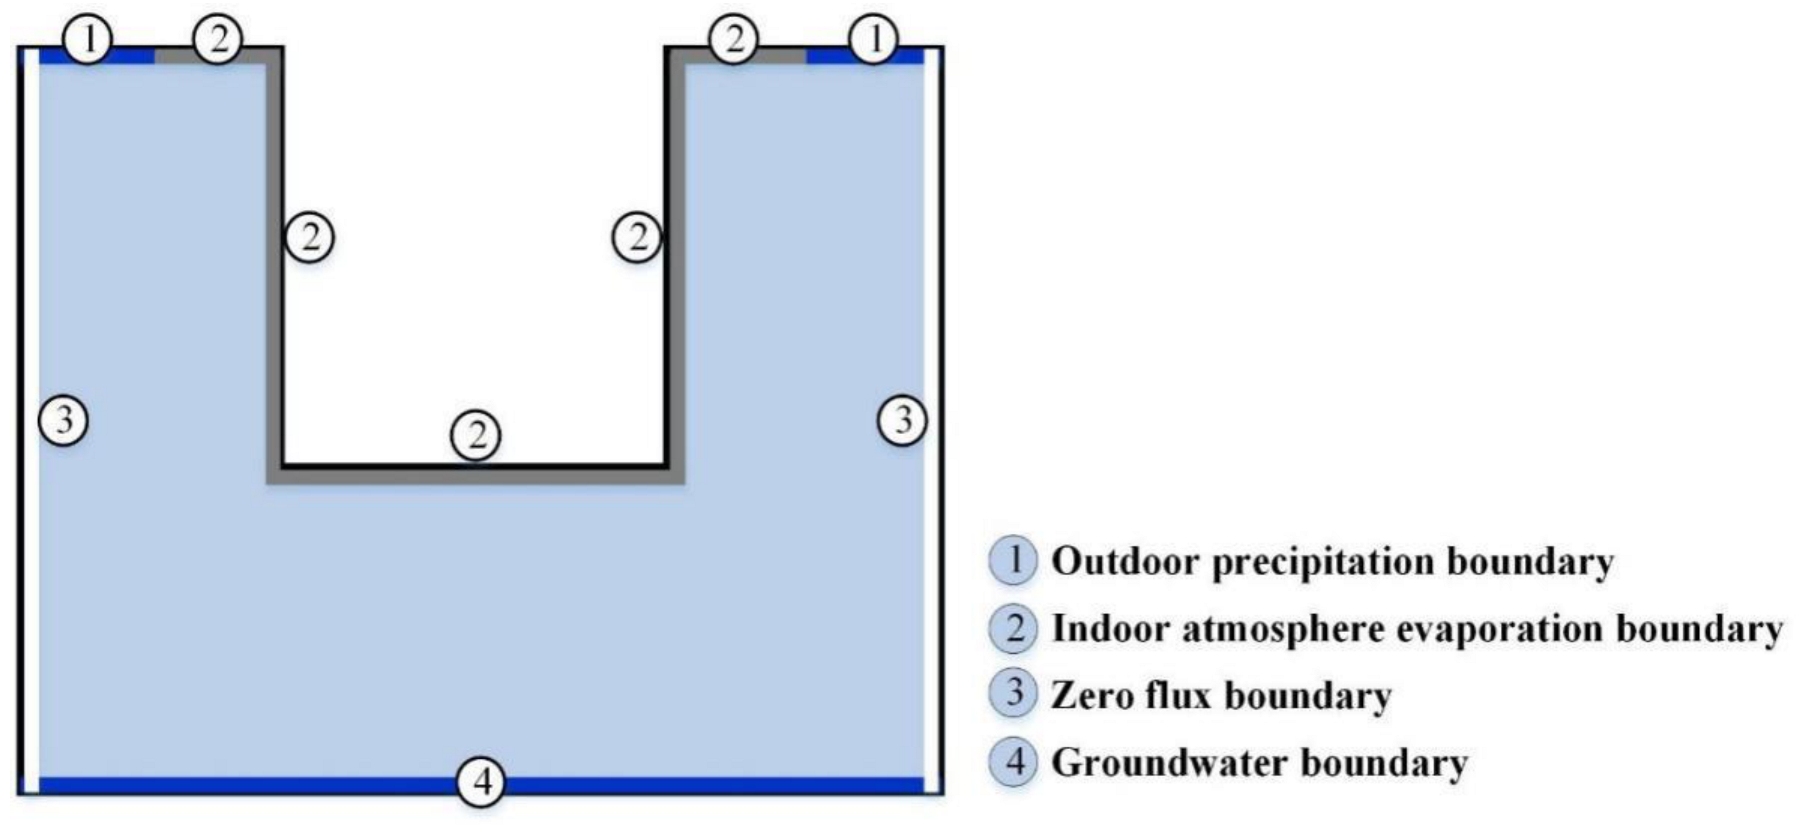
The boundary conditions of the model are shown in Figure 5. The upper surface of the model was the outdoor precipitation part and the indoor atmosphere part, which were, respectively, set as the variable flux boundary of precipitation and the boundary of atmospheric evaporation conditions (the evaporation amount was 0.2 mm/d). The wall was the indoor evaporation part, which was set as the evaporation boundary (the evaporation amount was 0.2 mm/d). If there was groundwater, the lower boundary was set as the constant head boundary. Due to the symmetry and ductility of the study area, the remaining boundary conditions were set to zero flux [32].
For the boundary of atmospheric evaporation, it is necessary to determine the amount of evaporation. The method of real-time monitoring can be used, or the Penman–Monteith formula recommended by FAO-56 can be used to calculate the amount of evaporation in the model [33], which takes into account the changes in energy balance and aerodynamic parameters. It has a strong theoretical basis and high calculation accuracy, and has been widely used in practical production. Its calculation formula is as follows (the root water absorption term is omitted in this paper):
where: ET0—potential evaporation/mm·d−1; Rn—net radiation/MJ·(m2·d)−1; G—soil heat flux density/MJ·(m2·d)−1; u2—wind speed at 2 m altitude/m·s−1; T—mean daily temperature/°C; es—air-saturated vapor pressure/Kpa; Δ—the slope of the curve of the relation between saturated vapor pressure and temperature/KPa·(°C)−1; γ—temperature calculation constant/KPa·(°C)−1.
Based on the calculation requirements of the numerical model, it is necessary to clarify the determination methods of the relevant parameters in the model, and obtain part of the model parameters through the experimental measurement method, to provide reliable basic data information for further numerical simulation research. We have conducted relevant experiments before [34], where the experimental contents included: the initial state of the experimental soil and the mass water content and dry density of each stage in the experimental process were obtained by the drying method and ring knife method, and then the volume water content of the experimental soil was calculated by the formula:
where: θm—mass water content of soil/g·g−1; ρb—dry density/g·(cm3)−1, with a value of 1.55.
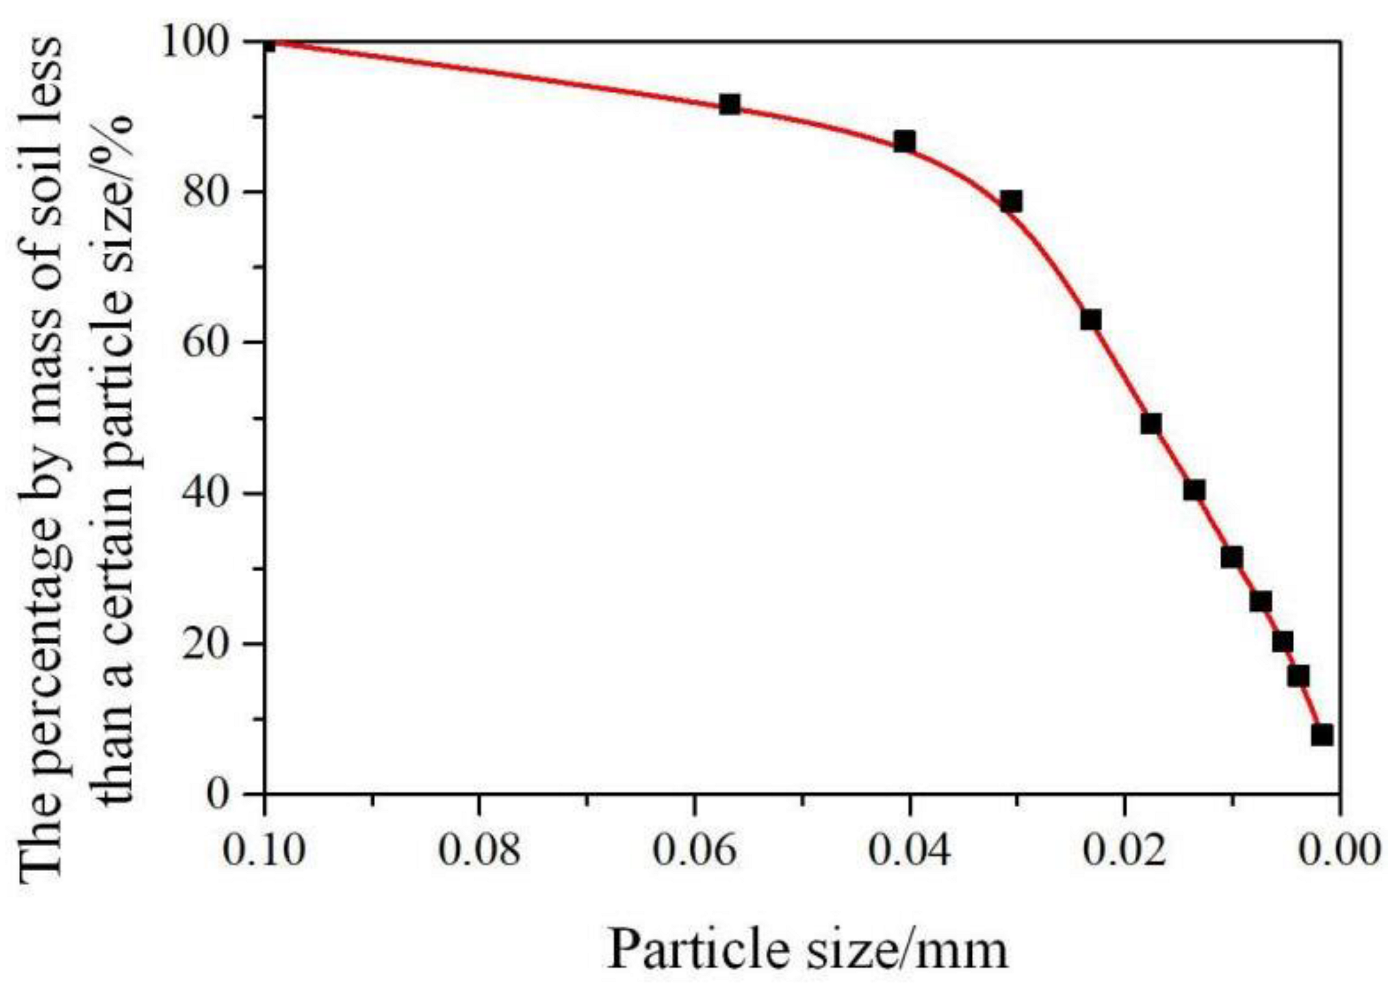
The initial state of the experimental soil and the contents of main salt ions (Cl−, SO42−, NO3−, Na+, K+, Mg2+, and Ca2+) in each stage of the experiment were obtained by ion chromatography. The distribution of experimental soil particle size was obtained by a combined screening method and densitometer method, which was used to predict soil hydraulic characteristic parameters according to soil particle size. The particle size distribution of the experimental soil is shown in Figure 6.
The following parameters were predicted using the HYDRUS Rosetta module [35]: soil water conductivity Ks, saturated water content , residual water content , and the parameters n and in the hydraulic characteristic curve, as shown in Table 5 below.
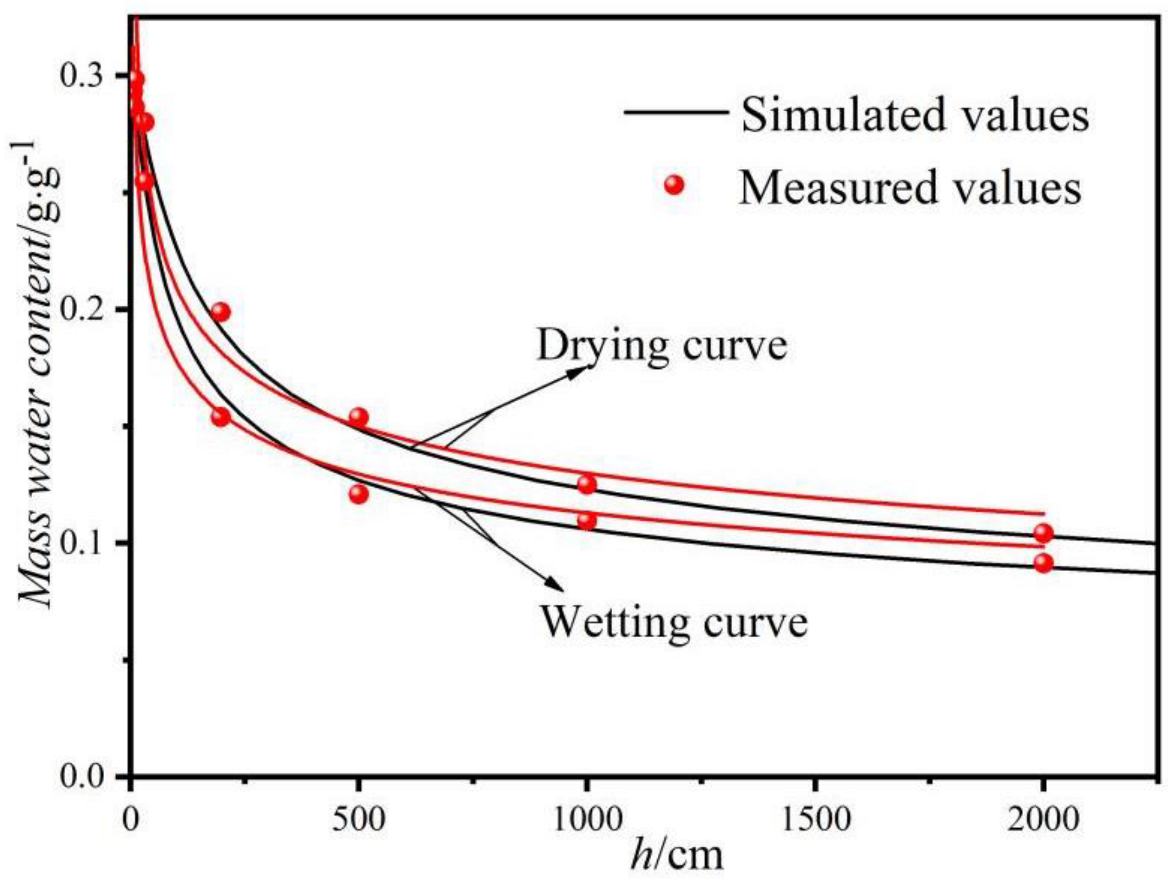
The water characteristic curve of experimental soil, including the hygroscopic curve and dehumidification curve, was obtained by the pressure membrane method. The hydraulic characteristic parameters predicted by the model could be corrected according to the results. The characteristic curves of soil water measured during the experiment and simulation are shown in Figure 7.
3. Discussion and Analysis of Water and Salt Resistances Experiment of Coated Sand
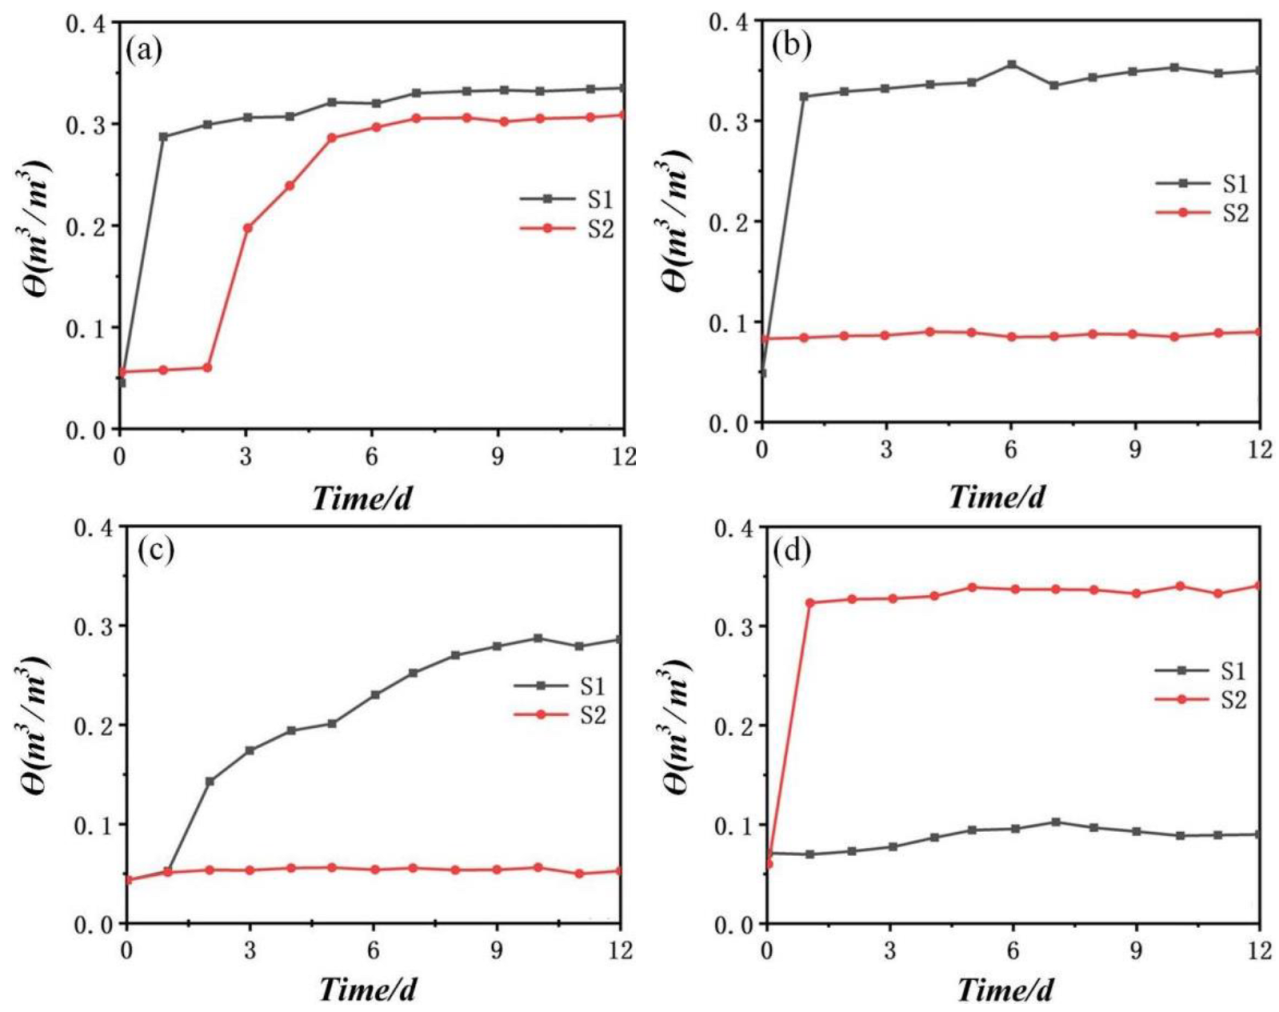
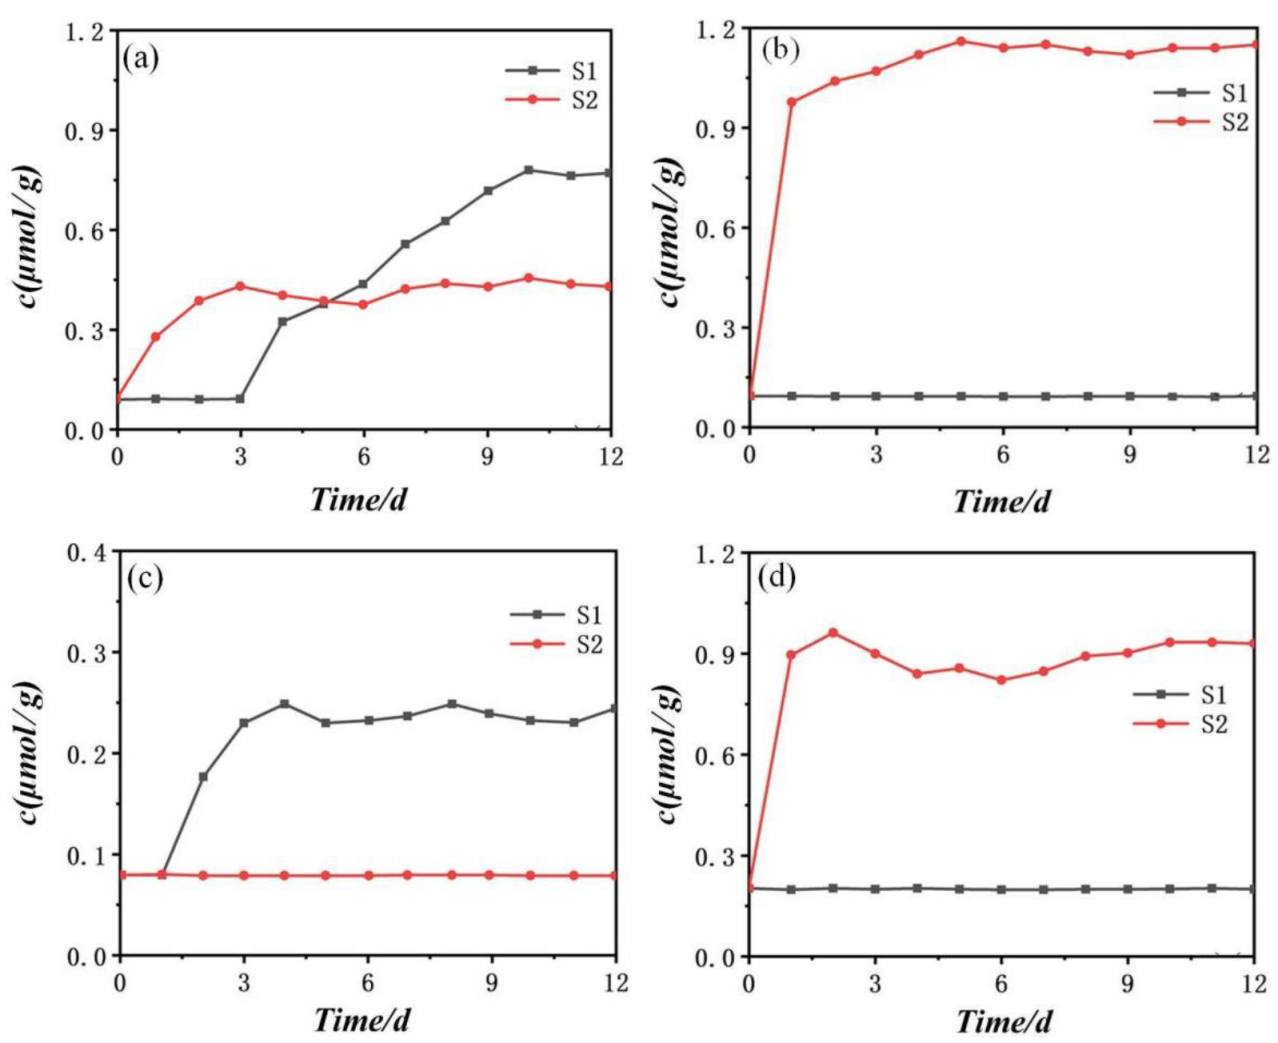
In the water-resisting and salt-resisting experiment of coated sand, the changes in water content (θ) and salt content (c) of each soil column are shown in Figure 9 and Figure 10, respectively. According to Figure 9 and comparing the water content changes of sensors under groups A, B, and D, it could be found that the water content of the three groups was almost saturated after the first day. Although the water content of the three groups rose slightly later, the change amplitude was very small. Regarding the water content of the sensors above Groups A, B, and D, Group A began to change on the second day, and the rate of change slowed down on the third day, until the water content approximately reached saturation on the sixth day. The water content of Group B and Group D had hardly changed. The slight increase in water content in Group D after 4 days was caused by a small amount of water flowing along the gap between the hydrophilic inner wall of PMMA and coated sand. The water content in the upper sensor of Group C increased slowly with the daily precipitation, while the water content in the lower sensor did not change. The change in the soil column salt content in Figure 10 was based on the change trend of water content in Figure 9. Thus, the principle that salt migration is based on water migration was completely verified to be correct.
Obviously, the three groups of soil columns with the film-coated sand layer have successfully played the role of salt resistance. The use of coated sand could completely prevent the vertical downward and horizontal migration of water and salt caused by precipitation in the soil mass and could also prevent the vertical upward migration of water and salt caused by groundwater in the soil mass. Cultural relics could be well preserved in the “safety zone” that is surrounded by coated sand.
4. Discussion and Analysis of the Numerical Simulation
4.1. Numerical Model Validation
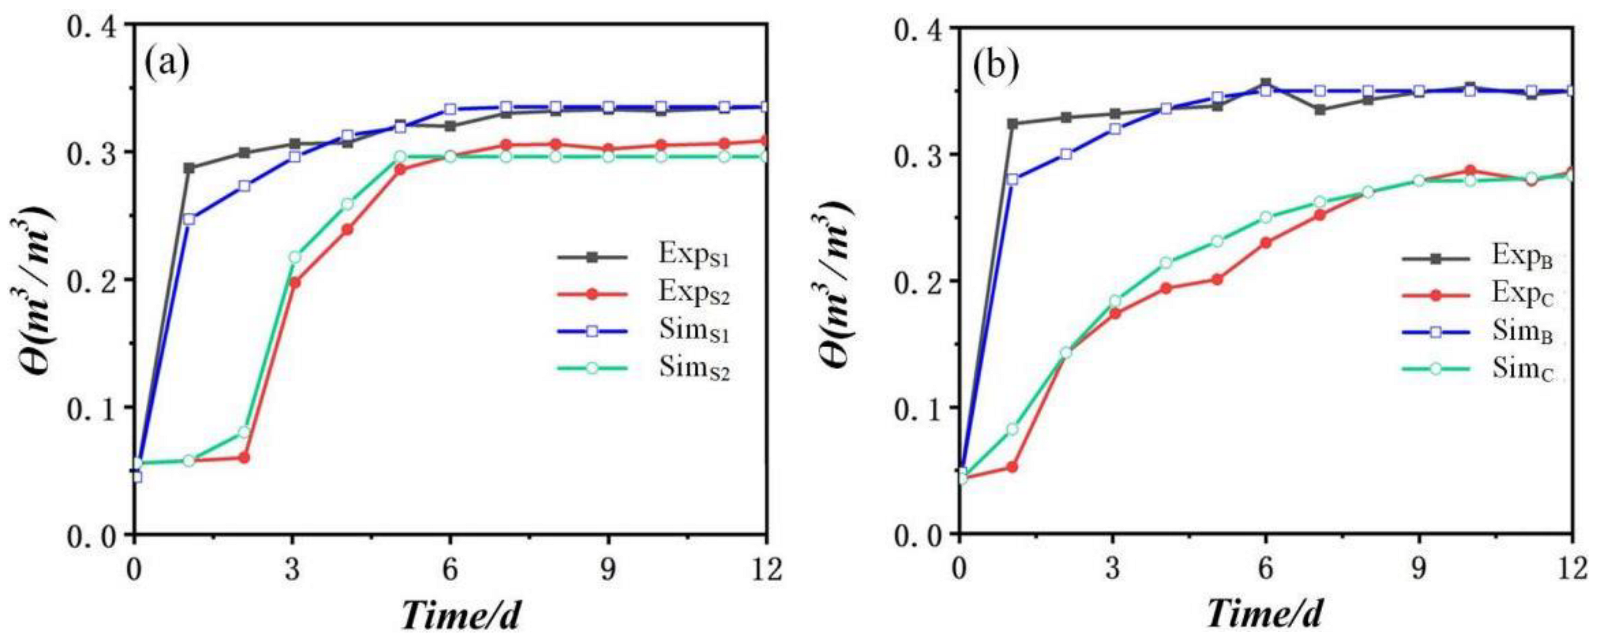
Control Group A and Coated Sand Groups B and C in the water and salt resistance experiment of the sand layer were, respectively, modeled, and the quantitative analysis and evaluation were carried out by comparing the experimental value and simulation value of the water content (w) at the sensor location. The simulation was divided into the control group model and the coated sand group model. Based on the control group model, the coated sand group model was set with a thickness of 10 cm, which was consistent with the experimental location. The simulation and measured results of the control group and the coated sand group of water content at each observation point are shown in Figure 11. The upper and lower observation points of the sand layer were referred to by the numbers S1 and S2, respectively. As the water migration of the measured and simulated results of the coated sand group did not reach the upper part of the sand layer, the experimental group only conducted comparative analysis on the monitoring results at the sensor position below the sand layer.
According to Figure 11, the numerical simulation results in this paper were in good agreement with the soil column test data, and the change trend was completely consistent. Thus, it is completely feasible to simulate the water and salt transport in soil mass with the HYDRUS numerical simulation software. As the water salt transport process was dominated by water movement, the soil salt had the effect of hydrodynamic dispersion in the soil water. In addition, the salt content in the simulation only included soluble salt content, so this part mainly focused on the simulation value of the water transport process.
4.2. Law of the Water and Salt Transport in the Soil Mass without Coated Sand
4.2.1. Influence of the Precipitation on the Soil Water and Salt Transports
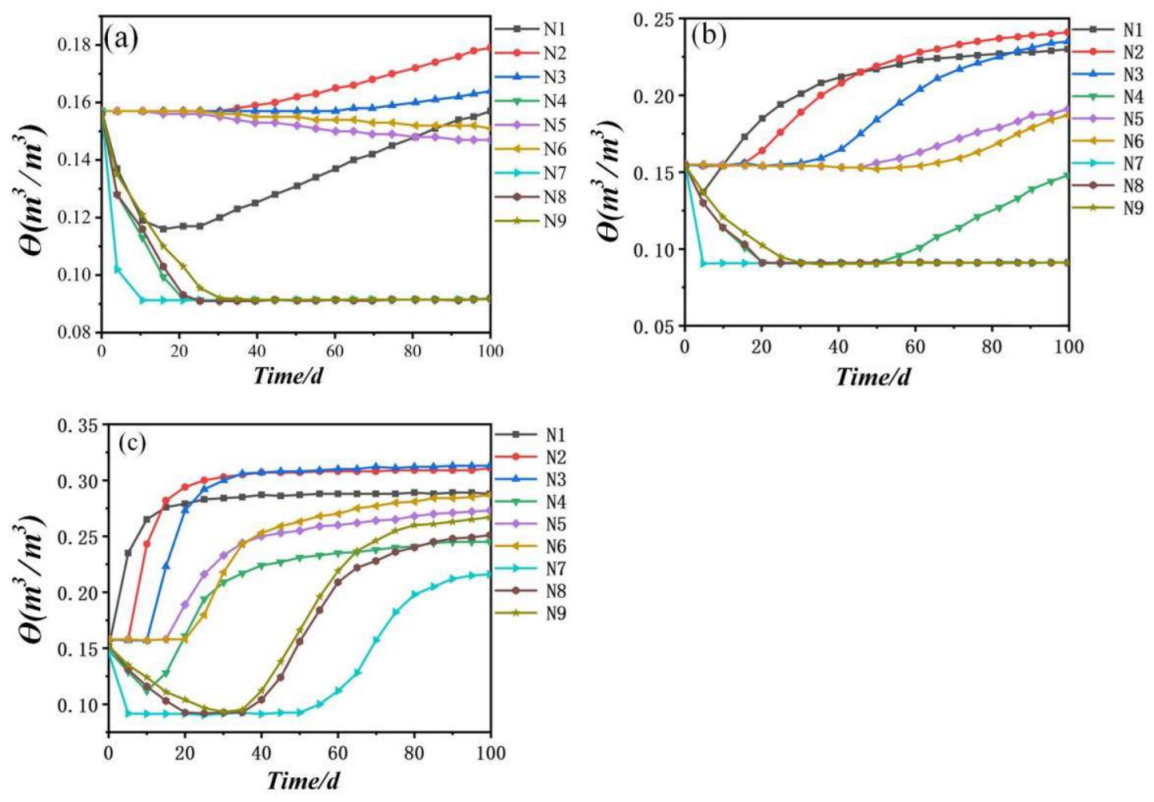
Under the condition that the indoor geometric scale remains unchanged, the daily average precipitation was set to 0.5 mm, 2 mm, and 10 mm, and then the migration rule of water salt in the soil mass under different precipitation conditions was studied. Figure 12 shows the change in N1–N9 water content at the observation point. In general, it could be observed that the water content at N1, N2, and N3 of the first column of observation points was generally greater than that at N4, N5, and N6, and then greater than that at N7, N8, and N9. This was because the vertical migration rate of water in the soil was greater than the horizontal migration rate after rainfall. Regarding the observation points N1, N4, and N7 in the first row, we found that the water content of these three points would decrease at the initial stage of simulation and increase with an increasing daily average precipitation at the later stage of the simulation. As the horizontal migration of water lagged the vertical migration and the three points were in the atmospheric boundary of soil surface water evaporation, the water content at these three points decreased at the initial stage of simulation.
Comparing the three figures in Figure 12a–c, it could be found that the horizontal and vertical migration of water were greatly promoted after the increase in the precipitation. When the precipitation was very small, the horizontal migration of water was not significant. Even after the precipitation increased, the horizontal migration of water was still far less than the vertical migration. Therefore, it was completely feasible to stop the horizontal migration of water by adding coated sand to the soil.
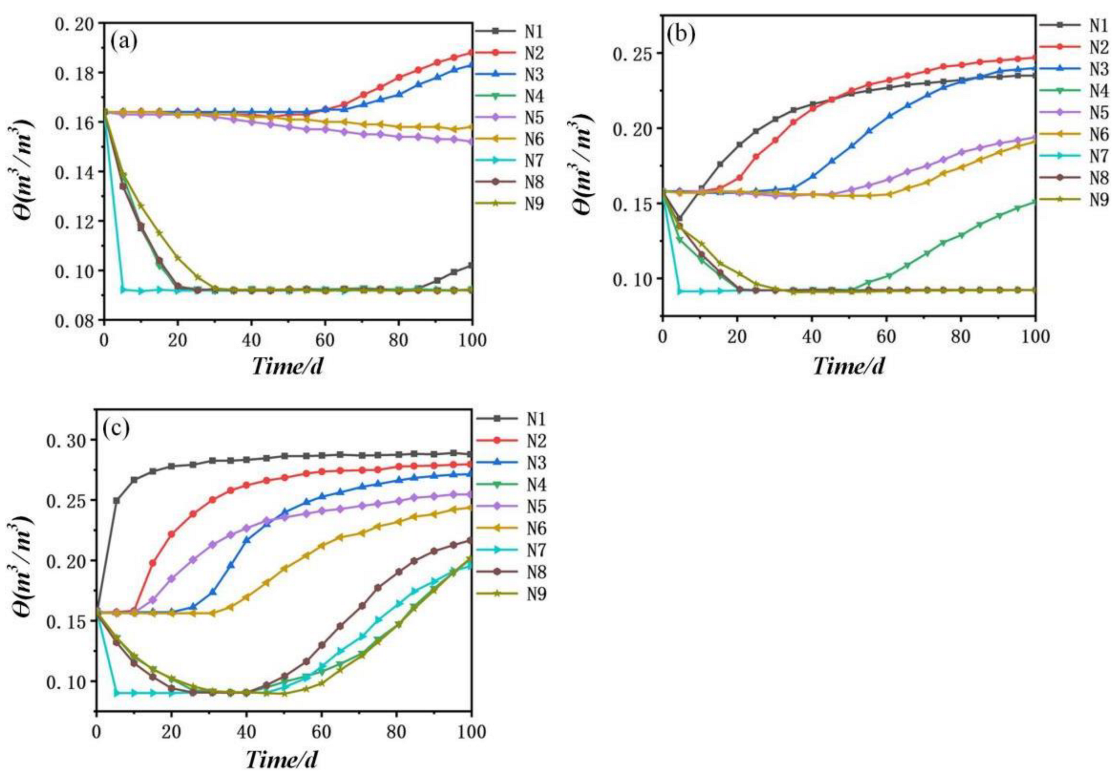
4.2.2. Influence of the Geometric Scale (L) on the Soil Water and Salt Transports
Working Condition 2 simulated the influence of different indoor geometric scales on the migration of water and salt in the soil mass after the indoor geometric scales were set to 120 cm, 75 cm, and 40 cm under the condition that the daily average precipitation was kept at a constant value of 2 mm. Figure 13 shows the changes in the N1–N9 water content at the observation points. According to Figure 13, regarding the longitudinal observation points N1, N2, and N3, the water content of these three points increased rapidly after the daily average precipitation increases as these three points were closest to the precipitation area. After comparing the three figures, it was found that after changing the indoor geometric scale, the maximum value of the soil moisture would change, and the distribution area of water content would also change. Obviously, the shorter the indoor geometric scale was, the faster the horizontal and vertical migration of water would be, and the larger the area with large water content in the soil would be. As the salt migrates with water, the peak value of the salt concentration on the soil surface would become larger after the indoor geometric scale decreases. Therefore, when designing the museum, the indoor length should be increased as much as possible to maintain the precipitation away from the pits.
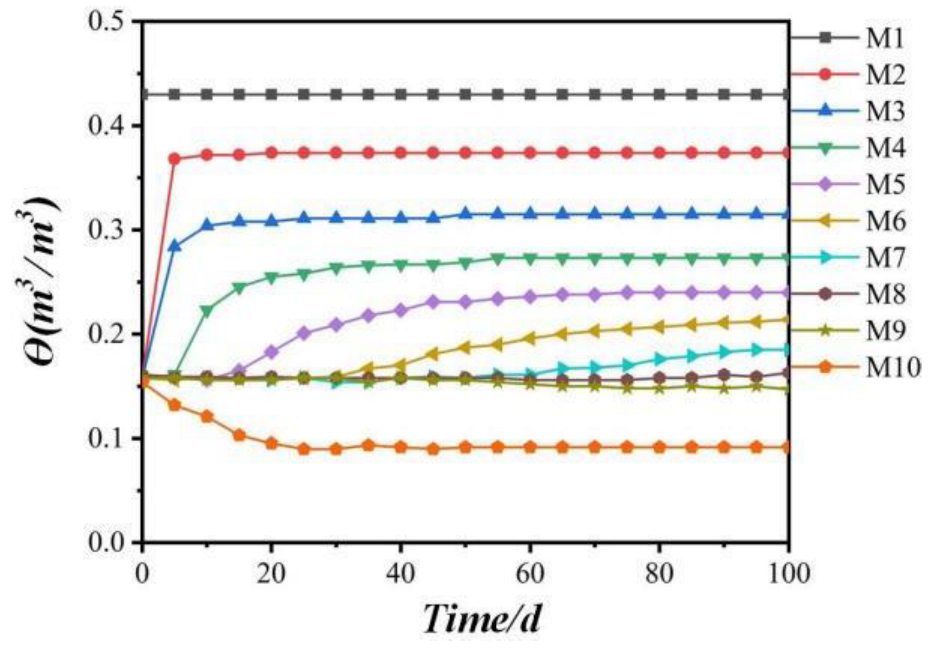
4.2.3. Influence Law of Groundwater on the Soil Water and Salt Transports
Working Condition 3 simulated the migration rule of water and salt in soil under the influence of groundwater. Figure 14 shows the change in water content value of M1–M10 at the observation points. According to Figure 14, Observation Point M1 was within the range of groundwater and had a high water content that was unchanged. The longitudinal distance between the observation points M8, M9, and M10 and the groundwater area was too far, and no water arrived within 100 days. Thus, the water content was reduced due to evaporation. The water content of other points was increased due to the vertical upward migration of groundwater.
Therefore, the impact of groundwater migration on the cultural relics could not be ignored. As time goes on, water would carry salt to the surface of the cultural relics, causing damage. Therefore, it was necessary to add coated sand to the soil to prevent the vertical upward migration of groundwater.
4.3. Analysis on the Research Results of the Water and Salt Resistances of Coated Sand
4.3.1. Analysis on the Research Results of the Water and Salt Resistances of Coated Sand under Precipitation
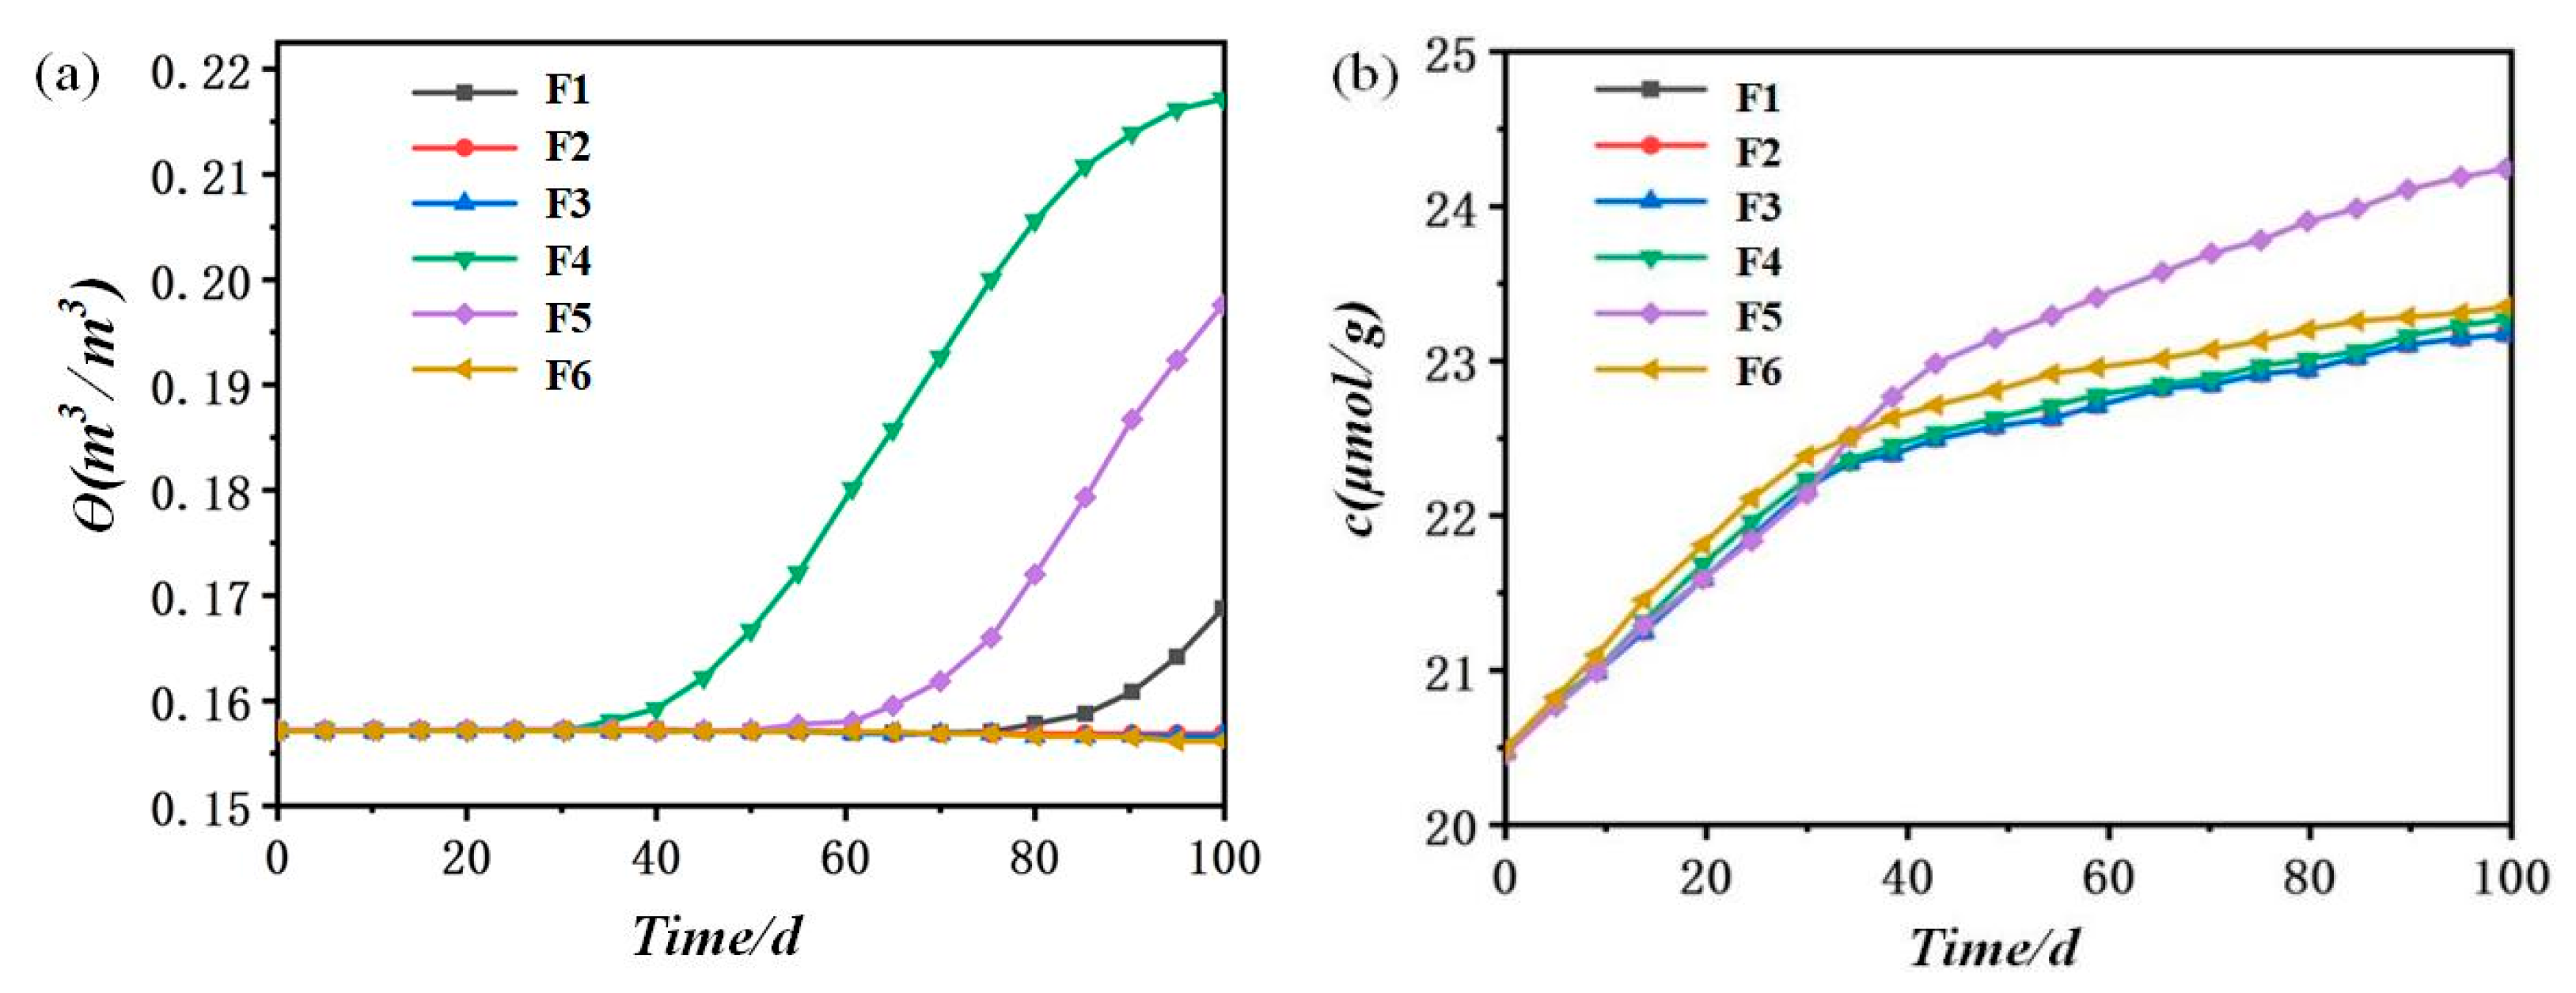
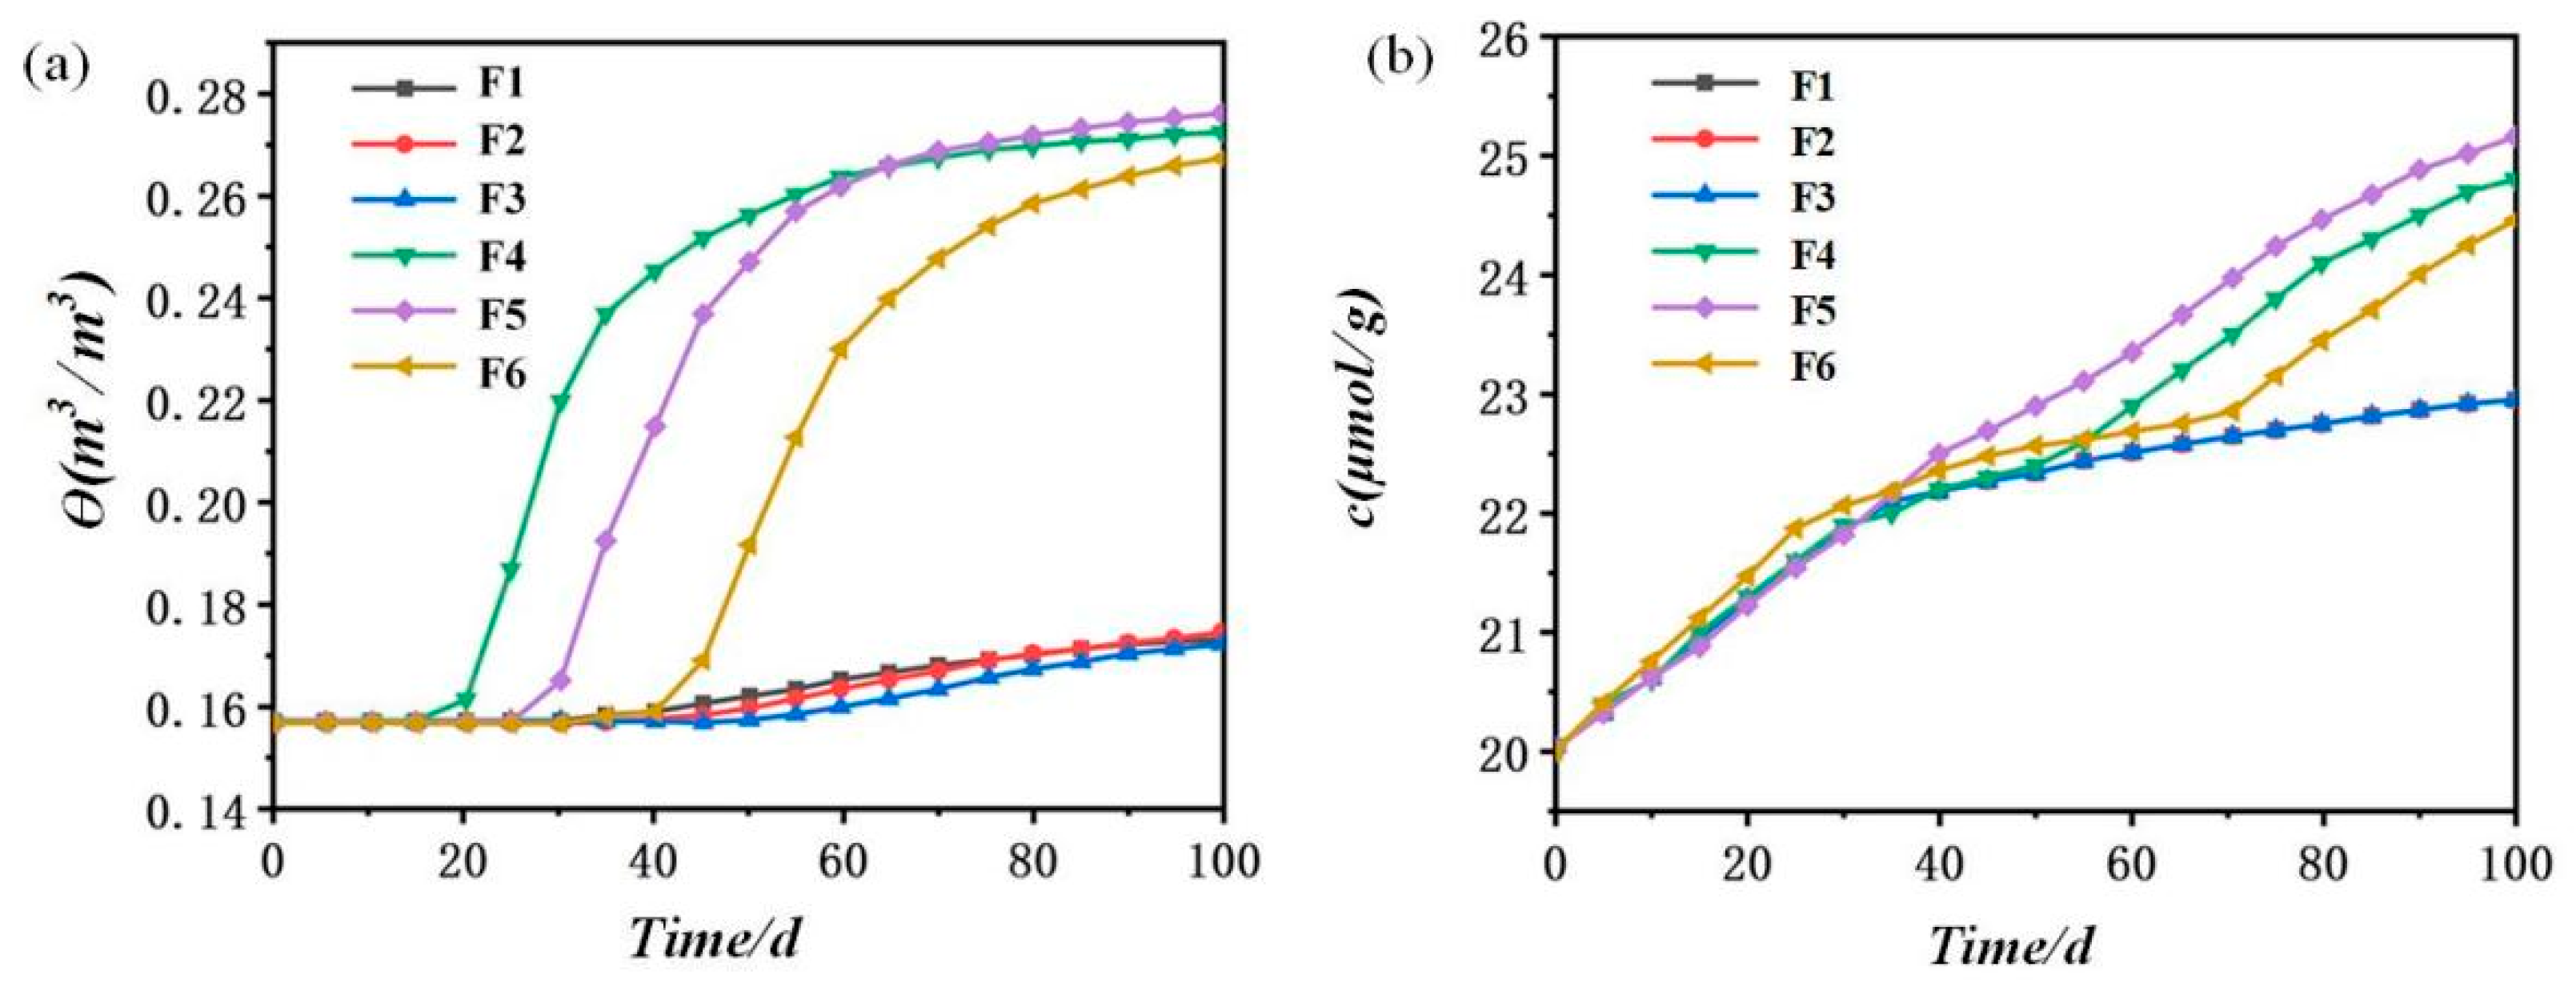
Working Condition 4 simulated the blocking effect of coated sand on the migration of water and salt in the soil mass under different precipitation conditions after setting the average daily precipitation to 2 mm, 5 mm, and 8 mm, while maintaining an unchanged indoor geometric scale when inserting coated sand with a thickness of 10 cm. Figure 15, Figure 16 and Figure 17 show the changes in the water content and salt content of Observation Points F1–F6.
As shown in Figure 15, Figure 16 and Figure 17 the water content and salt content of Observation Points F1, F2, and F3 in the left soil mass with coated sand were significantly lower than those of Observation Points F4, F5, and F6 in the control group. When the daily precipitation was 2 mm, the water content of F1, F2, and F3 basically did not change with time, because evaporation tended to decrease. When the daily precipitation increased to 5 mm and 8 mm, the water content rose slightly after 30~40 days of simulation.
4.3.2. Analysis on the Research Results of the Water and Salt Resistances of Coated Sand under the Condition of Groundwater
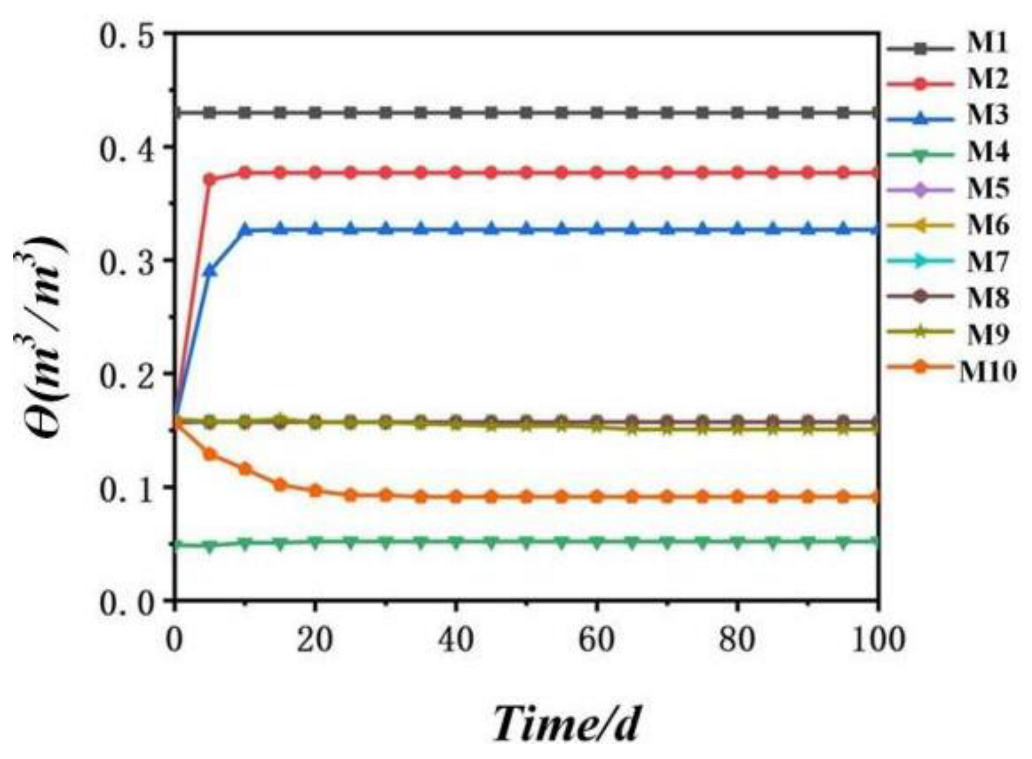
Working Condition 5 simulated the blocking effect of coated sand on the migration of water and salt in the soil in the presence of groundwater when the embedded thickness of coated sand was 10 cm. Figure 18 shows the changes in the water content and salt content at Observation Points M1–M10.
As shown in Figure 18, the observation point was analyzed from low to high. Observation Point M1 was located in the groundwater area, and the water content was the highest and remained unchanged. As Observation Points M2 and M3 were located at the lower part of the film-coated sand layer with normal water migration, the water content increased. Observation Point M4 was located in the coated sand layer, and the water content was almost 0. The water contents of Observation Points M5, M6, M7, and M8 were almost unchanged. The water contents of Observation Points M9 and M10 decreased due to the influence of the evaporation area.
In a word, light rain refers to the average daily precipitation of 0.1~10 mm, and moderate rain refers to the average daily precipitation of 0.1~25 mm. For studying the effect of the water and salt resistances of coated sand by changing the daily precipitation, the coated sand with a thickness of 10 cm could prevent the migration of light rain and some moderate rain for at least 30 days, and could also prevent the migration of salt along with the water level. Although the water-blocking capacity of coated sand was not unlimited, and a small amount of water would pass through the coated sand when the precipitation was too large, it was completely feasible to use coated sand to protect cultural relics during actual precipitation. In addition, the application of coated sand was still feasible for the numerical simulation study of coated sand to prevent groundwater.
5. Conclusions
In this paper, the salt damage of earthen relics is considered the research object to study the water and salt migration laws under the conditions of precipitation and groundwater. Moreover, the Terra Cotta Warriors Museum of the Qin Dynasty is taken as the realistic foundation to study the water and salt resistance performance of coated sand. Finally, the indoor soil column experiment and numerical simulation are taken as the research methods to analyze and evaluate the mechanism and feasibility of the proposed water and salt resistances of coated sand. The main conclusions obtained from the above research are as follows.
- (1)
- The root cause of salt damage in earthen sites was the horizontal and vertical migration of water and salt in the soil. By taking advantage of the water-blocking feature of coated sand, the coated sand was inserted into the soil mass where the cultural relics were located to prevent water migration. As water is the carrier of salt migration, the salt could not reach the surface of the cultural relics and separated. Thus, almost no disease could be caused.
- (2)
- In the water-resisting and salt-resisting experiments of coated sand, setting a coated sand layer in the soil column could completely stop the continuous vertical and horizontal migration of water and salt. At the same time, the salt could not pass through the coated sand layer and remained at the interface between the coated sand layer and the soil. Thus, the phenomenon of salt enrichment in the surface soil and the destruction of cultural relics could be avoided. By using coated sand, we could completely prevent the vertical downward and horizontal migration of water and salt caused by precipitation in the soil mass and prevent the vertical upward migration of water and salt caused by groundwater in the soil mass. Cultural relics could be well preserved in the “safety zone” surrounded by coated sand.
- (3)
- In the numerical simulation study on the characteristics of water and salt migrations, it was found that the longitudinal migration rate of water in the soil was significantly higher than the transverse migration rate when water infiltrated into the soil after rainfall. When other conditions remained unchanged and the precipitation increased, the horizontal and vertical migrations of water were greatly promoted. The salt was mostly concentrated in the edge of the soil. With the increase in precipitation and the reduction in indoor geometric scale, the salt content enriched in the surface soil and the side wall would increase. Because the size of the indoor geometric scale had a great impact on the results of water and salt migrations, the indoor geometric scale could be increased as much as possible when the museum was established.
- (4)
- In the numerical simulation study of water and salt resistances of coated sand, the same results as those of the specific experiments appeared. The coated sand could completely block the horizontal and vertical migration of water and salt in the soil. Even though there was a critical value for the water and salt resistances of coated sand, there was no problem in dealing with continuous rain in reality. It was completely feasible to protect cultural relics by adding coated sand to the soil around them.
The technology and method of film-coated sand protection for earthen relics mentioned in this paper provide a feasible method for the protection of cultural relics in our country. Due to the irreversibility of the occurrence of salt damage in earthen sites, the timely implementation of preventive protection measures is better than the control measures after the occurrence of salt damage. The coated sand layer can achieve the ideal effect of water resistance and salt resistance. However, because the upper soil sites are faced with the threat of dry cracking, drying, and other soil site diseases, it is necessary to continue to search for new measures to be combined with the film-coated sand water resistance and salt resistance measures.
Author Contributions
Conceptualization, W.X., X.L., B.C., Y.Z. and Z.G.; methodology, W.X., B.C. and X.L.; software, W.X.; writing—original draft preparation, W.X. and X.L.; writing—review and editing, W.X., X.L. and C.W.Y. All authors have read and agreed to the published version of the manuscript.
Funding
This work was funded by the National Natural Science Foundation of China (52078417).
Institutional Review Board Statement
Not applicable.
Informed Consent Statement
Not applicable.
Data Availability Statement
Not applicable.
Acknowledgments
We are sincerely grateful for all the help given by Xia Yin (Emperor Qin’s Mausoleum Site Museum) for his constructive suggestions in the manuscript preparation, and He Wen (Xi’an Jiaotong University) for their help in the environmental monitoring.
Conflicts of Interest
The authors declare no conflict of interest.
Abbreviations
| Original Vocabulary | Abbreviations or Symbols |
| Salt content | c |
| Soil water conductivity | Ks |
| Indoor geometric scale | L |
| Potassium silicate | PS |
| Water content | θ |
| Saturated water content | |
| mass water content | |
| Residual water content |
References
- Zhan, C.F.; Gang, T.J. Study Report on Protection of Earthen Sites, 1st ed.; Cultural Relics Press: Beijing, China, 2010; pp. 12–45. [Google Scholar]
- Sun, M.L.; Wang, X.D.; Li, Z.X. Preliminary Discussion on Soil Site Protection, 1st ed.; Science Press: Beijing, China, 2010; pp. 32–101. [Google Scholar]
- Yang, Q.Y. The Impact of Environmental Factors on Danfengmen Site of Daming Palace. Master’s Thesis, Northwestern University, Xi’an, China, 2012. [Google Scholar]
- Liu, X.Y. Formation Mechanism and Simulation of Salt Damage in the Burial Pit of Emperor Qin Shihuang K9901. Master’s Thesis, Northwest A&F University, Xi’an, China, 2015. [Google Scholar]
- Elert, K.; Bel-Anzue, P.; Monasterio-Guillot, L.; Pardo, S. Performance of alkaline activation for the consolidation of earthen architecture. J. Cult. Herit. 2019, 39, 93–102. [Google Scholar] [CrossRef]
- Espinosa, R.M.; Franke, L.; Deckelmann, G. Model for the mechanical stress due to the salt crystallization in porous materials. Constr. Build. Mater. 2008, 22, 1350–1367. [Google Scholar] [CrossRef]
- Steiger, M. Crystal growth in porous materials—II: Influence of crystal size on the crystallization pressure. J. Cryst. Growth 2005, 282, 470–481. [Google Scholar] [CrossRef]
- Flatt, R.J. Salt damage in porous materials: How high supersaturations are generated. J. Cryst. Growth 2002, 242, 435–454. [Google Scholar] [CrossRef]
- Watt, D.; Colston, B. Investigating the effects of humidity and salt crystallisation on medieval masonry. Build. Environ. 2000, 35, 737–749. [Google Scholar] [CrossRef]
- Zehnder, K. Long-term monitoring of wall paintings affected by soluble salts. Environ. Geol. 2007, 52, 353–367. [Google Scholar] [CrossRef]
- Qian, L.; Xia, Y.; Hu, H.Y. Application of composite starch and acrylamide polymer in desalination of Qin Shihuang Mausoleum and Hanyang Mausoleum sites. Anal. Meas. Technol. Instrum. 2016, 22, 140–147. (In Chinese) [Google Scholar] [CrossRef]
- Yan, G.S. Study on Deterioration Mechanism and Material Durability of Soil Cultural Relics in Arid Area. Ph.D. Thesis, Lanzhou University, Lanzhou, China, 2011. [Google Scholar]
- Zhang, H.Y.; Yan, L.; Wang, J.F. Study on mechanism of salt transport by capillary water to soil cultural relics. In Proceedings of the 2008 International Symposium on Preservation of Ancient Sites and Regional Symposium of International Society of Rock Mechanics, Dunhuang, China, 24 September 2008. [Google Scholar]
- Wang, X.D.; Zhang, B.; Pei, Q.Q.; Guo, Q.L.; Chen, W.W.; Li, F.J. Experimental studies on sacrificial layer in conservation of earthen sites. J. Cult. Herit. 2020, 41, 74–83. [Google Scholar] [CrossRef]
- Li, Z.; Wang, X.; Sun, M. Conservation of Jiaohe ancient earthen site in China. J. Rock Mech. Geotech. Eng. 2011, 3, 270–281. [Google Scholar] [CrossRef] [Green Version]
- Chen, W.W.; Zhang, Q.Y.; Liu, H.W.; Guo, Z.Q. Feasibility of protecting earthen sites by infiltration of modified polyvinyl alcohol. Constr. Build. Mater. 2019, 204, 410–418. [Google Scholar] [CrossRef]
- Chen, Y.M. Inhibitor Effect of Diethylenetriamine Pentamethylphosphonic Acid on Sodium Sulfate Damage in Rammed Earth. Master’s Thesis, Northwestern University, Xi’an, China, 2017. [Google Scholar]
- Qian, L.; Xia, Y.; Hu, H.Y.; Zhang, S.X.; Lv, G.X.; Zhou, T. Polymer materials used in soil relics desalination. Chem. Res. Appl. 2014, 12, 1839–1845. [Google Scholar] [CrossRef]
- Yang, M.N.; Yang, Q.L.; Huang, S.P.; Li, Y.H. Research progress and development trend of salt suppression and protection of soil sites. Silk Road 2011, 2, 30–32. (In Chinese) [Google Scholar] [CrossRef]
- Wang, S.J.; Zhang, B.J.; Wu, J. Feasibility study on air-liquid variable water replenishment for indoor soil sites: A case study of Xiaoshan Kuahuqiao Site Museum in Hangzhou. Conserv. Archaeol. Sci. 2019, 31, 16–25. (In Chinese) [Google Scholar] [CrossRef]
- Zhang, J.F. Discussion on desalting method of soil site. Sci. Res. Chin. Cult. Relics 2016, 1, 52–58. (In Chinese) [Google Scholar] [CrossRef]
- Products: Coated Sands. Available online: https://www.ha-group.com/en/products-and-services/products/resin-coated-sands/ (accessed on 19 January 2023).
- Fu, Y.L. Application of test data to evaluation of coated sand fracturing. Pet. Tubing. Instrum. 2015, 1, 51–53. [Google Scholar] [CrossRef]
- Yang, Y.J. Study on Oil-Water Two-Phase Seepage Characteristics of Superhydrophobic Film Coated Sand. Master’s Thesis, China University of Petroleum (East China), Qingdao, China, 2017. [Google Scholar]
- Zhang, C.H. Discussion on the adaptability of coated sand controlled water fracturing technology in peripheral oil fields. J. Daqing Norm. Univ. 2012, 32, 120–124. [Google Scholar] [CrossRef]
- Rakshita, M.; Babu, A.; Jayanthi, K.; Bathula, S.; Uday, K.K.; Haranath, D. Studies on contact angle measurements in superoleophobic aluminum hydroxide nanoflakes. Mater. Lett. 2022, 315, 131938. [Google Scholar] [CrossRef]
- Lv, G.X.; Zhang, S.X.; Qian, L.; Xia, Y.; Hu, H.Y.; Rong, B.; Zhou, T. Characteristics and desalinization of soluble salt in the site of Emperor Qin Shi Huang’s Mausoleum. J. Nat. 2015, 37, 341–347. (In Chinese) [Google Scholar] [CrossRef]
- Richards, L.A. Capillary conduction of liquids through porous mediums. Physics 1931, 1, 318–333. [Google Scholar] [CrossRef]
- Samani, S.; Ye, M.; Zhang, F.; Pei, Y.Z.; Tang, G.P.; Elshall, A.; Moghaddam, A.A. Impacts of prior parameter distributions on Bayesian evaluation of groundwater model complexity. Water Sci. Eng. 2018, 11, 5–16. [Google Scholar] [CrossRef]
- Biggar, J.W.; Nielsen, D.R. Miscible Displacement: V. Exchange Processes. Soil Sci. Soc. Am. J. 1963, 27, 623–627. [Google Scholar] [CrossRef]
- Langmuir, I. The adsorption of gases on plane surfaces of glass, mica and platinum. J. Am. Chem. Soc. 1918, 40, 1361–1403. [Google Scholar] [CrossRef] [Green Version]
- Selker, J.; Stewart, R. Soil Physics with HYDRUS: Modeling and Applications. Vadose Zone J. 2011, 10, 1338–1339. [Google Scholar] [CrossRef]
- Allen, R.G.; Pruitt, W.O.; Wright, J.L.; Howell, T.A.; Ventura, F.; Snyder, R.; Itenfisu, D.; Steduto, P.; Berengena, J.; Yrisarry, J.B.; et al. A recommendation on standardized surface resistance for hourly calculation of reference ET by the FAO56 Penman-Monteith method. Agric. Water Manag. 2006, 81, 1–22. [Google Scholar] [CrossRef]
- Wen, H. Study on the Mechanism of Water Replenishment and Salt Inhibition for Soil Site Salt Damage Control. Master’s Thesis, Xi’an Jiaotong University, Xi’an, China, 2019. [Google Scholar]
- Schaap, M.G.; Leij, F.J.; van Genuchten, M.T. Rosetta: A computer program for estimating soil hydraulic parameters with hierarchical pedotransfer functions. J. Hydrol. 2001, 251, 163–176. [Google Scholar] [CrossRef]
Figure 1.
Salt damage to earthen sites. (a) Tang and Song Dynasty neighborhood sites in Jiangnanguan street, Chengdu; (b) Banpo Site.
Figure 1.
Salt damage to earthen sites. (a) Tang and Song Dynasty neighborhood sites in Jiangnanguan street, Chengdu; (b) Banpo Site.

Figure 2.
Coated sand protects the soil sites with water and a salt barrier. (a) Current situation of water and salt migration in library earth sites. (b) Results of water and salt resistance of coated sand.
Figure 2.
Coated sand protects the soil sites with water and a salt barrier. (a) Current situation of water and salt migration in library earth sites. (b) Results of water and salt resistance of coated sand.

Figure 3.
Water and salt resistance test system of coated sand. (a) Schematic diagram of the experimental setup. (b) The experiment site (A,B,C,D).
Figure 3.
Water and salt resistance test system of coated sand. (a) Schematic diagram of the experimental setup. (b) The experiment site (A,B,C,D).

Figure 4.
Combined with the Terra Cotta Warriors Site Museum modeling. (a) Exhibition Hall of Terra Cotta Warriors. (b) Schematic diagram of water and salt migration. (c) Profile of water and salt migration hindered by coated sand model.
Figure 4.
Combined with the Terra Cotta Warriors Site Museum modeling. (a) Exhibition Hall of Terra Cotta Warriors. (b) Schematic diagram of water and salt migration. (c) Profile of water and salt migration hindered by coated sand model.

Figure 5.
Boundary conditions.

Figure 6.
Soil particle size distribution map.

Figure 7.
Soil water characteristic curve.

Figure 8.
Diagram of observation points. (a) Observation point of simulated water and salt migration law. (b) Observation point of water and salt resistances of coated sand is simulated.
Figure 8.
Diagram of observation points. (a) Observation point of simulated water and salt migration law. (b) Observation point of water and salt resistances of coated sand is simulated.

Figure 9.
Changes in the moisture content at the soil column sensor position with time. (a) Group A; (b) Group B; (c) Group C; (d) Group D.
Figure 9.
Changes in the moisture content at the soil column sensor position with time. (a) Group A; (b) Group B; (c) Group C; (d) Group D.

Figure 10.
Changes in the salt content at soil column sensor with time. (a) Group A; (b) Group B; (c) Group C; (d) Group D.
Figure 10.
Changes in the salt content at soil column sensor with time. (a) Group A; (b) Group B; (c) Group C; (d) Group D.

Figure 11.
Numerical simulation validation. (a) Control group validation. (b) Coated sand salt resistant group.
Figure 11.
Numerical simulation validation. (a) Control group validation. (b) Coated sand salt resistant group.

Figure 12.
Influence of the daily average precipitation on the water content change at the observation points. (a) 0.5 mm; (b) 2 mm; (c) 10 m.
Figure 12.
Influence of the daily average precipitation on the water content change at the observation points. (a) 0.5 mm; (b) 2 mm; (c) 10 m.

Figure 13.
Influence of the indoor geometric scale on the water content change at the observation points. (a) 120 cm; (b) 75 cm; (c) 40 cm.
Figure 13.
Influence of the indoor geometric scale on the water content change at the observation points. (a) 120 cm; (b) 75 cm; (c) 40 cm.

Figure 14.
Influence of groundwater on the change in the water content at the observation point.

Figure 15.
Changes in the observation data with time when the daily precipitation was 2 mm. (a) Water content. (b) Salt content.
Figure 15.
Changes in the observation data with time when the daily precipitation was 2 mm. (a) Water content. (b) Salt content.

Figure 16.
Changes in the observation data with time when the daily precipitation was 5 mm. (a) Water content. (b) Salt content.
Figure 16.
Changes in the observation data with time when the daily precipitation was 5 mm. (a) Water content. (b) Salt content.

Figure 17.
Changes in the observation data with time when the daily precipitation was 8 mm. (a) Water content. (b) Salt content.
Figure 17.
Changes in the observation data with time when the daily precipitation was 8 mm. (a) Water content. (b) Salt content.

Figure 18.
Changes in the water content at the observation points with time in the presence of groundwater.
Figure 18.
Changes in the water content at the observation points with time in the presence of groundwater.


Table 1.
Relationship between the contact angle θ and water transfer characteristics.
| Conditions | The Migration Characteristics |
|---|---|
| θ = 0 | All water can easily move freely between soil particles |
| θ < 90° | Some or a small amount of water can move freely between soil particle gap |
| θ = 90° | It is the boundary between wettability and non-wettability, i.e., the critical value of whether water can move in the soil particle gap |
| θ > 90° | No wetting, almost no water can move in the soil particle gap |
| θ = 180° | It is completely not wet, and all water cannot pass through the soil particle gap. Only when a large pressure is applied can there be water migration |
Table 2.
Technical indexes of 5TE sensor measurement parameters.
| Measuring Parameters | Range | Resolution Ratio | Accuracy |
|---|---|---|---|
| Volume moisture content (m3/m3) | 0–1 | 0.0008 | 0.03 |
| Conductivity (dS/m) | 0–23 | 0.01 | ±10% |
Table 3.
Experimental grouping settings.
| Working Condition | Control Group A | Experimental Group B | Experimental Group C | Experimental Group D |
|---|---|---|---|---|
| Picture |  |  |  |  |
| Description | Simulating the groundwater rise | Simulating the coated sand preventing the vertical upward migration of groundwater | Simulating the coated sand preventing the vertical migration of precipitation | Simulating the coated sand preventing horizontal migration of precipitation |
Table 4.
Test Simulation Conditions.
| Scene | Simulated Working Conditions | Study Variables | Variable Value | Other Parameter Settings |
|---|---|---|---|---|
| Simulation of water and salt transport characteristics in soil without coated sand | Condition 1 | Precipitation | 0.5 mm, 2 mm, 10 mm | L = 75 cm |
| Condition 2 | Indoor geometric scale (L) | 120 cm, 75 cm, 40 cm | The precipitation was 2 mm | |
| Condition 3 | Groundwater | Fixed value 75 cm | The precipitation was 0 | |
| Simulation of water and salt resistance of coated sand | Condition 4 | Precipitation | 2 mm, 5 mm | L = 75 cm |
| Condition 5 | Groundwater | Fixed value 75 cm | The precipitation was 0 |
Table 5.
Test Simulation Conditions.
| Hydraulic Parameter | /l·cm−3 | n | Ks/cm·d−1 | ||
|---|---|---|---|---|---|
| Experimental soil | 0.040 | 0.349 | 0.035 | 1.367 | 0.015 |
Table 6.
Setting of simulated observation points for each simulated working condition.
| Simulated Working Conditions | Observation Point | Distance between Two Points | |
|---|---|---|---|
| Simulation of water and salt transport characteristics in soil without coated sand | Condition 1 | N1-N9 | 35 cm |
| Condition 2 | N1-N9 | 35 cm | |
| Condition 3 | M1-M10 | 22 cm | |
| Simulation of water and salt resistance of coated sand | Condition 4 | F1-F6 | 30 cm |
| Condition 5 | M1-M10 | 22 cm |
Disclaimer/Publisher’s Note: The statements, opinions and data contained in all publications are solely those of the individual author(s) and contributor(s) and not of MDPI and/or the editor(s). MDPI and/or the editor(s) disclaim responsibility for any injury to people or property resulting from any ideas, methods, instructions or products referred to in the content. |
© 2023 by the authors. Licensee MDPI, Basel, Switzerland. This article is an open access article distributed under the terms and conditions of the Creative Commons Attribution (CC BY) license (https://creativecommons.org/licenses/by/4.0/).
Share and Cite
MDPI and ACS Style
Xu, W.; Chang, B.; Zhang, Y.; Gu, Z.; Yu, C.W.; Luo, X. Study on Barriers of Water Salt Transfers in Earthen Sites by Plastic-Coated Sand. Atmosphere 2023, 14, 236. https://doi.org/10.3390/atmos14020236
AMA Style
Xu W, Chang B, Zhang Y, Gu Z, Yu CW, Luo X. Study on Barriers of Water Salt Transfers in Earthen Sites by Plastic-Coated Sand. Atmosphere. 2023; 14(2):236. https://doi.org/10.3390/atmos14020236
Chicago/Turabian StyleXu, Wen, Bin Chang, Yunwei Zhang, Zhaolin Gu, Chuck Wah Yu, and Xilian Luo. 2023. "Study on Barriers of Water Salt Transfers in Earthen Sites by Plastic-Coated Sand" Atmosphere 14, no. 2: 236. https://doi.org/10.3390/atmos14020236
Note that from the first issue of 2016, this journal uses article numbers instead of page numbers. See further details here.