Article

Changes in the Spatiotemporal of Net Primary Productivity in the Conventional Lake Chad Basin between 2001 and 2020 Based on CASA Model

1
National Engineering Research Center for Desert-Oasis Ecological Construction, Xinjiang Institute of Ecology and Geography, Chinese Academy of Sciences, Urumqi 830011, China
2
University of Chinese Academy of Sciences, Beijing 100049, China
3
National Key Laboratory of Arid Area Ecological Security and Sustainable Development, Xinjiang Institute of Ecology and Geography, Chinese Academy of Sciences, Urumqi 830011, China
*
Author to whom correspondence should be addressed.
These authors contributed equally to this work.
Atmosphere 2023, 14(2), 232; https://doi.org/10.3390/atmos14020232
Submission received: 8 December 2022 / Revised: 18 January 2023 / Accepted: 19 January 2023 / Published: 24 January 2023
(This article belongs to the Special Issue Monitoring and Evaluation of Drought in Arid Areas)

Abstract

:
Accurate estimation of vegetation Net Primary Productivity (NPP) has important theoretical and practical significance for ecological environment governance, carbon cycle research, and the rational development and utilization of natural resources. In this study, the spatial characteristics, temporal changes, and driving factors of NPP in the Conventional Lake Chad Basin (CLCB) were based on MODIS data by constructing a Carnegie Ames Stanford Approach (CASA) model and using a combination of Residual trends (RESTREND) and correlation analysis. The results showed that from 2001 to 2020, the NPP of the CLCB decreased annually (1.14 g C/m2), mainly because of overgrazing, deforestation, and large-scale irrigation. We conducted a driving factor analysis and found that the main influencing factor of the NPP of the CLCB is high-intensity human activities, including farmland reclamation and animal husbandry. Although the impact of climate change on NPP is not obvious in the short term, climate change may help recover NPP in the long term. The continued reduction in NPP has greatly increased the difficulty of regreening the Sahel; the increase in population density and rapid urbanization have led are major contributing factors to this. Our findings have important implications for the continued implementation of stringent revegetation policies. However, owing to limited data and methods, only the overall change trend of NPP was obtained, and comprehensive follow-up studies are needed.

1. Introduction

Vegetation net primary productivity (NPP), which refers to the net accumulation of organic matter produced by photosynthesis per unit area of green plants [1], is not only a key indicator for considering climate change but also an important factor reflecting vegetation activities [2,3]. In addition, the study of NPP is of great significance for the rational use of vegetation resources, development of vegetation production potential, and realization of maximum vegetation yield [4,5]. NPP is affected by human and natural factors, and climate change is one of the primary drivers of interannual fluctuations in NPP [6]. The 2021 Sixth Assessment Report of the Intergovernmental Panel on Climate Change (IPCC) concluded that average global land and ocean temperatures have increased by approximately 1.09 °C over the past decade (2011–2020) compared to the period 1850–1900, and the temperature increase is particularly obvious in arid and semi-arid regions [7]. Therefore, exploring the spatiotemporal variability of ecosystem NPP and its driving mechanisms under climate change conditions can help humans manage and utilize natural resources more effectively.
The Chad Basin in Africa is located in the center of the Sahel region, and desertification is very in this area serious [8,9]. The Conventional Lake Chad Basin (CLCB) is the most active area in the Chad Basin, and the water supply to the Chad Basin comes from this area, which belongs to the Lake Chad Basin Committee [10]. Owing to climate change, more than 90% of the water in the CLCB is lost during heat and evaporation [11]. Population growth, uncontrolled irrigation in surrounding areas, desertification, deforestation, and drought have had a significant impact on local livelihoods and survival. In recent years, with the implementation of a series of policies, the habitat quality of the CLCB has been greatly improved, which has promoted the recovery of regional vegetation and the growth of carbon sequestration. However, the specific impacts of climate change and human activities on vegetation have not been systematically analyzed [12,13]. Therefore, exploring the dynamic changes of NPP in the traditional watershed of the CLCB has important guiding significance and reference value for monitoring the ecological environment and the formulation of ecological restoration plans in this area.
This study attempted to answer the following questions: What is the spatiotemporal distribution of NPP in the CLCB? Based on the background of climate change, what is the changing trend of NPP in the CLCB? According to the current changing trend of NPP, what are the driving factors of NPP in the CLCB, and how does the driving effect manifest?
In response to the above three issues, based on the multi-source remote sensing data from 2001 to 2020, we combined the Carnegie Ames Stanford Approach (CASA) model and the Mann–Kendall trend analysis method to estimate the vegetation NPP in the CLCB to analyze its spatiotemporal changes and trends. Meanwhile, the relative contribution of different driving factors, such as climatic factors and human activities, to the change in vegetation NPP was explored using the Residual trends (RESTREND) method.
The rest of the paper is organized as follows: Section 2 presents a literature review; Section 3 presents the research domain, methods, and data, including the method used to construct the CASA model, the RESTREND method, and data sources; Section 4 presents the results of this study; Section 5 discusses the results; and Section 6 concludes the paper.

2. Literature Review

In recent years, many studies have investigated the interannual variation of NPP from multiple fields and different perspectives [14,15], and multiple studies have been conducted at the national [16,17], ecosystem [18,19], and land use levels [14,20,21]. For example, [22] revealed the characteristics of land-use change in the Yangtze River Basin and its driving effect on NPP, which is of great significance for understanding the ecological environmental effects of the Yangtze River Basin. Based on the center of gravity model and geographic detectors, [23] determined the main driving factors of the spatiotemporal changes in vegetation NPP in the Hengduan Mountains from 2000 to 2015 and found that NPP and precipitation were negatively correlated. Based on the CASA model and long-term NDVI dataset, [24] quantified the annual NPP of China’s terrestrial ecosystems and identified the main climate drivers at different scales.
Currently, although human activity has been shown to be one of the causes of global vegetation loss, this is not the case at the CLCB [25]. Since the United Nations Sustainable Development Summit jointly adopted the “2030 Agenda for Sustainable Development,” a series of restoration and development projects have been implemented in the CLCB, such as the poverty alleviation project (Rehabilitation and Resilience Building Programme for Socio-Ecological Systems in the Lake Chad Basin, PRESIBALT) formulated by the Lake Chad Basin Committee and the Economic Recovery Project (Lake Chad Inclusive Economic and Social Recovery Project, RESLAC), which created conditions for continuous optimization and an increase in NPP [26,27]. However, not all projects are conducive to restoring vegetation productivity. Several studies have reported that many problems remain in the CLCB, such as water resource conflicts and population displacement due to increased resource pressure and unequal environments, which require specific planning by the African Union and international agencies [28]. Therefore, in addition to climate change, human activities can also be considered as key factors affecting the spatiotemporal distribution and trend changes of NPP.
Multiple linear regression and correlation analysis methods, such as the Pearson correlation coefficient [29], Spearman coefficient [30], and Mann–Kendall trend analysis [31,32], are usually used to explore the relationship between vegetation growth and natural and human factors. [33] used Sen’s slope and sensitivity analysis to explore the correlation between climate factors and NPP, using the upper mountainous and oasis areas in the middle and lower reaches of the Shiyang River Basin as the research area. The results showed that NPP was extremely sensitive to precipitation, relative humidity, and net solar radiation. [34] evaluated the impact of climate change and land use on regional NPP, analyzed the spatiotemporal distribution pattern and dynamic change characteristics of NPP under a long-term series in Anhui Province, China, and found that the NPP change of different land use types was related to climate factors, land cover area, and vegetation type. [35] used the residual method to identify and normalize precipitation-induced changes in vegetation NPP. They found that reducing grazing pressure had a positive effect on vegetation productivity; that is, grazing was the main driving factor of vegetation NPP changes in the Xilingol Grassland. [36] analyzed the relative contributions of human activities and climate change to China’s NPP based on the two-step method of residual trend analysis (RESTREND) and concluded that precipitation plays a decisive role in vegetation change in arid and semi-arid regions. In addition, the temperature is the dominant factor in alpine vegetation dynamics, and solar radiation is beneficial to vegetation growth in most parts of China.
Based on a summary of previous studies, we identified research gaps from three perspectives. First, due to the limitation of field data accuracy and workload, previous studies have mainly focused on relatively developed or well-developed cities and national-scale studies, while only a handful of studies have examined changes in the heart of the Lake Chad Basin in Africa’s Sahel region, where desertification is so severe that vegetation production potential needs to be assessed. Second, many studies have used NDVI to assess regional vegetation productivity; however, in areas with little vegetation coverage, NDVI is insensitive to vegetation changes [37]. However, NPP estimates are also affected by data quality, interpolation methods, and choice of the study area. Previous studies have shown large discrepancies in the computational results, even for those based on the same model [2]. Third, although existing studies have explored the main driving factors of NPP, commonly used segmental regression models have overfitting problems, and the addition of model parameters is highly artificial, leading to calculation errors in NPP.
First, this study constructed the CASA model to quantify the spatiotemporal distribution and variation of vegetation NPP in the CLCB from 2001 to 2020. Second, based on the spatiotemporal distribution of NPP, the Sen + Mann–Kendall method was used to obtain the changing trend of NPP. Third, in the selection of driving factor analysis methods, both the RUE and RESTREND methods are able to distinguish the two major types of factors, natural factors, and human factors, to a certain extent. However, both methods assume a linear relationship between vegetation productivity and rainfall, which is not linear in the semiarid Sahel. Therefore, this study combined trend analysis, correlation analysis, and residual trend analysis to construct a classification framework to distinguish the climatic factors that cause vegetation changes in the regular Lake Chad Basin from other factors. The findings of this study can be applied to ecological risk assessments and future management of ecological restoration projects in the context of global change, providing new and timely insights into vegetation restoration of ecosystems in poor, arid regions, thereby facilitating the implementation of strict environmental control policies. This study could inform the development of sustainable environmental management programs to control the malign changes in vegetation productivity in the context of climate change in arid regions.

3. Materials and Methods
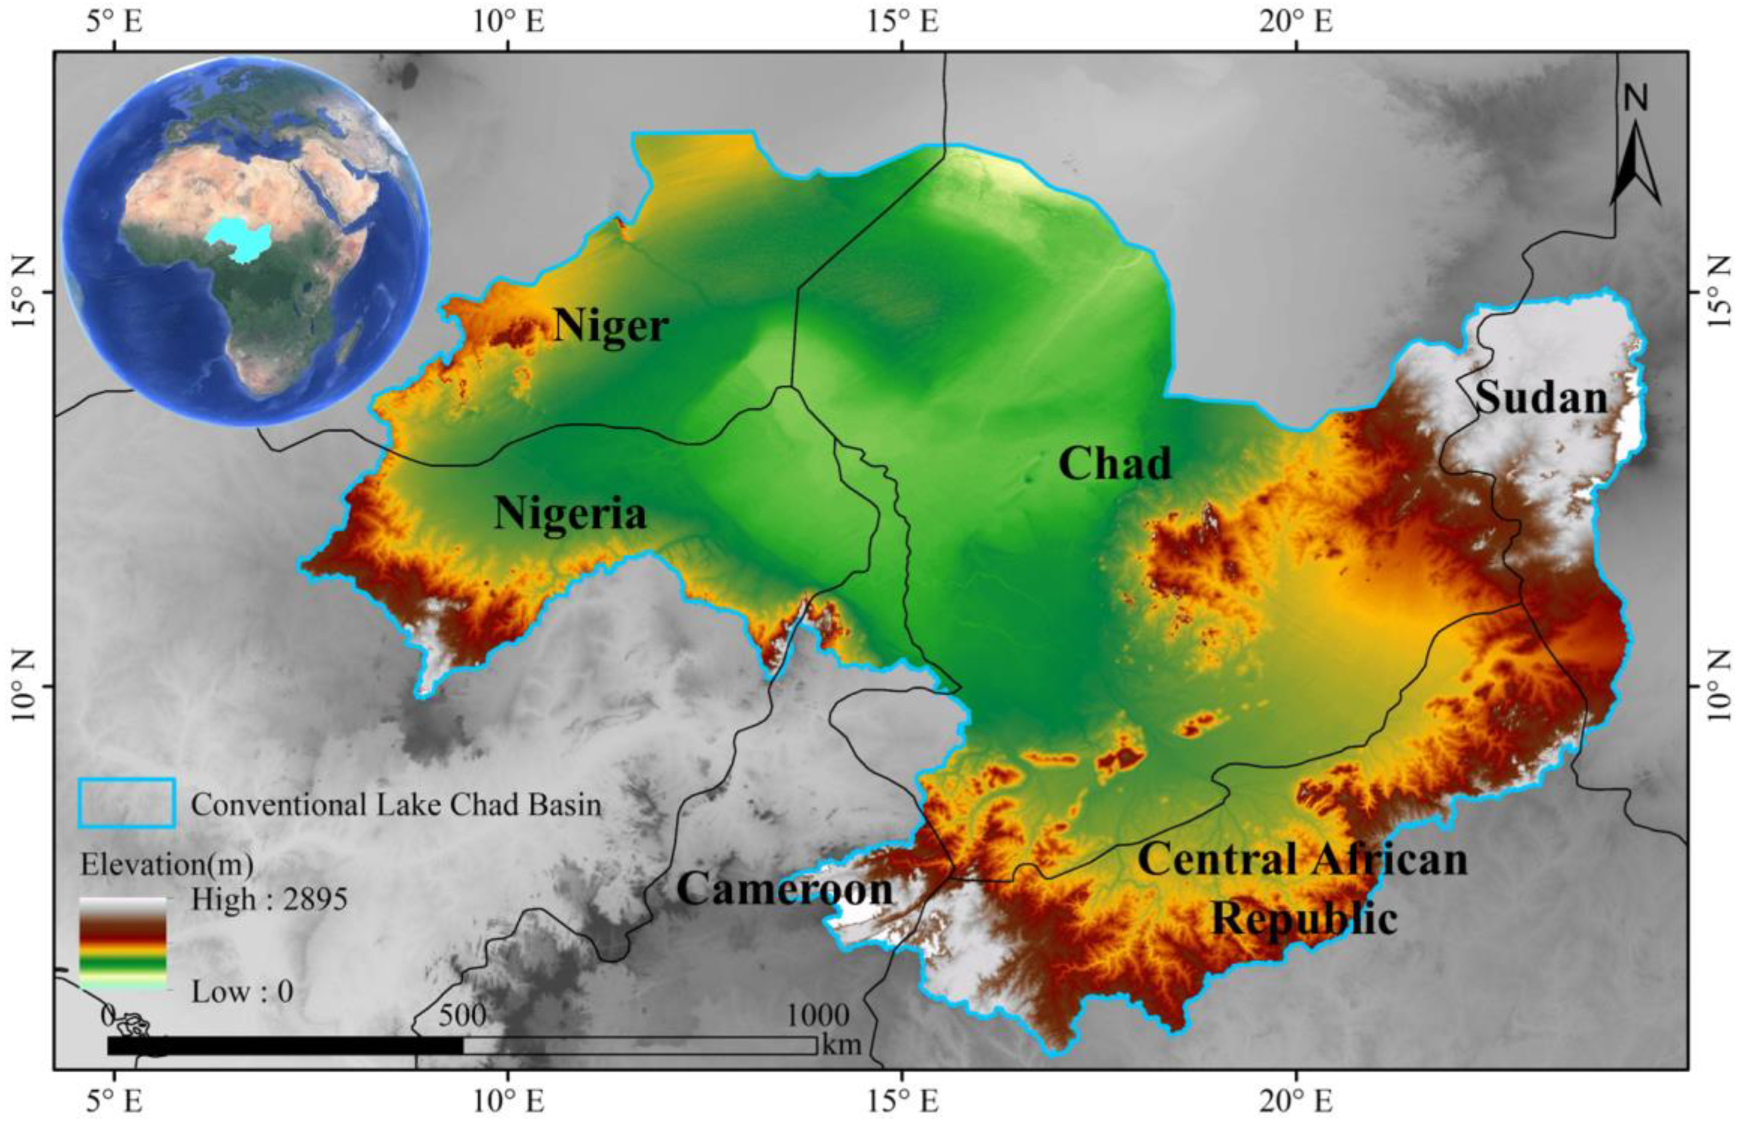
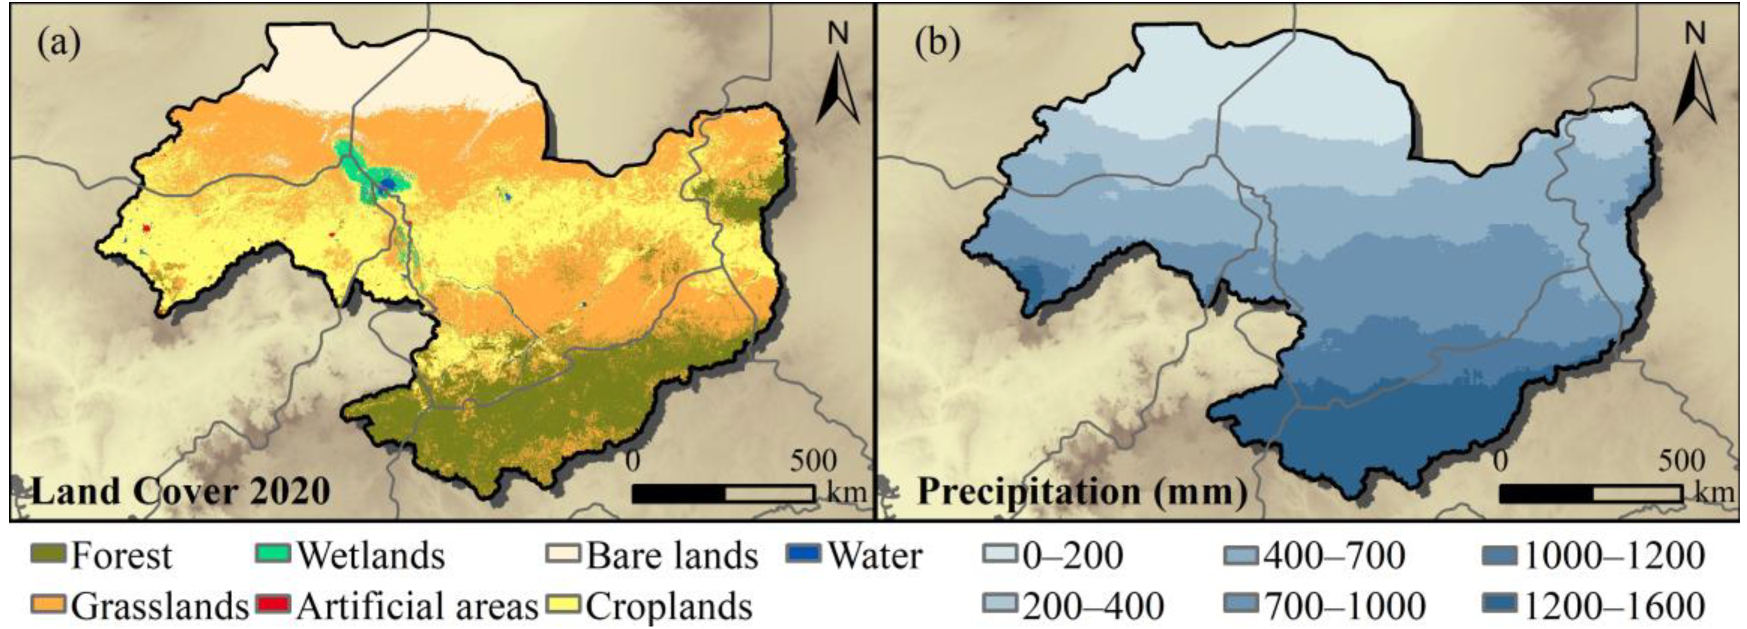
3.1. Study Area

The Lake Chad Basin (LCB) is one of the largest inland basins in the world, covering approximately 8% of Africa (2.5 × 10⁶ km2), mainly located between 6.85°–24.45° E and 5.19°–25.29° N (Figure 1). The LCB is a transboundary basin spanning eight countries: the Central African Republic, Chad, Libya, Niger, Nigeria, Algeria, Cameroon, and Sudan. In 2012, the population of LCB was estimated to be approximately 45 million [38]. Chad is the country most economically dependent on LCB resources, with 91% of the population living in the LCB. Nigeria has more than 26 million people living in the LCB. Recurring droughts, decreased rainfall, and degradation of vegetation cover has resulted in drastic changes in the environmental conditions of the region. The drying up of the LCB, the encroachment of the desert, and the decline of agriculture, livestock, and fisheries threaten the social and economic well-being of more than 22 million people in the basin [39]. The Conventional Lake Chad Basin (CLCB) is the most active area in the LCB, and the entire water supply to the LCB comes from this area, which belongs to the Lake Chad Basin Commission (LCBC). The CLCB accounts for approximately 40% (1.29 × 10⁶ km2) of the LCB. Since the 1960s, the surface area of the CLCB has decreased annually due to climate variability and various human activities (mainly agriculture). In impoverished regions, especially those in Africa, reduced river runoff has had severe ecosystem impacts, and there is an urgent need to estimate the NPP of vegetation in the CLCB and explore the main drivers of change.

3.2. Data Sources

The research data selected in this study included seven types of natural elements: surface temperature, evapotranspiration, potential evapotranspiration, NDVI, total solar radiation, precipitation, and land cover. Except for the land cover data obtained directly using the European Space Agency’s Climate Change Initiative (CCI) project data, other data were preprocessed through the Google Earth Engine (GEE) such as splicing, cropping, and coefficient conversion before subsequent data analysis. Evapotranspiration, potential evapotranspiration, total solar radiation, and precipitation were obtained from the Terra-Climate dataset. MODIS MOD11A1 and MOD13A1 data products were used for land surface temperature and NDVI, respectively. The specific years of use and spatial resolution of the data are listed in Table 1. We reclassified ESA CCI land cover data into 7 categories based on Table 2.

3.3. Methods

3.3.1. CASA Model

In the CASA model, NPP is calculated as the product of absorbed photosynthetically active radiation (APAR) and light use efficiency (ε) [40]. This study used the improved CASA model method to calculate the annual NPP value of the study area from 2001 to 2020 [41].
The main calculation method of the model is as follows:
N P P x ,   t = A P A R x ,   t × ε x ,   t
A P A R x ,   t = S O L x ,   t × F P A R x ,   t × 0.5
F P A R x ,   t = N D V I x , t N D V I i , m i n N D V I i , m a x N D V I i , m i n × F P A R m a x F P A R m i n + F P A R m i n
where N P P x ,   t is the N P P (gC m−2) of pixel x in month t ; ε x ,   t represents the actual value of the light energy utilization rate of pixel x in month t , which can be obtained by estimating the impact of surface temperature and water stress on the maximum light energy use efficiency under ideal conditions. A P A R x ,   t is the absorption of photosynthetically active radiation (MJ m−2) of pixel x in month t ; S O L x ,   t is the total solar radiation of pixel x in month t (unit: MJ m−2); F P A R x ,   t is the absorption ratio of photosynthetically active radiation (no unit); 0.5 is the ratio of the effective solar radiation used by vegetation to total solar radiation, which is a constant. For different vegetation types, F P A R is estimated by the maximum and minimum values of N D V I of the vegetation type and the corresponding maximum and minimum values of F P A R . The improved results of the previous studies determine the values of N D V I m a x , N D V I m i n and light energy use efficiency ε for different land cover types [42].

3.3.2. Sen + Mann–Kendall Trend Analysis

The trend analysis method in this study adopted Sen’s slope combined with the Mann–Kendall trend significance test. The calculation formula for Sen’s slope is:
β = M e d i a n x j x i j i j > i
where 1 < j < i < n , when β > 0 , the change trend of the time series data increases; when β < 0 , the change trend of the time series data is reduced. Because β is a non-normalized parameter, it can only reflect the size of the change trend of the time series itself, and the significance of the trend change cannot be judged by itself. Therefore, the significance test of the trend must be combined with the Mann–Kendall method.
Mann–Kendall trend test is a commonly used time series trend test method, which is a non-parametric statistical test method [43,44]. Its advantage is that it does not require samples to follow a certain distribution and is not disturbed by a few outliers. It is more suitable for type variables and order variables.
The Mann–Kendall test constructs statistical variables S for time series data x 1 ,     x 2 , ,   x n for testing:
S = i = 1 n 1 j = i + 1 n s g n x j x i
s g n x j x i =   1   i f x j x i > 0   0   i f x j x i = 0 1   i f x j x i < 0
S obeys normal distribution. The variance calculation formula is:
V a r S = n n 1 2 n + 5 i = 1 m t i t i 1 2 t i + 5 18
where m is the number of repeated data groups in the time series and t i is the number of repeated data points in the i th group of repeated data.
When n 10 , the calculation formula of Z is:
Z = S 1 v a r s   S > 0   0   S = 0 S + 1 v a r s   S < 0
The time series studied in this study was 20 years long; therefore, the test statistic Z was used to test the trend, and the test was carried out at a confidence level of α = 0.05 . When β is positive, the trend is positive, and when β is negative, the trend is negative. If the absolute value of Z is greater than 1.96, it indicates that the trend significance test has passed.

3.3.3. Drivers of NPP Trends

It is well known that in semi-arid areas such as the CLCB, vegetation productivity is highly dependent on precipitation; that is, the interannual variation of NPP is not only affected by the abundance and dryness of annual precipitation, but also depends on the distribution and seasonal variation of precipitation events within a year. Therefore, this study explored the correlation between precipitation, which is an influencing factor, and NPP. This study calculated the pixel-level Pearson correlation coefficient (r) between NPP and precipitation from to 2001–2020 to evaluate the nature and intensity of the relationship between NPP and precipitation. In general, r was considered to be statistically significant at the 95% level (p < 0.05).
Multivariate Residual Trend analysis (RESTREND) is a widely used method for analyzing differences in natural variability and degradation of ecosystems. In the process of residual trend analysis, this study used NPP time series and precipitation time series to carry out linear regression analysis, the Ordinary Least Square method to obtain the coefficients of the regression model, and then use the coefficients and precipitation time series to calculate the predicted value of NPP and the remaining residual part. Finally, this study performed a linear regression on the residual series (dependent variable) and time (independent variable) and used the Ordinary Least Square method to calculate the trend in the residual series. The calculation formula is as follows:
N P P j = a 0 + a × P r e c i p i t a t i o n j + E
E t = b 0 + b × t
where j refers to the j th year in the time series, j = 1 , 2 , , n . a 0 and a are two parameters in the linear regression of the NPP time series to the precipitation factor, which represent the intercept and slope of the linear regression model. E is the regression residual, that is, the difference between the NPP value and predicted NPP value. t is the t -th year in the time series, t = 1 , 2 , , n . b 0 and b are the intercept and slope of the residual series versus time linear regression model, respectively, where parameter b represents the trend existing in the residual series, that is, the vegetation change trend caused by factors other than precipitation. The standard F-test was used to determine the linear goodness of fit of the two models at a 95% confidence level.
Based on the methods described above, this study developed a framework for capturing the relative contributions of the drivers. This framework is based on the fact that the dynamics of biomass productivity per pixel mainly depend on the interaction between climatic factors (precipitation) and anthropogenic factors [45]. Therefore, this study separates climatic factors from anthropogenic factors and evaluates the relative contributions of these two factors to NPP status and changing trends.
Many case studies have shown that RUE or RESTREND analysis can be used to explore the influence of precipitation and anthropogenic factors on the change in NPP trend; however, this study adopts a more comprehensive classification scheme to identify the contribution of precipitation and anthropogenic factors to the change in NPP rate [45]. This classification scheme is based on the slope of the NPP trend, the correlation coefficient between NPP and precipitation, and the slope of the NPP residual trend, resulting in a set of decision rules with six possibilities (shown in Table 3). This classification scheme intuitively reflects three situations driven by: (1) only precipitation, (2) human factors, and (3) both factors (precipitation and human activities).

4. Results

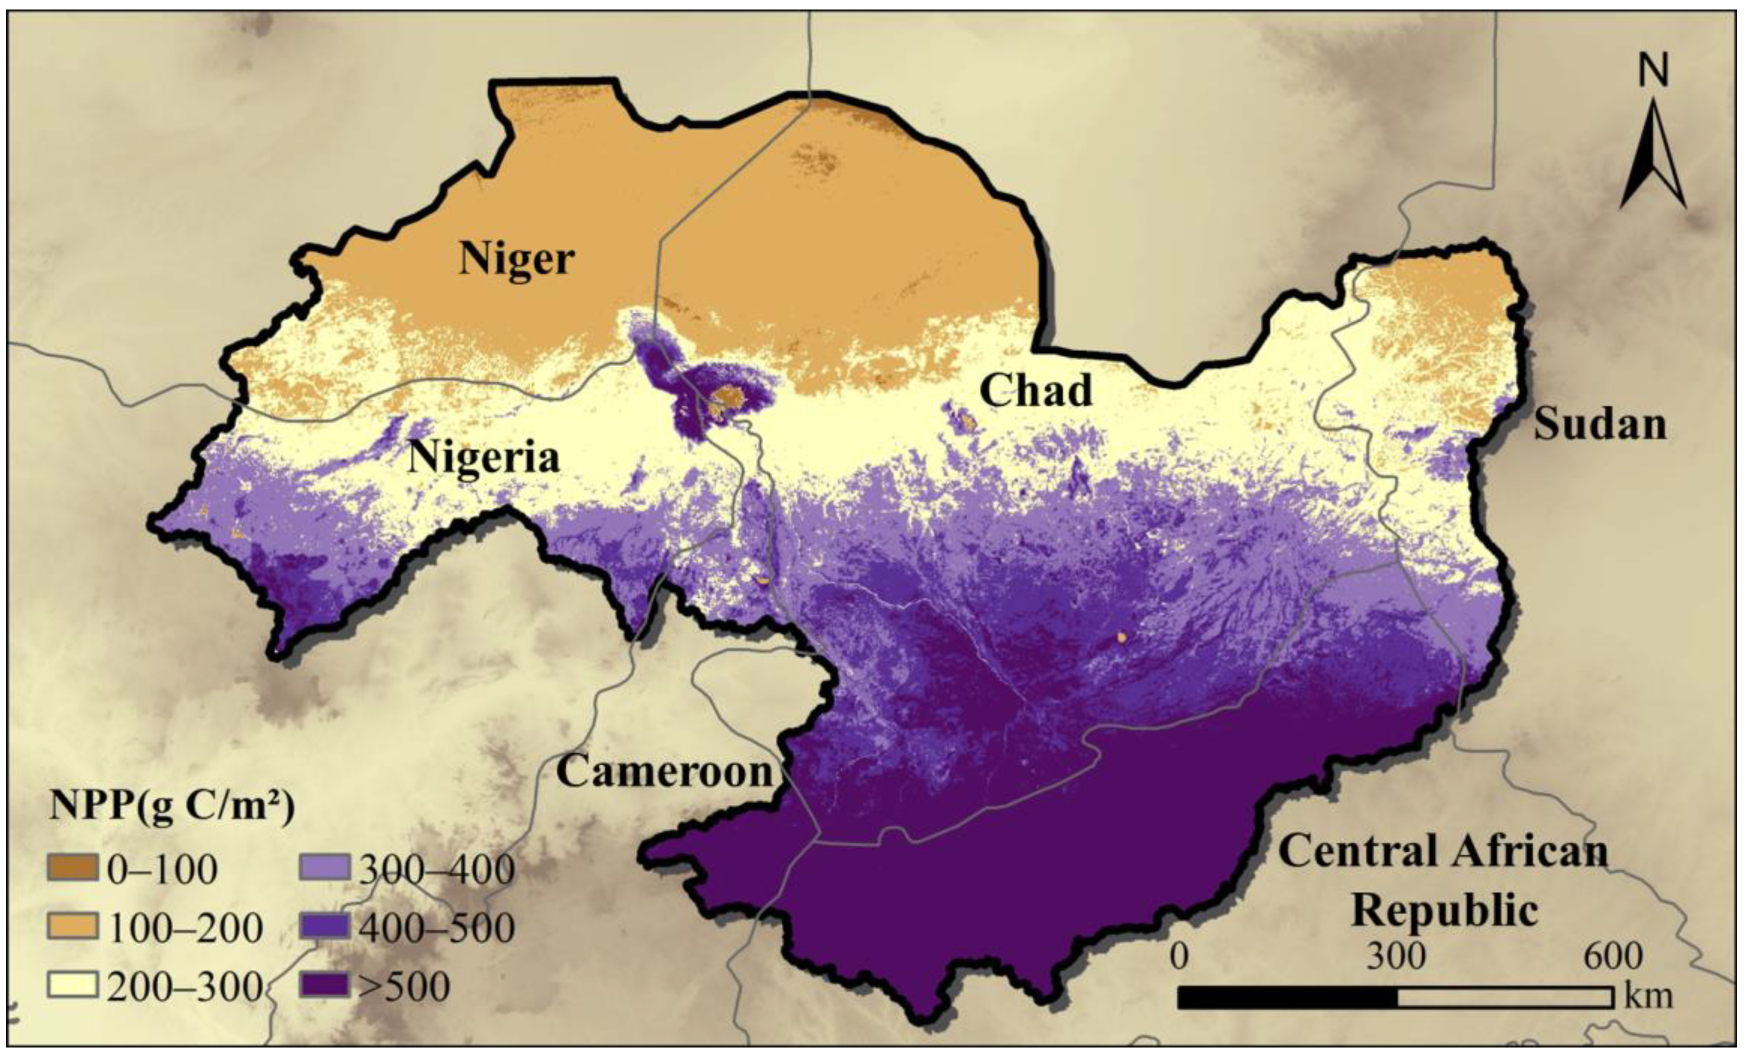
4.1. Spatial Variation Characteristics of NPP

To determine the health status and sustainable development level of the CLCB ecosystem and improve vegetation productivity, this study explored the spatial variation characteristics of the NPP distribution of the CLCB by analyzing the dynamic evolution process of the NPP of the CLCB from 2001 to 2020 (Figure 2). The average NPP of the CLCB in the past 20 years was 392.64 g C/m2. The annual average NPP of the entire study area presents a distinct spatial pattern and strong variability, which is generally higher in the south and lower in the north, and increases from northwest to southeast. This is closely related to the type of the CLCB coverage (Figure 3a). The northwest of the CLCB is mainly covered with bare land and sparse vegetation, and can be characterized by a dry climate and low NPP value, while the southeast of the CLCB is mainly covered by forest and grasslands, covered with perennial woody plants, and has high biomass production. There is a large amount of farmland in the central area of the CLCB, where the soil is fertile and suitable for the growth of various crops [45]. Although the biomass production of farmland cannot be compared with that of forests and grasslands, it still provides some help for the ecological restoration of the CLCB. However, the size of the lake has shrunk dramatically over the decades due to overgrazing, deforestation, and large-scale irrigation [46]. Abandoned fields (i.e., abandoned crops) are prone to NPP reduction. As highlighted by [47], in the CLCB, cropped vegetation tends to have higher NPP values than native vegetation in some cases, especially degraded savannahs with sparse vegetation, suggesting that when cropland is abandoned, the NPP content will decrease to some extent. In addition, croplands (including fallow land and grasslands) are vulnerable to grazing pressure, which means that high stocking rates, soil degradation, and species shifts may lead to reduced NPP yields [48]. The area and proportion of each land cover type of the CLCB in 2020 are shown in Table 4. The annual average evapotranspiration, potential evapotranspiration, total solar radiation, precipitation, surface temperature, and NDVI data of different land cover types from 2001 to 2020 are shown in Table 5.
At the national scale, the vegetation NPP values of the CLCB in the Cameroon and Central African Republic parts were higher, and the vegetation NPP values of the CLCB in the Niger and Sudan parts were opposite. According to the topographic map (Figure 1) and precipitation distribution map (Figure 3b) of the study area, it can be seen that the CLCB has a higher altitude in Cameroon and the Central African Republic, with sufficient precipitation (Figure 3b). The typical tropical rainforest climate includes abundant biological species. The vegetation types are diverse; therefore, the biomass production in this area is high. However, part of the CLCB in Sudan is mainly located in the Muir Mountains, which is in a tropical desert climate with a high temperature and little rain, and the climate is dry, which leads to low NPP values [49].

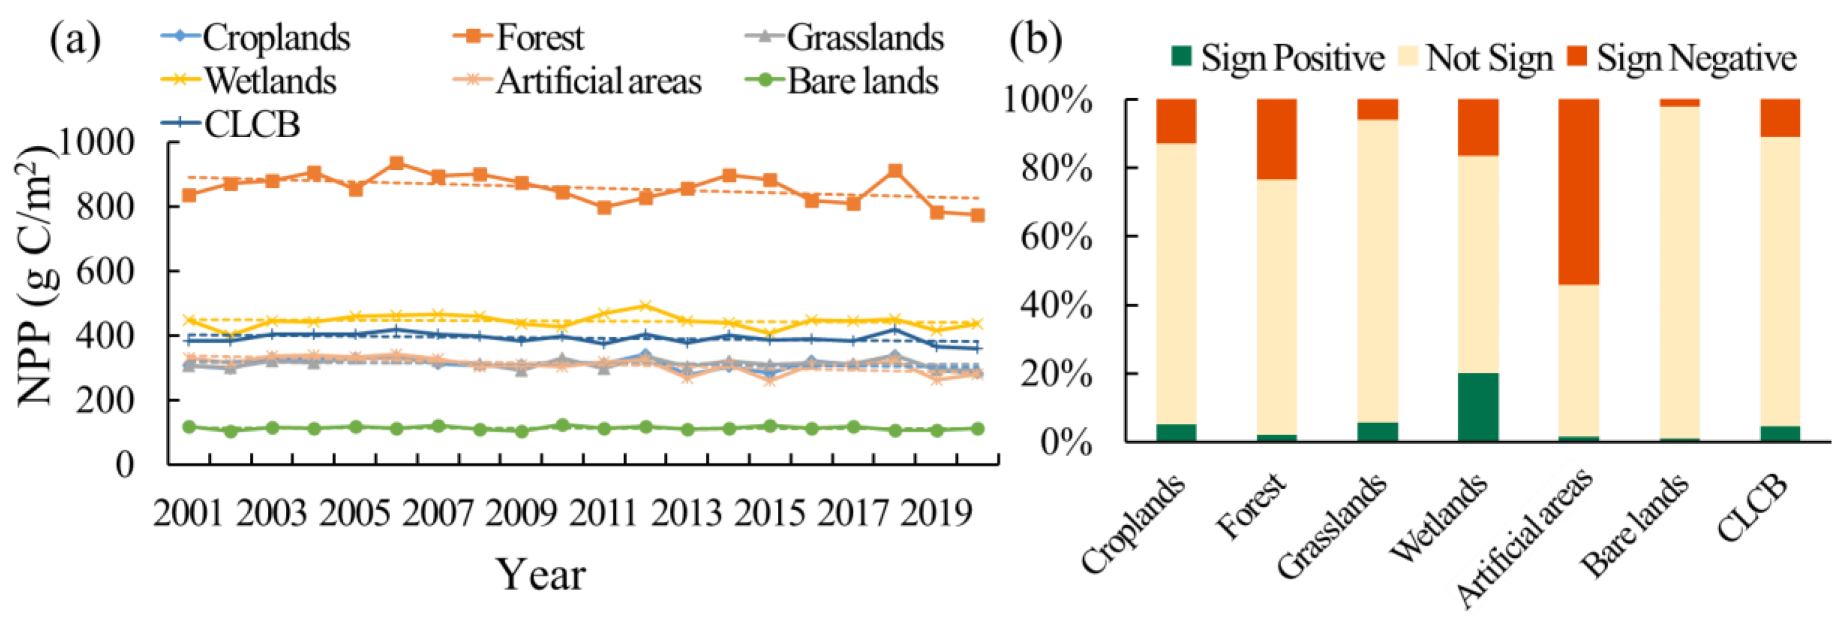
4.2. Temporal Variation Characteristics of NPP

From the perspective of time, the average NPP value of the entire study area decreased from 383.36 g C/m2 in 2001 to 360.57 g C/m2 in 2020. Therefore, the annual average NPP of the CLCB showed a downward trend of 1.14 g C/m2 per year. Moreover, according to the change in the trend of NPP in the study area from 2001 to 2020 (Figure 4), the results show that the area where NPP decreased accounted for 11.04% (1.42 × 10⁵ km2), and the area where NPP increased accounted for only 4.53% (5.84 × 10⁵ km2). The main falling areas are located in Nigeria, southern Chad, and Cameroon, while the main rising areas are located in eastern Chad. This finding is consistent with previous studies reporting year-on-year decreases in vegetation productivity in the CLCB [50]. Previous studies have also shown that the decline in vegetation productivity in Nigeria is mainly due to its high population density and the reduction in the per capita availability of NPP [51] owing to the reduction of woody plants [52].
In the past 20 years, the rate of decline of NPP of the entire CLCB and various terrestrial ecosystems was the largest in the Forest area (−3.52 g C/m2), followed by Artificial areas (−2.85 g C/m2). The overall NPP in the study area also showed a downward trend, and the lowest value of the annual average NPP appeared in 2020, at only 360.57 g C/m2 (Figure 5a). Figure 5b shows that the regional proportions of NPP increased and decreased in each terrestrial ecosystem. Among them, the NPP of artificial areas decreased the most, by up to 54.03% (with an area of 766.39 km2); the NPP of wetlands increased the most, accounting for approximately 20.10% (with an area of 2790.59 km2). According to previous research, meeting the energy needs of many urban populations in many Sahel countries has led to extensive deforestation in peri-urban areas [53]. Moreover, one of the current key problems of the CLCB is the loss of agricultural systems and large-scale forests [54]. Although local governments, non-governmental organizations (NGOs), and cooperatives have helped local farmers reduce deforestation and forest degradation, many farmers continued to conduct extensive agricultural production, which has led to a year-by-year decline in local NPP [55].

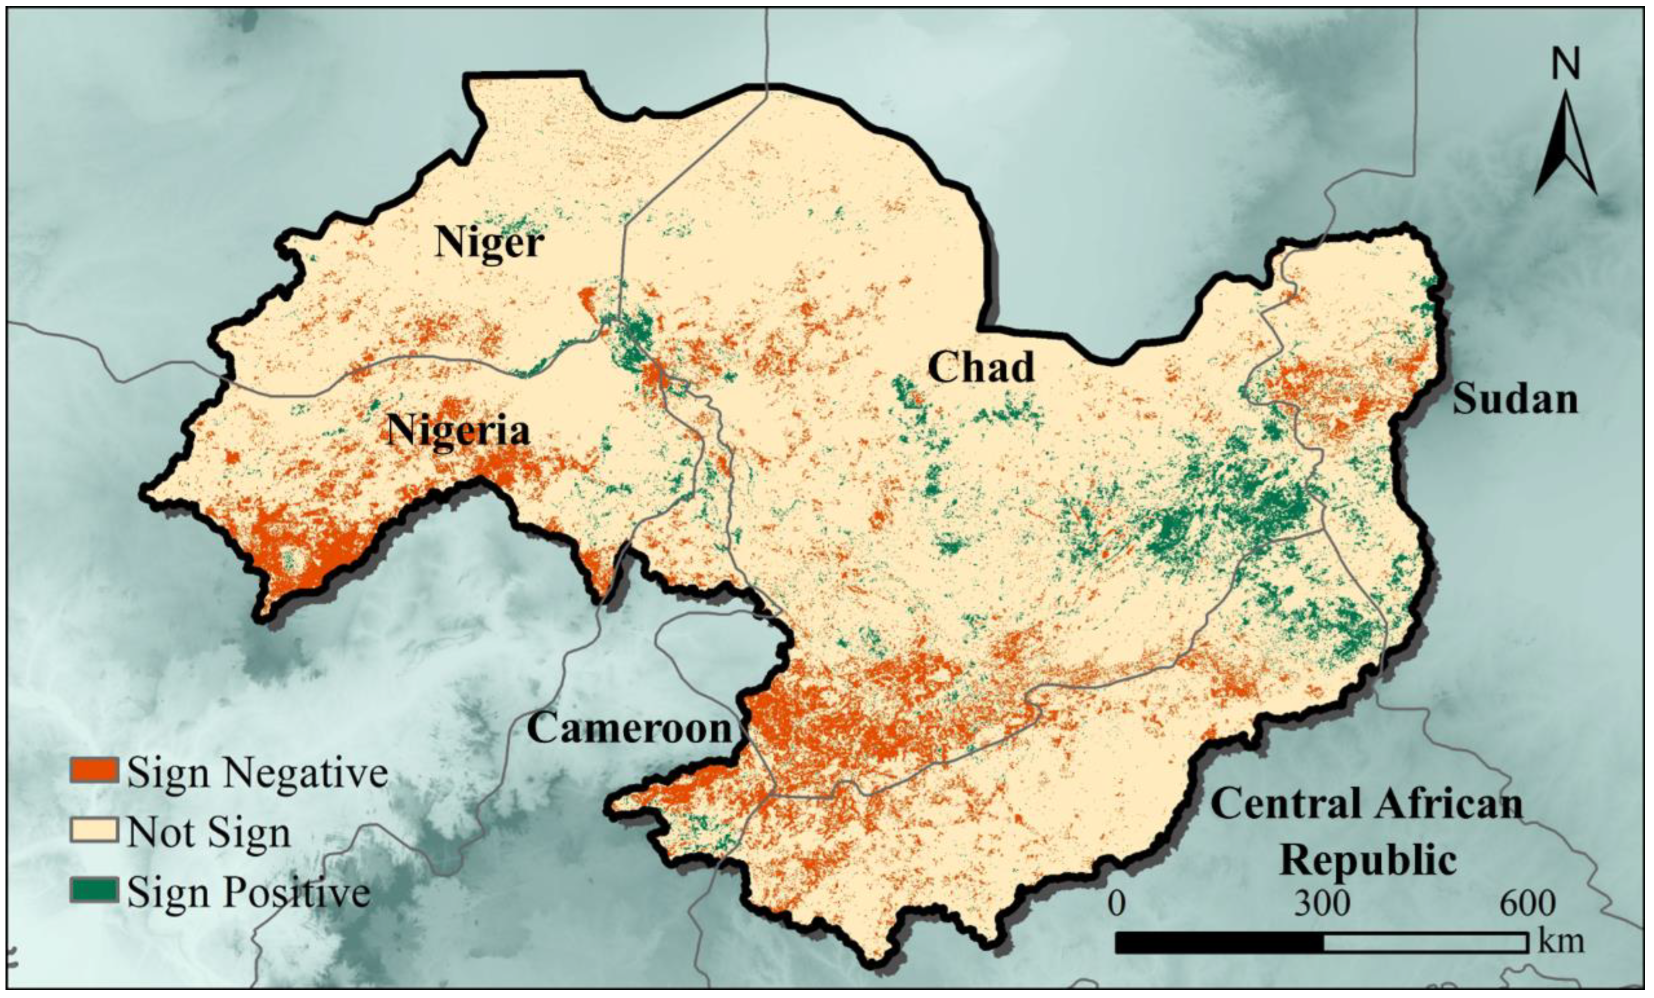
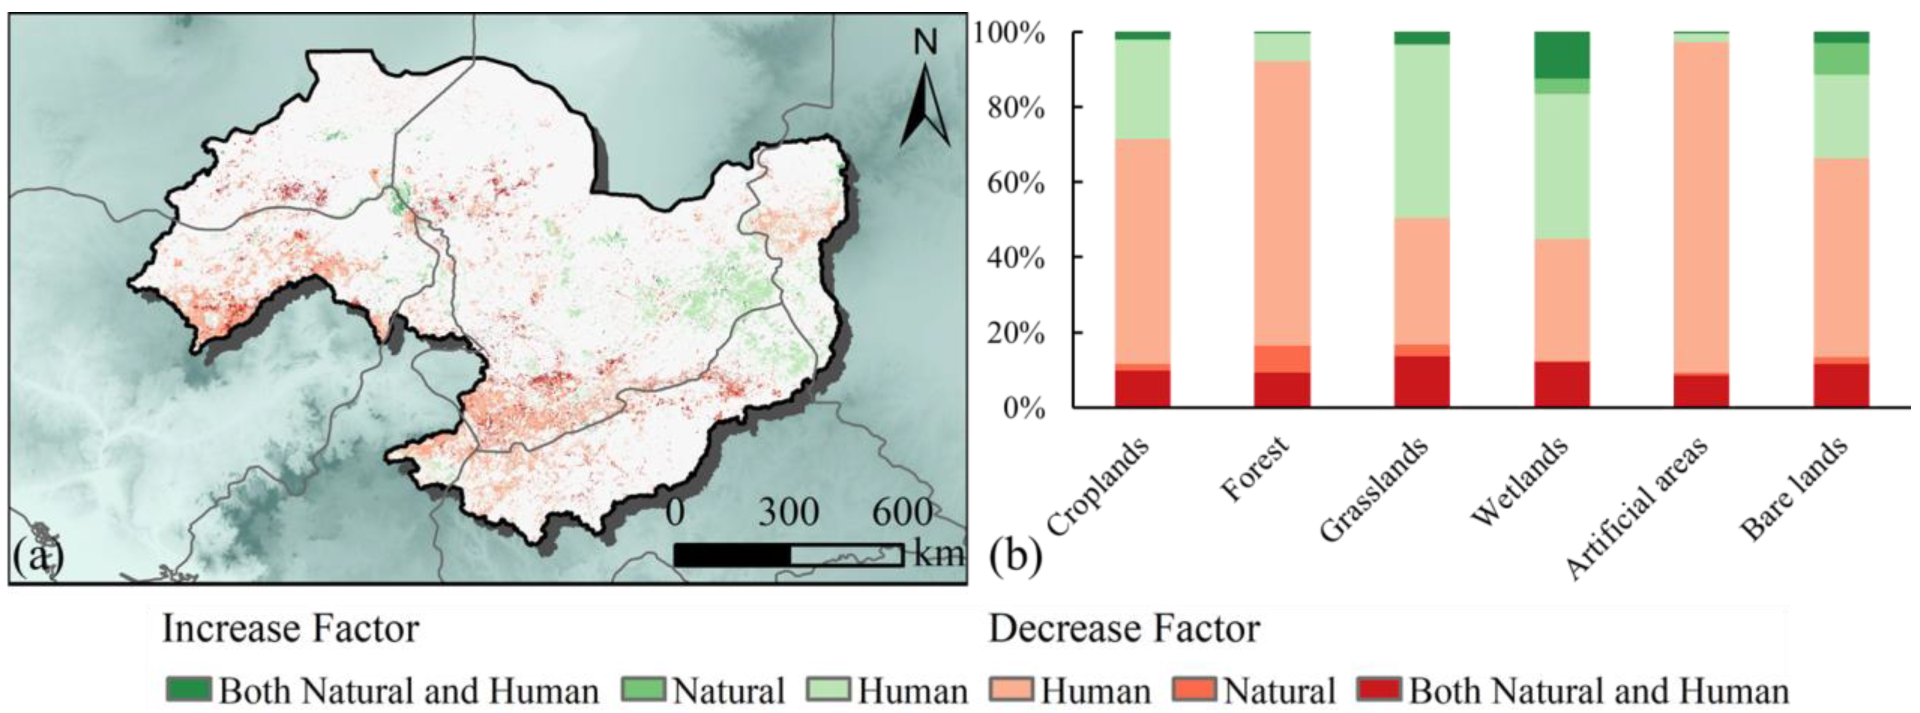
4.3. Driving Factors of Changes in NPP Trends
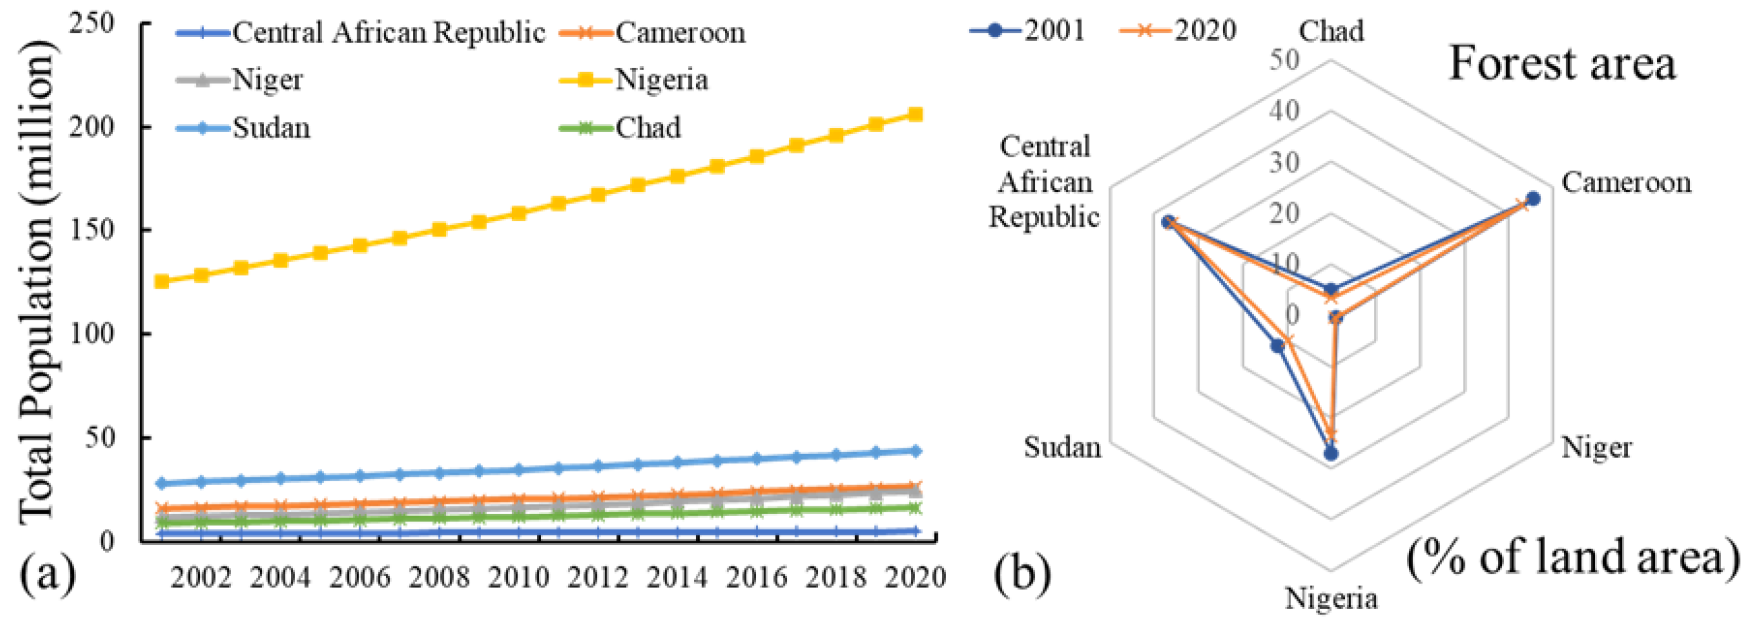
Climate change is an important factor affecting the NPP of the CLCB. In addition, human activities can cause changes in vegetation productivity. Based on the comprehensive framework of RESTREND and correlation analysis, this study used NPP as the dependent variable and precipitation factors as independent variables to analyze the driving factors of the NPP change trend in the study area (Figure 6). The main area of NPP decline was located in the southern part of the CLCB (Figure 6a). Although the overall NPP values in these areas are higher than those in the north, with continuous urbanization, the transformation of forests into farmland, and the influence of human factors such as overgrazing, NPP values have dropped significantly [56]. The main area that showed a rise in NPP is located east of the CLCB in the area that borders Chad and Sudan. Moreover, the main driving factors for the rise and fall of the CLCB’s NPP are human factors, and the proportion of the decrease due to human factors in areas with significant forest changes can reach 75.72% (46,661.48 km2). The areas where NPP increased due to human factors in grasslands and wetlands accounted for 45.95% and 38.59% of the significant change areas in each region, respectively (Figure 6b). Previous studies have shown that climate variability is the main driver of NPP improvement in southeastern Chad [56]. Considering that the improvements in NPP were mainly found in farmland and forested areas within southeastern Chad, although the precipitation has been relatively stable in recent years, other natural factors, such as the reduction of steam pressure deficit and atmospheric carbon dioxide content, may help improve the NPP in this area [57,58].

5. Discussion

Our study provides numerical evidence for NPP reduction in the CLCB and identifies key drivers. This decrease was mainly due to deforestation and overgrazing caused by increased human activities. In addition, although precipitation has a certain dominant effect on NPP changes, climate variability may lead to some increases in NPP.
We counted the population and forest area proportions of the countries included in the CLCB (Figure 7), which are the two crucial impact factors of NPP. The results show that among the seven countries, Nigeria has had the fastest population growth rate in recent years, reaching 4.04 million people/year, increasing from 125.39 million people in 2001 to 211.40 million people in 2020 (Figure 7a). Previous studies have shown that land use in Nigeria has undergone dramatic changes due to human activities, such as commercial logging (selective and destructive), agricultural reclamation, livestock and pasture farming, construction of dams, mining, and burning of bushes (forest fires), etc. [59,60]. These human factors have increased the pressure of the population on land, the intensity of agricultural activities, and the rate of deforestation, which in turn has led to a decline in NPP [61]. This is consistent with the results of the present study. Nigeria’s sharply increasing population and year-by-year shrinking forest area indicate the adverse effects of human factors on NPP (Figure 7b).
In addition, Chad had the largest area in the CLCB, and the NPP value in the eastern region of Chad showed an increasing trend. Studies have shown that current international aid to Chad is gradually increasing, and the top two categories of development aid are agriculture and forestry [62]. Moreover, it is not only changes in precipitation that has driven Chad’s significant increase in agricultural production, but also human factors in Chad’s agroecosystem play a role.
Our findings show that the current NPP of the CLCB decreases each year. Although we provide valuable results that can inform the future development of the CLCB, some limitations should be mentioned. First, owing to differences in the data sources used to study vegetation indicators such as NPP, even though the method is the same, there may still be some potential errors and uncertainties, which may lead to some invisible errors in the calculation of NPP. Although there are many literature references for using the CASA model to calculate NPP, our reference rate is not sufficient for areas with different climate types and vegetation coverage, and more appropriate long-term data and parameters should be selected for future estimations. Second, insufficient consideration of natural factors such as climate change may exacerbate sources of uncertainty. Because climate and NPP changes are inextricably linked, future research should investigate the impact of climate change on the dynamic changes in vegetation types. Third, owing to space constraints, we did not conduct segmental statistics on NPP development trends. However, the change in NPP may be non-monotonic. Therefore, follow-up research should add a short-term trend analysis to detect mutation points. In addition, current environmental restoration policies must be clarified to minimize uncertainties in future NPP calculations.

6. Conclusions

This study analyzed the spatiotemporal changes and trends of NPP in the CLCB from 2002 to 2020. We elucidated the main factors influencing NPP and explored NPP changes in different terrestrial ecosystems. The conclusions are as follows.
The NPP of the CLCB has been decreasing annually, and most areas still required vegetation restoration at present. Human factors (including urbanization, overgrazing, deforestation, and farmland reclamation) are key factors affecting vegetation productivity. In addition, climate change also has a certain impact on NPP, but possible changes in climate conditions (e.g., carbon dioxide content) may also improve NPP to a certain extent.
With the gradual reduction of NPP, increasing areas of forest and thus increasing NPP without sacrificing social and economic development is currently the biggest challenge facing the CLCB. Responsible government agencies and policymakers must improve and strengthen NPP restoration to ensure the reasonable expansion of green forest areas. In addition, to improve vegetation productivity, more factors affecting NPP changes should be analyzed, and sustainable development paths should be determined simultaneously.

Author Contributions

S.F. and Y.Z. contributed equally to this work. S.F. conceived the idea of the study and designed research, wrote the paper, discussed the results and revised the manuscript; Y.Z. analyzed the data, discussed the results and revised the manuscript; N.Z. conceived the idea of the study and designed research, discussed the results and revised the manuscript; J.L. involved in funding acquisition, resources and supervision. All authors have read and agreed to the published version of the manuscript.

Funding

This study was financially supported by the Science and Technology Partnership Program and International Science and Technology Cooperation Program of Shanghai Cooperation Organization (Grant No. 2022E01012), the National Key Research and Development Program (Grant No. 2018YFE0106000), the National Natural Science Foundation of China (Grant No. 41861144020) and the Alliance of International Science Organizations of Association (Grant No. ANSO-PA-2020-15).

Institutional Review Board Statement

Not applicable.

Informed Consent Statement

Not applicable.

Data Availability Statement

The data used to support the results of this research are shown in the manuscript and available from the corresponding author upon request.

Conflicts of Interest

Conflict of interest All authors have no conflicts of interests to declare.

References

  1. Yue, D.; Zhou, Y.; Guo, J.; Chao, Z.; Guo, X. Relationship between net primary productivity and soil water content in the Shule River Basin. Catena 2022, 208, 105770. [Google Scholar] [CrossRef]
  2. Feng, Y.; Zhu, J.; Zhao, X.; Tang, Z.; Zhu, J.; Fang, J. Changes in the trends of vegetation net primary productivity in China between 1982 and 2015. Environ. Res. Lett. 2019, 14, 124009. [Google Scholar] [CrossRef]
  3. Zhou, Y.; Yue, D.; Guo, J.; Chao, Z.; Meng, X. Assessing the impact of land conversion and management measures on the net primary productivity in the Bailong River Basin, in China. Catena 2021, 207, 105672. [Google Scholar] [CrossRef]
  4. Liu, X.; Pei, F.; Wen, Y.; Li, X.; Wang, S.; Wu, C.; Cai, Y.; Wu, J.; Chen, J.; Feng, K. Global urban expansion offsets climate-driven increases in terrestrial net primary productivity. Nat. Commun. 2019, 10, 5558. [Google Scholar] [CrossRef] [Green Version]
  5. Zhong, J.; Liu, J.; Jiao, L.; Lian, X.; Xu, Z.; Zhou, Z. Assessing the comprehensive impacts of different urbanization process on vegetation net primary productivity in Wuhan, China, from 1990 to 2020. Sustain. Cities Soc. 2021, 75, 103295. [Google Scholar] [CrossRef]
  6. Lu, X.-Y.; Chen, X.; Zhao, X.-L.; Lv, D.-J.; Zhang, Y. Assessing the impact of land surface temperature on urban net primary productivity increment based on geographically weighted regression model. Sci. Rep. 2021, 11, 22282. [Google Scholar] [CrossRef]
  7. Zhou, Y.; Zou, S.; Duan, W.; Chen, Y.; Takara, K.; Di, Y. Analysis of energy carbon emissions from agroecosystems in Tarim River Basin, China: A pathway to achieve carbon neutrality. Appl. Energy 2022, 325, 119842. [Google Scholar] [CrossRef]
  8. Okonkwo, C.; Demoz, B.; Onyeukwu, K. Characteristics of drought indices and rainfall in Lake Chad Basin. Int. J. Remote Sens. 2013, 34, 7945–7961. [Google Scholar] [CrossRef]
  9. Babamaaji, R.A.; Lee, J. Land use/land cover classification of the vicinity of Lake Chad using NigeriaSat-1 and Landsat data. Environ. Earth Sci. 2014, 71, 4309–4317. [Google Scholar] [CrossRef]
  10. Mahmood, R.; Jia, S.; Zhu, W. Analysis of climate variability, trends, and prediction in the most active parts of the Lake Chad basin, Africa. Sci. Rep. 2019, 9, 6317. [Google Scholar] [CrossRef] [Green Version]
  11. Nwilo, P.; Olayinka, D.; Okolie, C.; Emmanuel, E.; Orji, M.; Daramola, O. Impacts of land cover changes on desertification in northern Nigeria and implications on the Lake Chad Basin. J. Arid Environ. 2020, 181, 104190. [Google Scholar] [CrossRef]
  12. Ndehedehe, C.E.; Agutu, N.O.; Okwuashi, O.; Ferreira, V.G. Spatio-temporal variability of droughts and terrestrial water storage over Lake Chad Basin using independent component analysis. J. Hydrol. 2016, 540, 106–128. [Google Scholar] [CrossRef] [Green Version]
  13. Lilje, J.; Mosler, H.-J. Effects of a behavior change campaign on household drinking water disinfection in the Lake Chad basin using the RANAS approach. Sci. Total Environ. 2018, 619, 1599–1607. [Google Scholar] [CrossRef] [PubMed]
  14. Li, J.; Wang, Z.; Lai, C.; Wu, X.; Zeng, Z.; Chen, X.; Lian, Y. Response of net primary production to land use and land cover change in mainland China since the late 1980s. Sci. Total Environ. 2018, 639, 237–247. [Google Scholar] [CrossRef] [PubMed]
  15. Liu, L.; Peng, S.; AghaKouchak, A.; Huang, Y.; Li, Y.; Qin, D.; Xie, A.; Li, S. Broad consistency between satellite and vegetation model estimates of net primary productivity across global and regional scales. J. Geophys. Res. Biogeosciences 2018, 123, 3603–3616. [Google Scholar] [CrossRef]
  16. Chen, Y.; Chen, L.; Cheng, Y.; Ju, W.; Chen, H.Y.; Ruan, H. Afforestation promotes the enhancement of forest LAI and NPP in China. For. Ecol. Manag. 2020, 462, 117990. [Google Scholar] [CrossRef]
  17. Sun, J.; Yue, Y.; Niu, H. Evaluation of NPP using three models compared with MODIS-NPP data over China. PloS ONE 2021, 16, e0252149. [Google Scholar] [CrossRef] [PubMed]
  18. Guo, B.; Han, B.; Yang, F.; Chen, S.; Liu, Y.; Yang, W. Determining the contributions of climate change and human activities to the vegetation NPP dynamics in the Qinghai-Tibet Plateau, China, from 2000 to 2015. Environ. Monit. Assess. 2020, 192, 663. [Google Scholar] [CrossRef]
  19. Lei, T.; Feng, J.; Lv, J.; Wang, J.; Song, H.; Song, W.; Gao, X. Net Primary Productivity Loss under different drought levels in different grassland ecosystems. J. Environ. Manag. 2020, 274, 111144. [Google Scholar] [CrossRef]
  20. Lunyolo, L.D.; Khalifa, M.; Ribbe, L. Assessing the interaction of land cover/land use dynamics, climate extremes and food systems in Uganda. Sci. Total Environ. 2021, 753, 142549. [Google Scholar] [CrossRef]
  21. Xiao, X.; Li, X.; Jiang, T.; Tan, M.; Hu, M.; Liu, Y.; Zeng, W. Response of net primary production to land use and climate changes in the middle-reaches of the Heihe River Basin. Ecol. Evol. 2019, 9, 4651–4666. [Google Scholar] [CrossRef] [PubMed] [Green Version]
  22. Yang, H.; Zhong, X.; Deng, S.; Xu, H. Assessment of the impact of LUCC on NPP and its influencing factors in the Yangtze River basin, China. Catena 2021, 206, 105542. [Google Scholar] [CrossRef]
  23. Chen, S.-T.; Guo, B.; Zhang, R.; Zang, W.-Q.; Wei, C.-X.; Wu, H.-W.; Yang, X.; Zhen, X.-Y.; Li, X.; Zhang, D.-F. Quantitatively determine the dominant driving factors of the spatial—Temporal changes of vegetation npp in the hengduan mountain area during 2000–2015. J. Mt. Sci. 2021, 18, 427–445. [Google Scholar] [CrossRef]
  24. Li, H.; Wu, Y.; Liu, S.; Xiao, J. Regional contributions to interannual variability of net primary production and climatic attributions. Agric. For. Meteorol. 2021, 303, 108384. [Google Scholar] [CrossRef]
  25. Wakdok, S.S.; Bleischwitz, R. Climate Change, Security, and the Resource Nexus: Case Study of Northern Nigeria and Lake Chad. Sustainability 2021, 13, 10734. [Google Scholar] [CrossRef]
  26. Okpara, U.T.; Stringer, L.C.; Dougill, A.J. Integrating climate adaptation, water governance and conflict management policies in lake riparian zones: Insights from African drylands. Environ. Sci. Policy 2018, 79, 36–44. [Google Scholar] [CrossRef]
  27. Nagabhatla, N.; Brahmbhatt, R. Geospatial Assessment of water-migration scenarios in the context of sustainable development goals (SDGs) 6, 11, and 16. Remote Sens. 2020, 12, 1376. [Google Scholar] [CrossRef]
  28. Nagabhatla, N.; Cassidy-Neumiller, M.; Francine, N.N.; Maatta, N. Water, conflicts and migration and the role of regional diplomacy: Lake Chad, Congo Basin, and the Mbororo pastoralist. Environ. Sci. Policy 2021, 122, 35–48. [Google Scholar] [CrossRef]
  29. Jie, T.; Junnan, X.; Yichi, Z.; Weiming, C.; Yuchuan, H.; Chongchong, Y.; Wen, H. Quantitative assessment of the effects of climate change and human activities on grassland NPP in Altay Prefecture. J. Resour. Ecol. 2021, 12, 743–756. [Google Scholar] [CrossRef]
  30. Liu, H.; Cao, L.; Jia, J.; Gong, H.; Qi, X.; Xu, X. Effects of land use changes on the nonlinear trends of net primary productivity in arid and semiarid areas, China. Land Degrad. Dev. 2021, 32, 2183–2196. [Google Scholar] [CrossRef]
  31. Kamali, A.; Khosravi, M.; Hamidianpour, M. Spatial–temporal analysis of net primary production (NPP) and its relationship with climatic factors in Iran. Environ. Monit. Assess. 2020, 192, 718. [Google Scholar] [CrossRef] [PubMed]
  32. Wei, X.; Yang, J.; Luo, P.; Lin, L.; Lin, K.; Guan, J. Assessment of the variation and influencing factors of vegetation NPP and carbon sink capacity under different natural conditions. Ecol. Indic. 2022, 138, 108834. [Google Scholar] [CrossRef]
  33. Zhang, X.; Xiao, W.; Wang, Y.; Wang, Y.; Wang, H.; Wang, Y.; Zhu, L.; Yang, R. Spatial-temporal changes in NPP and its relationship with climate factors based on sensitivity analysis in the Shiyang River Basin. J. Earth Syst. Sci. 2020, 129, 24. [Google Scholar] [CrossRef]
  34. Yang, H.; Hu, D.; Xu, H.; Zhong, X. Assessing the spatiotemporal variation of NPP and its response to driving factors in Anhui province, China. Environ. Sci. Pollut. Res. 2020, 27, 14915–14932. [Google Scholar] [CrossRef]
  35. Chi, D.; Wang, H.; Li, X.; Liu, H.; Li, X. Assessing the effects of grazing on variations of vegetation NPP in the Xilingol Grassland, China, using a grazing pressure index. Ecol. Indic. 2018, 88, 372–383. [Google Scholar] [CrossRef]
  36. Ge, W.; Deng, L.; Wang, F.; Han, J. Quantifying the contributions of human activities and climate change to vegetation net primary productivity dynamics in China from 2001 to 2016. Sci. Total Environ. 2021, 773, 145648. [Google Scholar] [CrossRef]
  37. Li, S.; Xu, L.; Jing, Y.; Yin, H.; Li, X.; Guan, X. High-quality vegetation index product generation: A review of NDVI time series reconstruction techniques. Int. J. Appl. Earth Obs. Geoinf. 2021, 105, 102640. [Google Scholar] [CrossRef]
  38. Mahmood, R.; Jia, S. Assessment of hydro-climatic trends and causes of dramatically declining stream flow to Lake Chad, Africa, using a hydrological approach. Sci. Total Environ. 2019, 675, 122–140. [Google Scholar] [CrossRef]
  39. Buma, W.G.; Lee, S.-I. Evaluation of sentinel-2 and landsat 8 images for estimating chlorophyll-a concentrations in lake Chad, Africa. Remote Sens. 2020, 12, 2437. [Google Scholar] [CrossRef]
  40. Potter, C.S.; Randerson, J.T.; Field, C.B.; Matson, P.A.; Vitousek, P.M.; Mooney, H.A.; Klooster, S.A. Terrestrial ecosystem production: A process model based on global satellite and surface data. Glob. Biogeochem. Cycles 1993, 7, 811–841. [Google Scholar] [CrossRef]
  41. Zheng, Z.; Zhu, W.; Zhang, Y. Seasonally and spatially varied controls of climatic factors on net primary productivity in alpine grasslands on the Tibetan Plateau. Glob. Ecol. Conserv. 2020, 21, e00814. [Google Scholar] [CrossRef]
  42. Zheng, Z.; Zhu, W.; Zhang, Y. Direct and lagged effects of spring phenology on net primary productivity in the alpine grasslands on the Tibetan Plateau. Remote Sens. 2020, 12, 1223. [Google Scholar] [CrossRef] [Green Version]
  43. Li, T.; Li, M.; Ren, F.; Tian, L. Estimation and Spatio-Temporal Change Analysis of NPP in Subtropical Forests: A Case Study of Shaoguan, Guangdong, China. Remote Sens. 2022, 14, 2541. [Google Scholar] [CrossRef]
  44. Liu, Y.; Zhou, R.; Wen, Z.; Khalifa, M.; Zheng, C.; Ren, H.; Zhang, Z.; Wang, Z. Assessing the impacts of drought on net primary productivity of global land biomes in different climate zones. Ecol. Indic. 2021, 130, 108146. [Google Scholar] [CrossRef]
  45. Leroux, L.; Bégué, A.; Seen, D.L.; Jolivot, A.; Kayitakire, F. Driving forces of recent vegetation changes in the Sahel: Lessons learned from regional and local level analyses. Remote Sens. Environ. 2017, 191, 38–54. [Google Scholar] [CrossRef] [Green Version]
  46. Li, K.; Coe, M.; Ramankutty, N.; De Jong, R. Modeling the hydrological impact of land-use change in West Africa. J. Hydrol. 2007, 337, 258–268. [Google Scholar] [CrossRef]
  47. Bégué, A.; Vintrou, E.; Ruelland, D.; Claden, M.; Dessay, N. Can a 25-year trend in Soudano-Sahelian vegetation dynamics be interpreted in terms of land use change? A remote sensing approach. Glob. Environ. Change 2011, 21, 413–420. [Google Scholar] [CrossRef]
  48. Scoones, I. Review of The End of Desertification? Disputing Environmental Change in the Drylands by Roy H. Behnke and Michael Mortimore; Springer: Berlin, Germany, 2018. [Google Scholar]
  49. Biro, K.; Pradhan, B.; Buchroithner, M.; Makeschin, F. Land use/land cover change analysis and its impact on soil properties in the northern part of Gadarif region, Sudan. Land Degrad. Dev. 2013, 24, 90–102. [Google Scholar] [CrossRef]
  50. Ardö, J.; Tagesson, T.; Jamali, S.; Khatir, A. MODIS EVI-based net primary production in the Sahel 2000–2014. Int. J. Appl. Earth Obs. Geoinf. 2018, 65, 35–45. [Google Scholar] [CrossRef]
  51. Abdi, A.; Seaquist, J.; Tenenbaum, D.; Eklundh, L.; Ardö, J. The supply and demand of net primary production in the Sahel. Environ. Res. Lett. 2014, 9, 094003. [Google Scholar] [CrossRef]
  52. Brandt, M.; Rasmussen, K.; Peñuelas, J.; Tian, F.; Schurgers, G.; Verger, A.; Mertz, O.; Palmer, J.R.; Fensholt, R. Human population growth offsets climate-driven increase in woody vegetation in sub-Saharan Africa. Nat. Ecol. Evol. 2017, 1, 0081. [Google Scholar] [CrossRef] [PubMed] [Green Version]
  53. Stephenne, N.; Lambin, E. A dynamic simulation model of land-use changes in Sudano-sahelian countries of Africa (SALU). Agric. Ecosyst. Environ. 2001, 85, 145–161. [Google Scholar] [CrossRef]
  54. Epule, E.T.; Peng, C.; Lepage, L.; Chen, Z. The causes, effects and challenges of Sahelian droughts: A critical review. Reg. Environ. Change 2014, 14, 145–156. [Google Scholar] [CrossRef]
  55. Epule, T.E.; Ford, J.D.; Lwasa, S.; Lepage, L. Climate change adaptation in the Sahel. Environ. Sci. Policy 2017, 75, 121–137. [Google Scholar] [CrossRef]
  56. Ugbaje, S.U.; Odeh, I.O.; Bishop, T.F.; Li, J. Assessing the spatio-temporal variability of vegetation productivity in Africa: Quantifying the relative roles of climate variability and human activities. Int. J. Digit. Earth 2017, 10, 879–900. [Google Scholar] [CrossRef]
  57. Zhao, M.; Running, S.W. Drought-induced reduction in global terrestrial net primary production from 2000 through 2009. Science 2010, 329, 940–943. [Google Scholar] [CrossRef] [Green Version]
  58. Pan, S.; Dangal, S.R.; Tao, B.; Yang, J.; Tian, H. Recent patterns of terrestrial net primary production in Africa influenced by multiple environmental changes. Ecosyst. Health Sustain. 2015, 1, 1–15. [Google Scholar] [CrossRef] [Green Version]
  59. Olokeogun, O.S.; Ayanlade, A.; Popoola, O.O. Assessment of riparian zone dynamics and its flood-related implications in Eleyele area of Ibadan, Nigeria. Environ. Syst. Res. 2020, 9, 6. [Google Scholar] [CrossRef]
  60. Borisade, T.V.; Odiwe, A.I.; Akinwumiju, A.S.; Uwalaka, N.O.; Orimoogunje, O.I. Assessing the impacts of land use on riparian vegetation dynamics in Osun State, Nigeria. Trees, Forests and People 2021, 5, 100099. [Google Scholar] [CrossRef]
  61. Petrakis, R.E.; Van Leeuwen, W.J.; Villarreal, M.L.; Tashjian, P.; Dello Russo, R.; Scott, C.A. Historical analysis of riparian vegetation change in response to shifting management objectives on the Middle Rio Grande. Land 2017, 6, 29. [Google Scholar] [CrossRef] [Green Version]
  62. Nilsson, E.; Becker, P.; Uvo, C.B. Drivers of abrupt and gradual changes in agricultural systems in Chad. Reg. Environ. Change 2020, 20, 75. [Google Scholar] [CrossRef]
Figure 1. Schematic of the study area.
Atmosphere 14 00232 g001
Figure 2. Spatial distribution of average NPP from 2001–2020 in the CLCB.
Atmosphere 14 00232 g002
Figure 3. Spatial distribution of nature characteristics in the CLCB. (a) Spatial distribution of land cover; (b) Spatial distribution of precipitation.
Atmosphere 14 00232 g003
Figure 4. Spatial distribution of NPP trends in the CLCB from 2001 to 2020. The significance of each pixel is at the 5% level.
Atmosphere 14 00232 g004
Figure 5. Interannual average NPP in each terrestrial ecosystem from 2001 to 2020. (a) Interannual variation trend of average NPP in the CLCB; (b) NPP variation proportion in each terrestrial ecosystem.
Atmosphere 14 00232 g005
Figure 6. Driving factors of NPP in the CLCB. (a) Spatial distribution of driving factors of NPP, including increase factors and decrease factors; (b) Proportion of different factors of each terrestrial ecosystem.
Atmosphere 14 00232 g006
Figure 7. Typical characteristics of Nigeria. (a) Total population trends from 2001 to 2020; (b) Forest area variation trends from 2001 to 2020.
Atmosphere 14 00232 g007
Table 1. Data sources and basic characteristics.
DataResourcesResolution/mPeriod
Land CoverESA CCI3002001–2020
NDVIMOD13A15002001–2020
Potential EvapotranspirationTerraClimate4638.32001–2020
Total Solar RadiationTerraClimate4638.32001–2020
EvapotranspirationTerraClimate4638.32001–2020
PrecipitationTerraClimate4638.32001–2020
Surface TemperatureMOD11A110002001–2020
Table 2. Land cover reclassification based on the ESA-CCI land cover dataset.
Land Cover TypeESA CCI-LC CodesName
Croplands10,11,12Cropland, rainfed
20Cropland, irrigated
30cropland (>50%)/natural vegetation (<50%)
Forest50Tree cover, broadleaved, evergreen (>15%)
60,61Tree cover, broadleaved, deciduous (>15%)
70,71,72Tree cover, needle leaved, evergreen (>15%)
80,81Tree cover, needle leaved, deciduous (>15%)
90Tree cover, broadleaved and needle leaved
100tree and shrub (>50%)/herbaceous (<50%)
Grasslands40natural vegetation (>50%)/cropland (<50%)
110herbaceous (>50%)/tree and shrub (<50%)
120,122Shrubland
130Grassland
140Lichens and mosses
150,153Sparse vegetation (tree, shrub, herbaceous)
Wetlands160,170Tree cover, flooded
180Shrub or herbaceous, flooded
Artificial areas190Urban areas
Bare lands200,201,202Bare areas
220Permanent snow and ice
Water210Water bodies
Table 3. Classification rules to distinguish rainfall-driven NPP changes from changes caused by human factors.
NPP Trend
(p Value < 0.05)
Pearson Correlation CoefficientResidual Trend
(p Value < 0.05)
Interpretation of the NPP Trend
Positive NPP Trend
(slope > 0)
r > 0.49Slope > 0Precipitation and Human Activities
r > 0.49Slope < 0 or Slope (p value > 0.05)Precipitation
r < 0.49/Human Activities
Negative NPP Trend
(slope < 0)
r > 0.49Slope < 0Precipitation and Human Activities
r > 0.49Slope > 0 or Slope (p value > 0.05)Precipitation
r < 0.49/Human Activities
Table 4. Area and proportion of land cover types in the CLCB in 2020 (unit: km2).
CroplandsForestGrasslandsWetlandsArtificial AreasBare LandsWater
377,083.06241,672.65511,999.9013,882.431418.47141,016.485117.36
29.18%18.70%39.62%1.07%0.11%10.91%0.4%
Table 5. Annual average various data statistics of different land cover types in the CLCB between 2001 to 2020.
DataCroplandsForestGRASSLANDSWetlandsArtificial AreasBare LandsWater
NDVI0.320.570.320.460.290.100.22
Potential Evapotranspiration (mm)2158.411817.382210.862289.271995.922498.392133.22
Total Solar Radiation (W/m2)2961.262961.883045.063110.912818.153139.703057.57
Evapotranspiration (mm)588.79853.58508.41340.53679.01110.79578.49
Precipitation (mm)677.261029.74570.61360.07824.81116.74643.55
Surface Temperature (°C)39.0933.8139.1832.6837.0839.8631.22
Disclaimer/Publisher’s Note: The statements, opinions and data contained in all publications are solely those of the individual author(s) and contributor(s) and not of MDPI and/or the editor(s). MDPI and/or the editor(s) disclaim responsibility for any injury to people or property resulting from any ideas, methods, instructions or products referred to in the content.

