Article

Spatial-Temporal Seasonal Variability of Extreme Precipitation under Warming Climate in Pakistan

1
Department of Geography, Climate Research Institute (CRI), Konkuk University, Seoul 27478, Republic of Korea
2
Department of Civil Engineering, Ghulam Ishaq Khan Institute of Engineering Sciences and Technology, Topi 23640, Pakistan
3
Centre for Integrated Mountain Research (CIMR), Quaid e Azam Campus, University of the Punjab, Lahore 53720, Pakistan
4
Department of Complex Systems, Institute of Computer Science of the Czech Academy of Sciences, 182 07 Prague, Czech Republic
5
Faculty of Agriculture and Environmental Sciences, University of Rostock, 18059 Rostock, Germany
6
Crawford School of Public Policy, College of Asia & Pacific, Australian National University, Canberra 2600, Australia
7
International Centre for Integrated Mountain Development, Khumaltar, P.O. Box 3226, Kathmandu 44700, Nepal
*
Authors to whom correspondence should be addressed.
Atmosphere 2023, 14(2), 210; https://doi.org/10.3390/atmos14020210
Submission received: 4 October 2022 / Revised: 14 December 2022 / Accepted: 27 December 2022 / Published: 19 January 2023
(This article belongs to the Section Meteorology)

Abstract

:
Climate science has confirmed the alteration of the hydrological cycle attributed to global warming. This warming tendency affects the monsoon precipitation in Pakistan with an unprecedented intensity, causing severe flooding. Therefore, it is inevitable to observe the recent spring and summer monsoon changes in extreme precipitation throughout Pakistan. The present study examined 8 precipitation indices in the past 50-year period (1971–2020) (stretched to two data periods; 1971–1998 and 1999–2020) using Mann–Kendall and Sen’s method to investigate the direction and magnitude of the observed trends. Spring and summer wet days significantly increased in the central eastern (Kakul, Kotli, Jhelum) and western (Cherat, Chitral, Peshawar) regions in the 1st data period but significantly decreased in areas including the southern region in the 2nd data period. We further observed the high-intensity precipitation days (R10, R20) in the same seasons. The intensity of summer R20 was much stronger throughout Pakistan in the 1st data period which reduced significantly during the 2nd data period in northern and southern regions. We extended the circle of investigation to very heavy and extreme precipitation (R30 and R50). The intensity of R30 and R50 in summer followed the same pattern as observed for R10 and R20. However, R30 and R50 in pre-monsoon significantly increased in the northern, east-western, and south-eastern regions during the 2nd data period. Summer monsoon and westerly humid regions experienced a decreasing tendency of very heavy and severe precipitation in the 1st data period. Our results concluded that the most significant changes in precipitation extremes occurred with higher intensity and recurring frequency for all indices in spring and summer monsoon during the 2nd data period.

1. Introduction

Pakistan’s sensitivity to climate change was increasing in 1999–2020 as compared to 1971–1998. Pakistan has been facing many extreme events over the last 30 years. The recent floods (2010, 2013, 2014, 2015, 2020) and prolonged drought (1997–2002) were the climate-related extremes that impacted water resources and sustainable agricultural production in the country. The changes in extreme precipitation indices have also affected water resource management in the country, resulting in meteorological disasters. Some of the recent studies [1] reported that Pakistan has been affected by 152 climatic extreme events between 1999 and 2018, resulting in USD 3.8 billion in economic damage. Thus, further study is needed to quantify the severity of extreme precipitation changes to have a better understanding of climate change’s regional scale impact between 1971 and 1998 as well as 1999 and 2020. The objective of the current study was to quantify trend changes and extreme precipitation season-wise between the 1971–1990 and 1999–2020 periods.
Extreme precipitation events changed the frequency, severity, and length over space and time due to climate change caused by global warming [2]. Recent studies predict that increases in intense precipitation observed in the late 20th century will continue, with far more severe repercussions [3,4]. To assess the spatiotemporal trends in extreme precipitation in different parts of the world, numerous kinds of research have been carried out. In many of these investigations, extreme precipitation showed increasing trends [5,6]. The frequency and intensity of severe extreme precipitation occurrences vary widely between climatological regions globally.
Numerous studies have been conducted globally regarding extreme precipitation days on an annual and seasonal basis. A few of them [7] explored the probability of extreme precipitation events under the global warming scenarios 1.5 °C and 2 °C in the East-Central Asian regions. The results revealed that the occurrence of R95p annual days were reduced by 3 days/year in humid regions and 1 day/year in semi-arid regions at global warming of 1.5 °C scenarios instead of 2 °C in southeast China and Himalayan regions. According to detailed observation, the fraction of severe precipitation in total precipitation was found to increase by 10% because of the additional 0.5 °C of warming. The same follow-up studies [8] examined the changes in the trends of extreme precipitation events during 1966–2015 in Nepal. The analysis found 1-day extreme precipitation peaks in the southern foothills, with highest intensity in the central region of Nepal. Moreover, several studies have been conducted regarding extreme precipitation in India. Such studies highlighted the changes in extreme precipitation in the northeast regions of India [9,10,11]. Similarly, Ref [12] estimated the impact of the 2010 flood in Pakistan using climate data. In a nutshell, climate change has significantly increased the intensity of extreme precipitation in various regions globally.
As far as regional impact is concerned, Pakistan is one of the most highly vulnerable countries in terms of the ecosystem to climate change due to its complex topography, geographical location, and dynamic climatology. Numerous studies observed changes in extreme precipitation trends in overall Pakistan [13,14,15,16,17,18,19], provincial level and in northern areas [20,21,22,23,24]. Some of these studies, for instance [24], characterized rainfall intensity ranging from less than 1 mm per day to a value of 50 mm per day using nine daily-based rainfall indices. Additionally, various results from the trend analysis of rainfall intensity could occur for the same type of rainfall.
Some of these proposed that northeastern regions exhibit the greatest number of extreme precipitation events of more than 100 mm between 1991 and 2000 [21]. Over the southeast parts of Pakistan, extreme rainfall events with less than 50 mm per day were observed more frequently during 1961 and 2000. In the past 54 years, the annual rainfall trends (extremes) have been increased in the Azad Jammu Kashmir (AJK) and Gilgit-Baltistan (GB) regions, while there have been noticeable increases in heavy rainfall 99% of the time in the Kotli and Muzaffarabad regions [18]. The two indices were divided into categories by [15] using thresholds for precipitation during the summer monsoon. First, the daily criterion of 50 mm/day is used to define extreme rainfall occurrences. Similarly, [17] described an annual maximum consecutive 5-day rainfall (RX5 day) from 1976 to 2005 as heavy rainfall. Indus delta in Sindh, Pakistan experienced trends in 1-day and 5-day severe rainfall from 1981 to 2015. Except for Rohari, which is situated on the highest point in Sindh, the analysis suggests that the area under investigation is dry [24]. Moreover, [22] listed the number of days with very high rainfall in Pakistan’s northern area between 1971 and 1990. The patterns of extreme rainfall showed no discernible shift, however the northwest regions of the Ghizer and Hunza experienced notable changes in extreme occurrences in summer. In all of Pakistan’s provinces, the Rx1day, Rx5 day, R95pTOT, and R99pTOT all showed an upward trend [25]. Baluchistan and Sindh provinces exhibited non-significant trends, whilst the northern regions exhibited more pronounced trends when compared to the southern regions. According to the analysis, total rainfall increased by 120 mm, while R95 and R99 increased by 122% and 100%, respectively. Furthermore, Rx1 day and Rx5 day indicated a nonsignificant increase of around 25 mm and 50 mm, respectively.
The daily changes in precipitation over the tropical monsoon are used to characterize the wet and dry spells. Long stretches of extraordinarily wet weather are known as wet spells. Dry spells, on the other hand, are protracted times of dryness. On wet and dry spells and their effects on summer monsoon rainfall in various locations of Pakistan, a few studies addressed, however, the same issue. For instance, [20] suggested increased wet days in summer attributed to severe flooding in Pakistan’s Punjab province during 1980 and 2010. Furthermore, in desert and humid regions, the dry spells increased while wet spells increased from 1976 to 2007. No discernible change was observed in the semiarid zones. Some of the abovementioned studies explicitly investigated the substantially longer (shorter) wet (dry) spells in Pakistan’s northern and southern regions and concluded a considerable increase in the number of rainy days between 1961 and 2009 [14,16]. Most of these studies were restricted to the quantification of wet/dry spells based on shorter data periods rather than focusing on the intensity and frequency of a particular season with updated precipitation records. The present study mainly revolves around the variation of precipitation extreme in spring and summer across all of Pakistan. We have divided the study area into four different regions based on the previously observed precipitation trends. This division represents the visible deviation of precipitation under different climatic factors. Furthermore, the data period has been extended to 1971–2020 to observe the recent changes in extreme precipitation. This data period was further divided into two data series (1971–1998; 1999–2020) to observe the apparent change in each data series.

2. Data and Methodology
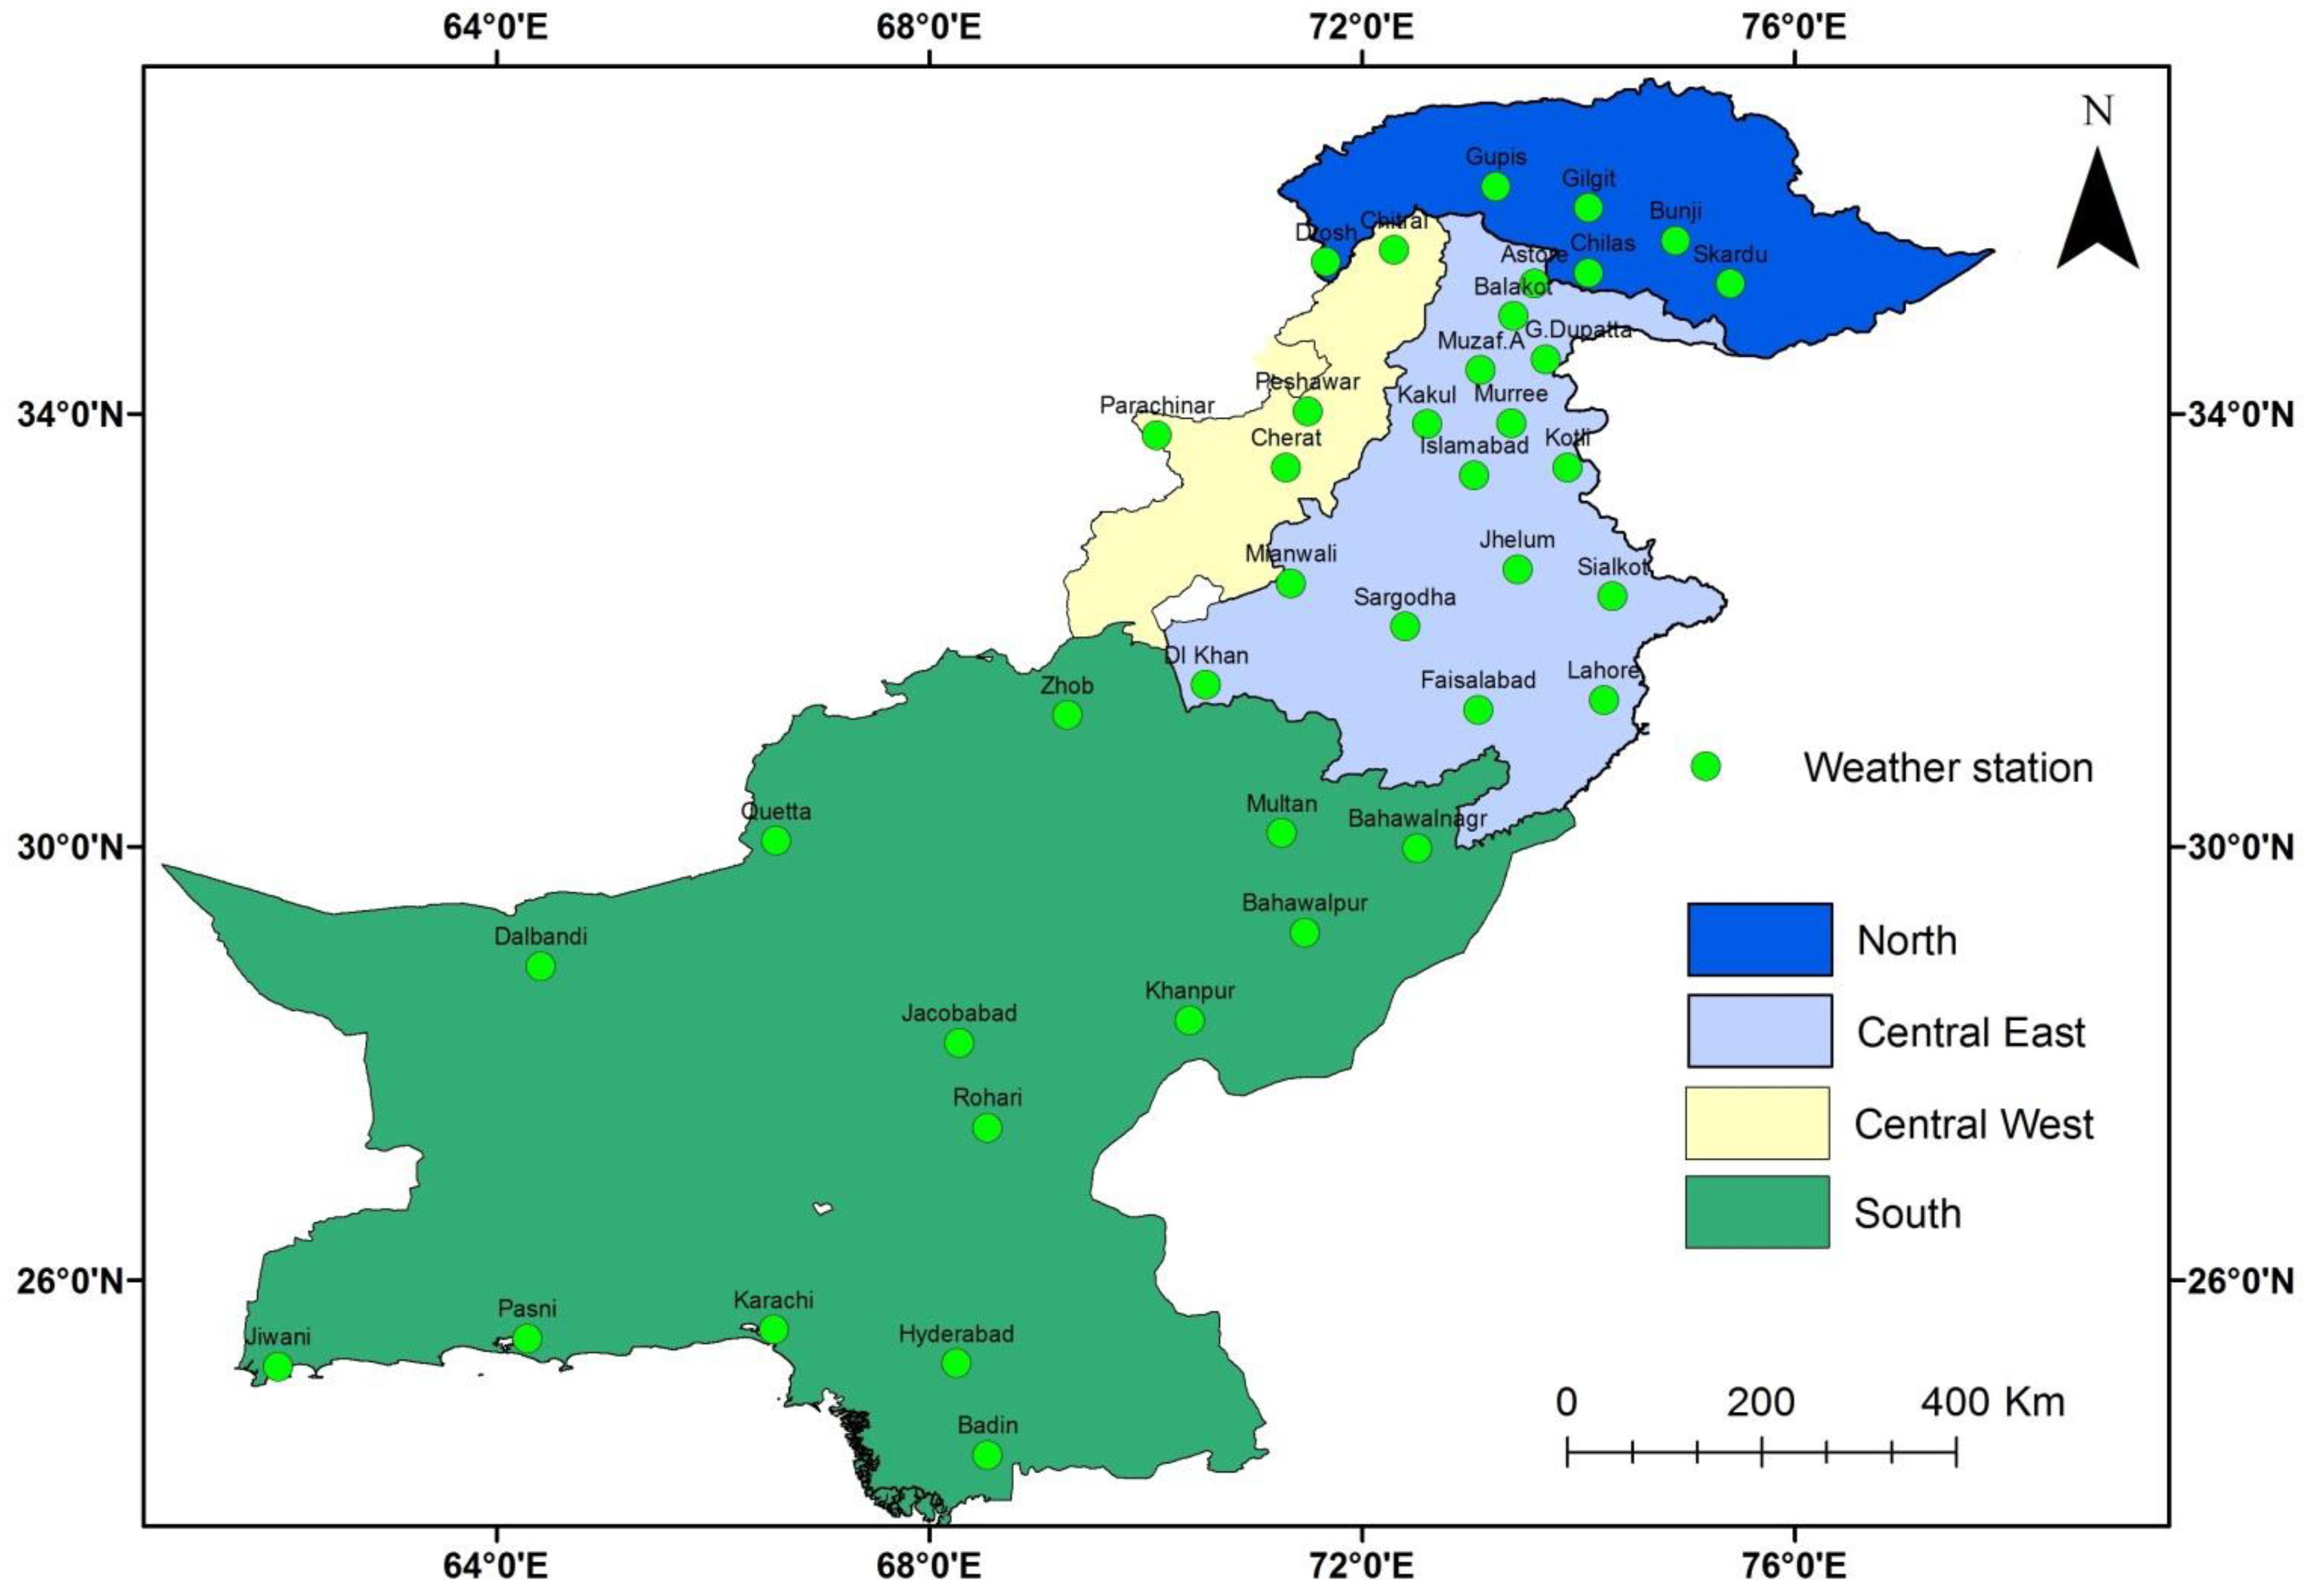
2.1. Study Regions

Pakistan is fenced by the borders of India in the east, China to the north, Afghanistan to the northwest, and Iran to the west. Geographically, it covers an area of 796,096 km2 of land and extends 885 km east–west and 1600 km north–south. There are six physiographic regions from the east–west and northeast. These are the northern mountains, western mountains, Balouchistan Plateau, Potwar plateau, Salt range, and Deserts. The landscape of Pakistan is diversified with high-elevated mountains in the upper zone, agricultural-dominated areas in the middle zone, and a coastal belt in the lower zones, most of them arid and semi-arid except for the southern slopes of the Himalayas and the sub-Himalayas. Approximately 50% of the area is classified as arid, 40% as semi-arid, and 10% as a humid environment [23]. In addition, the whole Sindh region, southern Punjab, central regions of the north, and southern Balouchistan have arid climates. Pakistan is an agrarian country where more than 65% of people depend on agriculture-based economic activities. The major source of irrigation is seasonal precipitation. Thus, precipitation is a significant factor for agriculture planning and development in the country.
The amount of precipitation increases from the northeast (humid areas) to the southwest (arid areas) over the Indus. The monsoon system and westerlies control weather systems that regulate the amount and distribution of precipitation across Pakistan. Approximately 50–70% of the total precipitation is associated with summer monsoon, which is controlled by the monsoon wind mechanism. The winter precipitation is influenced by western disturbances. On a seasonal scale, there are two peak precipitation seasons. The country’s northern areas experienced snowfall, as a result of the winter precipitation and summer monsoon season which lasted from June to September over the northeast and southeast regions [26]. In the context of temperature, the maximum average temperature of more than 35 °C is found in the southwest regions and the minimum average temperature is <0 °C in the northern regions.

2.2. Materials and Methods

The daily precipitation datasets of 37 weather observatories were provided by Pakistan Meteorological Department (PMD) to quantify extreme precipitation variability events between 1971 and 1998 (1st data period) as well as 1999 and 2020 (2nd data period). The locations of the observatory weather stations are shown in Figure 1. PMD has a network of synoptic-scale weather observatories to control the various meteorological parameters for their efficient use in many disciplines of research studies of different regions. To assure the dataset quality, the missing data of all studied weather stations were checked. The study analysis includes all stations with less than 10% missing values. Data were tabulated into spring and summer seasons based on monthly division of three months, i.e., March–May and June–July, respectively. The maximum precipitation occurs at the central east stations in summer. It is also evident that the summer precipitation increased in the second data period not only at the central east but extended to southern stations in Punjab province compared to the first data period as shown in Figure 2.

2.2.1. Mann–Kendal Test

The objective of the trend estimation involves the estimation of the value of the variable that has changed most significantly over the study duration [27]. Whether the assessment of the trend is statistically significant or not could be computed using the parametric or nonparametric tests. The climatologist typically uses non-parametric methods to assess the magnitude of the trend. The MK test enables the significance of trends in precipitation indices [28,29]. The non-parametric test is free from normal distribution of data and does not require or is less sensitive towards homogenization of the time series data which makes it a perfect trend detector [30]. MK is the nonparametric test that is influenced by autocorrelation. Many approaches have been introduced in the literature to address autocorrelation, including trend-free pre-whitening (TFPW) approaches [31,32,33]. The pre-whitening test was used to remove significant positive and negative autocorrelation. From the detailed observation, it is found that all the investigated weather stations have no autocorrelation. No significant homogenization problem was found in all dataset’s time series. The objective of the homogenization approach is to identify outliers or spikes in the observation dataset that were created by preventable errors in the instrumentations, relocations, replacements, environments, and procedures used to gather the data [34].
The Mann–Kendall statistic Zmk was evaluated the following:
z m k = { S 1 σ s i f   S > 0 0 i f   S = 0 S + 1 σ s i f   S < 0 } .
The MK statistic S is calculated as
S = k = 1 n 1 j = k + 1 n s g n ( x j x k ) ,
where n shows the number of years, xj and xk represent values (annual) in that year of j and k, correspondingly. The function sgn (xj − xk) determines that either value, 1, 0 or −1, should be employed depending upon the difference of (xj − xk), where j > k:
S g n ( x j x k ) = { 1 i f   x j x k > 0 0 i f   x j x k = 0 1 i f   x j x k < 0 } .
Zmk presents increasing trend with a positive value and vice versa. If the probability with null hypothesis Ho exceeds the test statistic Zmk for selected significance level α, it indicates the presence of significant trend where the test statistic (S) must follow the standard normal distribution. The null hypothesis Ho stands correct in the absence of any trend using the standard normal table to reject Ho. For the assessment of To being either positive or negative trend at α level of significance, Ho is rejected if the absolute value of Zmk > Z1−a/2 at the α-level of significance.

2.2.2. Sen’s Slope Estimator

The SS estimator determines the magnitude of the trend in the selected indices [35]. Sen’s formula enabled the variation within the selected data series using slope value. Such variation over time was estimated relative to mean daily discharge. The relative units were used, as discharge varies significantly between the two gauges; therefore, absolute change comparison is daunting. The intercomparison becomes difficult due to small magnitude of change in daily discharge.
N pairs of data was computed in the first phase using the following relation:
Q = x j x k j k if   j > k .
The Sen’s estimator of slope shows the median of these N values of Q. The median of the N slope is calculated in common way. N values of Qi were arranged from minimum to maximum.
The Sen’s estimator is given as follows:
Sen’s Estimator =   Q [ ( N + 1 ) 2 ] If N was odd,
1 2 ( Q N 2 + Q ( N + 2 ) 2 ) If N was even.
Ultimately, Qmed uses a double-tailed test with 100 (1−α)% confidence interval while Sen’s method enabled true slope, whereas the six indices used in this study were adopted from the World Meteorological Organization’s (WMO) Experts Team on Climate Change Detection Indices (ETCCDI) list [36,37]. The classification of wet and dry days depends on the amount of precipitation that occurred: if the amount is greater than 1 mm it will be considered as a wet day and vice versa. Following the same criteria, R10, R20, R30 and R50 will be classified as heavy, very heavy, extreme and severe precipitation days, respectively. The trend changes of the extreme precipitation indicators were displayed using Inverse Distance Weighting (IDW).

3. Results

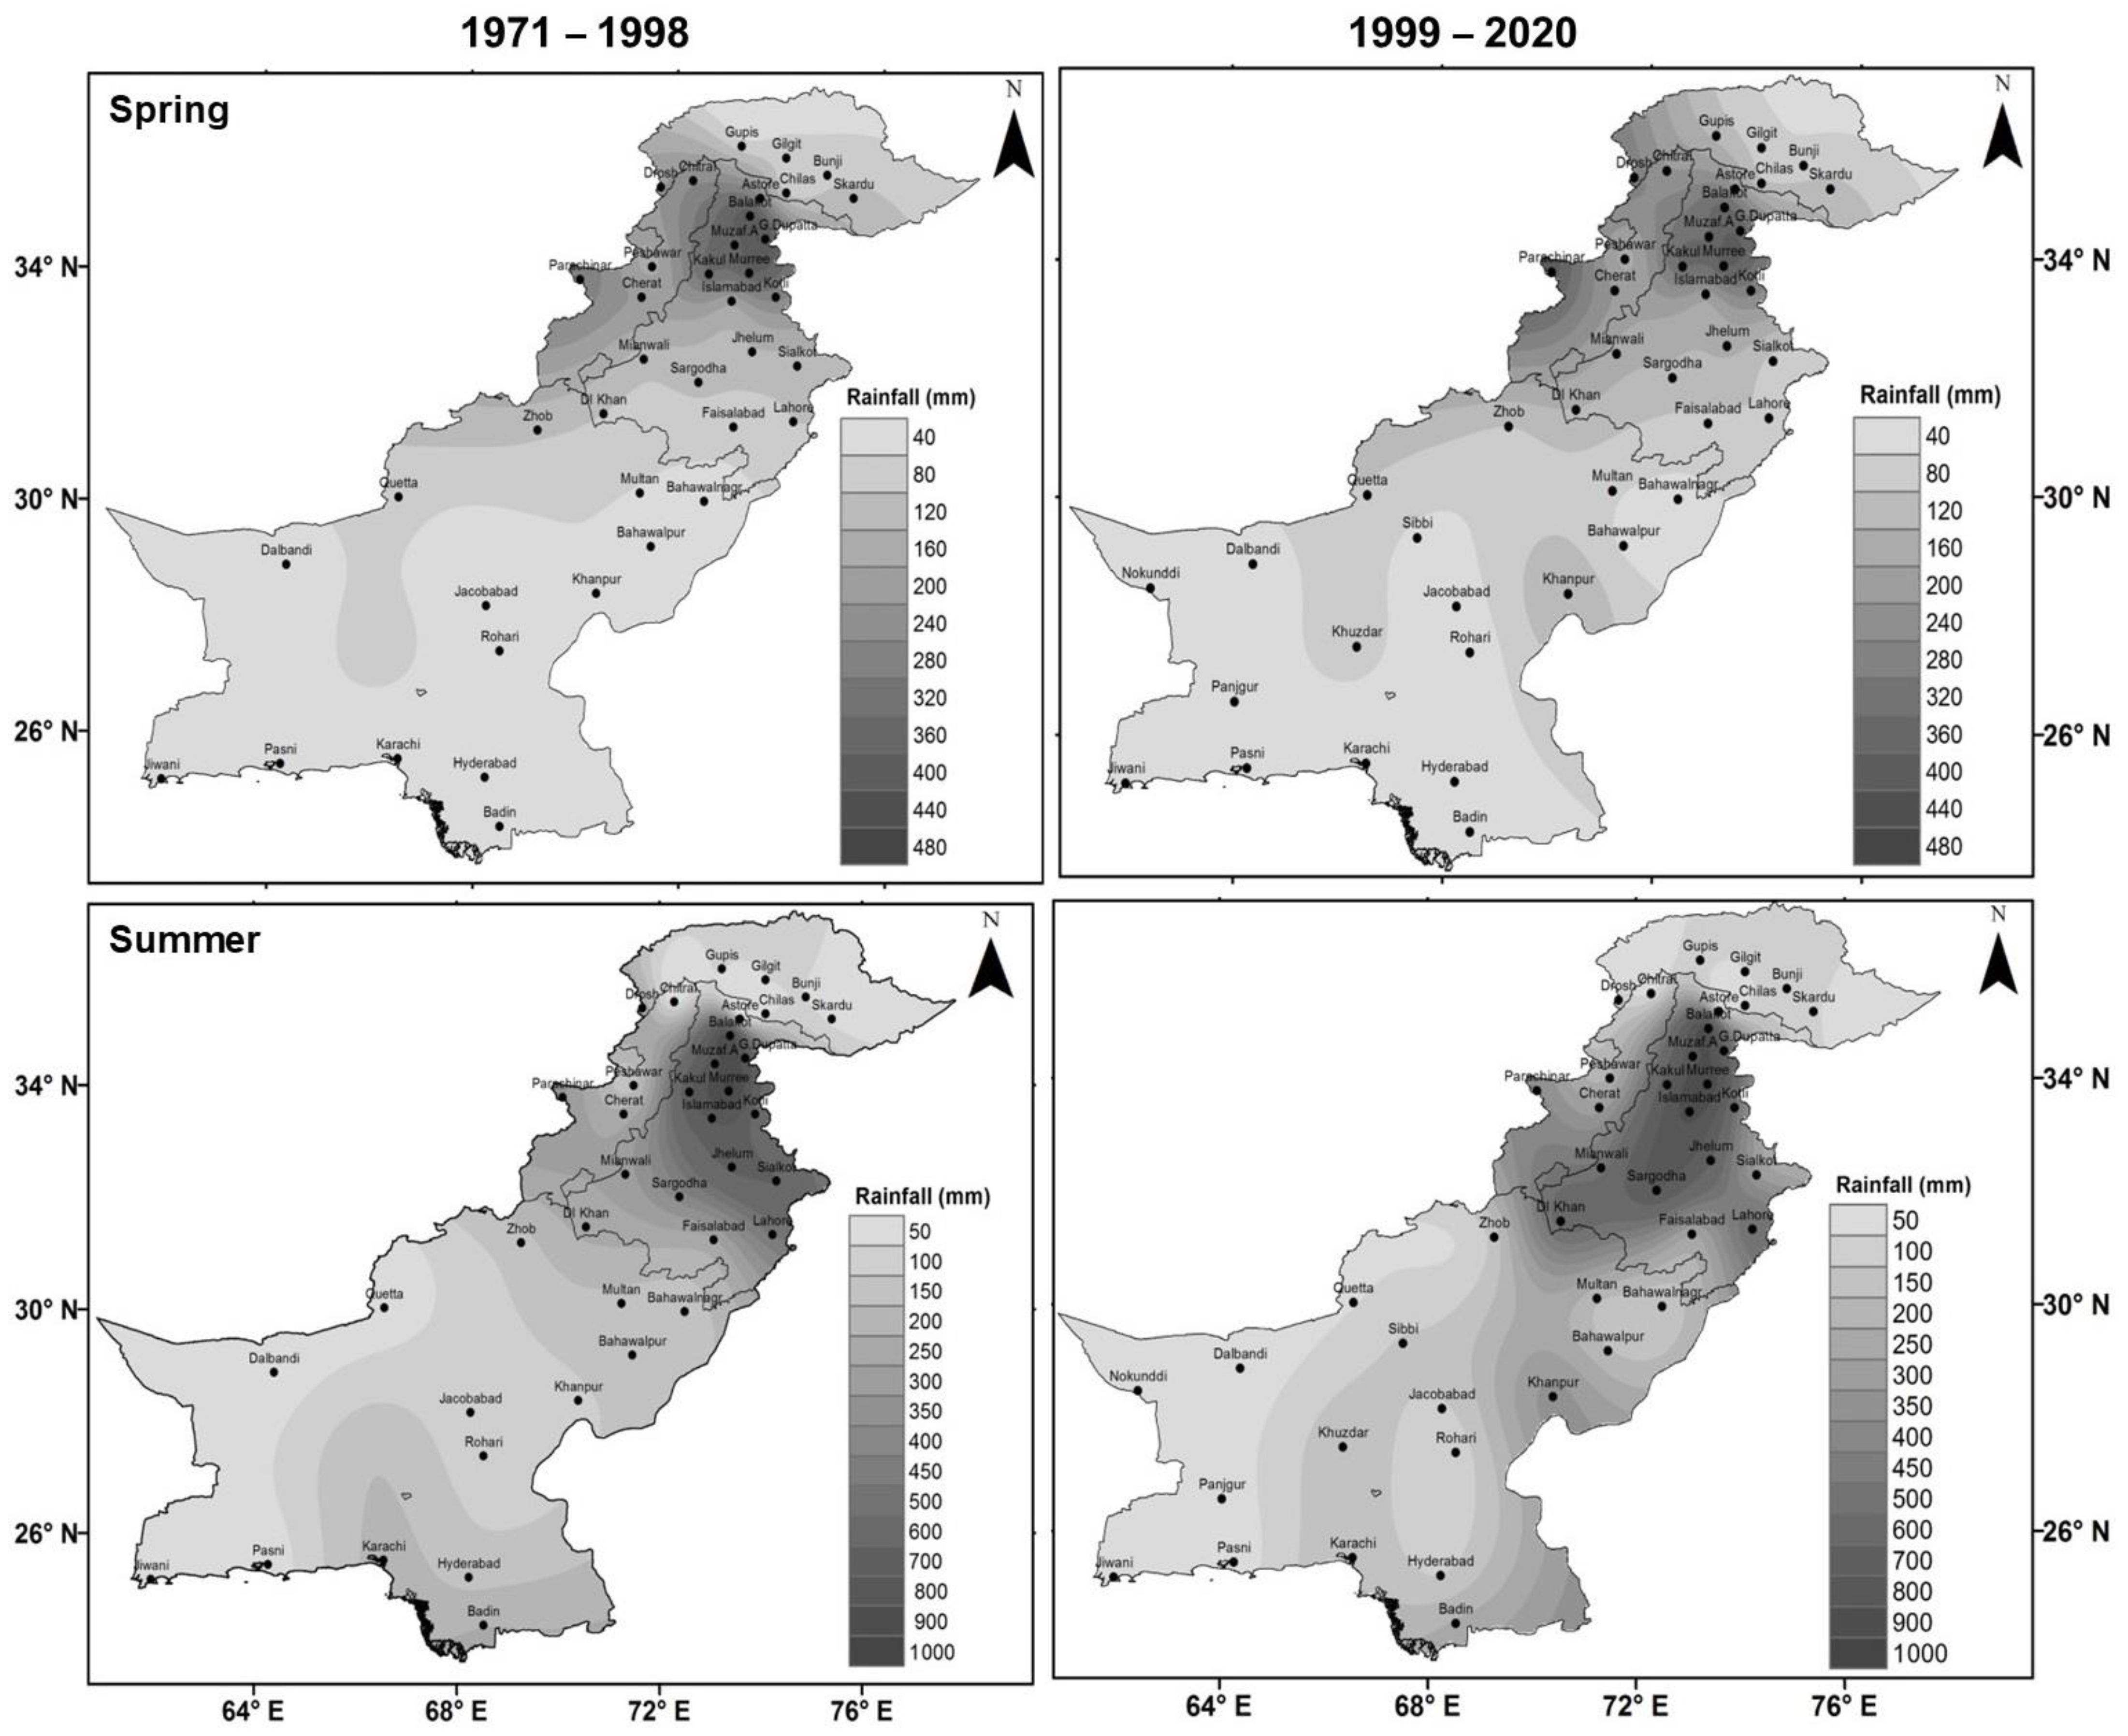
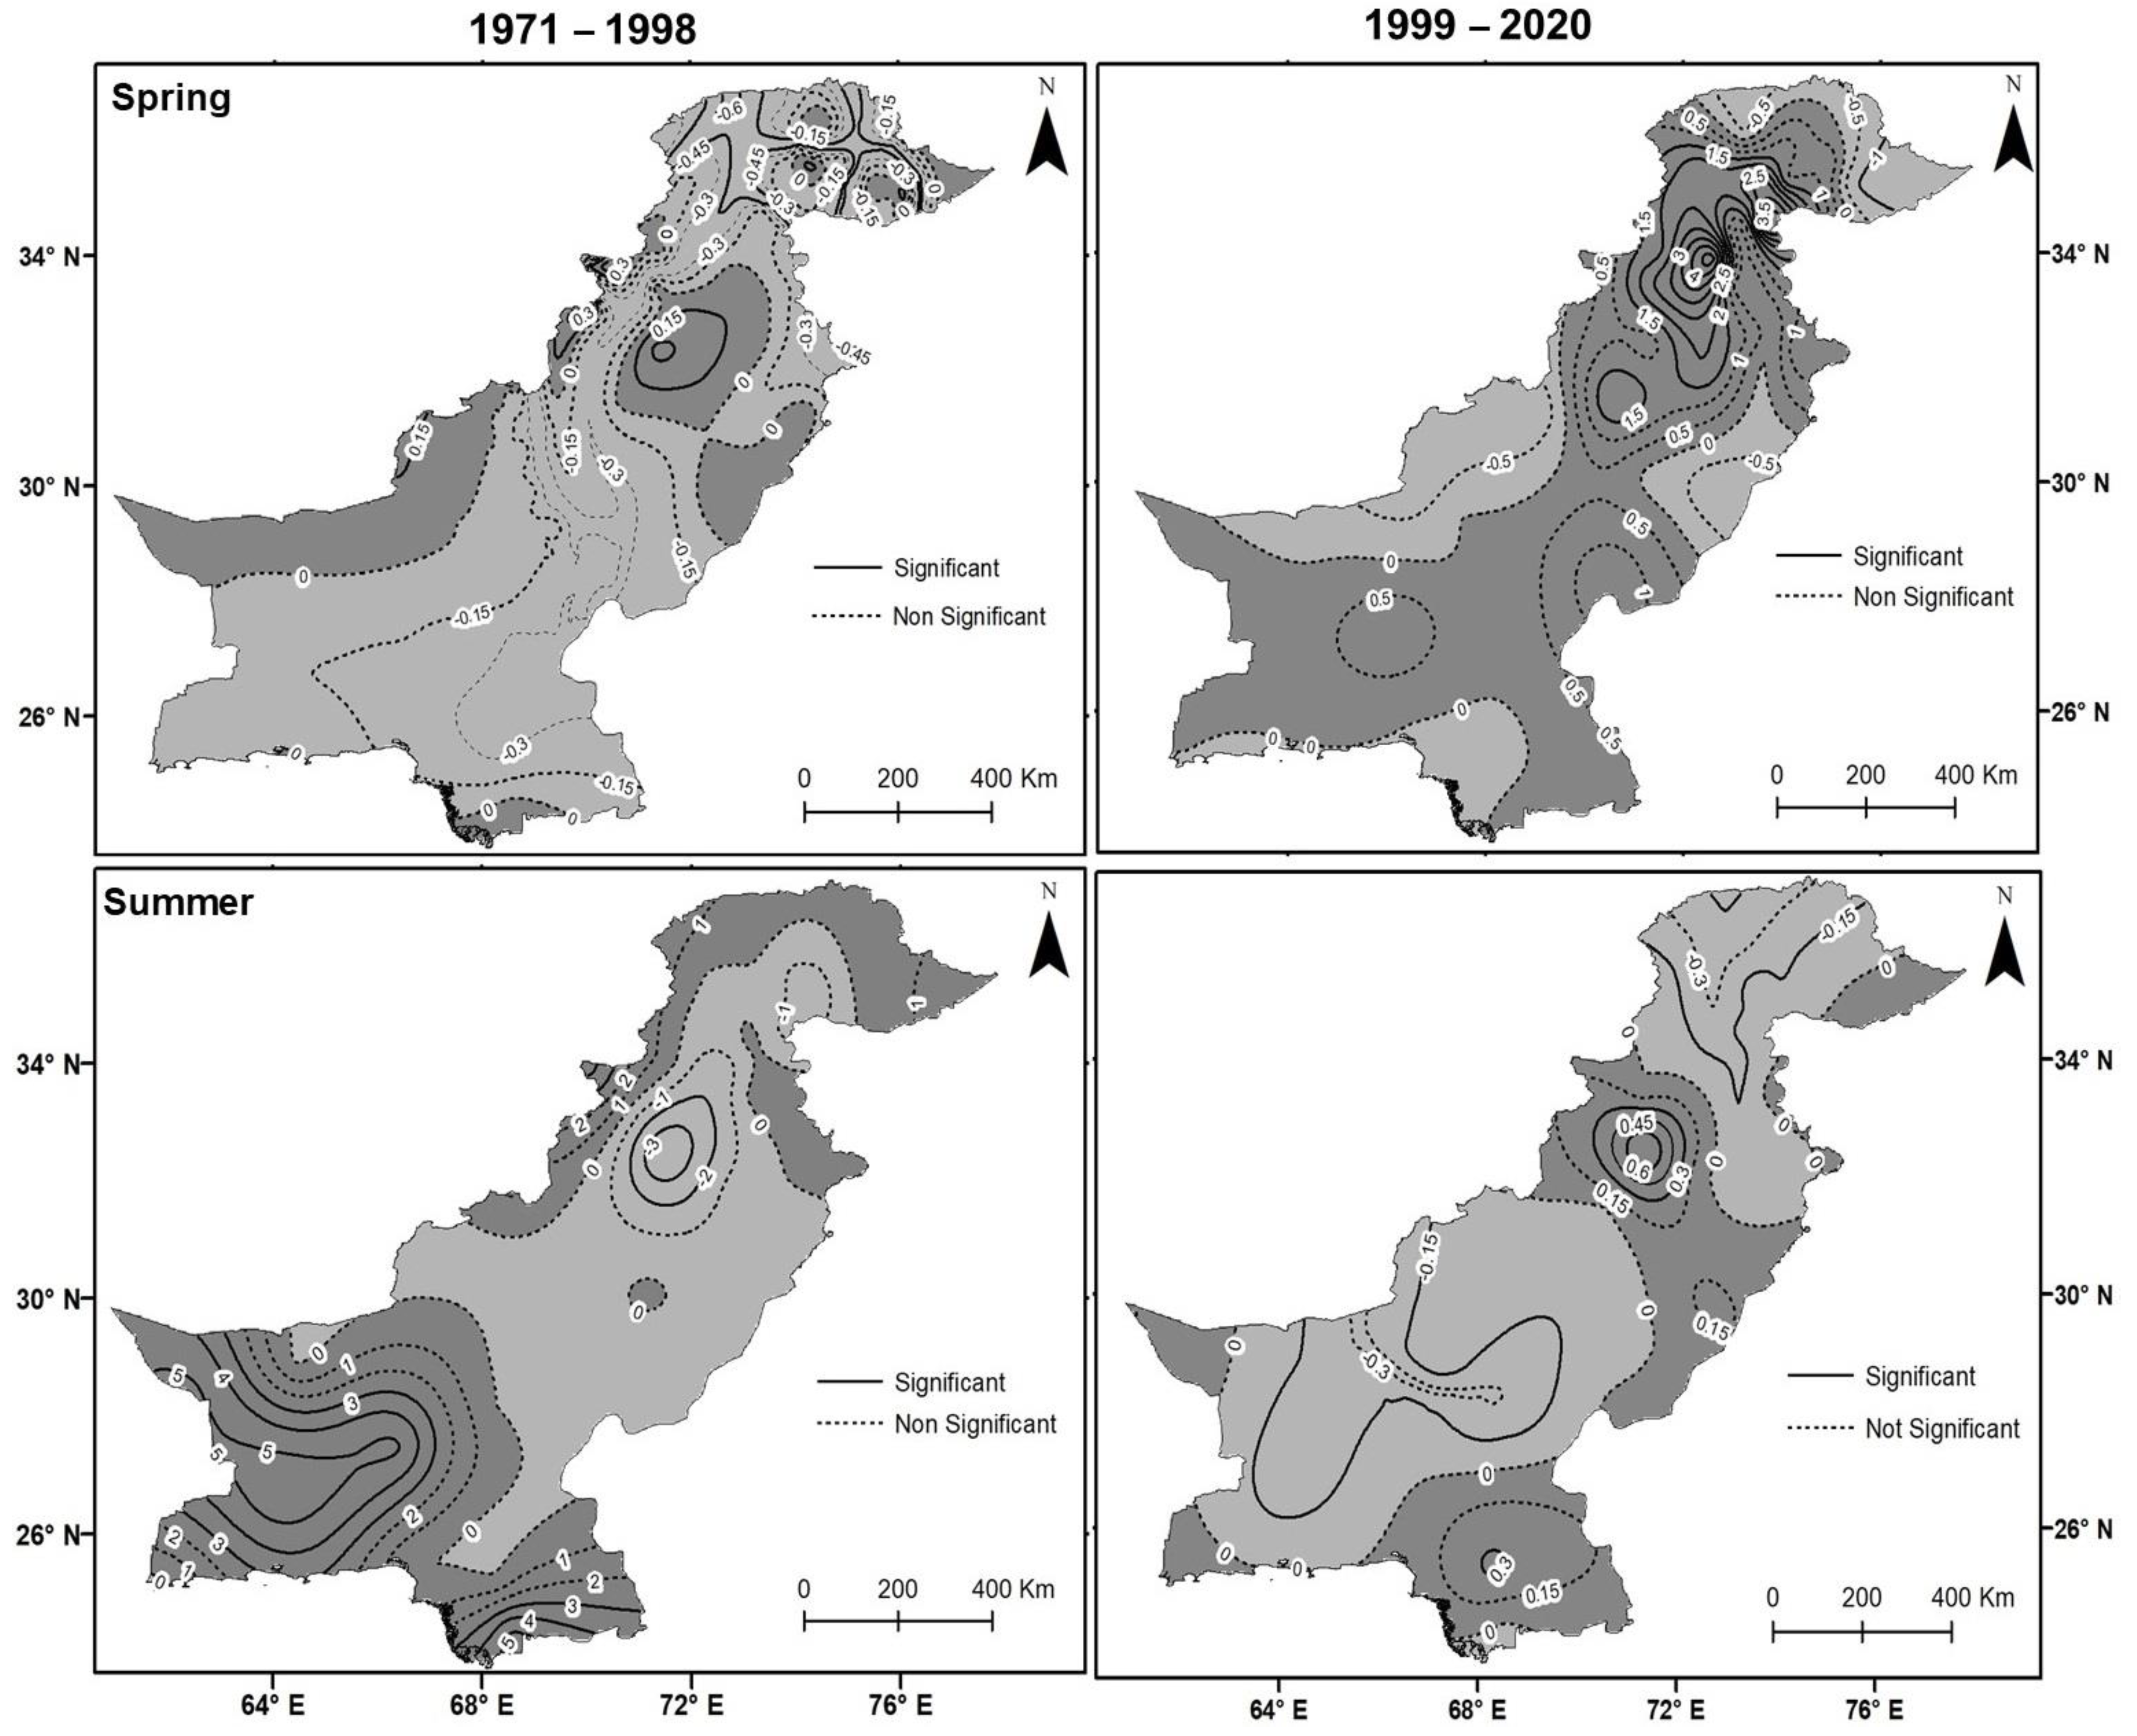
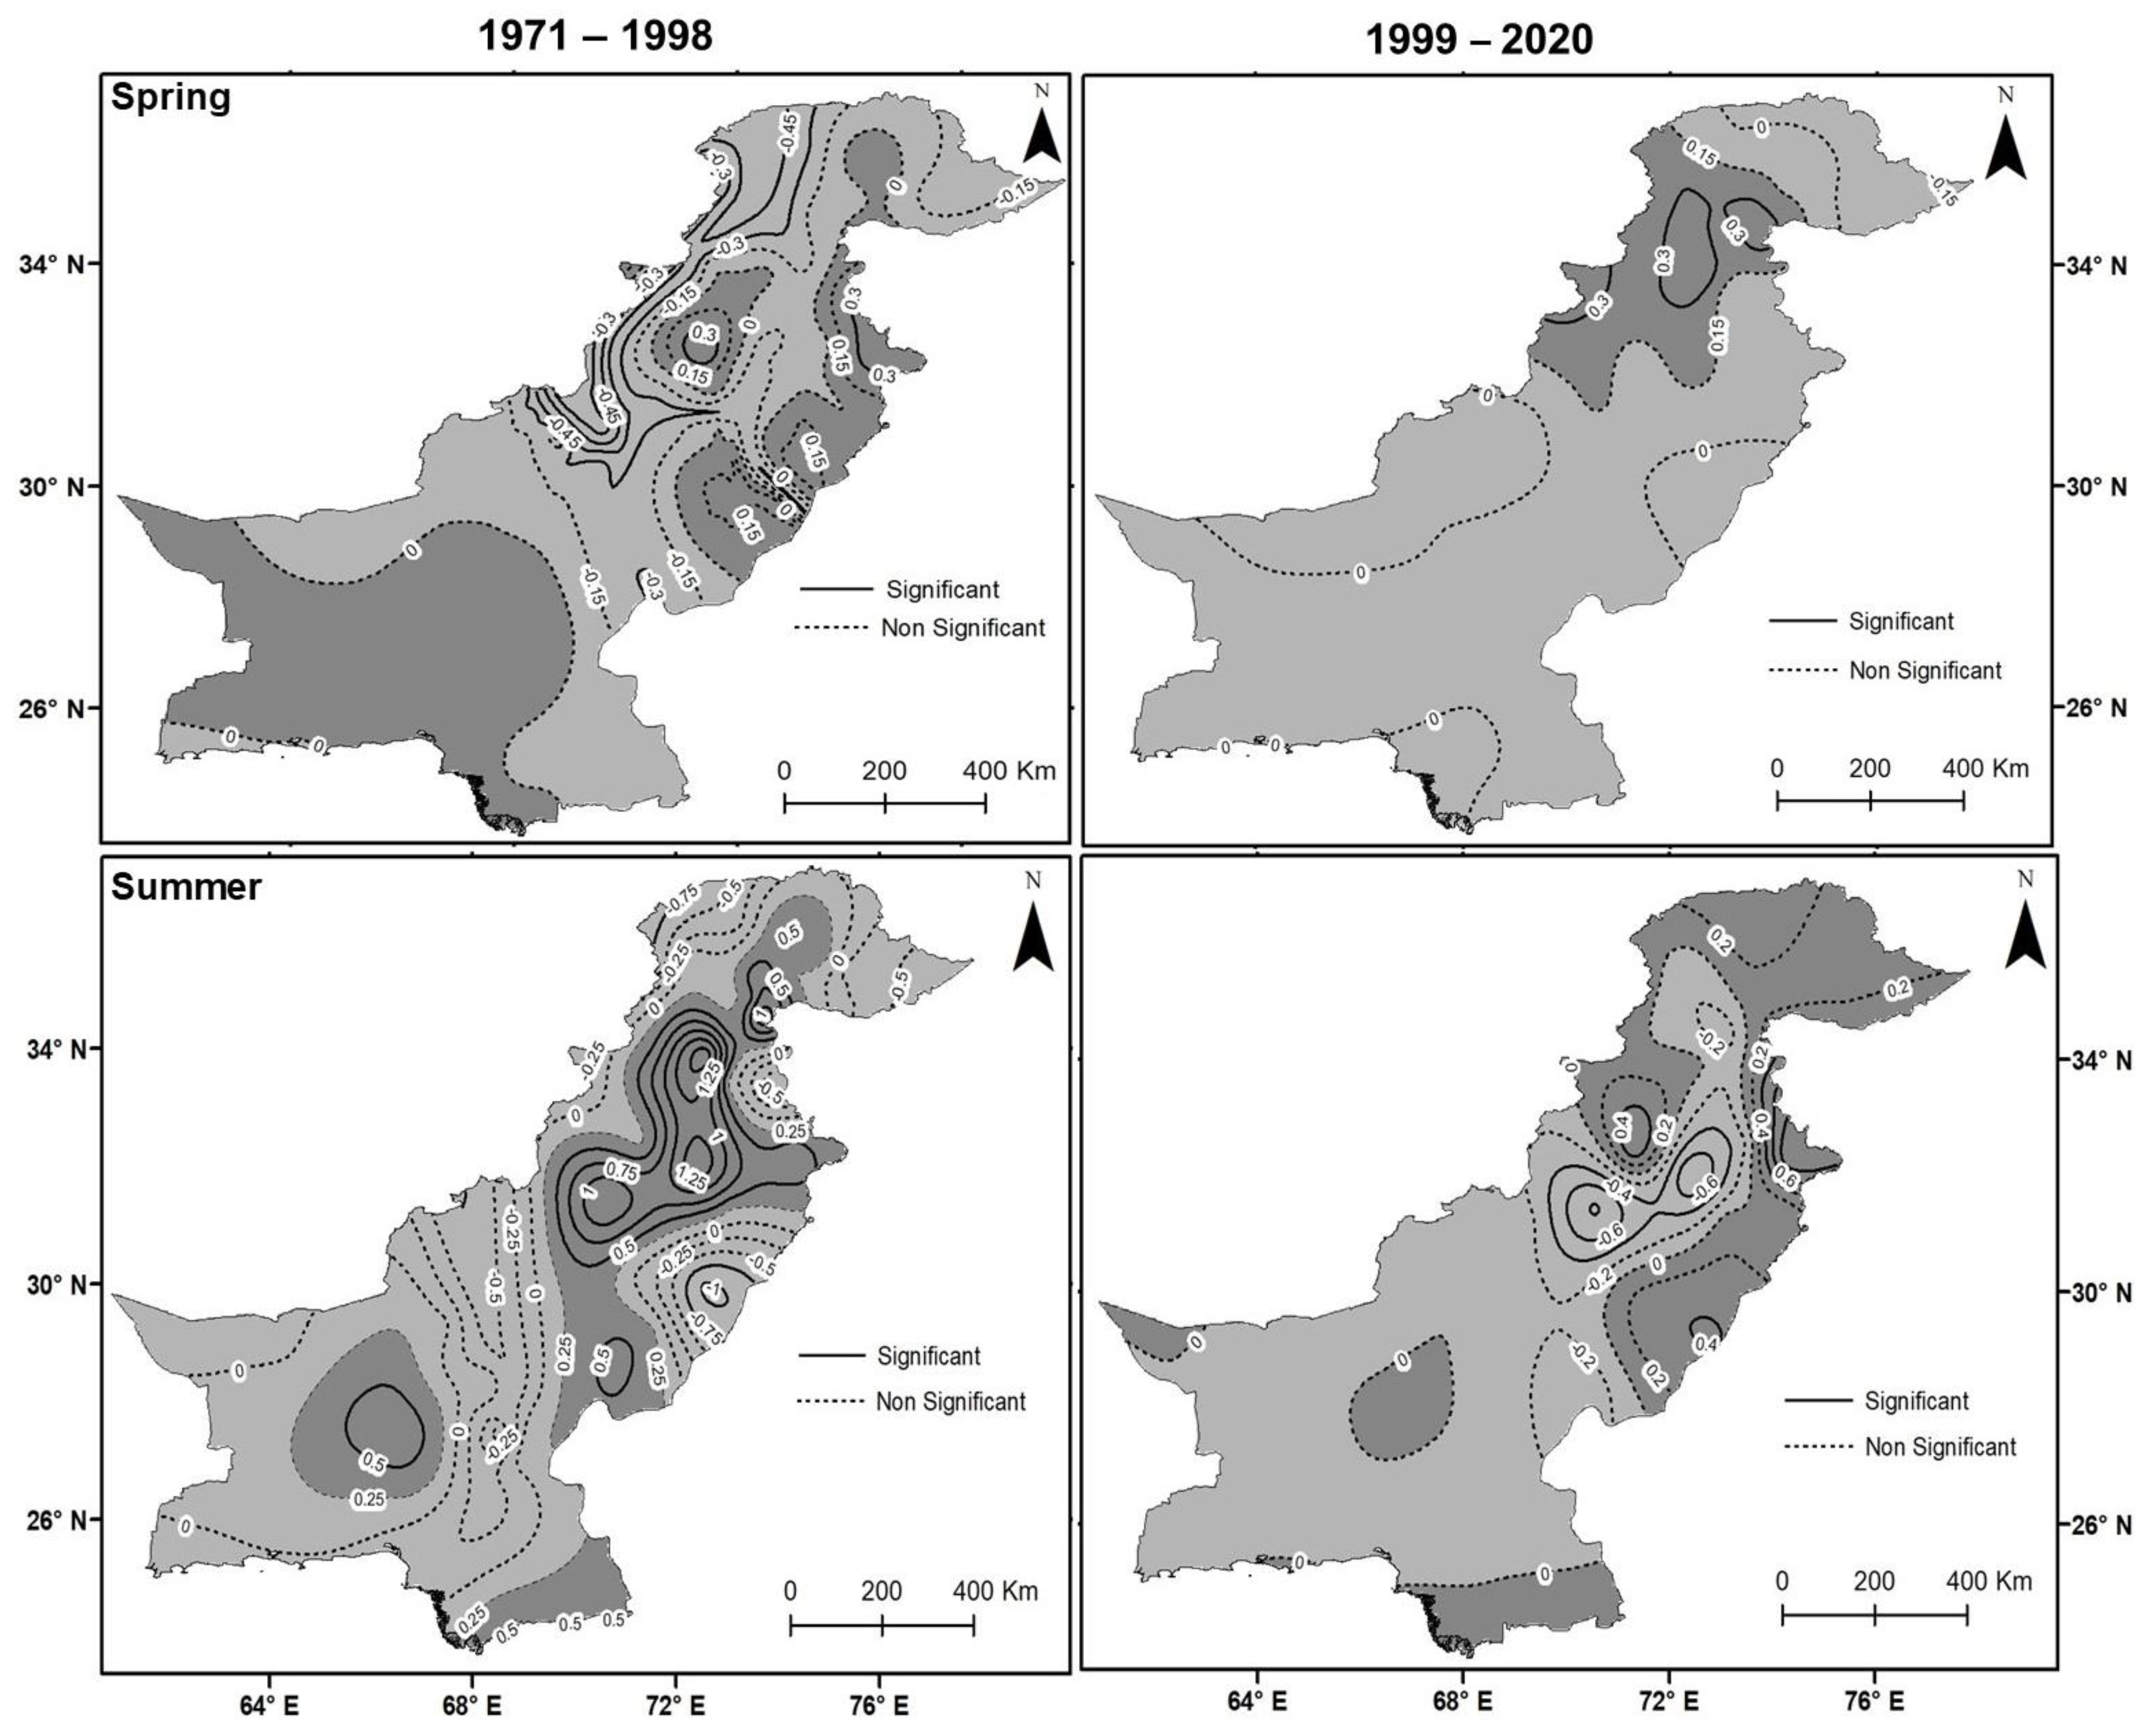
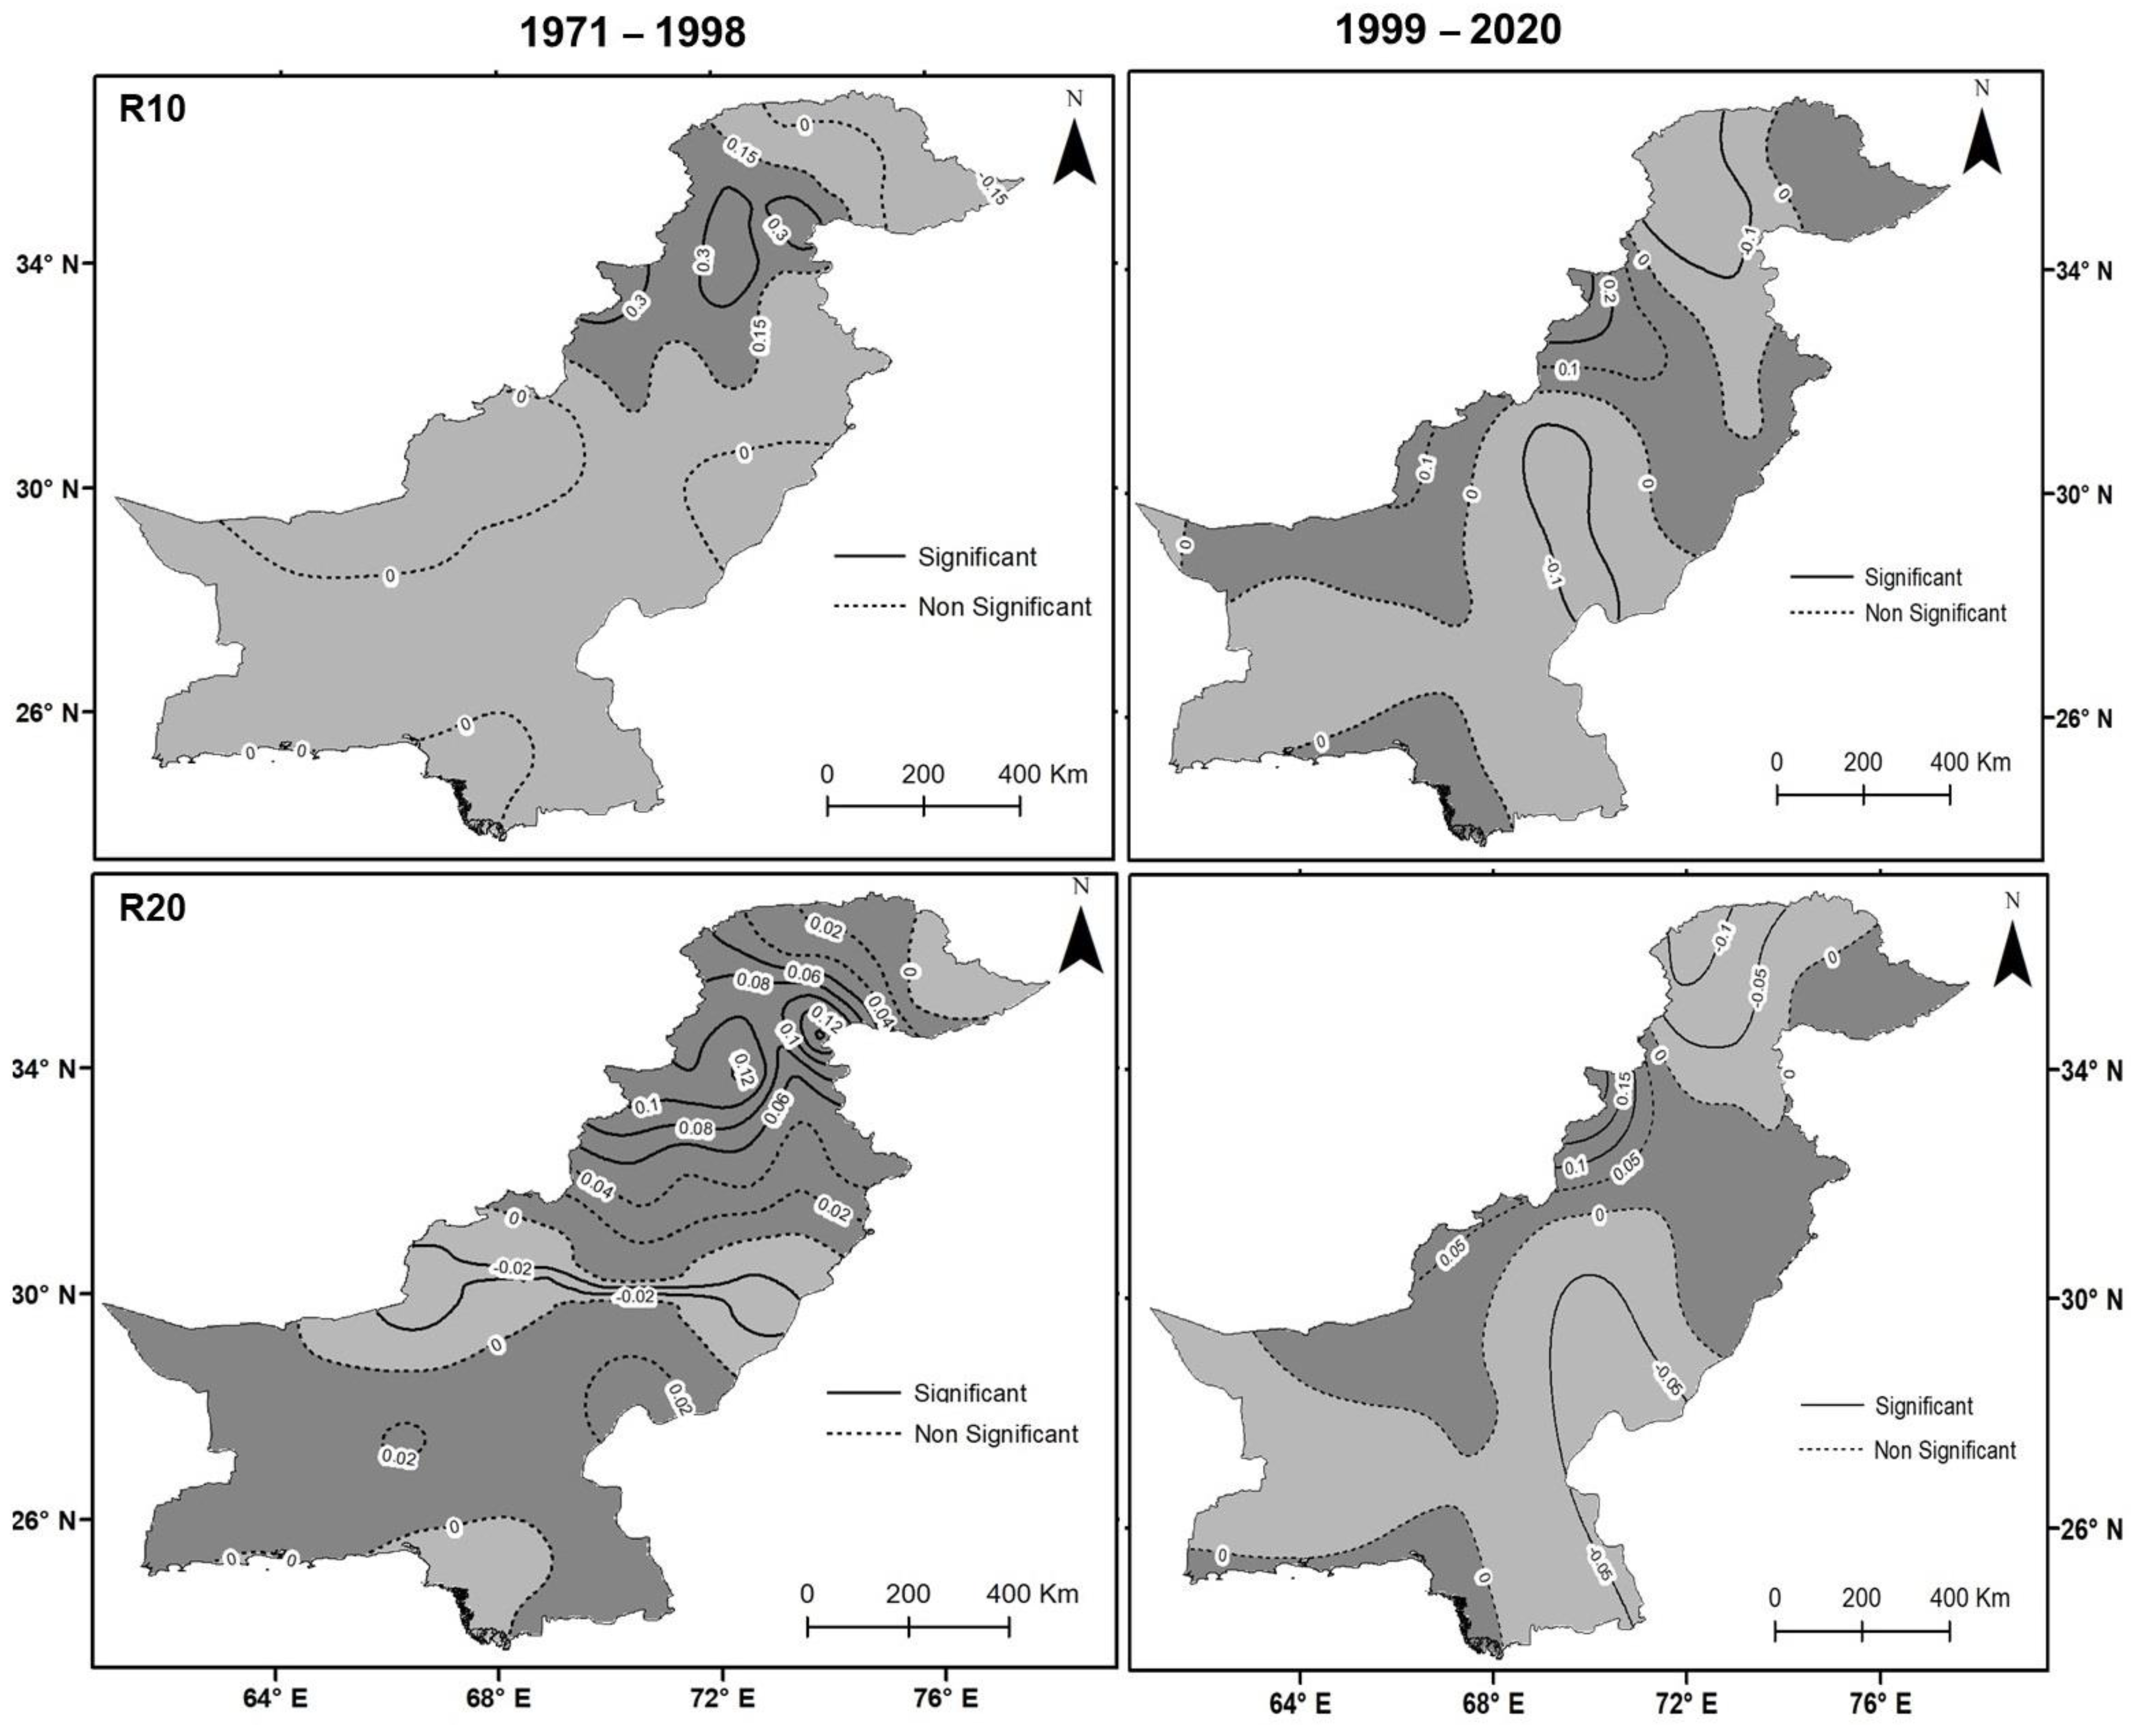
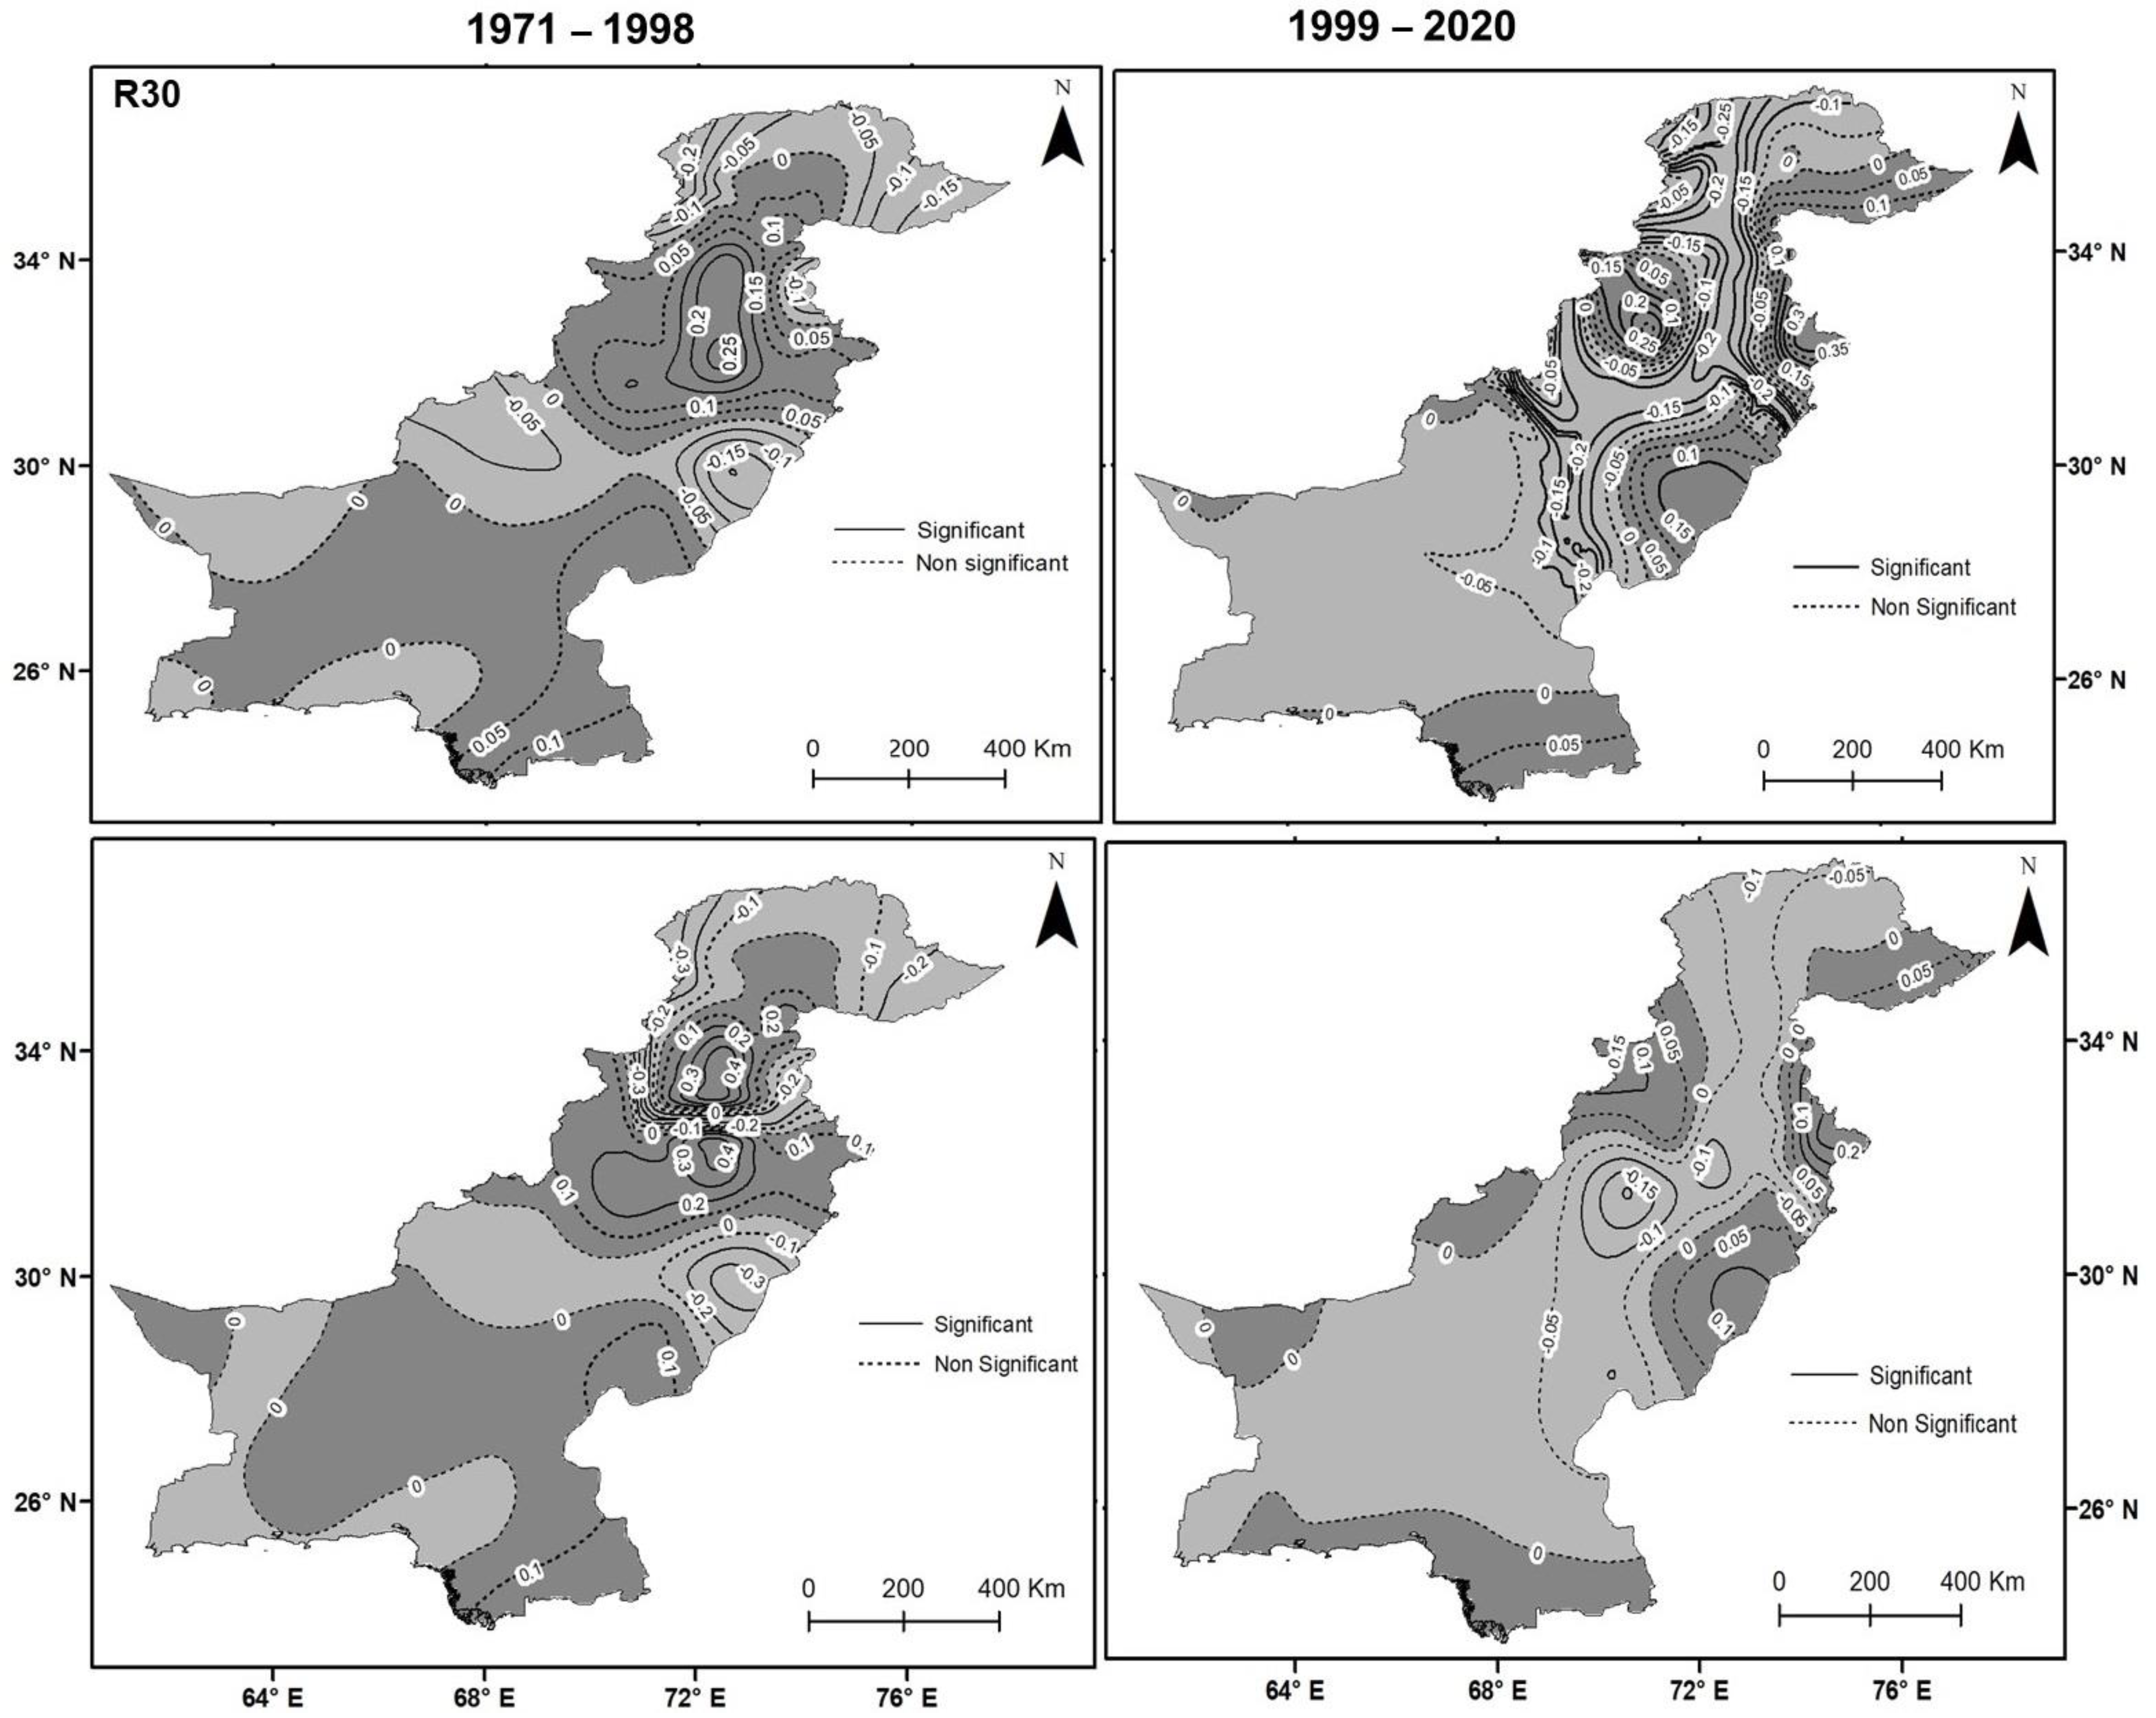
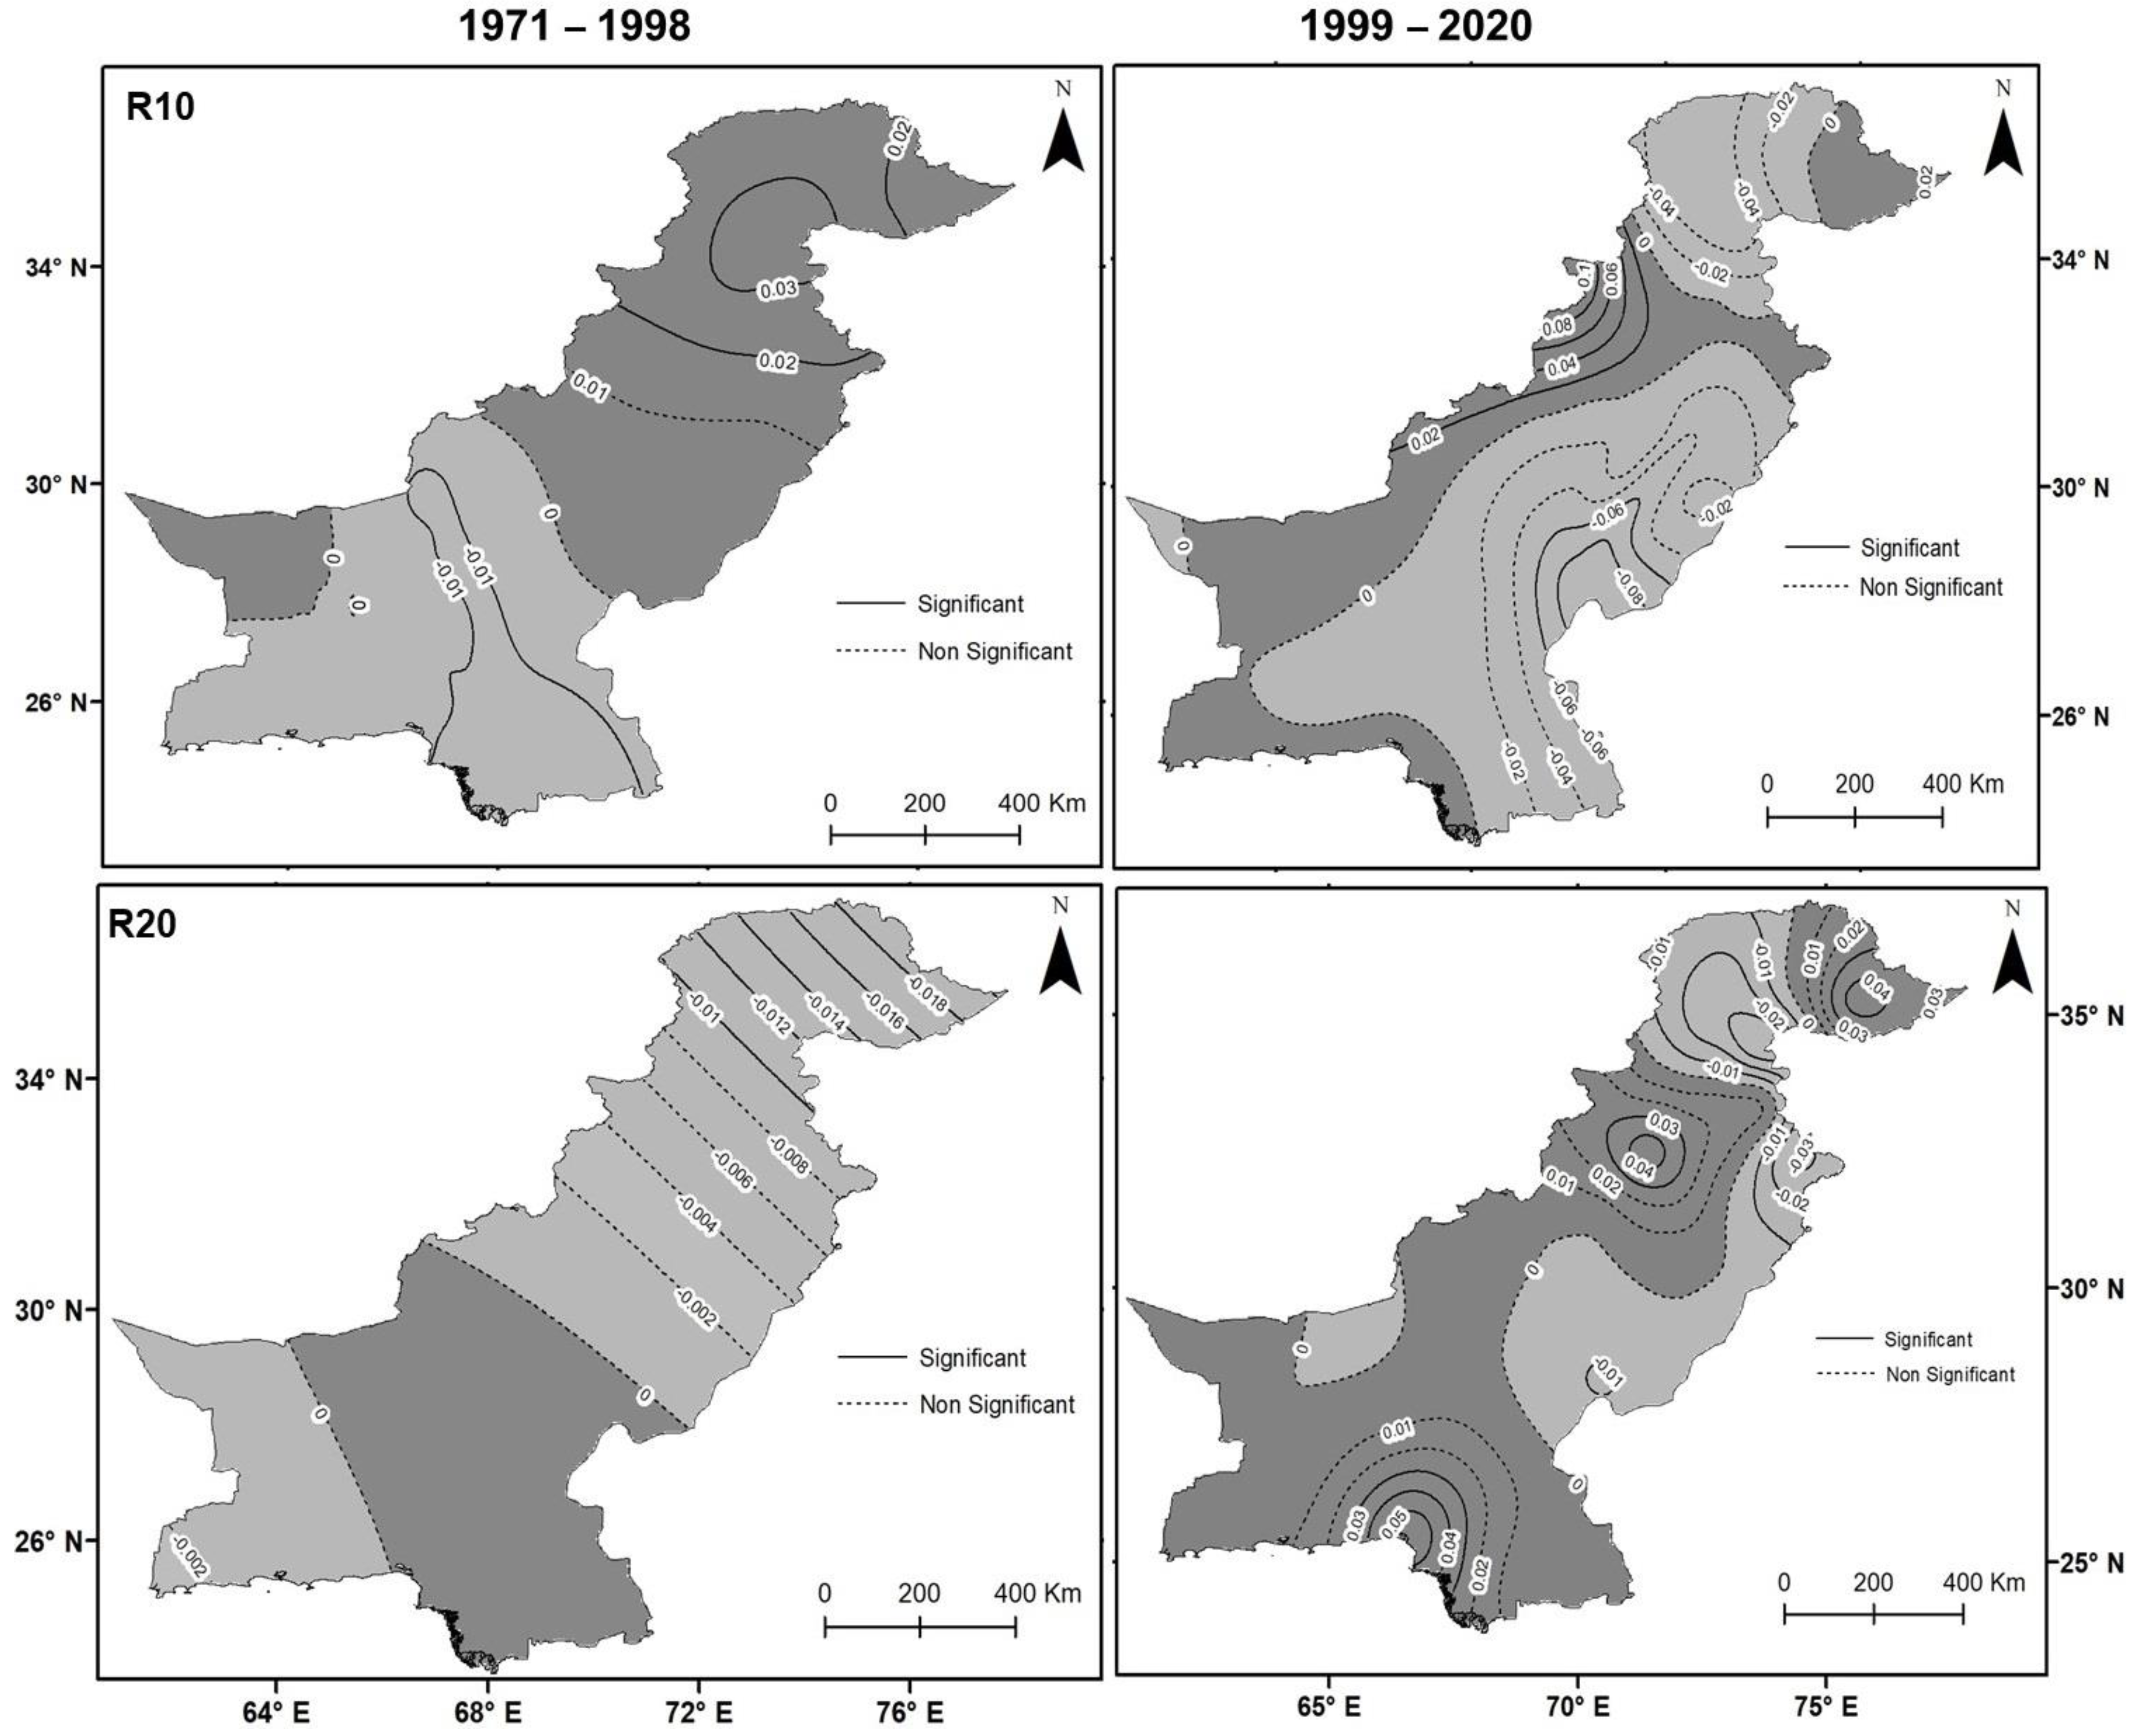
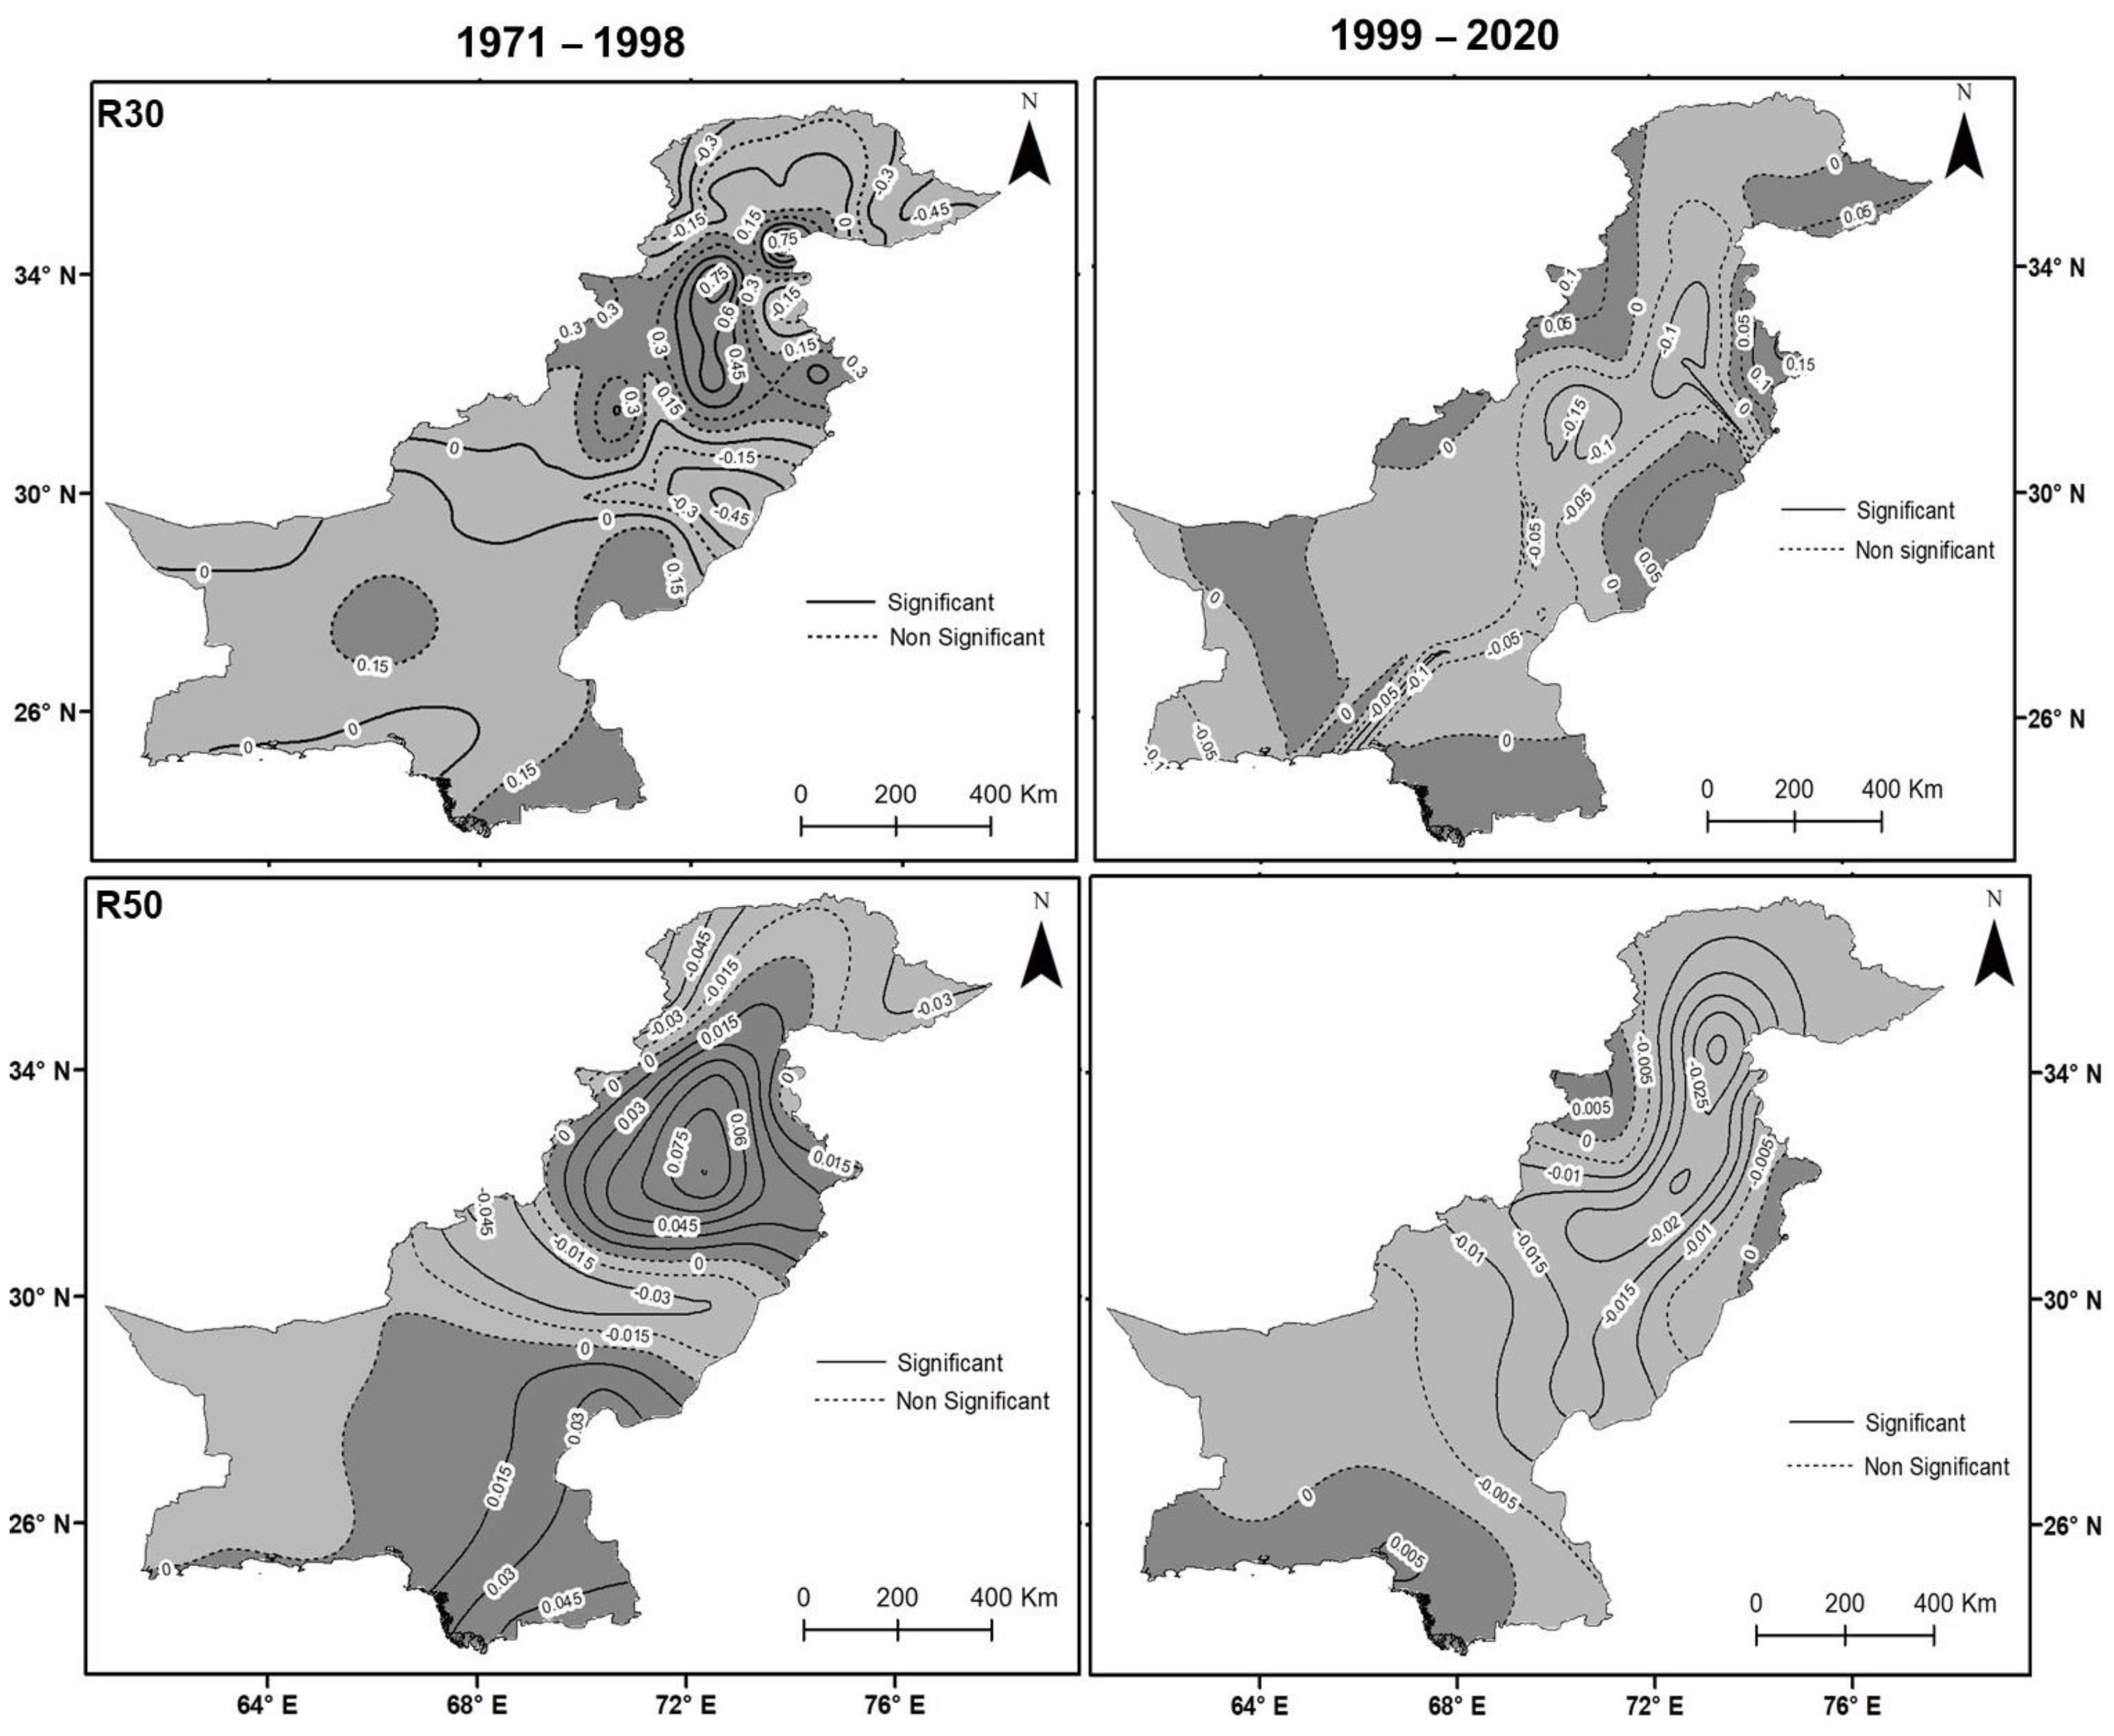
3.1. Seasonal Variability in Dry and Wet Days of Extreme Precipitation

Regarding seasonal variation of precipitation on wet and dry days, two indices were used in this study, i.e., R < 1 mm and R > 1 mm designated as dry and wet days, respectively. Figure 3 indicates the trends of dry days during 1st and 2nd data periods in spring and summer. Spring exhibited significantly dominant decreasing trends throughout the country in the 1st data period; however, wet days significantly increased in central eastern and western regions. During summer, decreasing significant trends were detected in east–west regions and increasing trends are observed from southwest regions in the 1st data period. However, in the 2nd data period, significant increasing trends were observed in the east–west, central, and southeast regions and decreasing trends have been analyzed in the northwest and some pockets of east regions.
Figure 4 indicates the trends of wet days in the spring and summer monsoons. The wet days showed a significant decreasing trend (stronger from east to west regions than other regions) and increasing trends found in the northwest regions (Drosh, Chitral, and Gupis) in the 1st data period, whereas significantly increasing trend at significant level 0.05 observed in some pockets near eastern regions in the 2nd data period. Similarly, the increasing significant trends were identified in the east–west regions while decreasing trends were dominant in southwest regions in the 1st data period. In 2nd data period, significant decreasing trends were exhibited in the east–west regions while increasing trends appeared near the eastern regions.

3.2. Seasonal Variability in the Intensity of Extreme Precipitation

3.2.1. Spring

Figure 5 depicts the spatial distribution of the R10 and R20 extreme precipitation index in the 1st and 2nd data periods. The results proposed that heavy precipitation days with a magnitude of 10 mm decreased significantly in the northwest and southeast parts (0.1 days) in the 2nd data period. It was interesting to note a 0.3-day increase in heavy precipitation in the northwest in the 1st data period. In comparison to 1st data period, there was a −0.2-day decrease in the southern and northern regions in the 2nd data period. On very heavy precipitating days with a magnitude of 20 mm, an asymmetric significant trend has been observed, with an increase (decrease) in the northwest and northeast (southwest) regions of 0.06–0.12 mm days (−0.02 days) in the 1st data period. During the 2nd data period, some regions in the west of the country exhibited an increased trend at a rate of 0.15 days.
During the same period, decreasing significant trends in the northwest and southwest regions were examined at a rate of 0.05 days in the spring season. For precipitation days (p ≥ 30 mm), an increasing trend was observed in northwest regions with a range of 0.02–0.03 days, and the regions in the southwest showed a slight decrease with <−0.01 days during the 1st data period. The precipitation in the 2nd data period exhibited an overall decreasing trend of <0.06 mm in the eastern and southern parts of the study region. In the precipitation days with a magnitude of 50 mm (p ≥ 50 mm), the only northern regions indicated decreasing significant trends with a range of −0.016–0.01 days from 1961 to 1990. In comparison, between 1991 and 2020, there was a −0.2-day decrease in the northwest and northeast regions as shown in Figure 6. An asymmetrical significant trend has been observed in the southeast, western, and northern regions with a range of 0.02–0.04 mm days.

3.2.2. Summer

For precipitation days (p ≥ 10 mm), an increasingly significant trend was measured with a magnitude of 10 mm; it decreased significantly in the eastward to central regions with a range of 0.30–0.75 days in the 1st data period as shown in Figure 7. An asymmetrical significant trend has been observed with an increase (decrease) in the eastward and westward (northwest and central) regions with a range of 0.30–0.75 days (−0.10 to 0.75 days) in the 2nd data period. It was interesting to notice a 0.40-day decrease in precipitation of magnitude R10 in the northeast and central regions in the 2nd data period. Comparatively, the moisture stress from southwest regions is found to increase in the last 30 years as compared to the 1st data period in the summer monsoon season. On very heavy precipitating days with a magnitude of 20 mm, an asymmetrical significant trend has been observed, with a decrease (increase) in the eastward and southeast (northwest) regions with a range from −0.02 to −0.03 days (0.2–0.4 days) in the first data period.
During the second data period, some regions in the country’s east to the west, southeast, and west regions showed an increasing trend at a rate of 0.20 days. During the same period, decreasing significant trends in the central regions were examined at a rate of 0.15 days in the summer monsoon season from 1991 to 2020. For precipitation days (p ≥ 30 mm), an increasing trend was observed in the east–west, central, and some pockets of northern regions with a range of 0.03–0.09 days; the regions in the southwest showed a slight decline with 0.01 days during the 1st data period as shown in Figure 8. However, R30 exhibited an overall increasing trend, but a significant trend was only noticed in the northeast of the Sialkot regions with a rate of 0.15 days in the 2nd data period. In the precipitation days with a magnitude of 50 mm (p ≥ 50 mm), the east–west and southeast regions indicated increasing significant trends with a range of 0.015–0.030 days from 1971 to 1998. In the 2nd data period, −0.025 days have been decreased compared to the 1st data period in the east–west regions. Overall, the decreasing significant trend was analyzed in all regions except some regions in the western part during the 2nd data period.

4. Discussion

The findings showed that seasonal precipitation is categorized into two major modes, monsoon system in pre-monsoon and summer monsoon and western disturbances in winter precipitation. The significant increasing trend was analyzed on wet days from east to west regions and increasing trends in northwest and northeast regions in 1961–1990, whereas the decreasing trend with a significant level of 0.05 has been observed in the northeast, southwest, and southeast regions in all seasons except post-monsoon during 1991–2020. Precipitation consistently increased from the west to the east along the longitudes and from the south to the north, following latitudinal range. Heavy precipitation days with a magnitude of 10 mm decreased between 1991 and 2020 in all seasons but were found to have increased in the winter, pre-monsoon and summer seasons in the northwest, central parts of north, southeast and southwest regions. In very heavy precipitating days with a magnitude of 20 mm, an asymmetrical significant trend has been observed, with a decrease (increase) in the eastward and southeast (northwest) regions in 1961–1990 during the summer monsoon and winter seasons. However, from 1991 to 2020, the very heavy precipitating days indicated increasing trends in the southeast, east, and west regions in all seasons except post-monsoon seasons. This is likely due to an increase in air temperature, which improves the air’s ability to hold water capacity, leading to increased water vapor over the atmosphere [38]. The results revealed a slight decrease in the number of days with severe precipitation over the western, northeast and northwest regions of Pakistan during 1991–2020.
Large-scale global warming and rising sea surface temperatures have an impact on the causes of an increasing trend in these indices, in addition to the rising temperatures in Pakistan. The geographical locations of Pakistan also exhibited extreme precipitation occurrences including significantly decreasing seasonal precipitation in UIB [39,40]. The remaining precipitation indices showed a significant increase in the Indus basin and a decrease in the monsoon central and core western disturbance zones except for the 99th percentile during the summer and winter seasons in 1999–2020. This detailed analysis might be attributed to two different facets of the region that include the aridity and moisture source for both major precipitation systems over Pakistan. The region’s aridity classes are primarily arid to semi-arid and severely arid [41]. When precipitation occurs, there is primarily increased infiltration and less runoff. Less runoff limits evapotranspiration and evaporation, which in turn limits the quantity of moisture recycled by convective processes. As a result, less water is recycled through convective processes [42]. The change in extreme precipitation trends has been caused by a possible change in the monsoon and westerly disturbance circulation trajectories. The Mediterranean region serves as the moisture source during the winter, while the Indian Ocean serves as the moisture source during the summer. A change in the large-scale circulation patterns can move the precipitation into severe precipitation [43,44].
According to the shifts in severe precipitation index patterns, the core monsoon (humid) and western (arid) regions saw a rise in extreme events in the early 1990s, which was then followed by a drought event in the following year, and vice versa. The rise in extreme precipitation indicators showed that precipitation had generally increased in recent years. The intensity of extreme precipitation occurrences is impacted by this rise in precipitation. Thus, the patterns of extreme weather events, particularly flash and riverine floods in the target regions with high vulnerability to natural hazards, may shift as a result of the observed changes in extreme precipitation events [5,17]. Drought definition can be greatly influenced by the arid/semi-arid region of southern Pakistan, where exceptional precipitation events are declining. Moreover, the increase in temperature over the high altitude of UIB [45] due to global warming and melting of snow and glaciers at the sub-basin scale [46] is also a certain conclusion which may have a considerable impact on drought, precipitation and water availability; therefore, precipitation is not the only component in weather estimation or prediction. Except for the 95th percentile, the elevation-dependent rise was less pronounced. Large-scale circulation indicators such as the South Asian high, Himalayan forcing, and oceanic forcing could contribute to the shift in addition to the normal precipitation systems [47]. Some of the recent studies [48] established a strong linkage between precipitation and droughts for the same study region (the whole of Pakistan). They concluded that the precipitation exhibits a decreasing trend in terms of the extreme events which is consistent with our findings of reduced R50 and R30 days.
The extreme precipitation indices reveal an upward trend in extreme precipitation occurrences over Pakistan during the past 30 years, suggesting that the danger may also rise as a result. Large-scale indices, the land-ocean temperature gradient, and global warming-induced changes in circulation can all be used to explain the rising trends in these extreme precipitation indices. The study’s conclusions are based on a quantification of changes in extreme precipitation indices in the 1st and 2nd time-series, and they do not consider the direct influence of large-scale circulation, oceanic, and related causes. These elements will be discussed in further detail in subsequent research. These factors are addressed in the current study and may need to be considered when analyzing localized trends. Future research ought to concentrate on the risk, exposure index, and associated remedies of such extreme precipitation indices in the region.

5. Conclusions

The current study investigates the variability in the extreme precipitation indices in Pakistan during the 1st and the 2nd data series. The study revealed an increasing trend of wet days (R1mm), the number of heavy precipitation days (R10 mm), and the number of very heavy precipitation (R20 mm) during the spring and summer monsoon. On very heavy precipitating days with a magnitude of 20 mm, an asymmetrical significant trend has been observed, with a decrease (increase) in the eastward and southeast (northwest) regions in 1971–1998 in all seasons except spring and summer, while during the period of 1999–2020, some regions in the country’s east to the west, southeast, and west regions showed an increasing trend in the summer and spring seasons. During the same period, declining significant trends in the central regions were examined at a rate of 0.15 days in the summer monsoon season from 1999 to 2020. For precipitation days (p ≥ 30 mm), an increasing trend was analyzed in the east–west, central, and some pockets of northern regions during the spring and summer monsoon seasons in 1999–2020 but the regions in the southwest showed a slight decrease during the first data period. The precipitation with a magnitude of 30 mm in the period of 1999–2020 exhibited an overall increasing trend, but significance was noticed in the northeast over the Sialkot regions during the spring and summer seasons. On the precipitation days with a magnitude of 50 mm (p ≥ 50 mm), the east–west and southeast regions indicated increasing significant trends from 1971 to 1998. There were fewer days in the east–west regions during the spring and summer seasons in 1971–1998 as compared to 1999–2020.

Author Contributions

Conceptualization, S.A., M.Y. and Y.L.; methodology, S.A., M.Y., Y.L., T.H.K., M.W. and S.A.; software, M.Y. and Y.L; validation, M.K.L. and M.W.; formal analysis, M.Y., Y.L., S.M., T.H.K. and S.A.; investigation, M.Y., Y.L., M.W., M.K.L. and S.A.; writing—original draft, S.M.; writing—review and editing, M.Y., Y.L. and S.M.; visualization, M.K.L., Y.L., S.M. and S.A.; supervision, M.Y. and Y.L.; funding acquisition, M.K.L. and M.W. All authors have read and agreed to the published version of the manuscript.

Funding

This research received no external funding.

Institutional Review Board Statement

Not applicable.

Informed Consent Statement

Not applicable.

Data Availability Statement

All data used in the present study was provided by the Pakistan Meteorological Department.

Acknowledgments

Y.L. was supported by the Czech Academy of Sciences, Praemium Academiae awarded to M. Palus. S.M. was supported by ICIMOD which gratefully acknowledges the support of its core donors: the Governments of Afghanistan, Australia, Austria, Bangladesh, Bhutan, China, India, Myanmar, Nepal, Norway, Pakistan, Sweden, and Switzerland. The views and interpretations in this publication are those of the authors and they are not necessarily attributable to their organizations. The authors would further like to extend gratitude to the Pakistan Meteorological Department (PMD) for sharing invaluable station data. We express sincere gratitude to the University of Rostock, Rostock, Germany for funding APC from the funding program open access publishing.

Conflicts of Interest

The authors declare no conflict of interest.

References

  1. Eckstein, D.; Künzel, V.; Schäfer, L.; Winges, M. Global Climate Risk Index 2020. In Who Suffers Most from Extreme Weather Events? Weather-Related Loss Events in 2018 and 1999 to 2018; Germanwatch: Bonn, Germany, 2020. [Google Scholar]
  2. IPCC. Climate Change 2013: The Physical Science Basis; Cambridge University Press: Cambridge, UK, 2013. [Google Scholar]
  3. Kharin, V.V.; Zwiers, F.W.; Zhang, X.; Wehner, M. Changes in temperature and precipitation extremes in the CMIP5 ensemble. Clim. Change 2013, 119, 345–357. [Google Scholar] [CrossRef]
  4. Scoccimarro, E.; Gualdi, S.; Bellucci, A.; Zampieri, M.; Navarra, A. Heavy precipitation events in a warmer climate: Results from CMIP5 models. J. Clim. 2013, 26, 7902–7911. [Google Scholar] [CrossRef]
  5. You, Q.-L.; Ren, G.-Y.; Zhang, Y.-Q.; Ren, Y.-Y.; Sun, X.-B.; Zhan, Y.-J.; Shrestha, A.B.; Krishnan, R. An overview of studies of observed climate change in the Hindu Kush Himalayan (HKH) region. Adv. Clim. Change Res. 2017, 8, 141–147. [Google Scholar] [CrossRef]
  6. Tian, Y.; Yan, Z.; Li, Z. Spatial and Temporal Variations of Extreme Precipitation in Central Asia during 1982–2020. Atmosphere 2021, 13, 60. [Google Scholar] [CrossRef]
  7. Zhang, M.; Yu, H.; King, A.D.; Wei, Y.; Huang, J.; Ren, Y. Greater probability of extreme precipitation under 1.5 °C and 2 °C warming limits over East-Central Asia. Clim. Change 2020, 162, 603–619. [Google Scholar] [CrossRef]
  8. Talchabhadel, R.; Karki, R.; Thapa, B.R.; Maharjan, M.; Parajuli, B. Spatio-temporal variability of extreme precipitation in Nepal. Int. J. Climatol. 2018, 38, 4296–4313. [Google Scholar] [CrossRef]
  9. Elalem, S.; Pal, I. Mapping the vulnerability hotspots over Hindu-Kush Himalaya region to flooding disasters. Weather Clim. Extrem. 2015, 8, 46–58. [Google Scholar] [CrossRef] [Green Version]
  10. Hunt, K.M.; Turner, A.G.; Shaffrey, L.C. Extreme daily rainfall in Pakistan and north India: Scale interactions, mechanisms, and precursors. Mon. Weather Rev. 2018, 146, 1005–1022. [Google Scholar] [CrossRef] [Green Version]
  11. Suthinkumar, P.S.; Babu, C.A.; Varikoden, H. Spatial distribution of extreme rainfall events during 2017 southwest monsoon over Indian subcontinent. Pure Appl. Geophys. 2019, 176, 5431–5443. [Google Scholar] [CrossRef]
  12. Van der Schrier, G.; Rasmijn, L.M.; Barkmeijer, J.; Sterl, A.; Hazeleger, W. The 2010 Pakistan floods in a future climate. Clim. Change 2018, 148, 205–218. [Google Scholar] [CrossRef]
  13. Siddiqui, Z.A.; Rashid, A. Thunderstorm Frequency over Pakistan (1961-1990). Pak. J. Meteorol. 2008, 5, 39–63. [Google Scholar]
  14. Naheed, G.; Kazmi, D.H.; Rasul, G. Seasonal variation of rainy days in Pakistan. Pak. J. Meteorol. 2013, 9, 9–13. [Google Scholar]
  15. Ikram, F.; Afzaal, M.; Bukhari, S.A.A.; Ahmed, B. Past and future trends in the frequency of heavy rainfall events over Pakistan. Pak. J. Meteorol. 2016, 12, 57–78. [Google Scholar]
  16. Nabeel, A.; Athar, H. Observed, stochastically simulated, and projected precipitation variability in Pakistan. Theor. Appl. Climatol. 2018, 137, 2239–2256. [Google Scholar] [CrossRef]
  17. Rahman, A.; Dawood, M. Spatio-statistical analysis of temperature fluctuation using Mann–Kendall and Sen’s slope approach. Clim. Dyn. 2017, 48, 783–797. [Google Scholar] [CrossRef]
  18. Sajjad, H.; Ghaffar, A. Observed, simulated and projected extreme climate indices over Pakistan in changing climate. Theor. Appl. Climatol. 2019, 137, 255–281. [Google Scholar] [CrossRef]
  19. Aslam, R.A.; Shrestha, S.; Pal, I.; Ninsawat, S.; Shanmugam, M.S.; Anwar, S. Projections of climatic extremes in a data poor transboundary river basin of India and Pakistan. Int. J. Climatol. 2020, 40, 4992–5010. [Google Scholar] [CrossRef]
  20. Abbas, F.; Ahmad, A.; Safeeq, M.; Ali, S.; Saleem, F.; Hammad, H.M.; Farhad, W. Changes in precipitation extremes over arid to semiarid and subhumid Punjab, Pakistan. Theor. Appl. Climatol. 2014, 116, 671–680. [Google Scholar] [CrossRef]
  21. Imran, A.; Zaman, Q.; Afzal, M. Temporal trends in the peak monsoonal precipitation events over Northeast Pakistan. Pak. J. Meteorol. 2013, 10. [Google Scholar]
  22. Iqbal, M.F.H. Athar Validation of satellite-based precipitation over diverse topography of Pakistan. Atmos. Res. 2018, 201, 247–260. [Google Scholar] [CrossRef]
  23. Khan, S.; Hassan, M.; Khan, A. Environment, Agriculture, and Land Use Pattern. In Climate Change and Agriculture; Hussain, S., Ed.; IntechOpen: London, UK, 2019. [Google Scholar] [CrossRef] [Green Version]
  24. Abbas, F.; Rehman, I.; Adrees, M.; Ibrahim, M.; Saleem, F.; Ali, S.; Rizwan, M.; Salik, M.R. Prevailing trends of climatic extremes across Indus-Delta of Sindh-Pakistan. Theor. Appl. Climatol. 2018, 131, 1101–1117. [Google Scholar] [CrossRef]
  25. Ali, S.; Eum, H.-I.; Cho, J.; Dan, L.; Khan, F.; Dairaku, K.; Shrestha, M.L.; Hwang, S.; Nasim, W.; Khan, I.A.; et al. Assessment of climate extremes in future projections downscaled by multiple statistical downscaling methods over Pakistan. Atmos. Res. 2019, 222, 114–133. [Google Scholar] [CrossRef]
  26. Ullah, W.; Wang, G.; Ali, G.; Tawia Hagan, D.F.; Bhatti, A.S.; Lou, D. Comparing multiple precipitation products against in-situ observations over different climate regions of Pakistan. Remote Sens. 2019, 11, 628. [Google Scholar] [CrossRef]
  27. Haan, C.T. Statistical Methods in Hydrology; The Iowa State University Press: Ames, IA, USA, 1977. [Google Scholar]
  28. Mann, H.B. Nonparametric tests against trend. Econom. J. Econom. Soc. 1945, 13, 245–259. [Google Scholar] [CrossRef]
  29. Kendall, M.G. Rank Correlation Methods, 2nd ed.; Hafner Publishing Co.: Oxford, UK, 1955. [Google Scholar]
  30. Caloiero, T.; Roberto Coscarelli, R.; Ennio Ferraric, E.; Mancinia, M. Trend detection of annual and seasonal rainfall in Calabria (Southern Italy). Int. J. Climatol. 2011, 31, 44–56. [Google Scholar] [CrossRef]
  31. Kumar, S.; Merwade, V.; Kam, J.; Thurner, K. Stream flow trends in Indiana: Effects of long-term persistence, precipitation and subsurface drains. J. Hydrol. 2009, 374, 171–183. [Google Scholar] [CrossRef]
  32. Ahmad, I.; Tang, D.; Wang, T.; Wang, M.; Wagan, B. Precipitation Trends over Time Using Mann-Kendall and Spearman’s rho Tests in Swat River Basin, Pakistan. Adv. Meteorol. 2015, 43, 431860. [Google Scholar] [CrossRef] [Green Version]
  33. Latif, Y.; Ma, Y.; Ma, W. Climatic trends variability and concerning flow regime of Upper Indus Basin, Jehlum, and Kabul river basins Pakistan. Theor. Appl. Climatol. 2021, 144, 447–468. [Google Scholar] [CrossRef]
  34. Sun, J.; Zhang, F. Daily extreme precipitation and trends over China. Sci. China Earth Sci. 2017, 60, 2190–2203. [Google Scholar] [CrossRef]
  35. Sen, P.K. Estimates of the regression coefficient based on Kendall’s tau. J. Am. Stat. Assoc. 1968, 63, 1379–1389. [Google Scholar] [CrossRef]
  36. Zhang, X.; Alexander, L.; Hegerl, G.C.; Jones, P.; Tank, A.K.; Peterson, T.C.; Trewin, B.; Zwiers, F.W. Indices for monitoring changes in extremes based on daily temperature and precipitation data. Wiley Interdiscip. Rev. Clim. Change 2011, 2, 851–870. [Google Scholar] [CrossRef]
  37. Ongoma, V.; Chen, H.; Gao, C.; Nyongesa, A.M.; Polong, F. Future changes in climate extremes over Equatorial East Africa based on CMIP5 multimodel ensemble. Nat. Hazards 2018, 90, 901–920. [Google Scholar] [CrossRef]
  38. Trenberth, K.E.; Fasullo, J.T. Climate extremes and climate change: The Russian heat wave and other climate extremes of 2010. J. Geophys. Res. Atmos. 2012, 117, D17103. [Google Scholar] [CrossRef]
  39. Ullah, S.; You, Q.; Ali, A.; Ullah, W.; Jan, M.A.; Zhang, Y.; Xie, W.; Xie, X. Observed changes in maximum and minimum temperatures over China-Pakistan economic corridor during 1980–2016. Atmos. Res. 2019, 216, 37–51. [Google Scholar] [CrossRef]
  40. Latif, Y.; Yaoming, M.; Yaseen, M. Spatial analysis of precipitation time series over the Upper Indus Basin. Theor. Appl. Climatol. 2018, 131, 761––775. [Google Scholar] [CrossRef] [Green Version]
  41. Haider, S.; Adnan, S. Classification and assessment of aridity over Pakistan provinces (1960-2009). Int. J. Environ. 2014, 3, 24–35. [Google Scholar] [CrossRef] [Green Version]
  42. Galarneau, T.J.; Hamill, T.M.; Dole, R.M.; Perlwitz, J. A multiscale analysis of the extreme weather events over western Russia and northern Pakistan during July 2010. Mon. Weather Rev. 2012, 140, 1639–1664. [Google Scholar] [CrossRef] [Green Version]
  43. Dimri, A.P.; Niyogi, D.; Barros, A.P.; Ridley, J.; Mohanty, U.C.; Yasunari, T.; Sikka, D.R. Western disturbances: A review. Rev. Geophys. 2015, 53, 225–246. [Google Scholar] [CrossRef]
  44. Chen, F.; Chen, J.; Huang, W.; Chen, S.; Huang, X.; Jin, L.; Jia, J.; Zhang, X.; An, C.; Zhang, J.; et al. Westerlies Asia and monsoonal Asia: Spatiotemporal differences in climate change and possible mechanisms on decadal to sub-orbital timescales. Earth Sci. Rev. 2019, 192, 337–354. [Google Scholar] [CrossRef]
  45. Latif, Y.; Yaoming, M.; Yaseen, M.; Muhammad, S.; Atif Wazir, M. Spatial analysis of temperature time series over the Upper Indus Basin (UIB) Pakistan. Theor. Appl. Climatol. 2020, 139, 741–758. [Google Scholar] [CrossRef] [Green Version]
  46. Latif, Y.; Ma, Y.; Ma, W.; Muhammad, S.; Adnan, M.; Yaseen, M.; Fealy, R. Differentiating Snow and Glacier Melt Contribution to Runoff in the Gilgit River Basin via Degree-Day Modelling Approach. Atmosphere 2020, 11, 1023. [Google Scholar] [CrossRef]
  47. Latif, M.; Hannachi, A.; Syed, F.S. Analysis of rainfall trends over Indo-Pakistan summer monsoon and related dynamics based on CMIP5 climate model simulations. Int. J. Climatol. 2018, 38, e577–e595. [Google Scholar] [CrossRef]
  48. Dilawar, A.; Chen, B.; Arshad, A.; Guo, L.; Ehsan, M.I.; Hussain, Y.; Kayiranga, A.; Measho, S.; Zhang, H.; Wang, F.; et al. Towards Understanding Variability in Droughts in Response to Extreme Climate Conditions over the Different Agro-Ecological Zones of Pakistan. Sustainability 2021, 13, 6910. [Google Scholar] [CrossRef]
Figure 1. Network of climatic stations installed by Pakistan Meteorological Department (PMD).
Atmosphere 14 00210 g001
Figure 2. Climatology of seasonal precipitation in different regions of Pakistan.
Atmosphere 14 00210 g002
Figure 3. Spatial variation of dry days (numbers)in spring and summer seasons between 1971 and 1998 as well as 1999 and 2020. Dark color indicates the positive changes and light color shows the negative changes at 0.05 level of significance.
Atmosphere 14 00210 g003
Figure 4. Spatial variation of wet days (numbers) in spring and summer season between 1971 and 1998 as well as 1999 and 2020. Dark color indicates the positive changes and light color shows the negative changes at 0.05 level of significance.
Atmosphere 14 00210 g004
Figure 5. Spatial trends for extreme precipitation indices R10 and R20 (days) between 1971 and 1998 as well as 1999 and 2020. Dark color indicates the positive changes and light color shows the negative changes at 0.05 level of significance.
Atmosphere 14 00210 g005
Figure 6. Spatial trends for extreme precipitation indices R30 and R50 (days)between 1971 and 1998 as well as 1999 and 2020. Dark color indicates the positive changes and light color shows the negative changes at 0.05 level of significance.
Atmosphere 14 00210 g006
Figure 7. Spatial trends for extreme precipitation indices R10 and R20 (days) between 1971 and 1998 as well as 1999 and 2020. Dark color indicates the positive changes and light color shows the negative changes at 0.05 level of significance.
Atmosphere 14 00210 g007
Figure 8. Spatial trends for extreme precipitation indices R30 and R50 (days) during 1st and 2nd data period. Dark color indicates the positive changes and light color shows the negative changes at 0.05 level of significance.
Atmosphere 14 00210 g008
Disclaimer/Publisher’s Note: The statements, opinions and data contained in all publications are solely those of the individual author(s) and contributor(s) and not of MDPI and/or the editor(s). MDPI and/or the editor(s) disclaim responsibility for any injury to people or property resulting from any ideas, methods, instructions or products referred to in the content.

