1. Introduction
Potential atmospheric pollutants such as particulate matter (PM) having sizes less than 2.5
m or 10
m, ozone (
O3), nitric oxide (
NO2), and volatile organic compounds (VOC) emitted from industries and vehicles are considered hazardous to human health. Air pollution may increase the risks for various health issues, including mental health disorders [
1], heart disease, stroke, obstructive pulmonary disease, pneumonia, cancer, etc, even when pollutant concentrations are below the permitted levels [
2].
The coronavirus (COVID-19) was first detected in Wuhan, China in December 2019 [
3] and it was shortly spread to more than 210 countries [
4]. The World Health Organization declared the COVID-19 pandemic on 11 March 2020 [
5]. Many countries, including North Macedonia, have implemented a variety of measures to limit the spread of COVID-19, including strict and partial lock-downs, curfews, regulations on social distancing, commuting and public transport restrictions as well as recommendations to work online whenever possible. In general, the restrictions contributed to the reduction of the transportation of people and goods and optimized the production of goods, which led to disruption of the established supply chains.All of these measures had an impact on air quality improvement by reducing the emissions from human activities [
6].
While there are no exact proofs that show that air pollution directly affects an individual’s likelihood of dying from COVID-19, there is a large amount of research examining the relationships between PM2.5 and other COVID-19 outcomes such as hospitalization. Increased PM exposure can influence severe acute respiratory syndrome coronavirus (SARS-CoV) fatality [
7]. An analysis made in 71 Italian provinces showed that long-term exposure to air pollutants (PM10, PM2.5,
NO2, and
O3) was strongly correlated with COVID-19 cases [
8]. Similarly, the authors’ Wu et al. [
9] showed that long-term average exposure to PM2.5 concentration increased the risk of COVID-19 infection.
On the other side, the COVID-19 pandemic had a positive impact on air quality. Experimental results in [
10] show reduced pollutant
NO2, PM2.5, PM10 emissions by approximately 20% to 40% in 2020, where the period of the lockdown was analyzed. The paper [
11] suggests a statistical model based on a generalized additive model (GAM) to analyze the effect of the lockdown measures on
NO2 in Europe. The relationships between various meteorological factors and temporal metrics (season, time of the day) and air pollution mitigation were analyzed. The study presented in [
12] examines the impact of COVID-19 lockdown on air pollution mitigation in 44 regions in China. In the research presented in [
13], the
concentration in Sao Paolo, Brasil decreased by
compared with the average of the past 5 years due to the partial lockdown. The
NO2 concentrations decreased by
, while the
NO concentration was mitigated by
. The research presented in [
14] indicated a decrease in
NO2 concentrations as a result of the reduced vehicle traffic in Barcelona and Madrid, Spain during the lockdown in March 2020. In the paper by [
15], it is shown that the
NO2 concentration decreased by
in March 2020 compared to March 2019.
A systematic review in [
16] indicates the effect of COVID-19 pandemic on ambient air quality and human mobility around the world. In the analysis made during the COVID-19 lockdown, the concentrations of PM2.5,
NO2, PM10,
SO2 and
CO in the range of 2.9–76.5%, 18.0–96.0%, 6.0–75.0%, 6.8–49.0% and 6.2–64.8%, respectively, decreased.
O3 concentration increased in the range of 2.4–252.3%. Similarly, authors in [
17] show PM concentration mitigation due to lockdown, mainly due to less movement of people to keep “social distancing” to control spreading of the COVID-19 virus. The research presented in [
18] confirmed a reduction in PM10, PM2.5,
,
, and
in the range of 34–48% in roadside measurement stations and 18–50% in non-roadside measurement stations during the full lockdown in Shanghai. The average concentration of PM2.5, PM10,
NO2, and
CO in March 2020 decreased by
,
,
, and
, respectively, compared with those in March 2019, as it is presented in [
19]. In the study presented in [
20], due to COVID-19 restriction rules the average concentration of PM2.5 decreased by
in February and March 2020, compared with that in February and March of 2017–2019. Similar results are presented in the analysis in Seoul, South Korea [
21]. They analyzed the social distancing period for 30 days and concluded that the average concentrations of PM2.5.
NO2 and
CO decreased by
,
, and
, respectively, compared with the period before social distancing [
21] was imposed. The same conclusions can be confirmed from the analysis conducted in Seoul and Daegu, South Korea. The average concentrations of PM2.5 in March 2020 decreased by
and
, respectively, compared with those in March of 2017–2019 [
22].
The problem of poor air quality has been observed in the city of Skopje for a number of years [
23,
24,
25]. The reasons for the problem are related to its geospatial position and the climate conditions, which worsen in winter months. The rapid urbanization and population growth increase the energy demand in the city of Skopje, especially heat demand in the period from November until April. The geographical position of the city of Skopje, the capital city of North Macedonia, which is situated in the River Vardar valley, and the local weather conditions increase the accumulation of pollutants in the city. Additionally, the city of Skopje stretches for more than 23 km, but it is only 9 km wide. For years, Skopje has had a bad reputation for the enormous exceeding concentration of PM in the air throughout the whole year [
26]. It is interesting to observe that the concentration of PM2.5 and PM10 in Skopje is much higher during the night. In [
23] it was reported that the concentration of PM2.5 is
higher, and while the concentration of PM10 is almost
higher during the night compared to the daytime periods. The observed problems as well as the changes caused by the COVID-19 pandemic were the major drivers for conducting the study presented in this paper.
The aim of the paper is to investigate the impact of the COVID-19 pandemic on air pollution in Skopje. For this purpose, the PM concentrations in the city of Skopje, North Macedonia were investigated. The data were collected at the technical campus of the Faculty of Electrical Engineering and Information Technologies. The measurement data analyzed in this work covers the period: May 2018, May 2020, May 2021, and May 2022.
The paper is organized as follows. In
Section 2 the sensors and methods used to collect the data are presented, along with the applied statistical tools. The following two sections present the measurement results, the statistical analyses and the related discussion. The results show the concentration of PM2.5 and PM10 was significantly reduced during the pandemic years, and as all COVID-19 measures were canceled in 2022, the air quality is reported to be as before the pandemic. The results show that in 2020 there is no difference between the concentration of PM2.5 and PM10 during day-time and nighttime, which is a different trend compared to results from previous measurement campaigns when night-time pollution was higher than day-time pollution [
23]. This trend is again reported for 2022. In 2021, the air quality is significantly better than pre-pandemic, but still lower than in 2020. Continuing this trend, the results suggest that there is no significant difference in PM concentration air quality when pre-pandemic and post-pandemic years are compared.
3. Results
The descriptive statistics for the meteorological data are presented in
Table 2 and
Table 3. The first table,
Table 2, gives the descriptives for the temperature, real feel temperature, cloud cover, and visibility, while
Table 3 presents the data for precipitation, humidity, and wind speed.
The reported meteorological data indicate that May 2020 and May 2021 were colder than May 2018 and May 2022; it is also interesting to observe that while the humidity ranges are similar for May 2020 and May 2021, the humidity, cloud coverage, and precipitation are much higher for May 2020.
The descriptive statistics for the PM measurements are presented in
Table 4. The statistics are calculated for the whole day (WD), as well as for daytime (DT) and night-time (NT) separately. The reason for calculating the PM concentrations for various parts of the day was the already mentioned trends for high NT PM concentrations observed in previous studies [
23]. These results suggest that the concentration of PM2.5 is highest in 2018, and the lowest in 2020 and 2021. For PM10 the highest concentrations are recorded in 2022, then in 2018, 2021, and 2020. To confirm these observations, hypothesis tests are performed.
The obtained data for the concentration of PM2.5 and PM10 show a very strong correlation between these two parameters during the observed period (the Pearson correlation coefficient is above 0.9 for 2018, 2020, and 2021), while the Pearson correlation coefficient in 2022 is smaller (0.74), but still indicates a strong correlation.
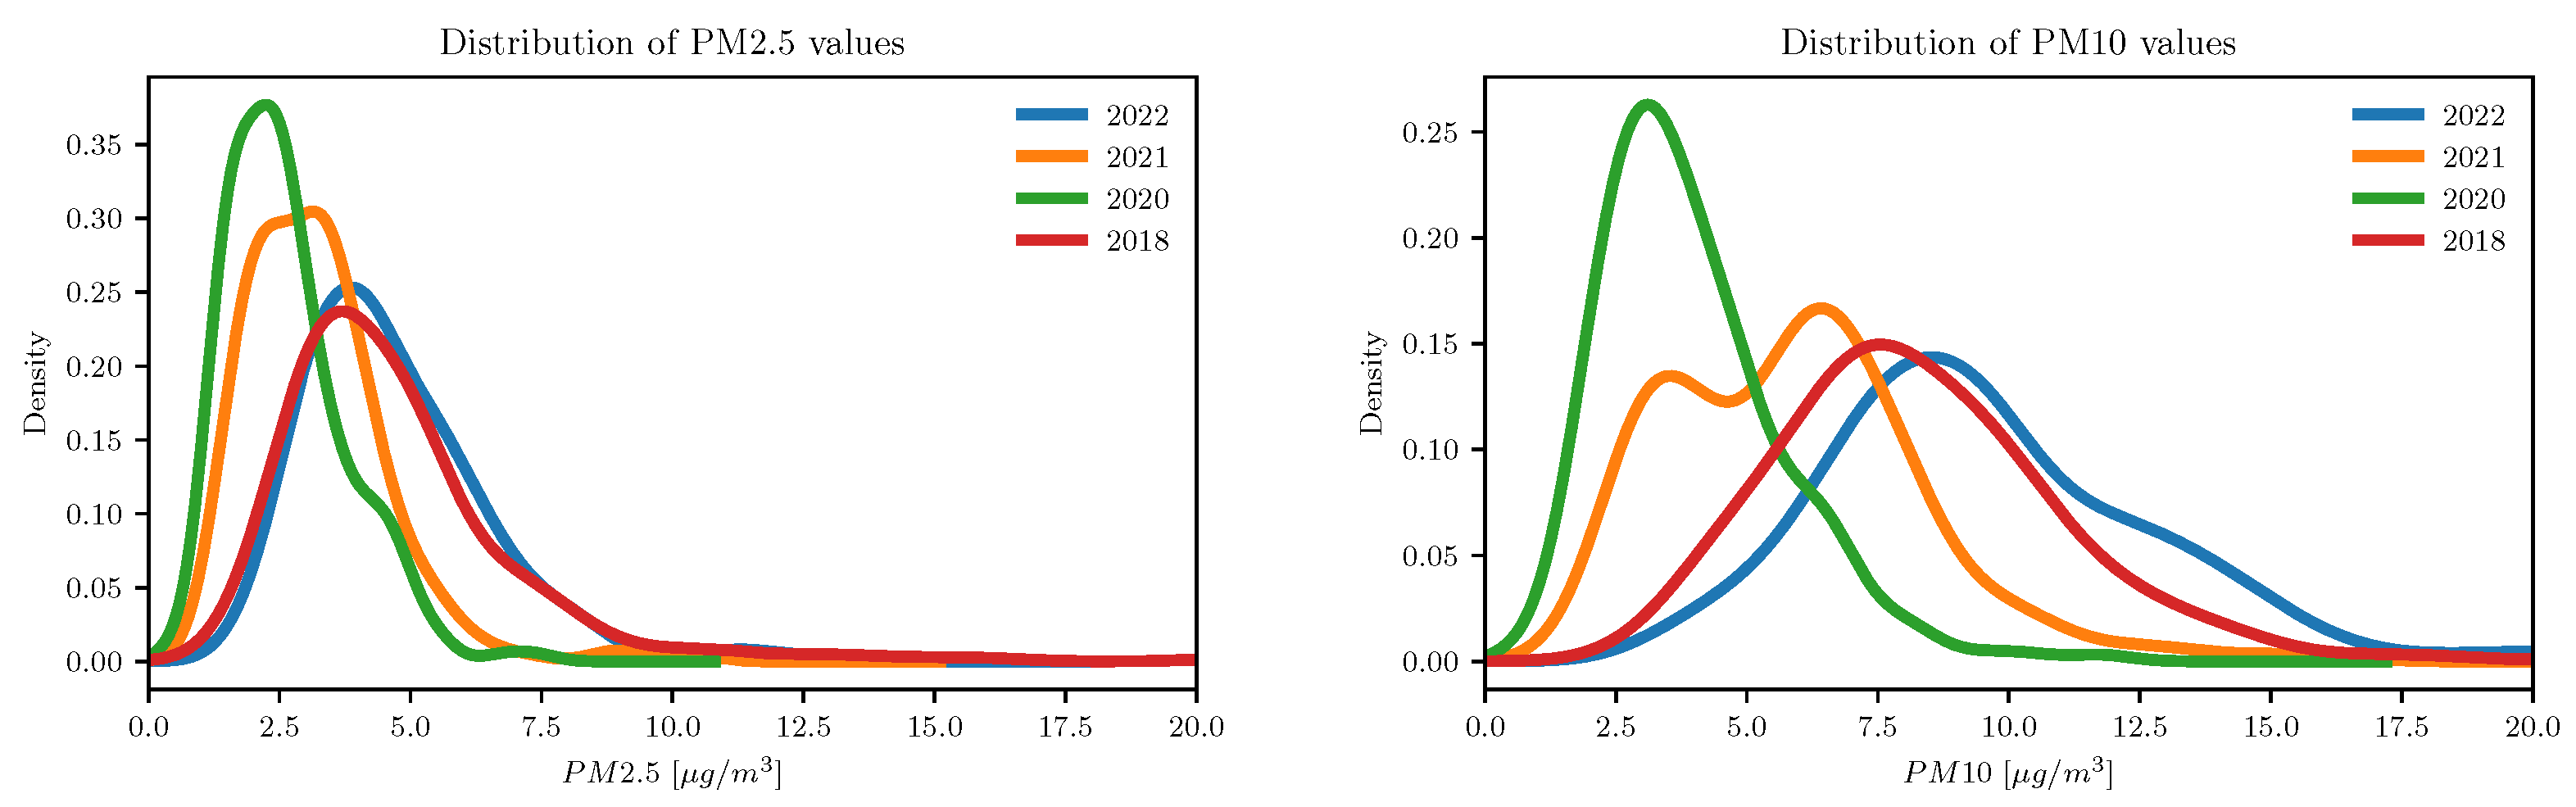
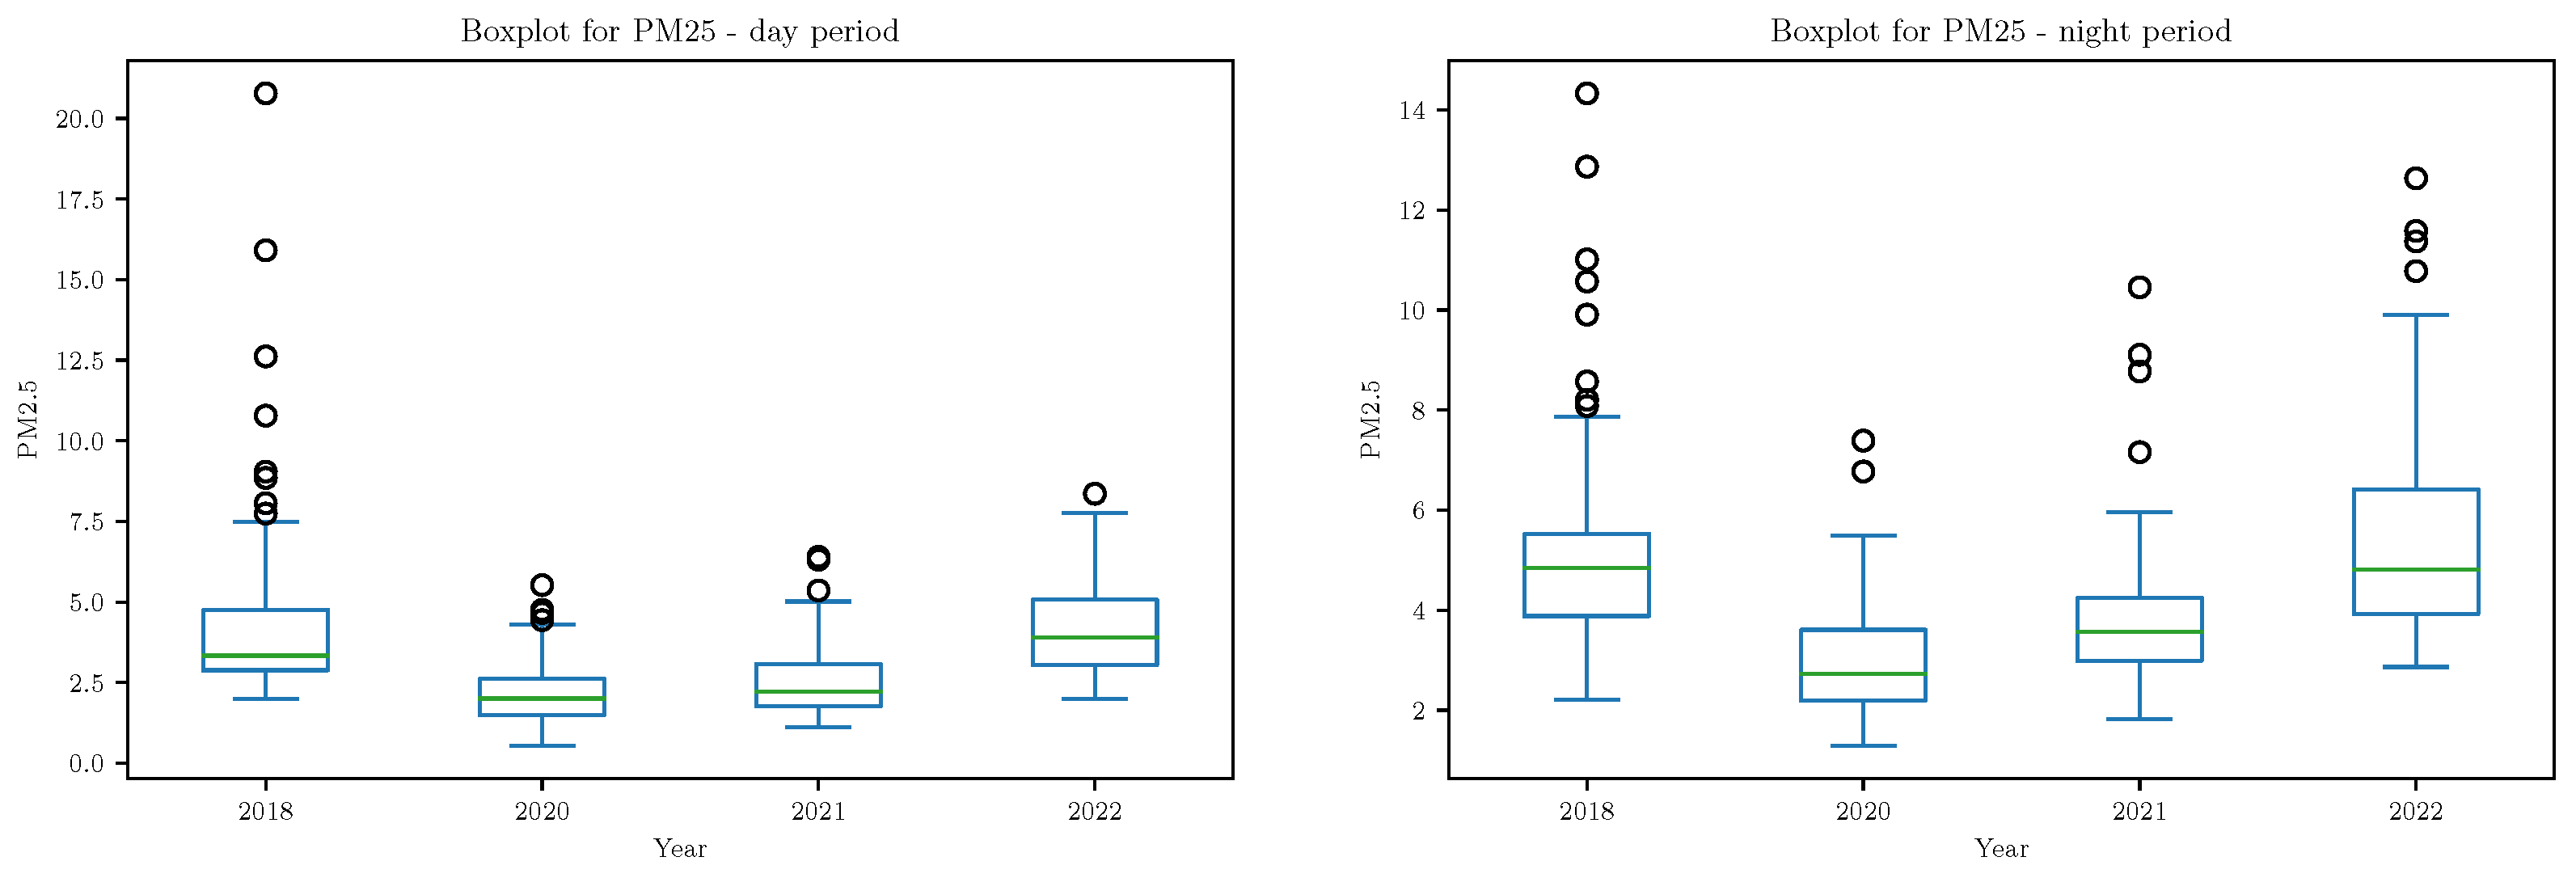
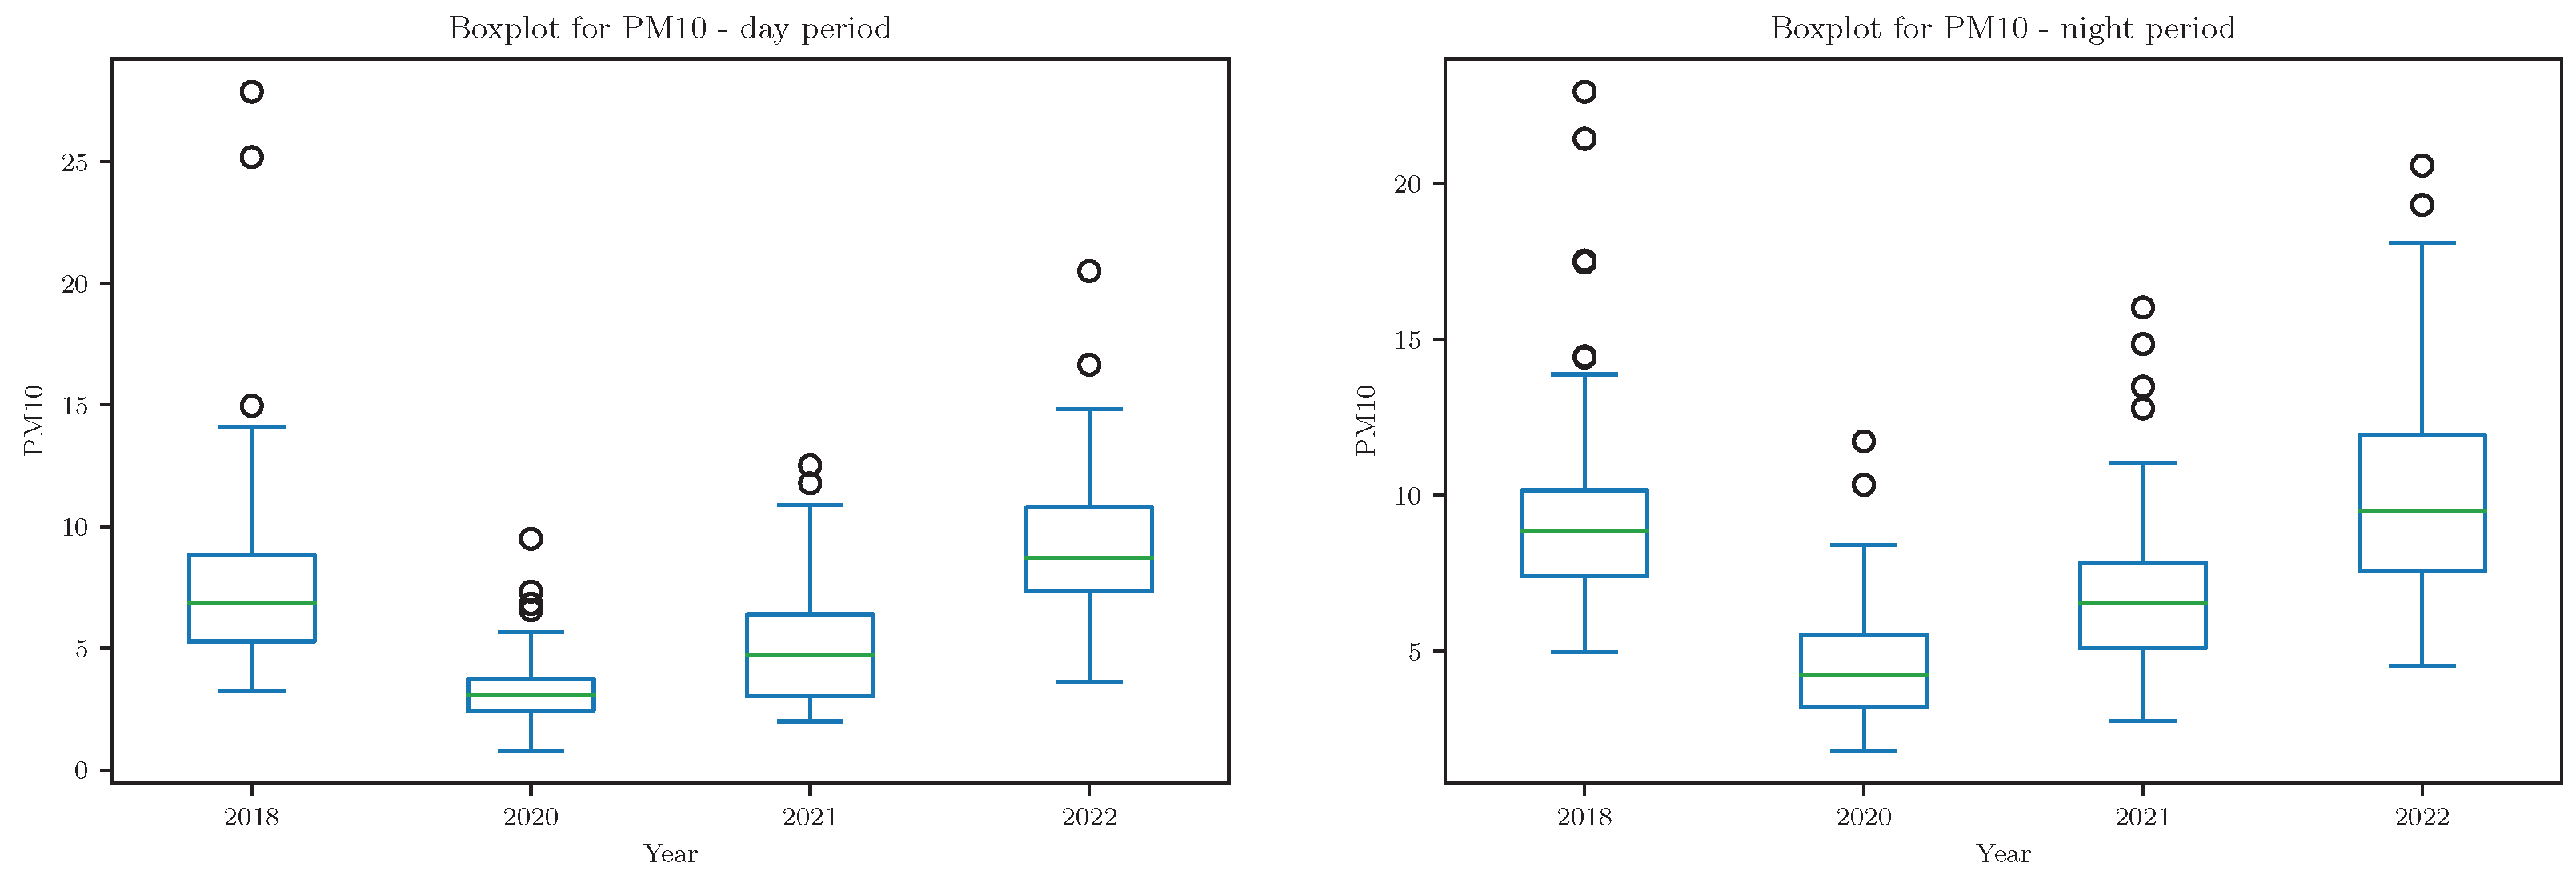
The data for PM2.5 and PM10 don’t have a normal distribution, which is confirmed by the Kolmogorov-Simirnov test and Shapiro-Wilk test for normality. The distribution of PM2.5 and PM10 is presented in
Figure 3 and with boxplots given in
Figure 4. From
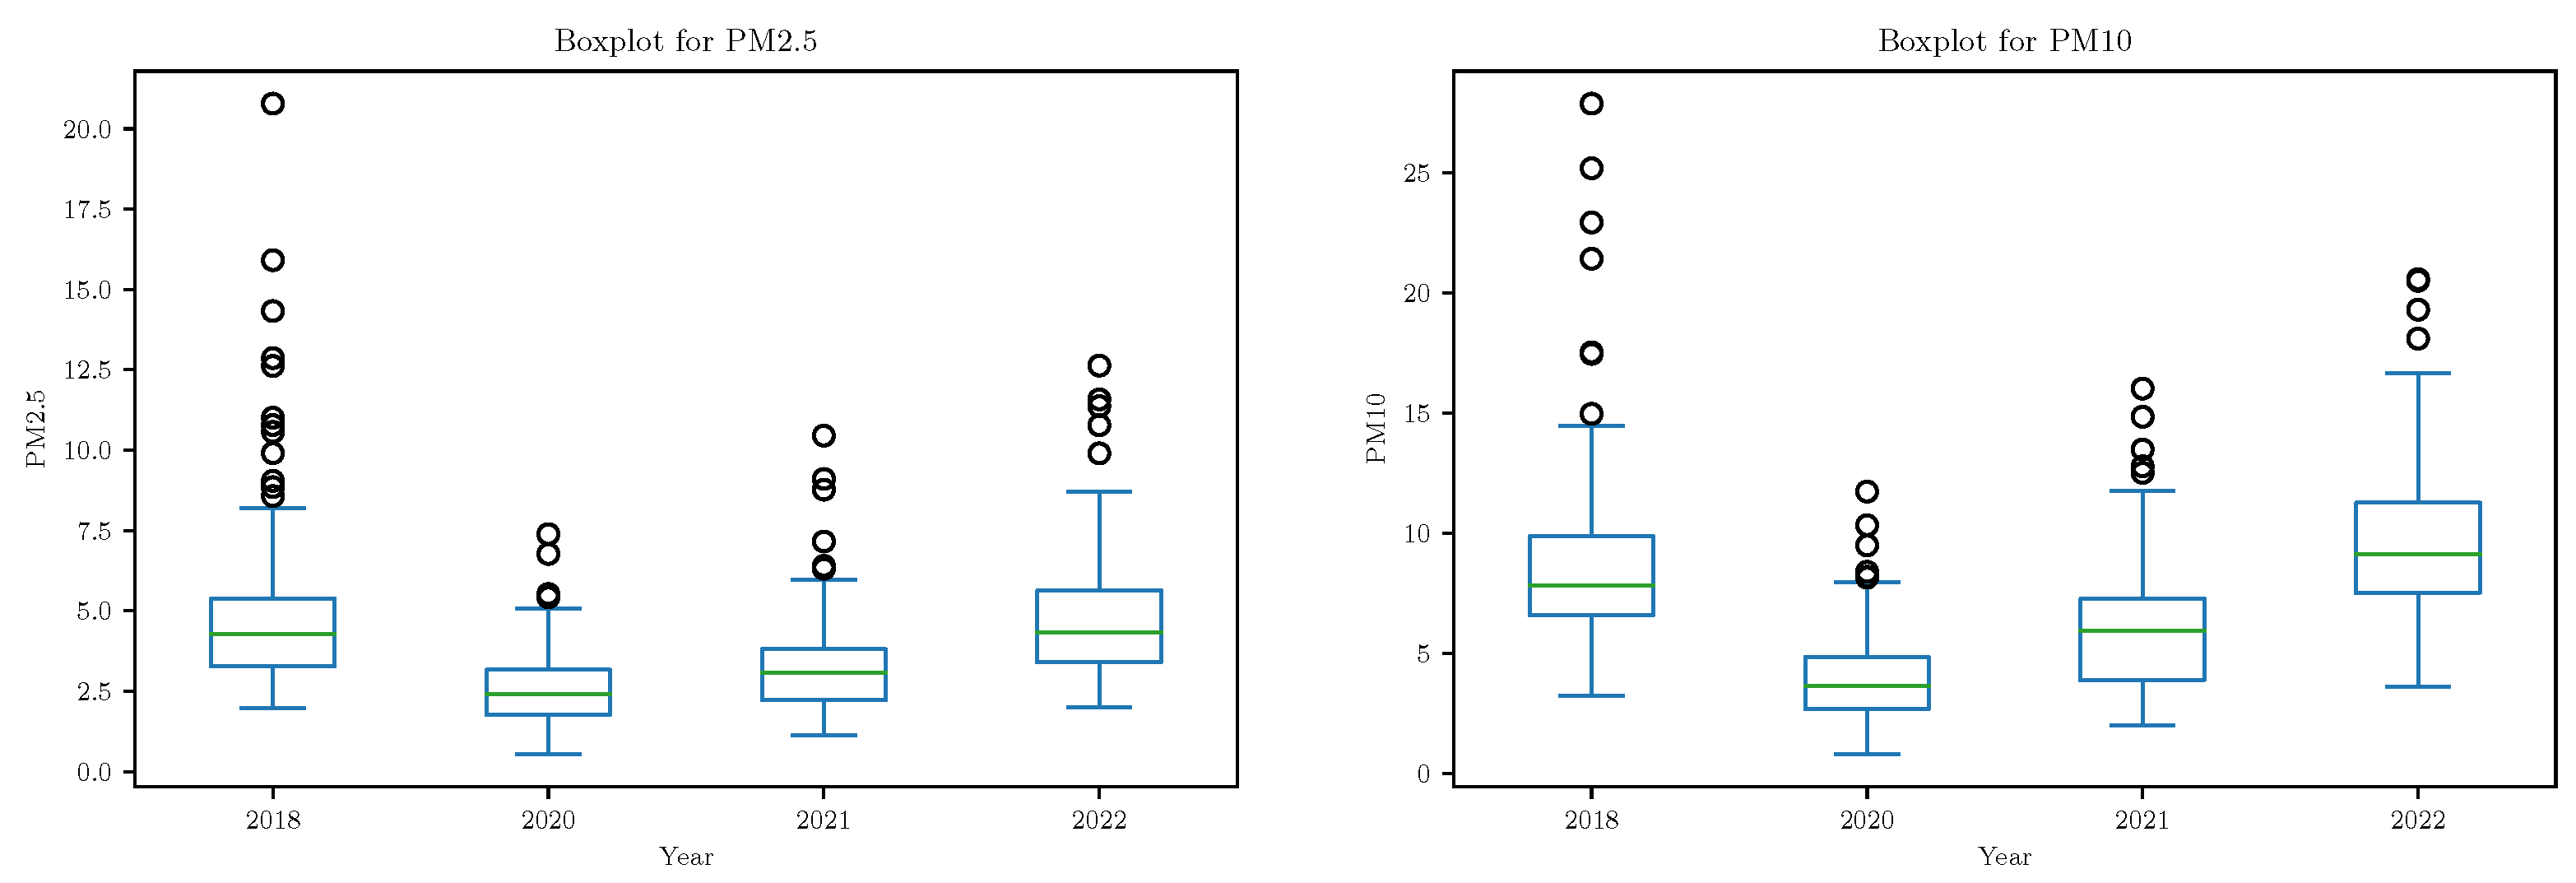
Figure 3 it is obvious that that data is positively skewed (right-skewed distribution). What strikes the eye here is that the distributions graph for the data in 2018 and 2022 are almost overlapping, while these graphs are different from the graphs of the data distribution in 2020 and 2021. Even more, the data distribution for 2020 and 2021 is skewed more to the right, compared to 2018 and 2022. This also indicates better air quality in 2020 and 2021 than in 2018 and 2022. The boxplots given in
Figure 4 support already presented results regarding the (not) normality of the data. It is also obvious the variation of the data is much bigger in 2018 than in 2020 and 2021. The difference in the recorded data in 2020 and 2021 is very small for PM2.5, which is not the case for PM10. In 2018 compared to the other three observed periods many outliers are reported, and the maximal concentration is much higher than in the other three considered periods.
As the PM concentrations are not normally distributed, the non-parametric Mann-Whitney and Kruskal-Willis tests are performed on the observed data. Both tests are designed for independent variables. For the observed period, the DT (from 8 A.M. to 8 P.M.), the NT (from 8 P.M. to 8 A.M.), and WD PM concentrations were analyzed. The resulting descriptive statistics of the obtained data are presented in
Table 4.
Figure 4,
Figure 5 and
Figure 6 present the boxplots for the data. The descriptive analysis indicates that the PM concentration is lower in 2020 and 2021, and that there is no obvious difference in the PM concentration between DT and NT in 2020 (but there is a difference in the other three years). To see if the observed difference is significant we apply a nonparametric test. The performed Mann-Whitney U test with significance level
shows that there is no statistically significant difference in the air quality during DT and NT in 2020 and 2022, but the difference is statistically significant in 2018 and 2021 for PM2.5 (
p-value
).
The effect
r of the factor [
32] (day-night) can be evaluated by the Formula (
1) where
z is the corresponding
z value that the Mann-Withey test produces [
31], and
n is the sample size (in this case
for 2018 and
for 2021). For the year 2018, the
z value for PM2.5 and PM10 are
and
respectively, and hence the effect of day-night is small [
31] for PM2.5 (
) and small to medium for PM10 (
). For the year 2021, the corresponding
z values for PM2.5 and PM10 are
and
respectively, and therefore the effect of night-day is large for PM2.5 (
), while for PM10 the effect is medium (
).
The next step was to analyze if there is a difference in the concentration of PM2.5 (resp. PM10) in 2018, 2020, 2021, and 2022, i.e., pre-COVID, during the global pandemic, and post-COVID. The analyses was performed by applying the Kruskal-Willis test [
31], which resulted in
p-value
, hence the Null hypothesis now is
. There is no difference in the concentration of PM2.5 (resp. PM10).
is rejected. To locate the difference a post hoc test was performed [
31], and the results show that the concentration of PM2.5 and PM10 is significantly lower in 2020 compared to 2018 and 2022. Although there is a difference in concentration in favor of 2022, the results indicate that it is not significantly different than the concentration in 2018. Similarly, the concentration of PM in 2021 is significantly smaller than the concentration in 2018 and 2022. When PM concentrations are compared for 2020 and 2021 it is easy to see that the concentration in 2021 is higher than in 2020, and the results show that this difference is also statistically significant.
Applying (
1) one can evaluate the effect size. Observe that the Kruskal-Wallis test is a
statistic, so the resulting value should be converted into
z score. The analysis shows the effect size, presented in
Table 5. Values above 0.14 in literature are interpreted [
33] as a large effect, while values in the interval
are considered as a small effect. It is obvious that the COVID-19 pandemic had a large positive effect on air pollution in 2020 compared to 2018 and 2022, but the effect of COVID-19 was small to insignificant when 2022 compared to 2018. The effect for 2021 is reduced, compared to 2020.
4. Discussion
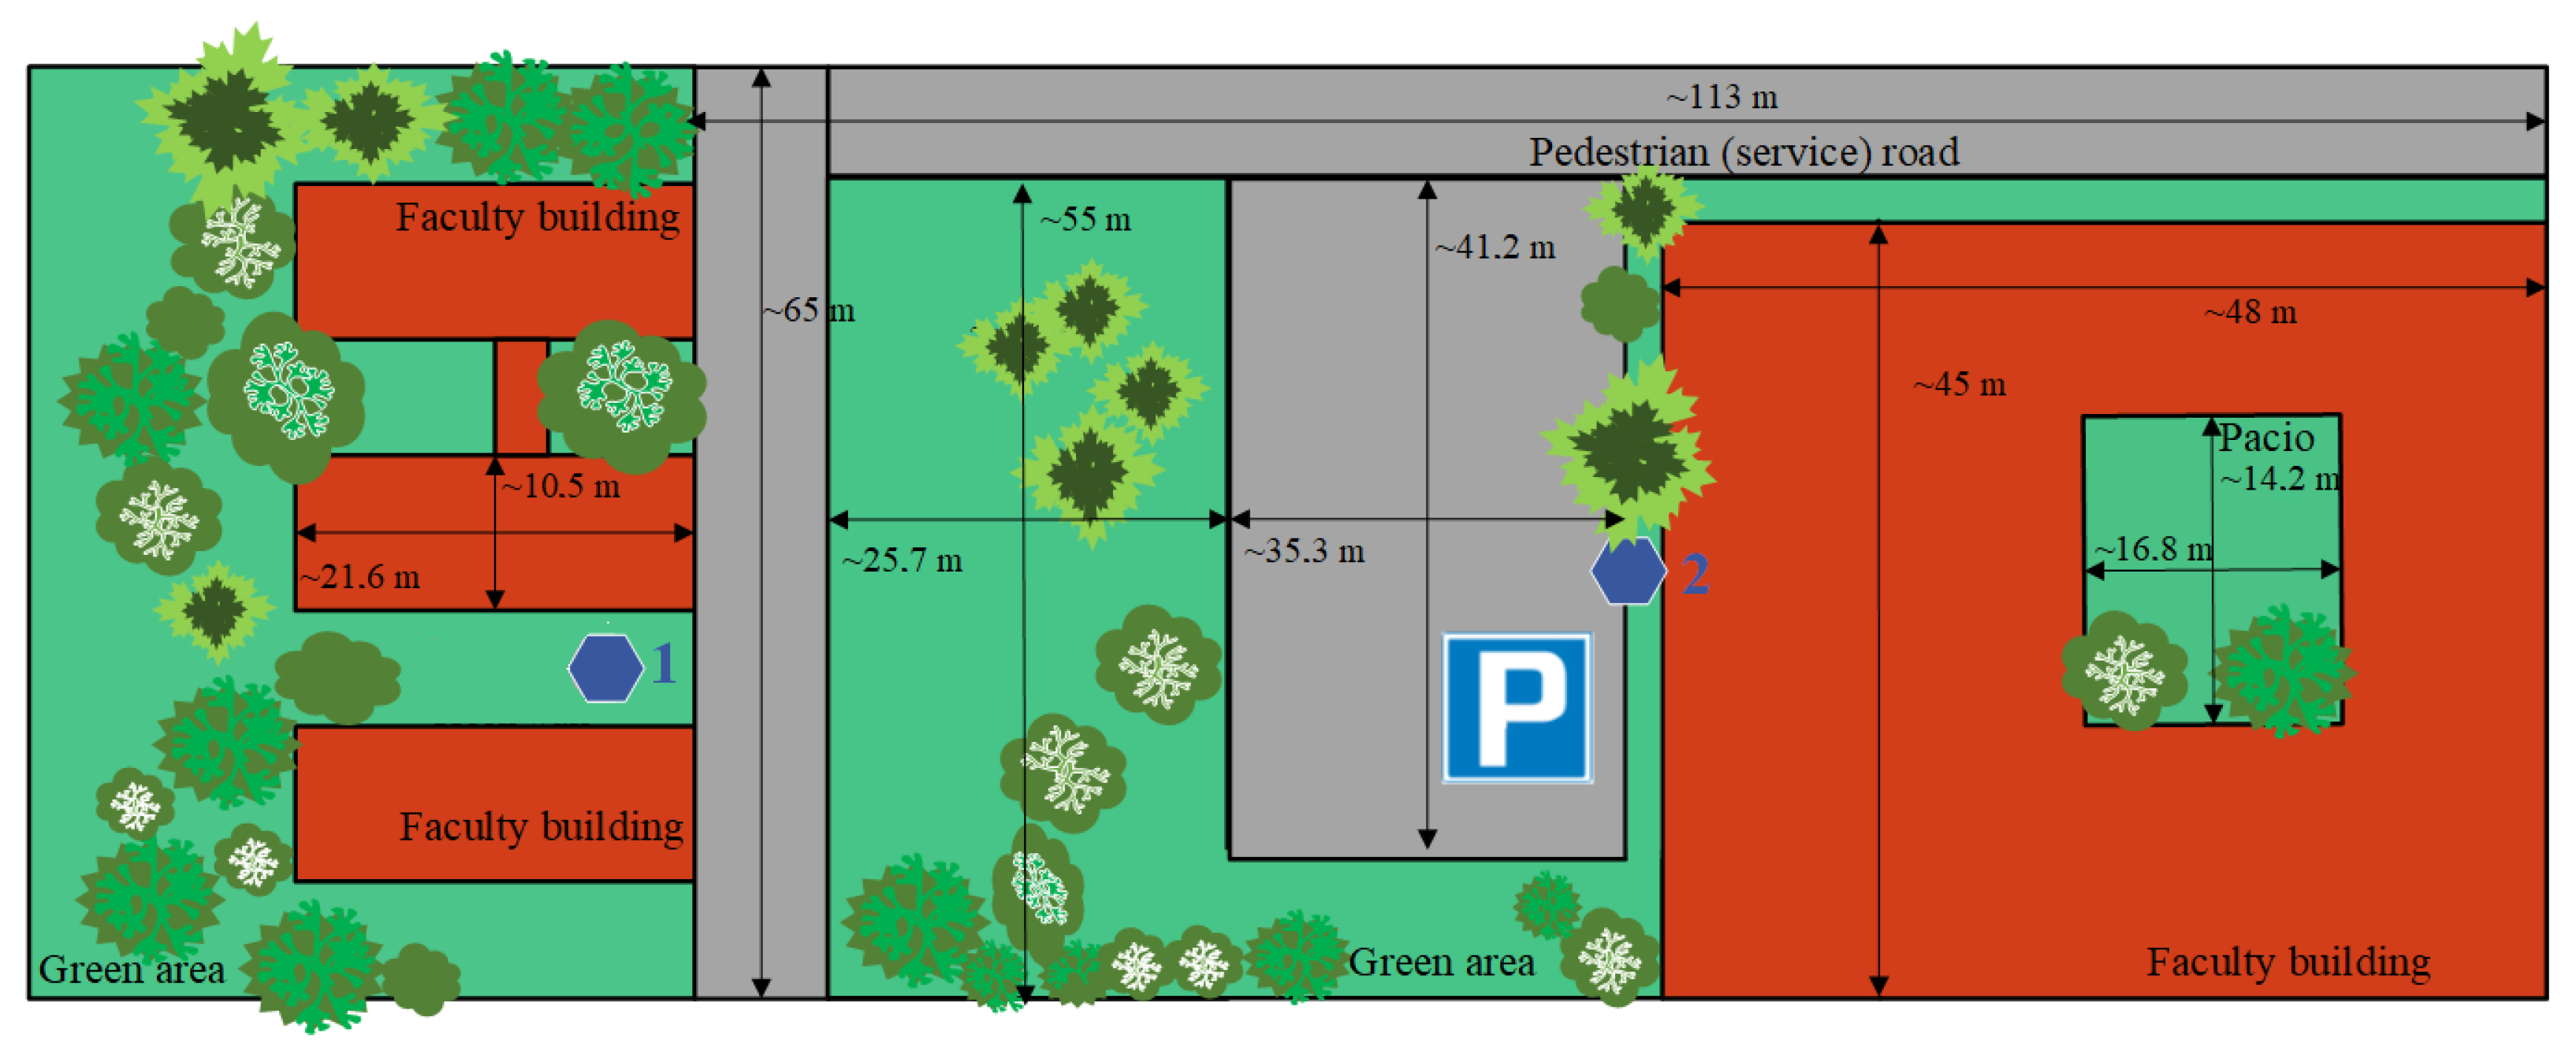
The data analyzed in this paper was collected with sensors located near the parking lot of the Faculty of Electrical Engineering and Information Technologies (see
Figure 1) in May 2018, May 2020, May 2021, and May 2022. In May 2018 the faculty functioned at full capacity, but due to the COVID-19 pandemic, the campus was fully closed from the middle of March 2020 until late September. The number of activities on the campus gradually increased, and since February 2020 the faculty worked with
of its capacity. As the COVID-19 pandemic started in March 2020, the authorities in Macedonia introduced restriction measures such as quarantines and curfews, and also many stores and factories were closed or working with reduction. Schools were also closed till the end of the school year, and the administration worked at reduced capacity. All of the restriction measures ended at the beginning of 2022 and life was slowly getting back to “normal”.
The analyses in this paper consider data from May 2018, 2020, 2021, and 2022. May was chosen to eliminate the effects of the pollution typical for the heating season (sub-urban and some urban areas are not connected to the district heating system). Clearly, the habits of the people dramatically changed during the pandemic. The aim of the paper was to investigate whether these lifestyle changes affected in some way the air pollution. The results from the statistical analysis are presented in the previous section. Previous studies [
23] have shown that PM concentration in Skopje is much higher during NT. The analyses on the observed set of data led to the same conclusion for May 2018, but that was not the case for the other observed years. There might be several reasons for the decrease in NT PM concentration-reduced economic activity due to the pandemic, reduced traffic, and possibly increased control of sources of pollution.
The analysis also shows that during the COVID-19 pandemic the concentration of PM2.5 and PM10 was significantly reduced, compared to 2018. Clearly, COVID-19 and implemented measures had a large effect on air pollution with PM2.5 and PM10 (see
Table 5). The concentration of PM2.5 was reduced by
compared to May 2018, and the concentration of PM10 was reduced by
. The observed case for Skopje leads to similar conclusions as studies undertaken in other parts of the world, as described in the
Section 1. Observing the statistics for the WD period, it can be concluded that the pollution in the post-COVID-19 period becomes similar to the pre-COVID-19 period. This may also serve as an indication of the factors that contribute to high concentrations of PM2.5 and PM10. Namely, the reduction of traffic, civil works, and economic activities in combination with positive weather factors (higher humidity) have a positive impact on PM concentration. The effect of each of these factors requires collection of additional data and further analyses. The COVID-19 pandemic and the restriction implemented by the government had a big effect on the air quality in a positive sense. Returning to the old habits results in a similar air quality as the pre-COVID-19 period.
5. Conclusions
The lockdown response to COVID-19 has caused an unexpected reduction in transportation and in the global economy. The change in daily habits and the complete lifestyle of people during the lockdowns and curfews at least made a positive contribution to air pollution reduction. The paper presents a systematic statistical approach to investigate the impact of the pandemic on the air quality in Skopje. The applied methodology allowed testing of the hypothesis that there is a difference between the PM2.5 and PM10 concentrations before, during, and after the COVID 19 pandemic. The analyses of the collected data confirmed that the PM concentrations were reduced in the years when certain restrictive measures were applied. Therefore, it can be concluded, that for the observed measurement location, the COVID 19 pandemic had a positive impact on PM concentration mitigation. After accounting for the variabilities of the PM concentrations in the observed period, it can be also concluded that there is a decline in PM concentration when comparing DT and NT.
Although the performed measurements are specific for the location, the conclusion and statistical analyses undertaken to assess the measurement location relative to the air pollution during COVID-19 can be generalized to obtain the following aspects. Firstly, the influence on people’s pandemic lifestyle (government and self-imposed restrictive measures) on PM concentrations under the described conditions is significant, which is confirmed by the statistical analyses presented in the paper. The conclusion should serve as a trigger to devise measures that will contribute to PM concentration reduction, especially in terms of optimization of inter-city commuting by using online collaboration tools in companies, optimizing transport chains, incentivizing alternative transportation, and so on. Of course, these measures should be developed in a manner that will not compromise the economic activities of the citizens. Additionally, these observations are confirmed by the data analyzed for the post-pandemic period, where the tendency of air pollution increase is noticeable, as people’s social habits and work obligations are nearly the same as in the pre-pandemic period. It should not be neglected that other factors may have an impact on air pollution. Such factors may turn out to be substantial and more important and therefore it is advisable to conduct further studies in this field.

 ,
, 


