Article

Ambient Ozone and Fine Particular Matter Pollution in a Megacity in South China: Trends, Concurrent Pollution, and Health Risk Assessment

1
Department of Atmospheric Environment and Climate Change Research, Shenzhen Academy of Environmental Sciences, Shenzhen 518000, China
2
Department of Atmospheric Environment Monitoring, Shenzhen Ecological and Environmental Monitoring Center of Guangdong Province, Shenzhen 518000, China
3
Climate Research Department, Shenzhen National Climate Observatory, Shenzhen 518000, China
*
Authors to whom correspondence should be addressed.
Atmosphere 2023, 14(12), 1806; https://doi.org/10.3390/atmos14121806
Submission received: 13 November 2023 / Revised: 6 December 2023 / Accepted: 7 December 2023 / Published: 9 December 2023
(This article belongs to the Special Issue Air Pollution in Asia)

Abstract

:
Over the past several years, Shenzhen’s air quality has significantly improved despite increased ground-level ozone (O3) and the challenges in reducing fine particulate matter (PM2.5). We investigated concentration trends, concurrent pollution features, and long-term exposure health risks to enhance our understanding of the characteristics of O3 and PM2.5 pollution. From 2016 to 2022, there was a decrease in PM2.5 levels, but an increase in O3. Additionally, the premature mortality attributed to long-term air pollution exposure decreased by 20.1%. High-O3-and-PM2.5 days were defined as those when the MDA8 O3 ≥ 160 μg m–3 and PM2.5 ≥ 35 μg m–3. Significantly higher levels of O3, PM2.5, nitrogen dioxide (NO2), OX (OX = O3 + NO2), and sulfur dioxide (SO2) were observed on high-O3-and-PM2.5 days. Vehicle emissions were identified as the primary anthropogenic sources of volatile organic compounds (VOCs), contributing the most to VOCs (58.4 ± 1.3%), O3 formation (45.3 ± 0.6%), and PM2.5 formation (46.6 ± 0.4%). Cities in Guangdong Province around Shenzhen were identified as major potential source regions of O3 and PM2.5 during high-O3-and-PM2.5 days. These findings will be valuable in developing simultaneous pollution control strategies for PM2.5 and O3 in Shenzhen.

1. Introduction

Over the past few decades, there has been a remarkable increase in surface ozone (O3) levels in East Asia, particularly in China [1,2,3]. Despite rapid reductions in fine particulate matter (PM2.5) levels [4,5], PM2.5-related hazards remain significant due to adverse impacts on visibility, climate change, and human health [6,7,8]. Tropospheric aerosols play an important role in cooling the climate system by reflecting solar radiation and enhancing cloud reflection [9]. Long-term or short-term exposure to O3 and PM2.5 has a detrimental effect on human health, e.g., mortality from cardiovascular and respiratory diseases [10,11,12,13]. The Global Burden of Disease Study in 2019 reported that air pollution has emerged as the fourth leading cause of death worldwide [14]. The premature deaths related to long-term exposure to O3 and PM2.5 were reported to be 1.39 million and 147.7 thousand, respectively, in 2020 across China [15]. Given the serious O3 and PM2.5 pollution issues in China [16,17], it is essential to identify the causes of pollution for O3 and PM2.5 to implement coordinated prevention and control measures.
Tropospheric O3 is recognized as one of the most important products formed via the photochemical oxidation of volatile organic compounds (VOCs), catalyzed via nitrogen oxides (NOX) and hydrogen oxide radicals (HOX) in the presence of sunlight [18,19]. Ambient PM2.5 has been shown to affect O3 production by attenuating solar radiation and HOX radical uptake [20,21]. Shao et al. [22] demonstrated a 37% increase in O3 production attributed to reduced PM2.5 in Beijing from 2006 to 2016. Nevertheless, other researchers reported that the increase in O3 elevates the atmospheric oxidation capacity, which promotes the formation of secondary PM2.5 [23,24]. Despite the different formation mechanisms of ambient O3 and PM2.5 and their complex relationships, the same precursors, including VOCs and nitrogen dioxide (NO2), make it possible to establish mitigation strategies for both O3 and PM2.5.
Shenzhen is a coastal city located in the southern region of China, with a population of more than 17 million. The region is influenced by a subtropical monsoon climate, characterized by relatively high temperatures throughout the year. As the central city of the Greater Bay Area, Shenzhen ranks as the third-largest city in China for gross domestic product (GDP). In recent years, the air quality in this area has significantly improved. The annual average concentration of PM2.5 was 16 μg m−3 in 2022, close to the World Health Organization (WHO)’s recommended first-stage interim target of 15 μg m−3. However, O3 concentrations in Shenzhen have not shown declining trends, and the levels of O3 and PM2.5 are still significantly higher than the WHO’s air quality guideline (AQG) levels [16,25]. This situation highlights the coordinated control of O3 and PM2.5 pollution, which will help improve air quality and reduce environmental health risks.
In this study, the pollution characteristics of O3 and PM2.5 in Shenzhen were investigated. This study quantified the trends, correlations, and premature mortality associated with long-term exposure to ambient O3 and PM2.5 from 2016 to 2022. The influence of the meteorological conditions on the high-O3-and-PM2.5 days was analyzed. The positive matrix factorization (PMF) model and the TrajStat model were applied to determine the contributions of VOC sources and potential source regions of O3 and PM2.5 during high-O3-and-PM2.5 days, respectively. The outcomes are expected to assist local governments in formulating effective strategies for controlling O3 and PM2.5. These findings also have implications for other international coastal regions that seek to further improve air quality.

2. Materials and Methods

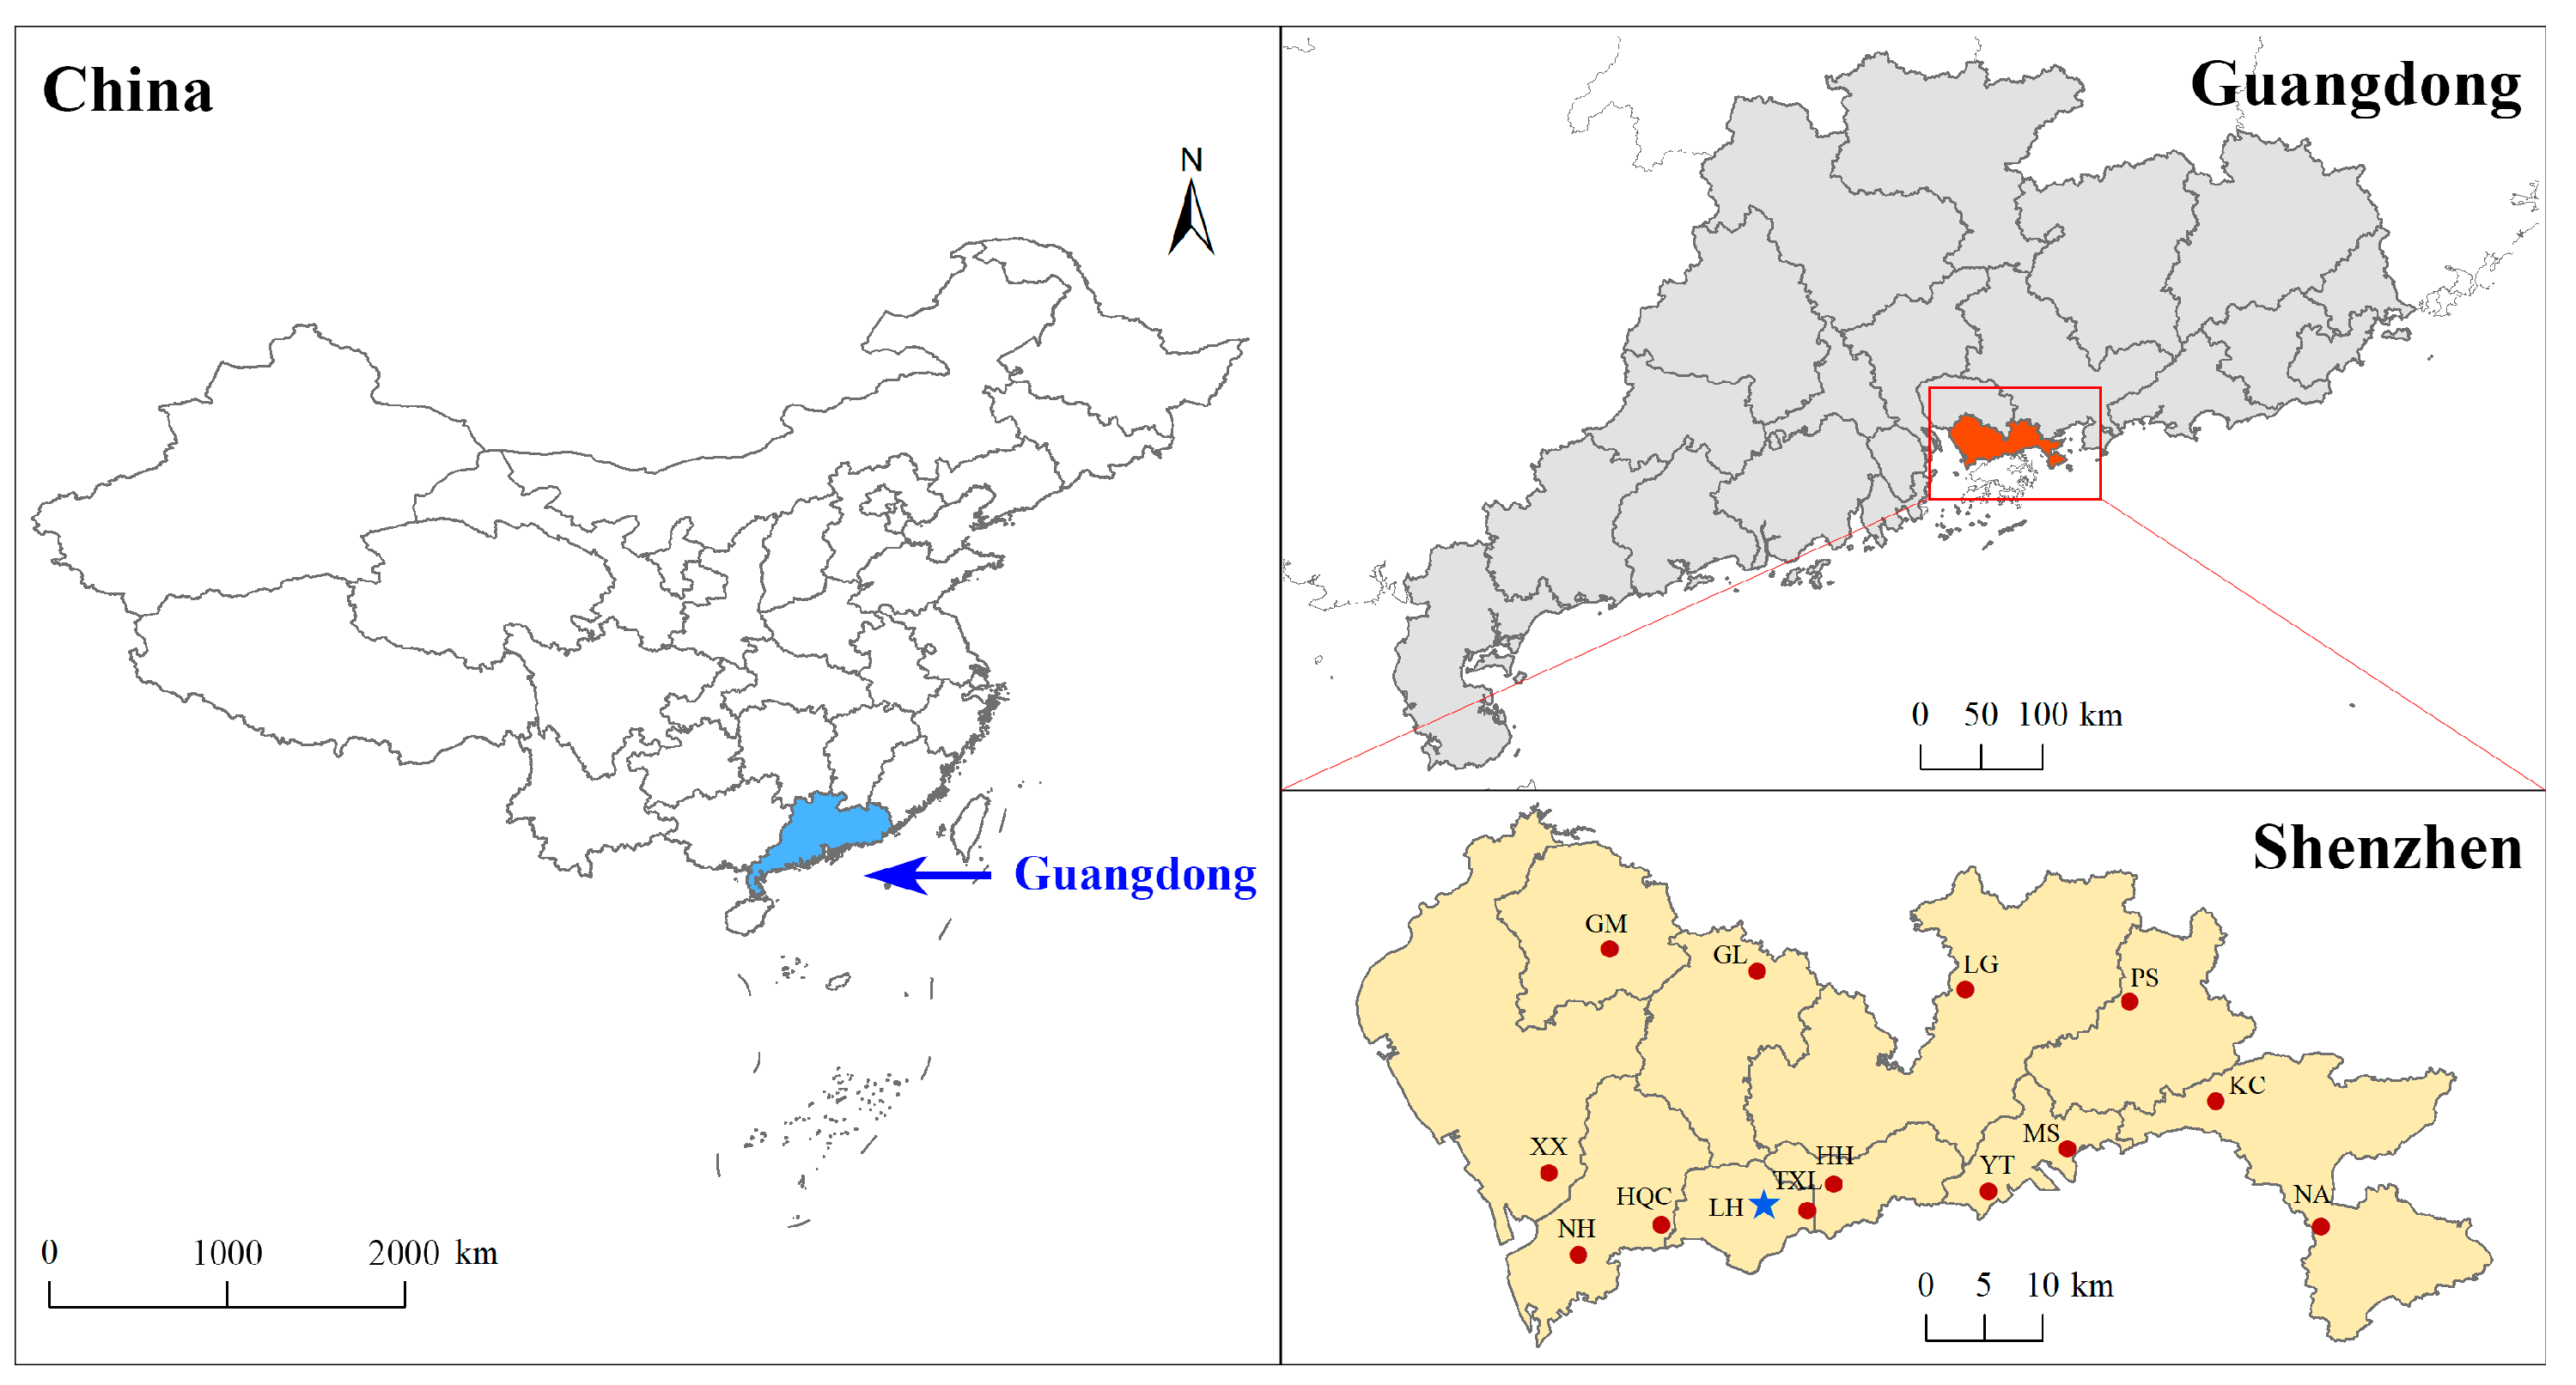
2.1. Data Collection

The locations of the sampling sites are depicted in Figure 1. The 14 sites were all ambient air quality monitoring stations where data on O3, PM2.5, NO2, sulfur dioxide (SO2), and carbon monoxide (CO) were collected. Meteorological parameters, such as temperature, relative humidity, air pressure, wind speed, and wind direction, were collected from the meteorological monitoring stations situated near the sampling sites. The details of the 14 sites are presented in Table S1. We have defined 13 sites, excluding the Lianhua (LH) site, as basic air quality monitoring stations (BAQMS). Hourly O3, PM2.5, NO2, and SO2 concentrations were monitored at 13 BAQMS from 2016 to 2022. In accordance with the National Ambient Air Quality Standards (NAAQS) of China [26], the reference state for O3, NO2, and SO2 was standardized at 273 K and 101.325 kPa, while the concentrations of PM2.5 were reported based on real-time temperature and pressure. At the LH site, 51 VOC species were continuously measured using an online gas chromatograph with a 1 h time resolution (Air-moVOC GC-866, CHROMATE-SUD, France) from 2019 to 2022. The LH site is a typical urban site located in the center of Shenzhen, which is surrounded by parkland, residential and commercial blocks. This site was also selected as a typical urban site in previous studies in Shenzhen [27,28,29].

2.2. Analytical Methods

2.2.1. Data Analysis

In this study, the levels of O3, PM2.5, NO2, SO2, and meteorological parameters in Shenzhen were determined using data from 13 BAQMS. Data from the LH site were used for source apportionment and to analyze the precursor VOCs’ impact on O3 and PM2.5 formations. The months of March to May, June to August, September to November, and December to February were defined as spring, summer, autumn, and winter, respectively. We defined the high-O3-and-PM2.5 days as those with daily maximum 8 h average (MDA8) O3 concentrations ≥ 160 μg m−3 and PM2.5 daily average concentrations ≥ 35 μg m−3 to investigate the concurrent pollution of O3 and PM2.5. Similarly, high-O3 days were categorized as days MDA8 O3 levels ≥ 160 μg m−3 and daily averages of PM2.5 < 35 μg m−3. The statistical analyses were conducted using the SPSS Statistics 26.0 software package. Since the concentrations of the air pollutants did not satisfy the normality distribution assumption, the correlation analysis was conducted using the Spearman correlation coefficient method.

2.2.2. Source Contribution Investigation

The US Environmental Protection Agency (EPA) positive matrix factorization model (PMF, version 5.0) was applied to investigate the emission sources of VOCs at the LH site, a representative urban site in central Shenzhen. The PMF model is a multivariate factor analysis tool that decomposes a matrix of speciated sample data into two matrices, i.e., factor contribution and factor profile decomposition [30,31]. Next, the sources of VOCs in the specific sites can be identified. This model has been frequently used for the source apportionment of ambient VOCs, and detailed introductions and applications of the PMF model can be found in previous studies [32,33]. In this study, data collected from 23 high-O3-and-PM2.5 days at the LH site were applied to the PMF model. A total of 19 non-methane hydrocarbons (NMHCs) and one trace gas (CO) were input into the model, and the uncertainties for each species were determined by summing 10% of the VOC concentrations [33]. Values below the method detection limit (MDL) were replaced by half the MDL, and the uncertainties were set at 5/6 of the MDL [34,35,36].
To assess the influence of anthropogenic sources on the formation of O3 and secondary organic aerosol (SOA), the maximum incremental reactivity (MIR) method [37,38] and the fractional aerosol coefficient (FAC) method [39,40] were utilized to compute the ozone formation potentials (OFPs) and secondary organic aerosol formation potentials (SOAFPs) of all VOC species, respectively. OFPs and SOAFPs can be calculated using the following equations:
OFPs = i VOC i × MIR i
SOAFPs = i VOC i × FAC i
where VOCi represents the concentration of VOC species i (μg m−3). MIRi denotes the MIR coefficient of species i [37]. FACi represents the FAC of species i [39,40]. In this study, the OFPs and SOAFPs of 19 VOC species used as input in the PMF model were calculated.

2.2.3. Identification of Potential Source Regions

We conducted simulations of the backward trajectories of air masses and identified the potential source regions of O3 and PM2.5 using a GIS-based model TrajStat to examine the impact of regional transport [41]. This model has been extensively used in previous studies [42,43,44]. The meteorological data used for the model were obtained from the global data assimilation system (GDAS) dataset (available at https://www.ready.noaa.gov/archives.php, accessed on 8 December 2023). The LH site, situated in the central area of Shenzhen, was selected as the target location for the backward trajectory study. A total of 58 high-O3-and-PM2.5 days were identified during the study period in Shenzhen. The model was run in a 24 h backward mode at a height of 200 m with a 1 h interval on high-O3-and-PM2.5 days during 2016 and 2022. Considering that the back trajectories at different heights below 1000 m did not differ significantly [45], the height of 200 m was chosen to reduce the effects of surface friction and to represent the concentrations of well-mixed air pollutants [46]. In previous studies, the height of 200 m has been widely used to investigate the back trajectories of air masses and potential source regions of air pollutants [46,47,48].
The potential source contribution function (PSCF) model combined with backward trajectories was applied to identify potential O3 and PM2.5 source regions. The study area was divided into i × j grids, and the PSCF value of grid ij can be calculated using Equation (3).
PSCF ij = m ij n ij
where nij represents the number of endpoints within the ij grid, and mij is the number of endpoints exceeding the pollutant concentration threshold. In total, there were 1392 trajectories and 34,800 endpoints. The area covered by the trajectories was divided into 3599 grids with a resolution of 0.15 × 0.15°. The O3 and PM2.5 thresholds were set at 115.7 μg m–3 and 44.0 μg m−3, respectively. These values represent the average O3 and PM2.5 concentrations during high-O3-and-PM2.5 days.
Since the PSCF model only indicates the distribution of pollution trajectories within a grid and is unable to demonstrate the actual pollution levels of specific trajectories, the concentration-weighted trajectory (CWT) model is utilized to attach weights to the trajectories based on their associated concentrations. The CWT is calculated using Equation (4).
C ij = a = 1 b C a × t ija a = 1 b t ija
where Cij denotes the average weight concentration of trajectory a in the ij grid. Ca is the concentration of trajectory a, and b represents the total number of trajectories. tija is the time that trajectory a remains in the ij grid.
If the value of nij is lower than three times the average number of endpoints for each grid nave, the weighting function Wij should be applied to reduce uncertainty by multiplying the PSCF and CWT. The Wij is calculated using Equation (5).
W ij = 1.00 ,   n ij > 3 n ave 0.70 ,   3 n ave     n ij > 1.5 n ave 0.40 ,   1.5 n ave   n ij > n ave 0.20 ,   n ave   >   n ij

2.2.4. Health Risk Assessment

This study utilized the Poisson regression relative risk model based on epidemiological research to estimate the premature mortality associated with long-term exposure to O3 and PM2.5. All-cause mortality, as well as cardiovascular and respiratory mortality, was calculated using Equation (6) [2,49].
M i , y = P y × I i , y × 1 1 / e β i ( C y C 0 )
where ΔMi,y represents the premature mortality of health endpoint i attributable to long-term exposure to O3 or PM2.5 in year y. Py is the population of Shenzhen in year y; Ii is the baseline mortality rate for health endpoint i in year y. βi denotes the long-term exposure–response coefficient (ERCs) of O3 or PM2.5 for health endpoint i (as shown in Table S2). It is defined as the percentage change in mortality for every 10 μg m−3 increase in O3 or PM2.5 concentration. Cy is the exposure concentration of O3 or PM2.5 in year y. C0 refers to the baseline concentration of O3 or PM2.5, which is considered a safe level with relatively low health risks. In line with the WHO Global Air Quality Guidelines [50], the long-term exposure scenario for O3 is defined as the peak season concentration. This is specifically determined by calculating the average of the MDA8 O3 concentration over six consecutive months with the highest six-month running average O3 concentration. The exposure scenario for PM2.5 is defined by the annual average concentration. The baseline concentrations of peak season MDA8 O3 and annual PM2.5 are assumed to be 60 μg m−3 and 5 μg m−3, respectively.
The economic loss caused by premature mortality was assessed using the value of a statistical life (VSL) method, which is commonly applied to evaluate the health economic loss resulting from air pollution [51,52,53]. Due to the unavailability of VSL in Shenzhen, the VSL from Chongqing [54] was used to assess the economic loss. This study utilizes per capita disposable income (PCDI) to calculate the VSL in Shenzhen, considering the influence of residents’ income [55]. The equation is as follows [56]:
VSL y = VSL base × I y I base β E
where VSLy represents the VSL in Shenzhen in year y, and VSLbase indicates the VSL of Chongqing in 2018, which is USD 3.88 million [54]. Ibase denotes the PCDI of the benchmark city in the base year, i.e., the PCDI of Chongqing in 2018 (available at http://tjj.cq.gov.cn/zwgk_233/tjnj/2019/indexch.htm, accessed on 5 December 2023). Iy is the PCDI of Shenzhen in year y. βE is the income elasticity coefficient, which the Organization for Economic Cooperation and Development recommends to equal 0.8 [57]. The population and PCDI data in Shenzhen for each year were obtained from the Shenzhen Statistical Yearbook (available at http://tjj.sz.gov.cn/zwgk/zfxxgkml/tjsj/tjnj/, accessed on 5 December 2023). Mortality rates related to various diseases were provided by the Health Commission of Shenzhen Municipality (available at http://wjw.sz.gov.cn/gkmlpt/index#2504, accessed on 5 December 2023).

3. Results and Discussion

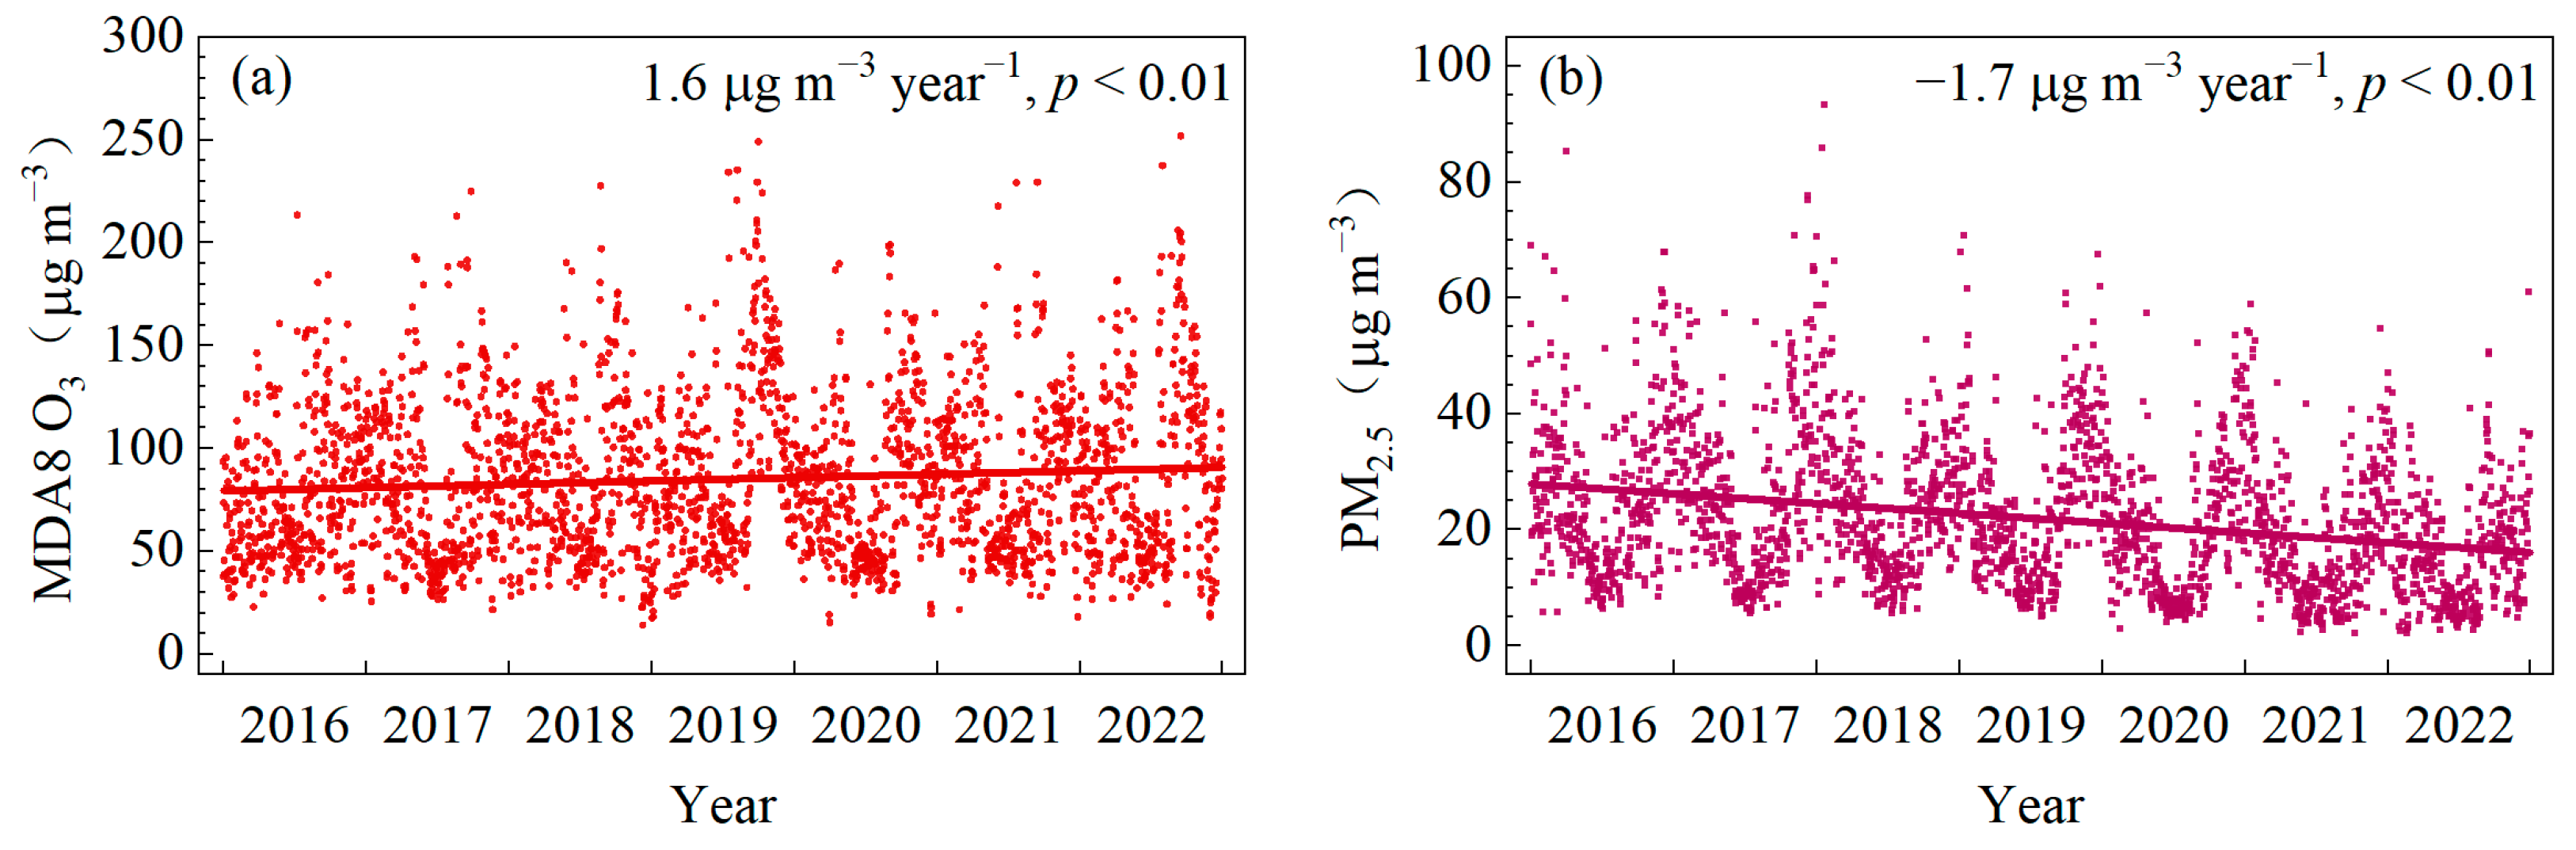
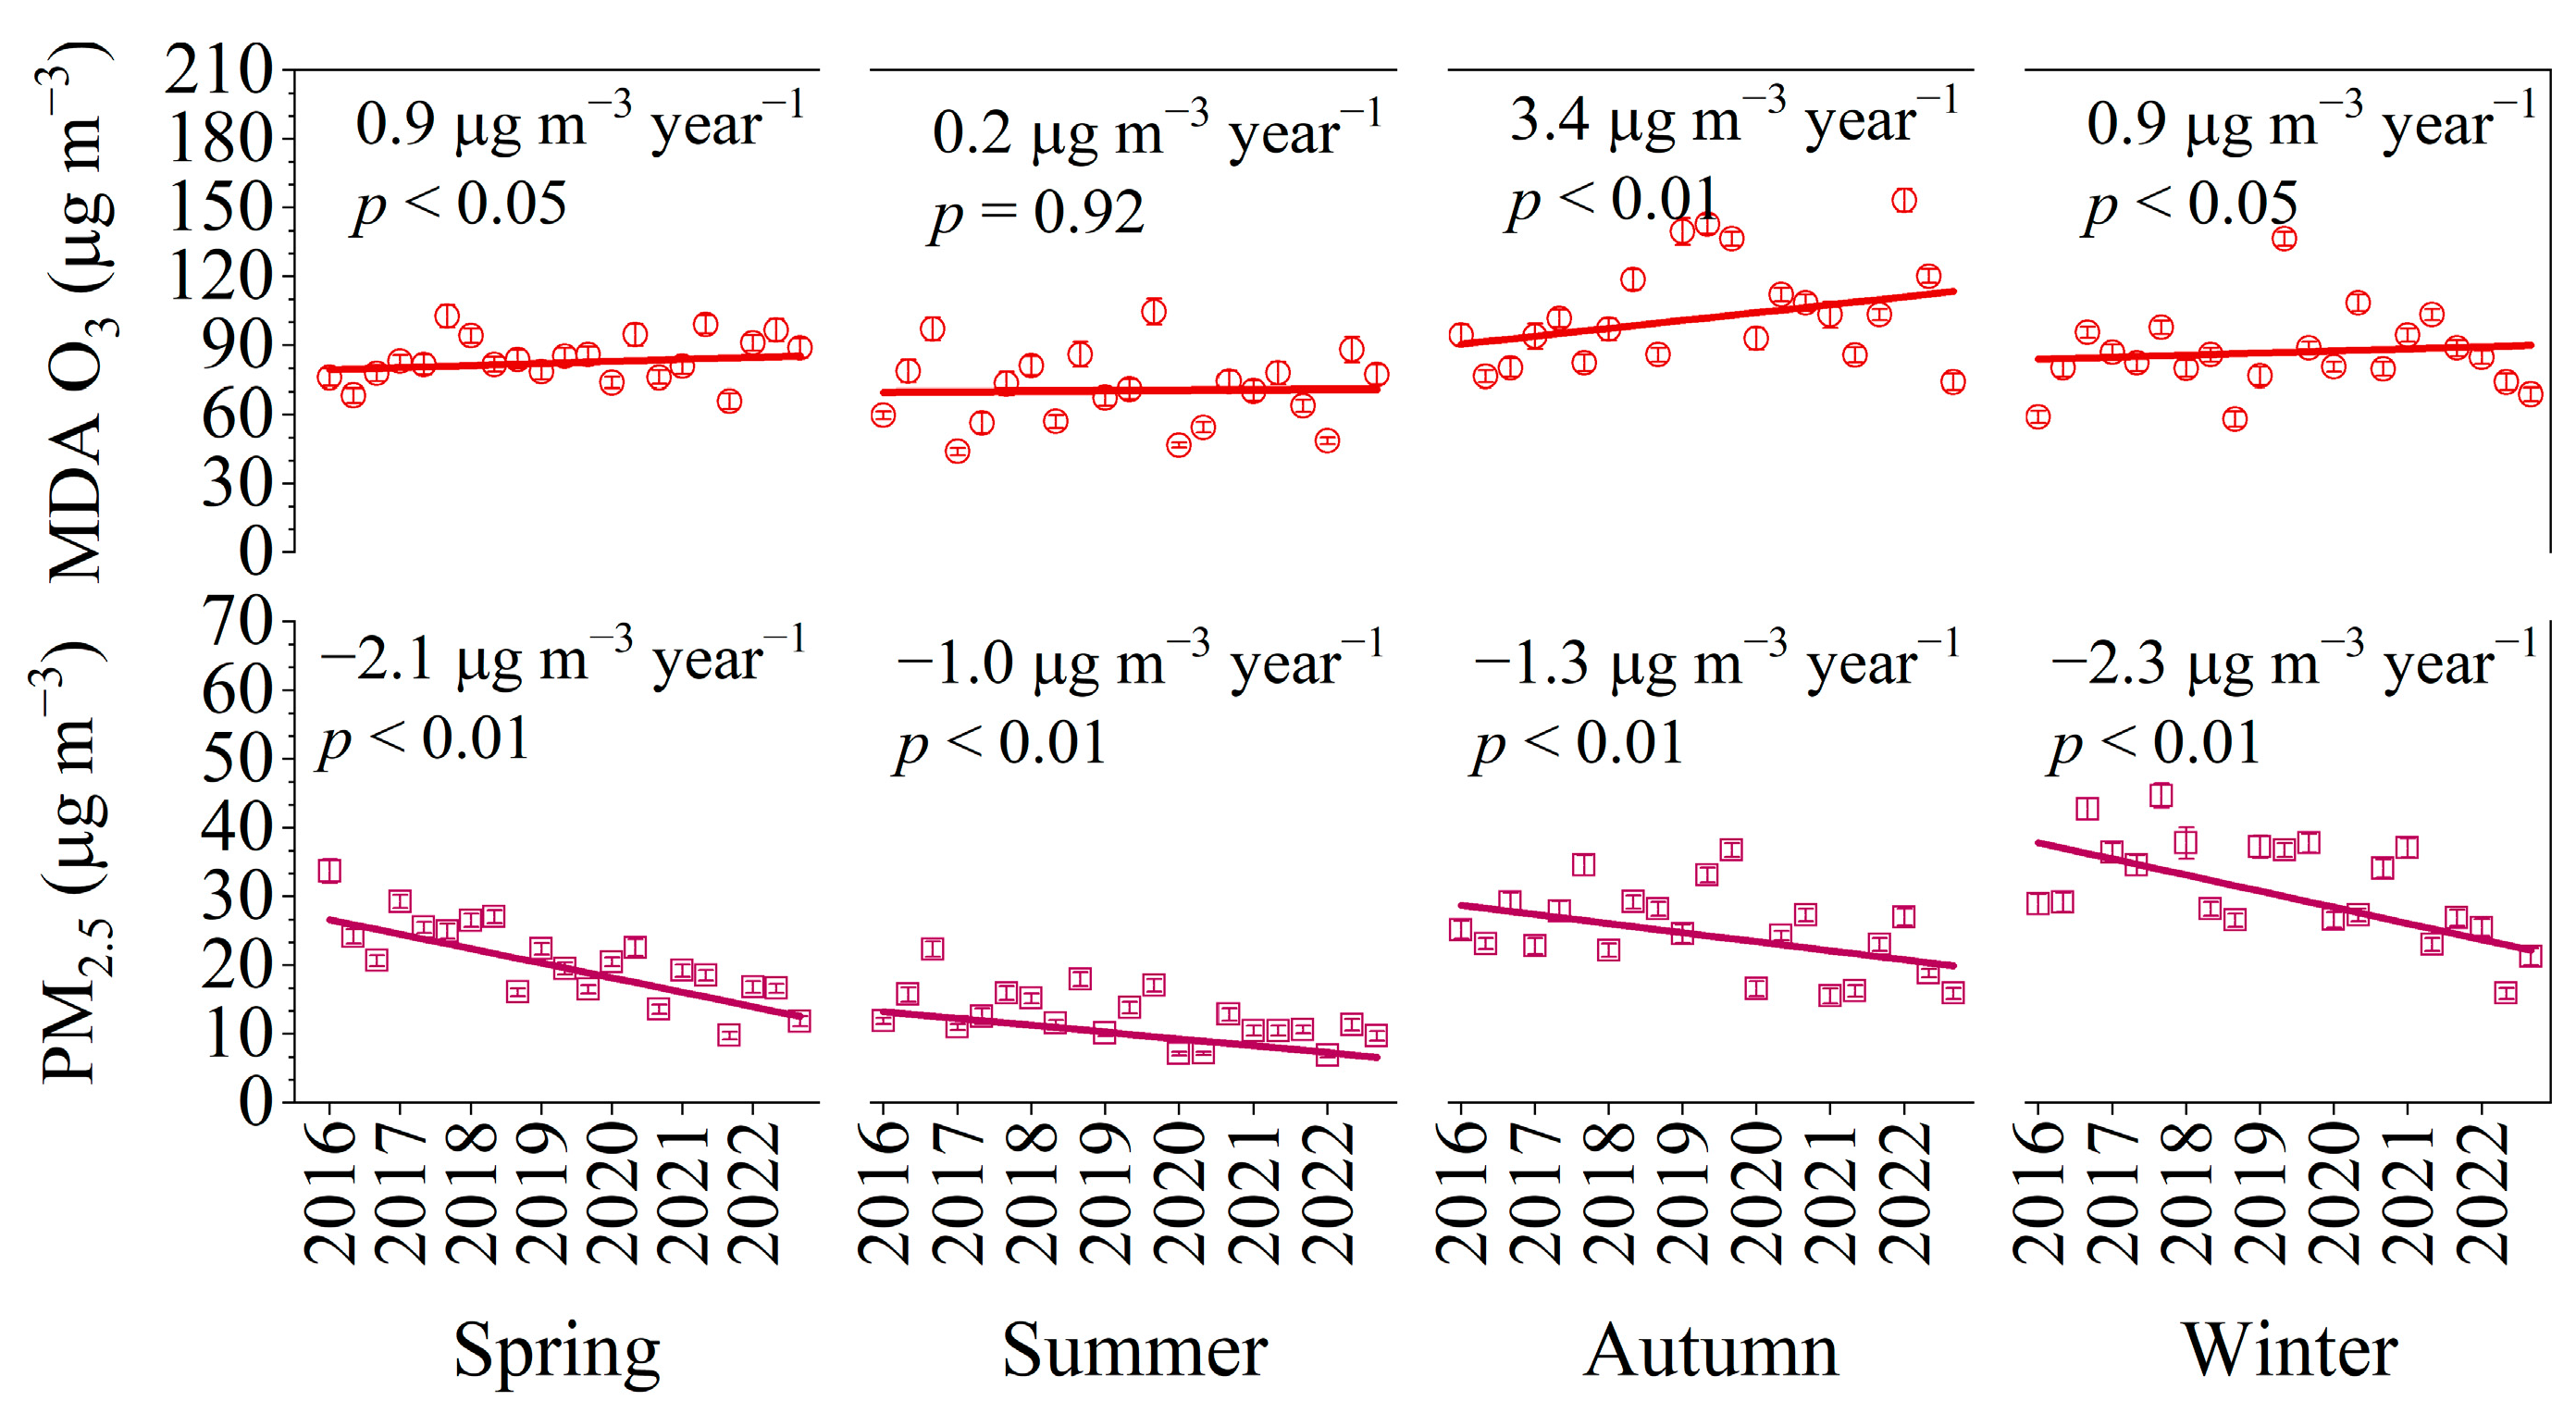
3.1. Trends of Air Pollutants

Figure 2 illustrates the trends of the daily average PM2.5, MDA8 O3, and NO2 concentrations in Shenzhen from 2016 to 2022. It was found that the PM2.5 levels decreased at a rate of −1.7 μg m−3 year−1. The concentrations of PM2.5 precursors (Figures S1 and S2), namely NO2, SO2, and VOCs, decreased at a rate of 1.5 μg m−3 year−1, 0.3 μg m−3 year−1, and 0.3 μg m−3 year−1, respectively. A comparable decline was also observed in Beijing, Shanghai, Hong Kong, and other cities in China [15,58,59,60], indicating the efficacy of the air pollution control measures. It is worth noting that the global spread of COVID-19 since 2019 has had a significant impact on anthropogenic activities, especially in China. Decreased industrial and transportation activities result in a reduction in air pollutant emissions, including NO2, PM2.5, SO2, and VOCs [61,62,63,64]. Therefore, the impact of the COVID-19 pandemic on ambient air pollutant levels from 2019 to 2022 cannot be ignored. In contrast to PM2.5, the concentration of MDA8 O3 increased by 1.5 μg m−3 year−1. This finding is consistent with previous studies that have reported a significant increase in O3 levels in urban areas in China [2,53,65], highlighting the importance of controlling ozone pollution. OX (OX = O3 + NO2) can be used to describe the atmospheric oxidation capacity of urban areas [66]. OX levels decreased at a rate of −1.5 μg m−3 year−1 (Figure S1), indicating a decline in atmospheric oxidation capacity. Given the increasing trend in O3 concentrations, the decrease in OX concentrations is primally attributed to reduced NO2 concentrations.
Figure 3 illustrates the seasonal variation of MDA8 O3 and PM2.5 from 2016 to 2022. The MDA8 O3 levels exhibited relatively low values in summer and high values in autumn. This differs from the seasonal variations of O3 in inland cities such as Beijing, Shanghai, Xi’an, and Wuhan, where the highest O3 concentrations consistently occur in the summer [53,67,68]. The levels of O3 in Shenzhen during the summer are influenced by unfavorable conditions, such as rainy and humid weather, as well as the dispersion of clean air from the southern sea. Despite the lower temperatures compared to summer (Table S3), Shenzhen maintains a relatively warm climate during the autumn season, particularly in September (28.7 ± 0.02 °C) and October (25.5 ± 0.02 °C). The decrease in relative humidity and precipitation during autumn, along with unfavorable synoptic systems, such as typhoon periphery and subtropical high-pressure systems, contribute to the formation and accumulation of O3. The periphery of typhoons and subtropical high-pressure systems often create favorable conditions, such as intense solar radiation and low wind speeds, for the photochemical formation of O3, as well as the accumulation of O3 and its precursors [69,70,71].
From 2016 to 2022, MDA8 O3 concentrations significantly increased in spring, autumn, and winter (p < 0.05), while showing no significant trend in summer (p > 0.05). The rate of increase in autumn is as high as 3.4 μg m−3 year−1. PM2.5 concentrations were relatively high in winter and low in summer. The long-term trends in all seasons showed significant decreases (p < 0.01), with the highest rate of −3.4 μg m−3 year−1 in winter. Similarly, all precursors (i.e., NO2, SO2, and VOCs) exhibited low levels in summer and high in winter (Figures S3 and S4). NO2 and SO2 levels significantly decreased in all seasons between 2016 and 2022 (p < 0.05), whereas VOCs only decreased in spring (p < 0.05). In contrast to other pollutants, the long-term trend of OX increased in autumn (0.7 μg m−3 year−1, p < 0.05) and decreased in other seasons (p < 0.05). The relatively high levels of OX in autumn indicate a more oxidative atmosphere, which favors the formation of O3 and PM2.5.
Figure 4 shows the frequency of MDA8 O3 and PM2.5 daily values exceeding Grade II NAAQS of China (160 μg m−3 for MDA8 O3, and 75 μg m−3 for PM2.5) at the 13 BAQMS from 2016 to 2022. The frequency of MDA8 O3 concentrations exceeding the NAAQS displayed an upward trend, increasing from 147 days in 2016 to 380 days in 2022, highlighting the severity of O3 pollution in Shenzhen. The number of MDA8 O3 exceedance days in autumn was significantly higher than in other seasons, highlighting the importance of controlling O3 pollution during this time of year. In contrast to the trend for MDA8 O3, the frequency of PM2.5 levels exceeding the NAAQS showed a significant downward trend, declining from 38 days to 0 days. The frequency of PM2.5 exceedance days is much higher in winter than in other seasons. Although PM2.5 levels in Shenzhen are below China’s NAAQS limit, they are significantly higher than the guideline level recommended by the WHO (5 μg m−3). Furthermore, there is still a significant difference compared to the levels observed in internationally advanced cities. In 2022, the annual average PM2.5 concentration in Shenzhen was 16 μg m−3, which is notably higher than Tokyo (9.0 μg m−3), London (9.6 μg m−3), New York (9.9 μg m−3), and other advanced international cities [72]. Therefore, it is essential to simultaneously mitigate O3 and PM2.5 to improve air quality in Shenzhen.

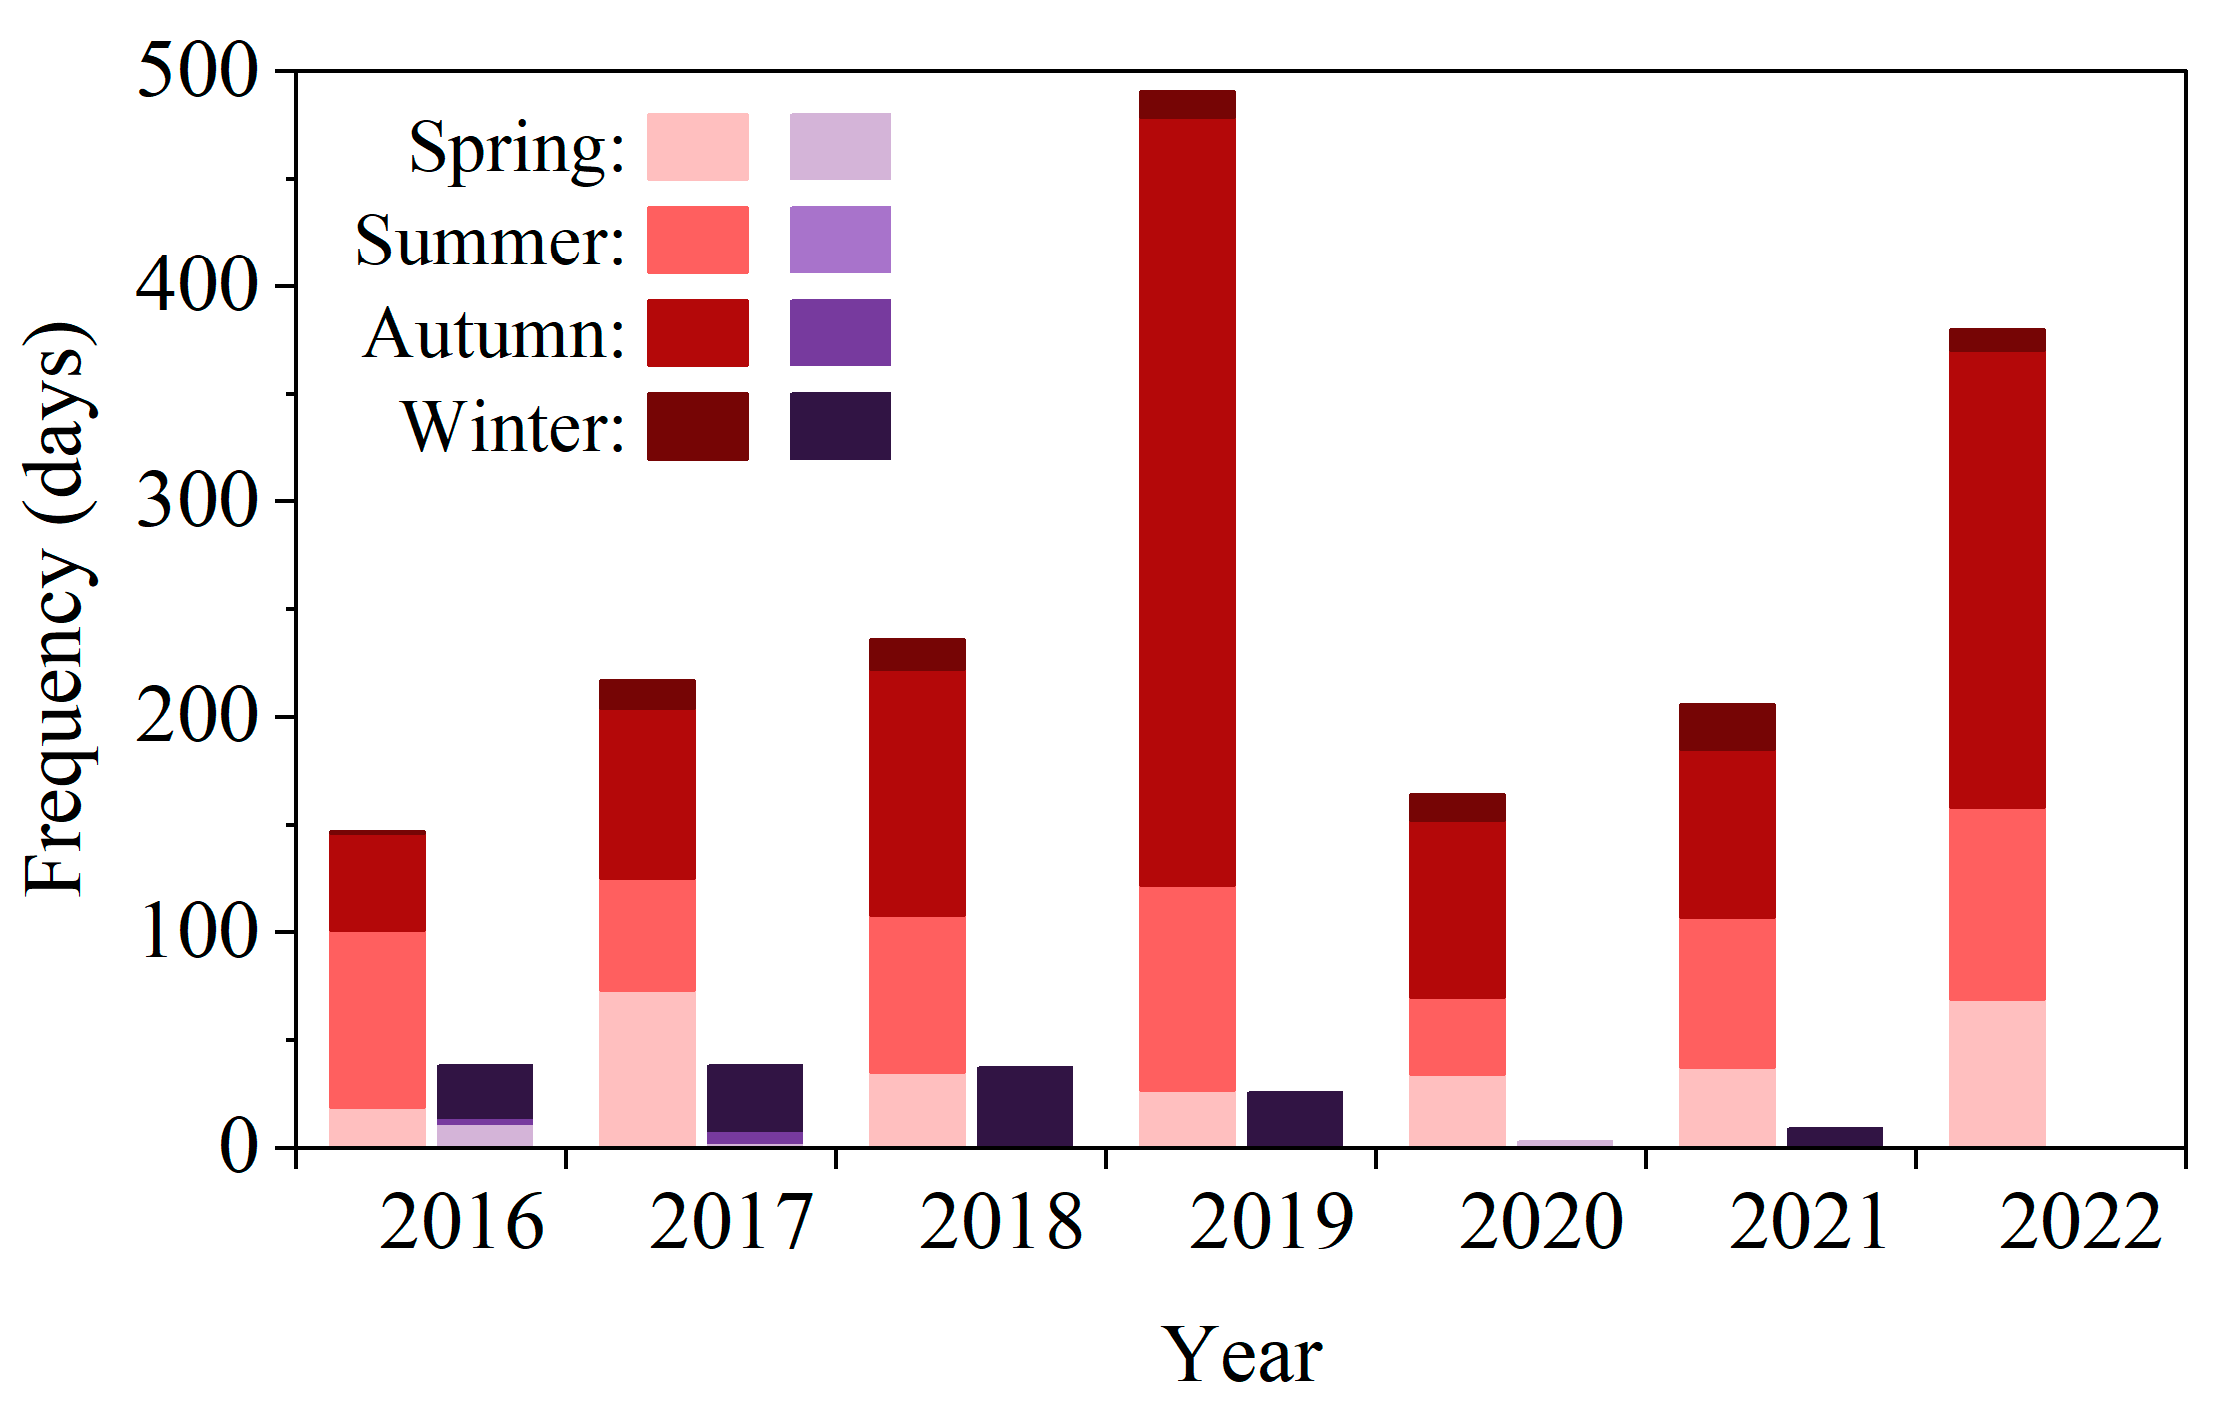
3.2. Concurrent Pollution of O3 and PM2.5

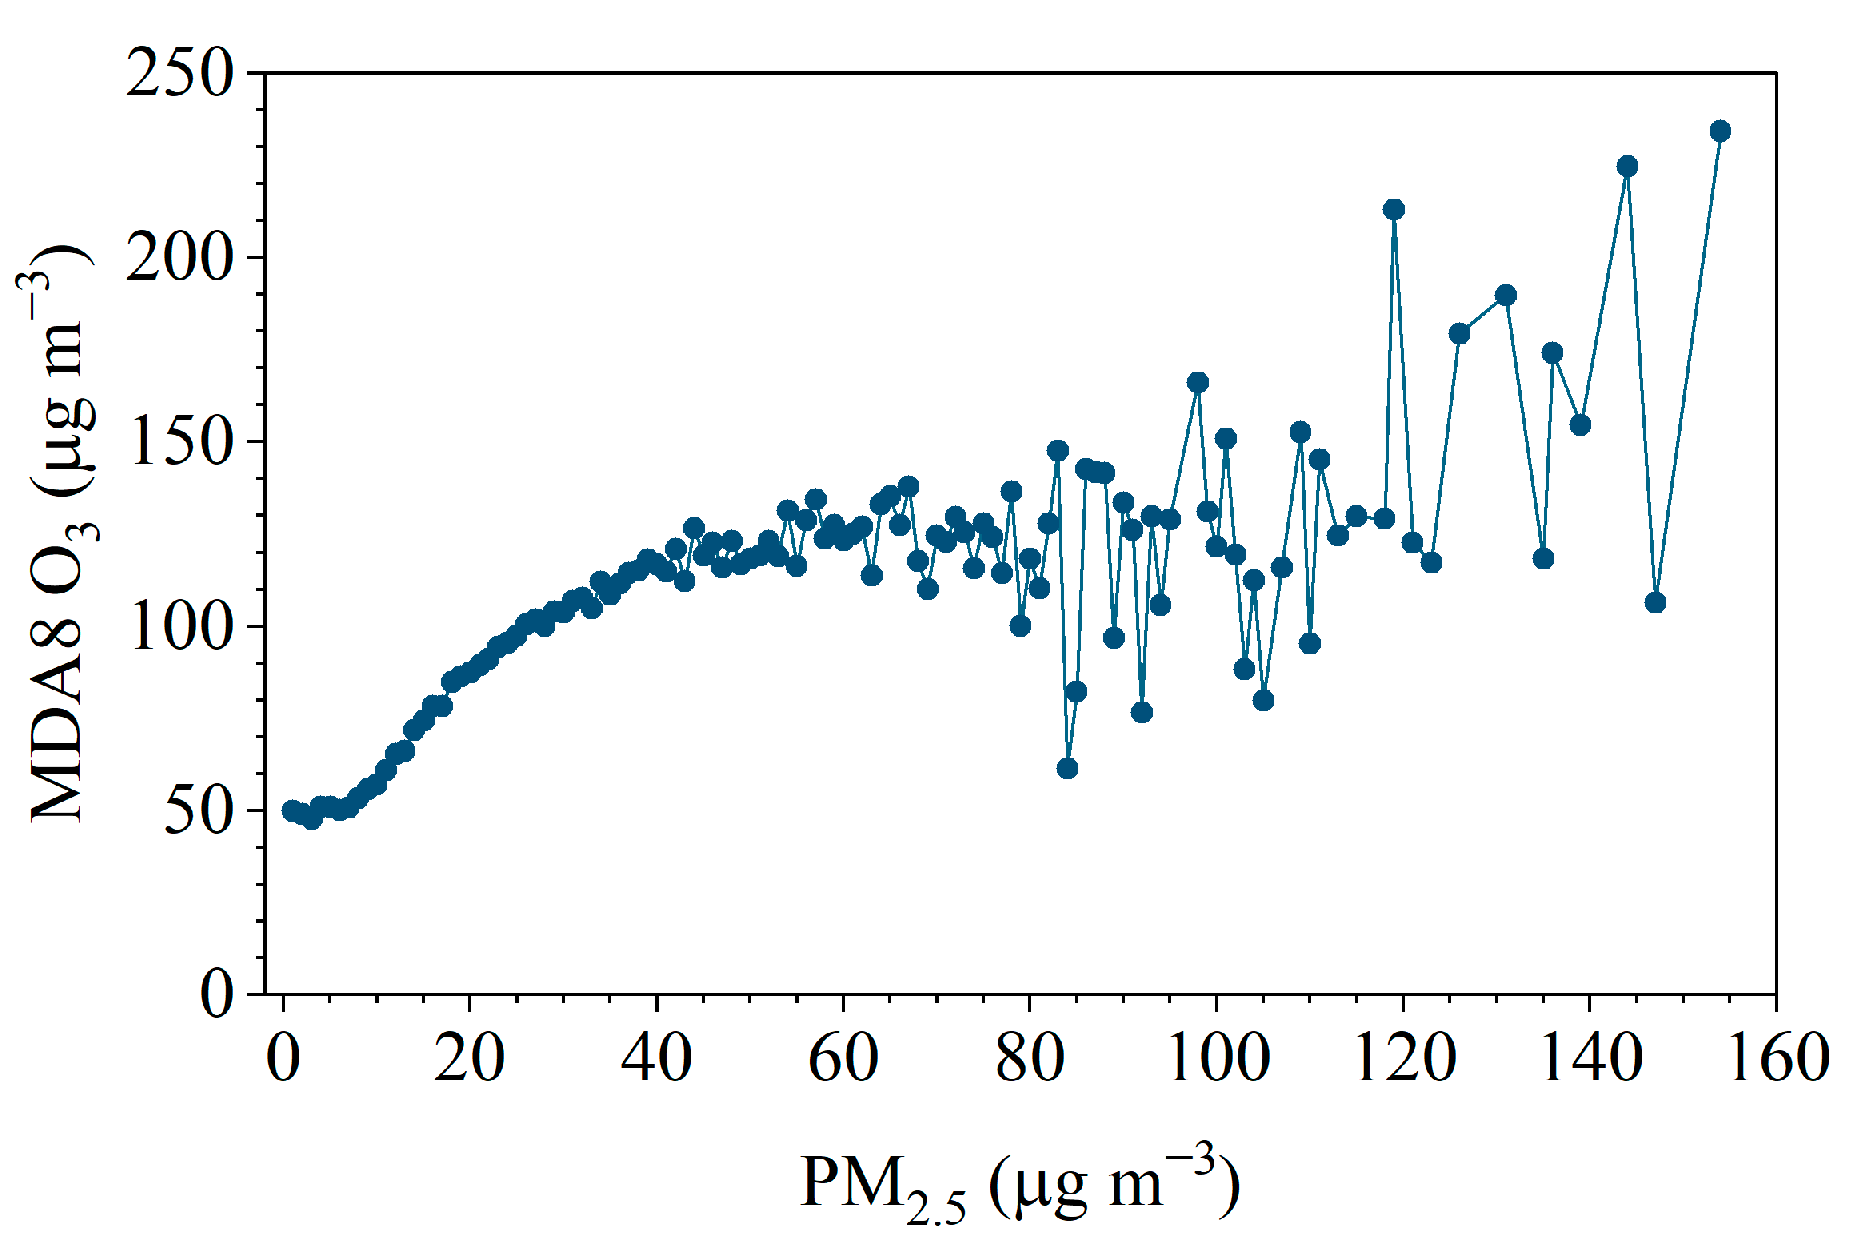
3.2.1. Correlations between O3 and PM2.5

Figure 5 displays the average MDA8 O3 concentrations at different PM2.5 levels in Shenzhen from 2016 to 2022. The average MDA8 O3 concentrations increased progressively from 49.1 ± 2.9 μg m−3 to 116.7 ± 5.1 μg m−3 as PM2.5 levels increased from less than 2.0 μg m−3 to 40 μg m−3. When the PM2.5 concentration exceeded 40 μg m−3, there was an increase in the fluctuation of the mean MDA8 O3 concentrations. In contrast to previous findings in the Yangtze River Delta and North China Plain [73,74], MDA8 O3 concentrations in Shenzhen did not exhibit significant decreases with increasing PM2.5 concentrations. This might be due to the relatively high temperature in Shenzhen. Between 2016 and 2022, the annual mean temperature was 23.7 ± 0.1 °C, and the average winter temperature was 16.9 ± 0.1 °C. Under high temperatures, the impact of O3 on the formation of secondary PM2.5 may surpass the interaction between them [73].
Table 1 presents the correlation coefficients (R) between MDA8 O3, OX, and PM2.5 in Shenzhen from 2016 to 2022. Remarkable positive correlations (R > 0) were observed throughout each season and the entire year, consistent with findings reported in the Pearl River Delta region [24,73]. The significantly positive correlation between MDA8 O3 and PM2.5 (p < 0.01) indicated simultaneous trends in O3 and PM2.5 concentrations. This might be attributed to the same precursors of O3 and secondary PM2.5, such as VOCs and NO2 [19,75]. Furthermore, elevated O3 concentrations will increase the atmospheric oxidation capacity and promote the generation of secondary PM2.5, which contributes to the positive correlation between O3 and PM2.5 [23,24,73,76]. This also explains why the strongest correlation between MDA8 O3 and PM2.5 is observed in summer (R = 0.62). It has been widely reported that O3 and PM2.5 are positively correlated in warm seasons, especially in summer [23,77]. This might be due to the relatively high solar radiation and temperature during the summer, which greatly enhances the ambient photochemistry, and promotes the formation of O3 and secondary PM2.5 [69,78,79]. The correlation coefficients of PM2.5-OX were higher than those of MDA8 O3-PM2.5, suggesting that PM2.5 concentrations tend to be more synchronous with atmospheric oxidation. This may be related to the substantial NO2 fractions in OX (about 30% in Shenzhen). Particulate nitrate is an important component of secondary PM2.5, which can be generated via the gas-phase oxidation reaction of NO2 with hydroxyl radicals (OH) [19]. As both O3 and particulate nitrate are generated in atmospheric oxidation processes, the control of O3 and PM2.5 pollution is expected to benefit from the mitigation of atmospheric oxidation capacity [21].

3.2.2. Influence of Precursors and Meteorological Parameters

When O3 concentrations exceed China’s Grade Ⅱ NAAQS, they often coincide with increased PM2.5 levels. This underscores the importance of examining the pollution characteristics of high-O3-and-PM2.5 days, which typically occur in autumn, particularly in September (Figure S5). Table S4 presents the descriptive statistics of MDA8 O3, PM2.5, OX, NO2, and SO2 on high-O3-and-PM2.5 days and high-O3 days. Compared to high-O3 days, the high-O3-and-PM2.5 days showed higher concentrations of MDA8 O3, PM2.5, OX, SO2, and NO2 (p < 0.01). During high-O3-and-PM2.5 days, the MDA8 O3 and PM2.5 concentrations were 195.6 ± 2.1 μg m−3 and 47.2 ± 0.9 μg m−3, respectively, which were approximately 6% and 80% higher than on high-O3 days (p < 0.01).
Meteorological parameters, which have significant impacts on O3 and PM2.5 concentrations, were statistically analyzed and are presented in Table S5. Compared to high-O3 days, the high-O3-and-PM2.5 days were associated with lower temperatures and wind speeds (p < 0.01), as well as comparable boundary layer height and lower relative humidity (p > 0.05). Since the temperature difference between the two scenarios was not significant (approximately 1 °C), and the high-O3-and-PM2.5 days often occurred close to high-O3 days, the occurrence of high-O3-and-PM2.5 days might be attributed to inferior pollutant dispersion conditions under lower wind speeds. The synoptic systems during high-O3-and-PM2.5 days are statistically presented in Table S6. Three synoptic system patterns governed the high-O3-and-PM2.5 days, including the typhoon periphery, uniform pressure system, and subtropical high-pressure system, with occurrence proportions of 65.9%, 18.2%, and 15.9%, respectively. Under the periphery of a typhoon, unfavorable meteorological conditions occur, including downdrafts and low wind speeds, and the transmission of pollution from upstream cannot be neglected [71]. The uniform pressure system always results in calm weather, which is unfavorable for the dispersion of air pollutants [70,80]. The subtropical high-pressure system was found to play a crucial role in the formation and accumulation of O3 and secondary aerosols [81,82]. Therefore, under these three patterns of synoptic systems, air pollutants are more likely to accumulate and less likely to disperse, increasing the likelihood of the occurrence of high-O3-and-PM2.5 days.

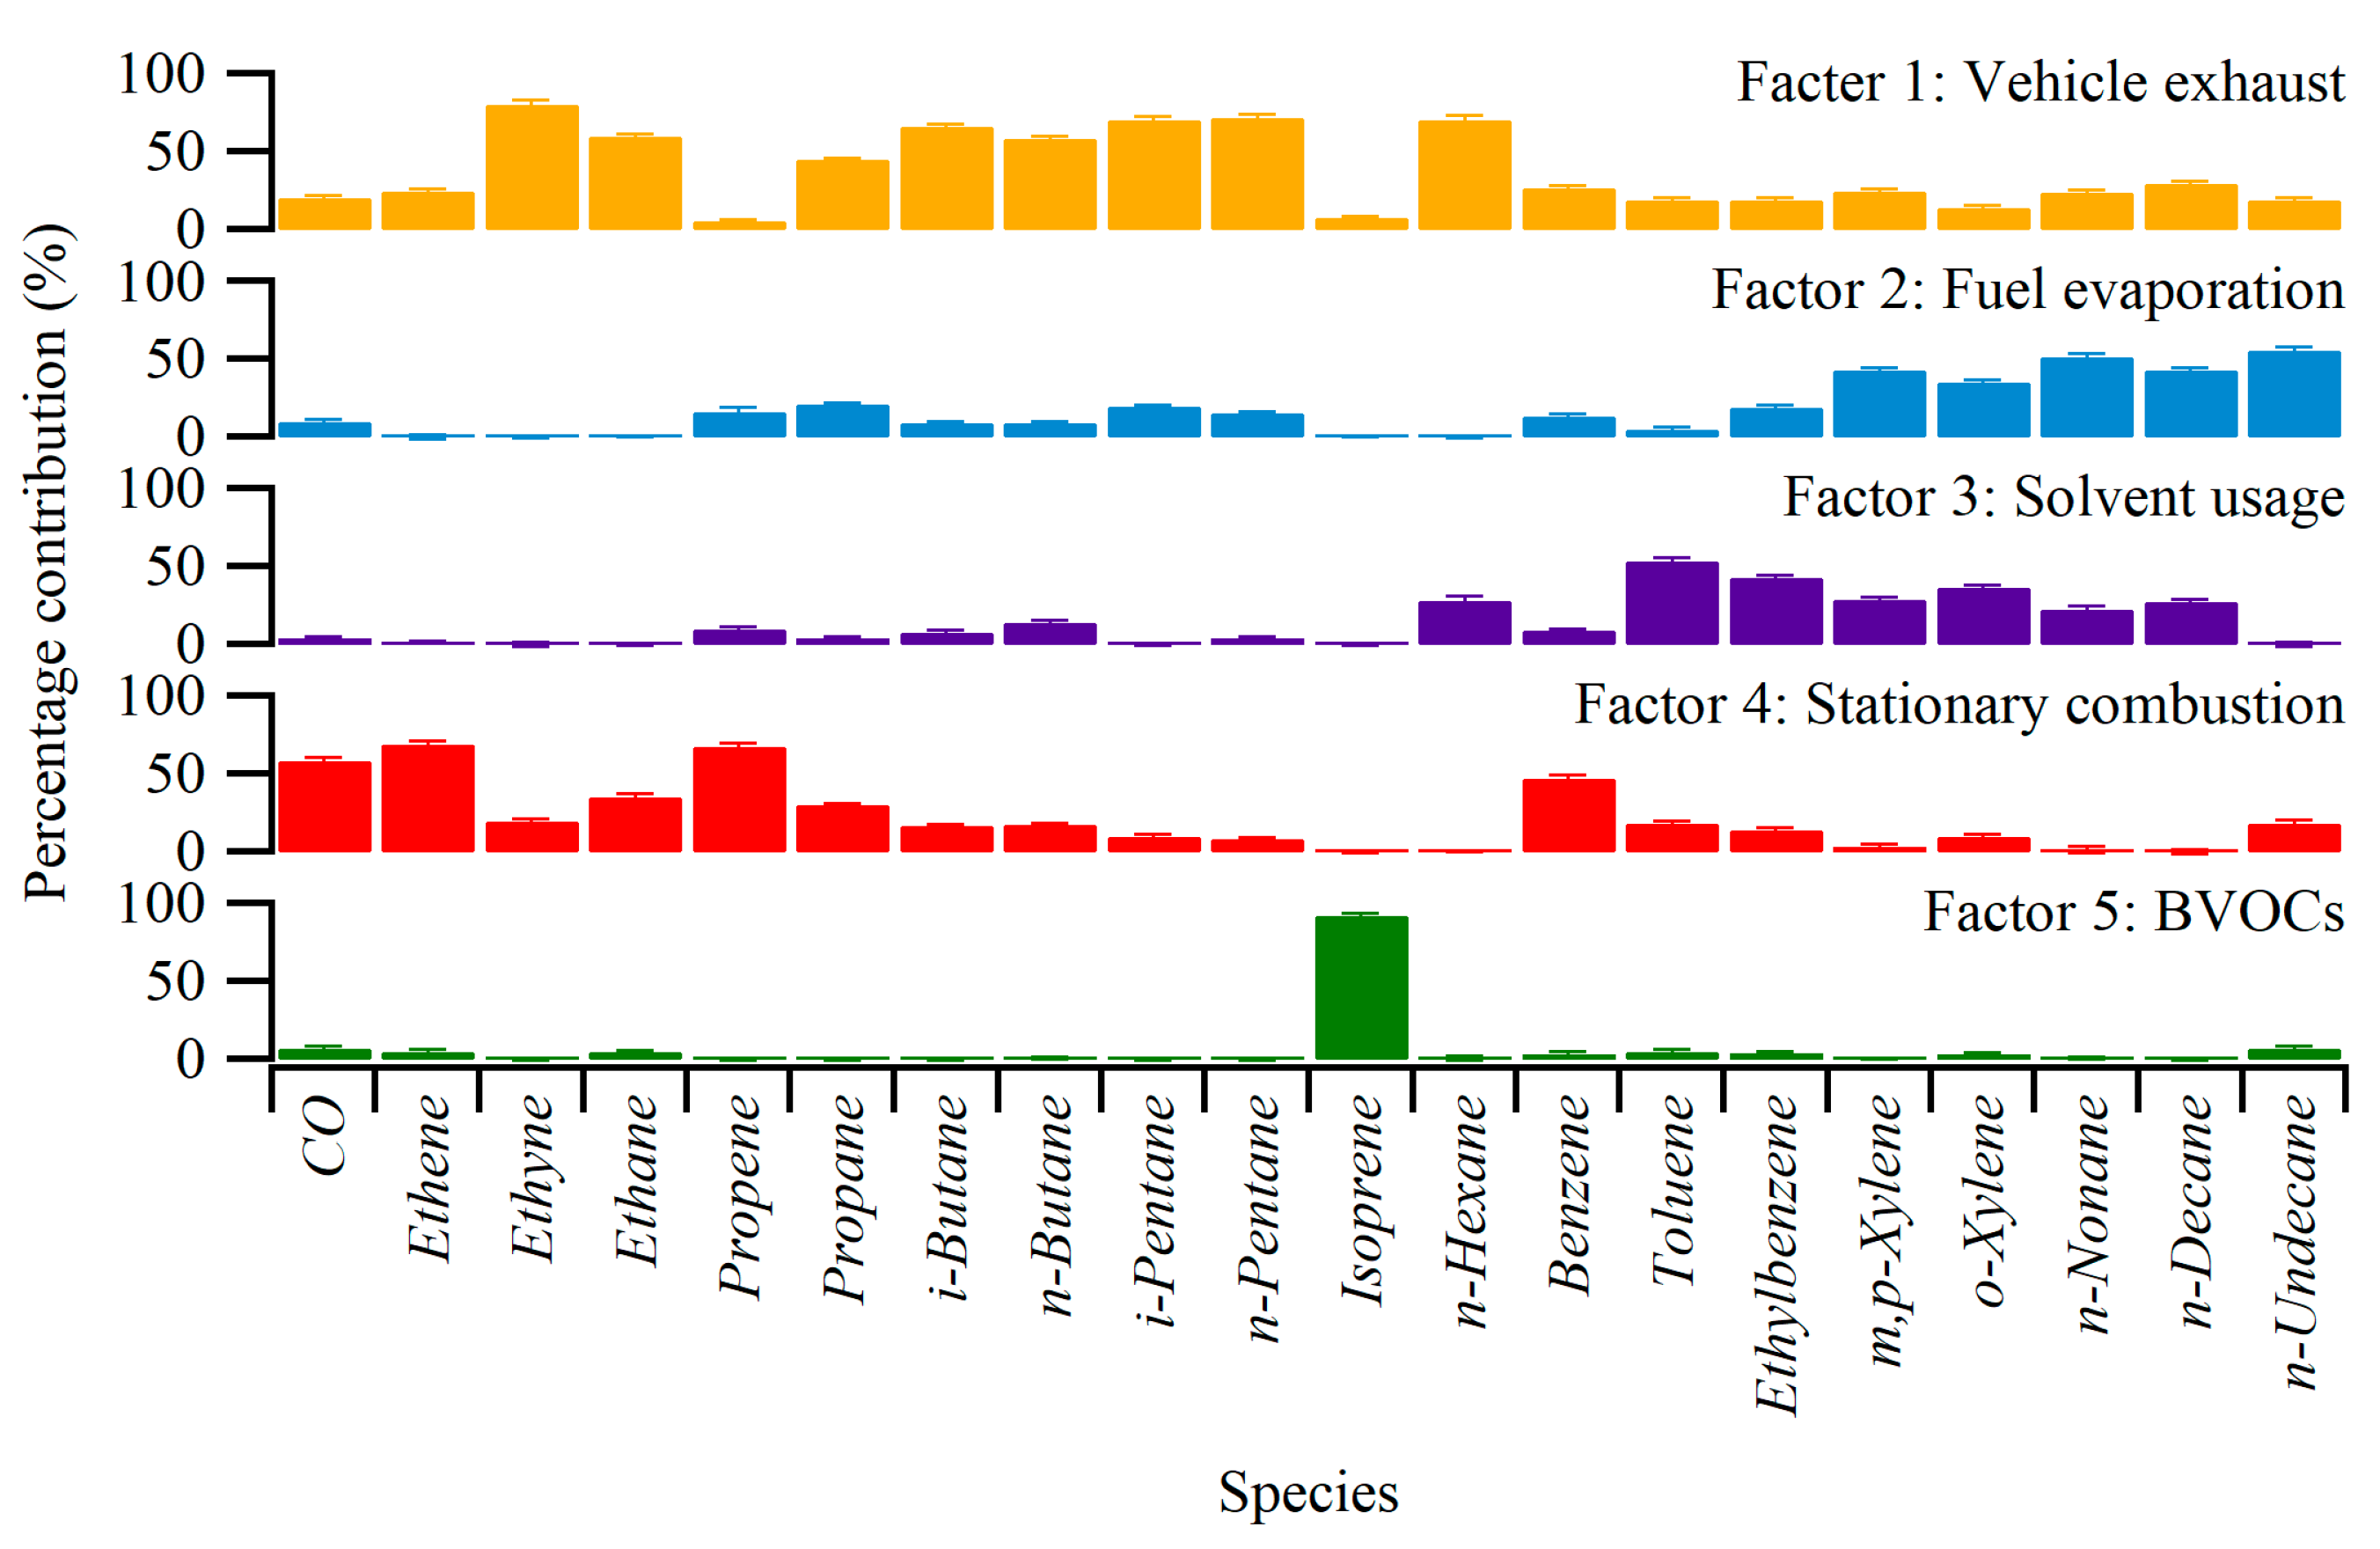
3.3. Contributions of VOC Sources

A total of 19 VOC species, along with one trace gas, were applied to PMF for source apportionment. A five-factor resolution was identified to best describe the source of ambient VOCs (Figure 6). Factor 1 was characterized by considerable percentages of C2–C4 hydrocarbons, n/i-pentanes, and n-hexane, indicating its association with vehicle exhaust [36,83,84]. Factor 2 was characterized by the dominance of aromatic hydrocarbons, as well as C3–C5 and C8–C11 hydrocarbons, which are consistent with the composition of gasoline and diesel evaporation [85,86]. Thus, this factor was identified as fuel evaporation. Factor 3 exhibited high percentages of n-hexane, n-nonane, n-decane, and TEX (toluene, ethylbenzene, and xylenes), while the proportions of other species were relatively low, which defined as solvent usage [36,87]. Factor 4 had high loadings of C2–C3 hydrocarbon and CO, which are associated with natural gas and biomass combustion [85,88]. This factor is therefore classified as stationary combustion. Factor 5 was classified as biogenic VOCs (BVOCs) due to its exclusive dominance by isoprene, the indicator of biogenic emissions [33,89].
Table 2 lists the contributions of anthropogenic sources to VOCs, as well as O3 and SOA formations on high-O3-and-PM2.5 days. Notably, vehicle emissions, including vehicle exhaust and fuel evaporation, were the dominant sources of VOCs during high-O3-and-PM2.5 days in Shenzhen, accounting for a total contribution of 58.4 ± 1.3%. Compared to other cities in China, the contribution of vehicular emissions was higher than that found at an urban site in Chongqing (45.1%) [90], while it was comparable to that in Beijing (57.7%) [91]. The contribution of solvent usage to VOCs in this study (20.2 ± 1.3%) was higher than in Wuhan (16.2%) [88] but much lower than that in Hong Kong (54.1%) [92]. However, the contribution of stationary combustion (21.4 ± 1.3%) was lower in Shenzhen than in Wuhan (31.5%) [33]. It is worth noting that the results of source identification and contributions strongly depend on the species and profiles used for source apportionment, the study period, and the sampling site.
This study examined the impact of VOCs on the formation of O3 and SOA. Vehicle emissions (the combination of vehicle exhaust and fuel evaporation) made the largest contributions to both O3 formation (45.3 ± 0.6%) and SOA formation (46.6 ± 0.4%). Solvent usage was found to make a higher contribution (p < 0.05) to O3 formation (24.8 ± 0.5%) and SOA formation (41.7 ± 0.3%) compared to its contribution to VOCs (20.2 ± 1.3%). However, stationary combustion made a greater contribution to O3 formation (30.0 ± 0.8%) but a lower contribution to SOA formation (11.7 ± 0.1%) compared to its contribution to VOCs (21.4 ± 1.3%). The discrepancies among source contributions to VOCs and O3 and PM2.5 formations underscored the importance of emphasizing the chemical reactivities of VOC species. The outcomes imply that VOCs from vehicle emissions were the main cause of the generation of O3 and SOA on high-O3-and-PM2.5 days. The study by Peng et al. [93] reported that vehicle emissions made the largest contribution (31.1%) to PM2.5 in Shenzhen in 2021. This underscores the significance of controlling vehicle emissions.

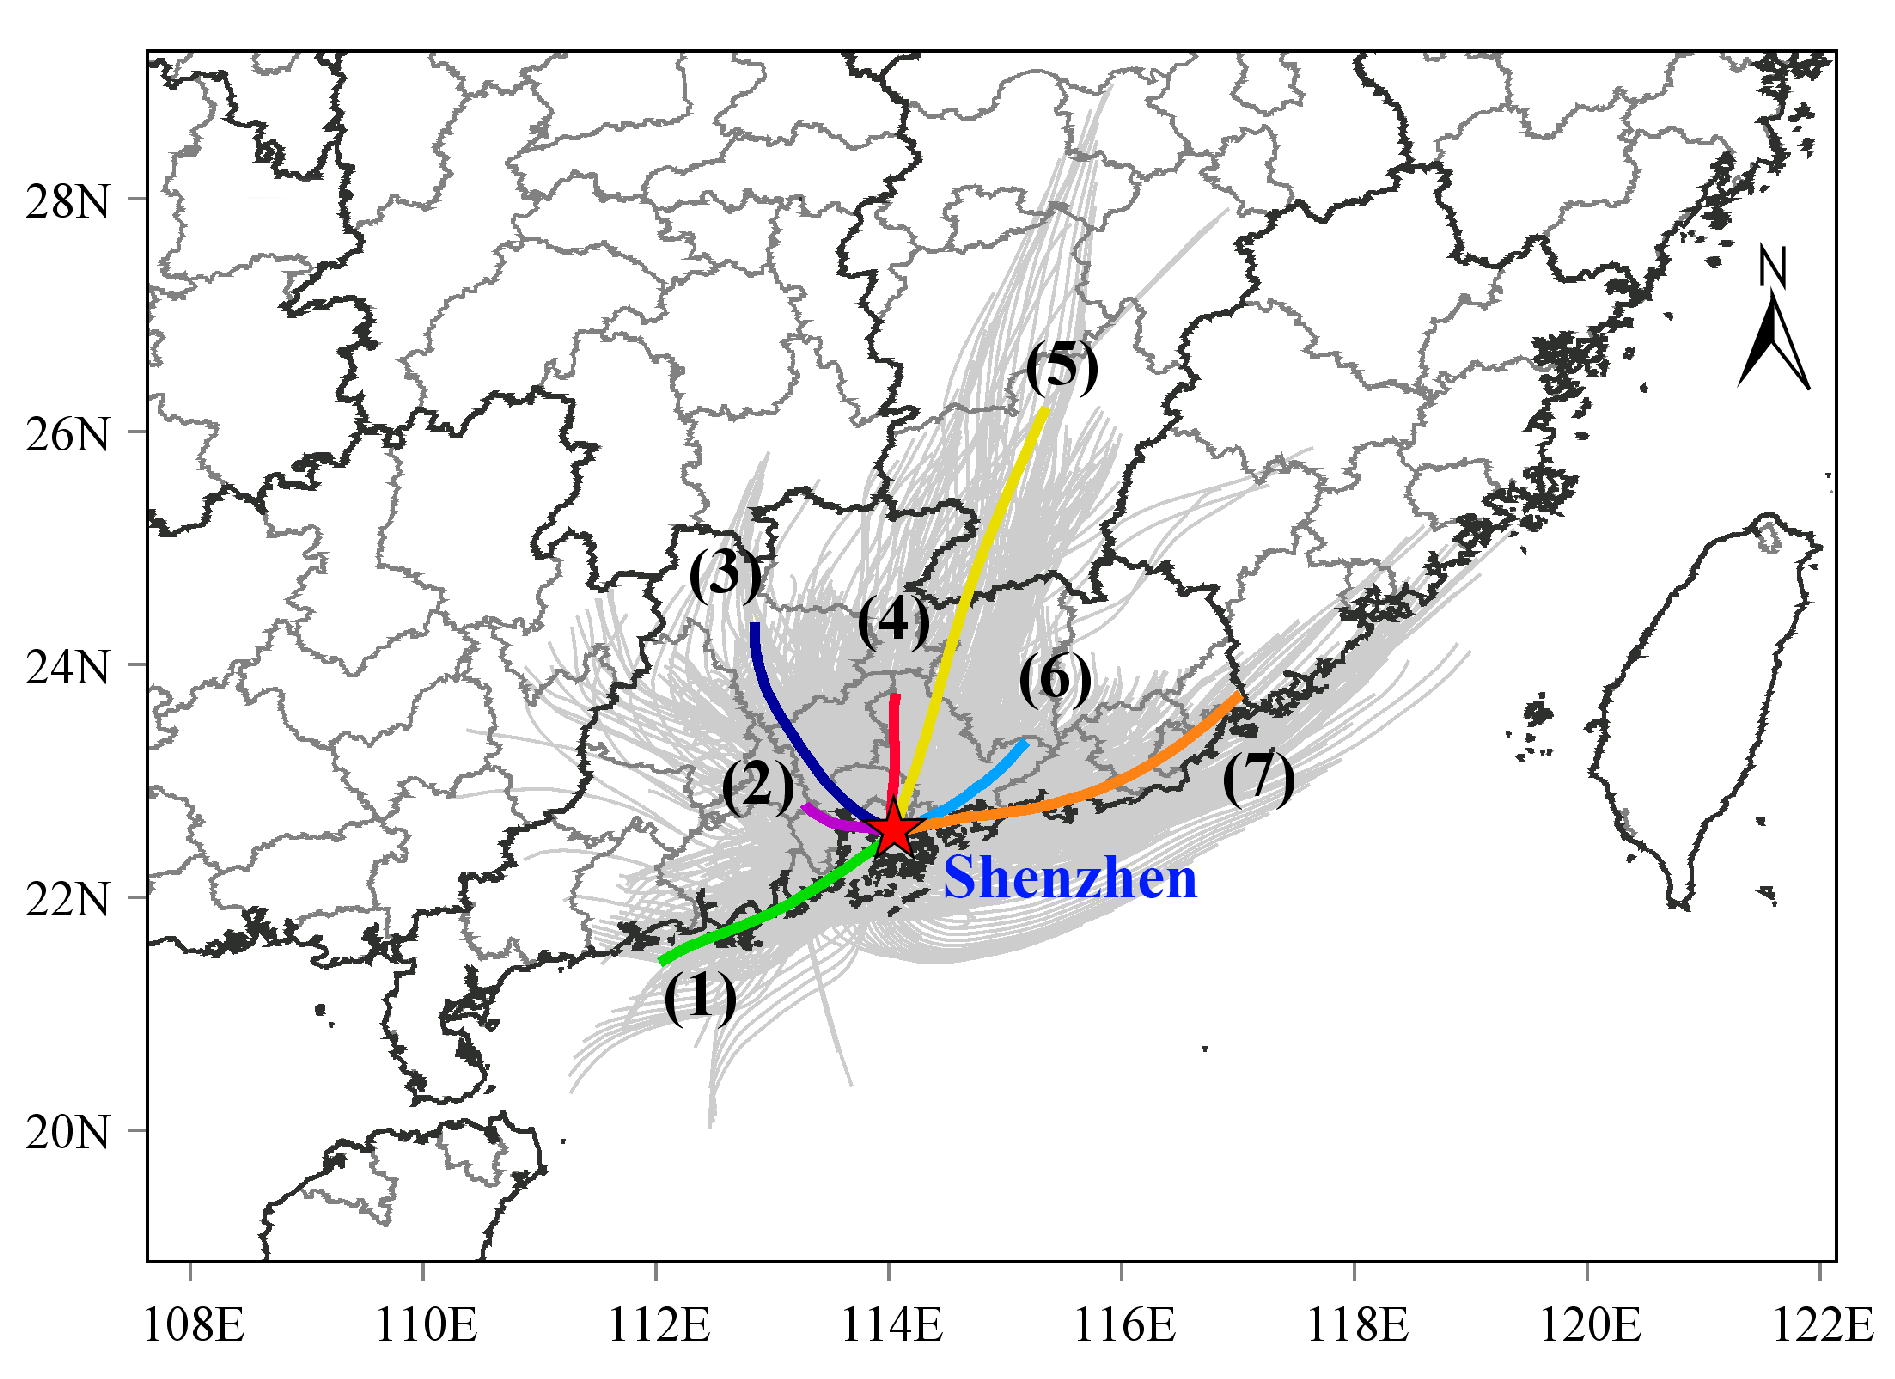
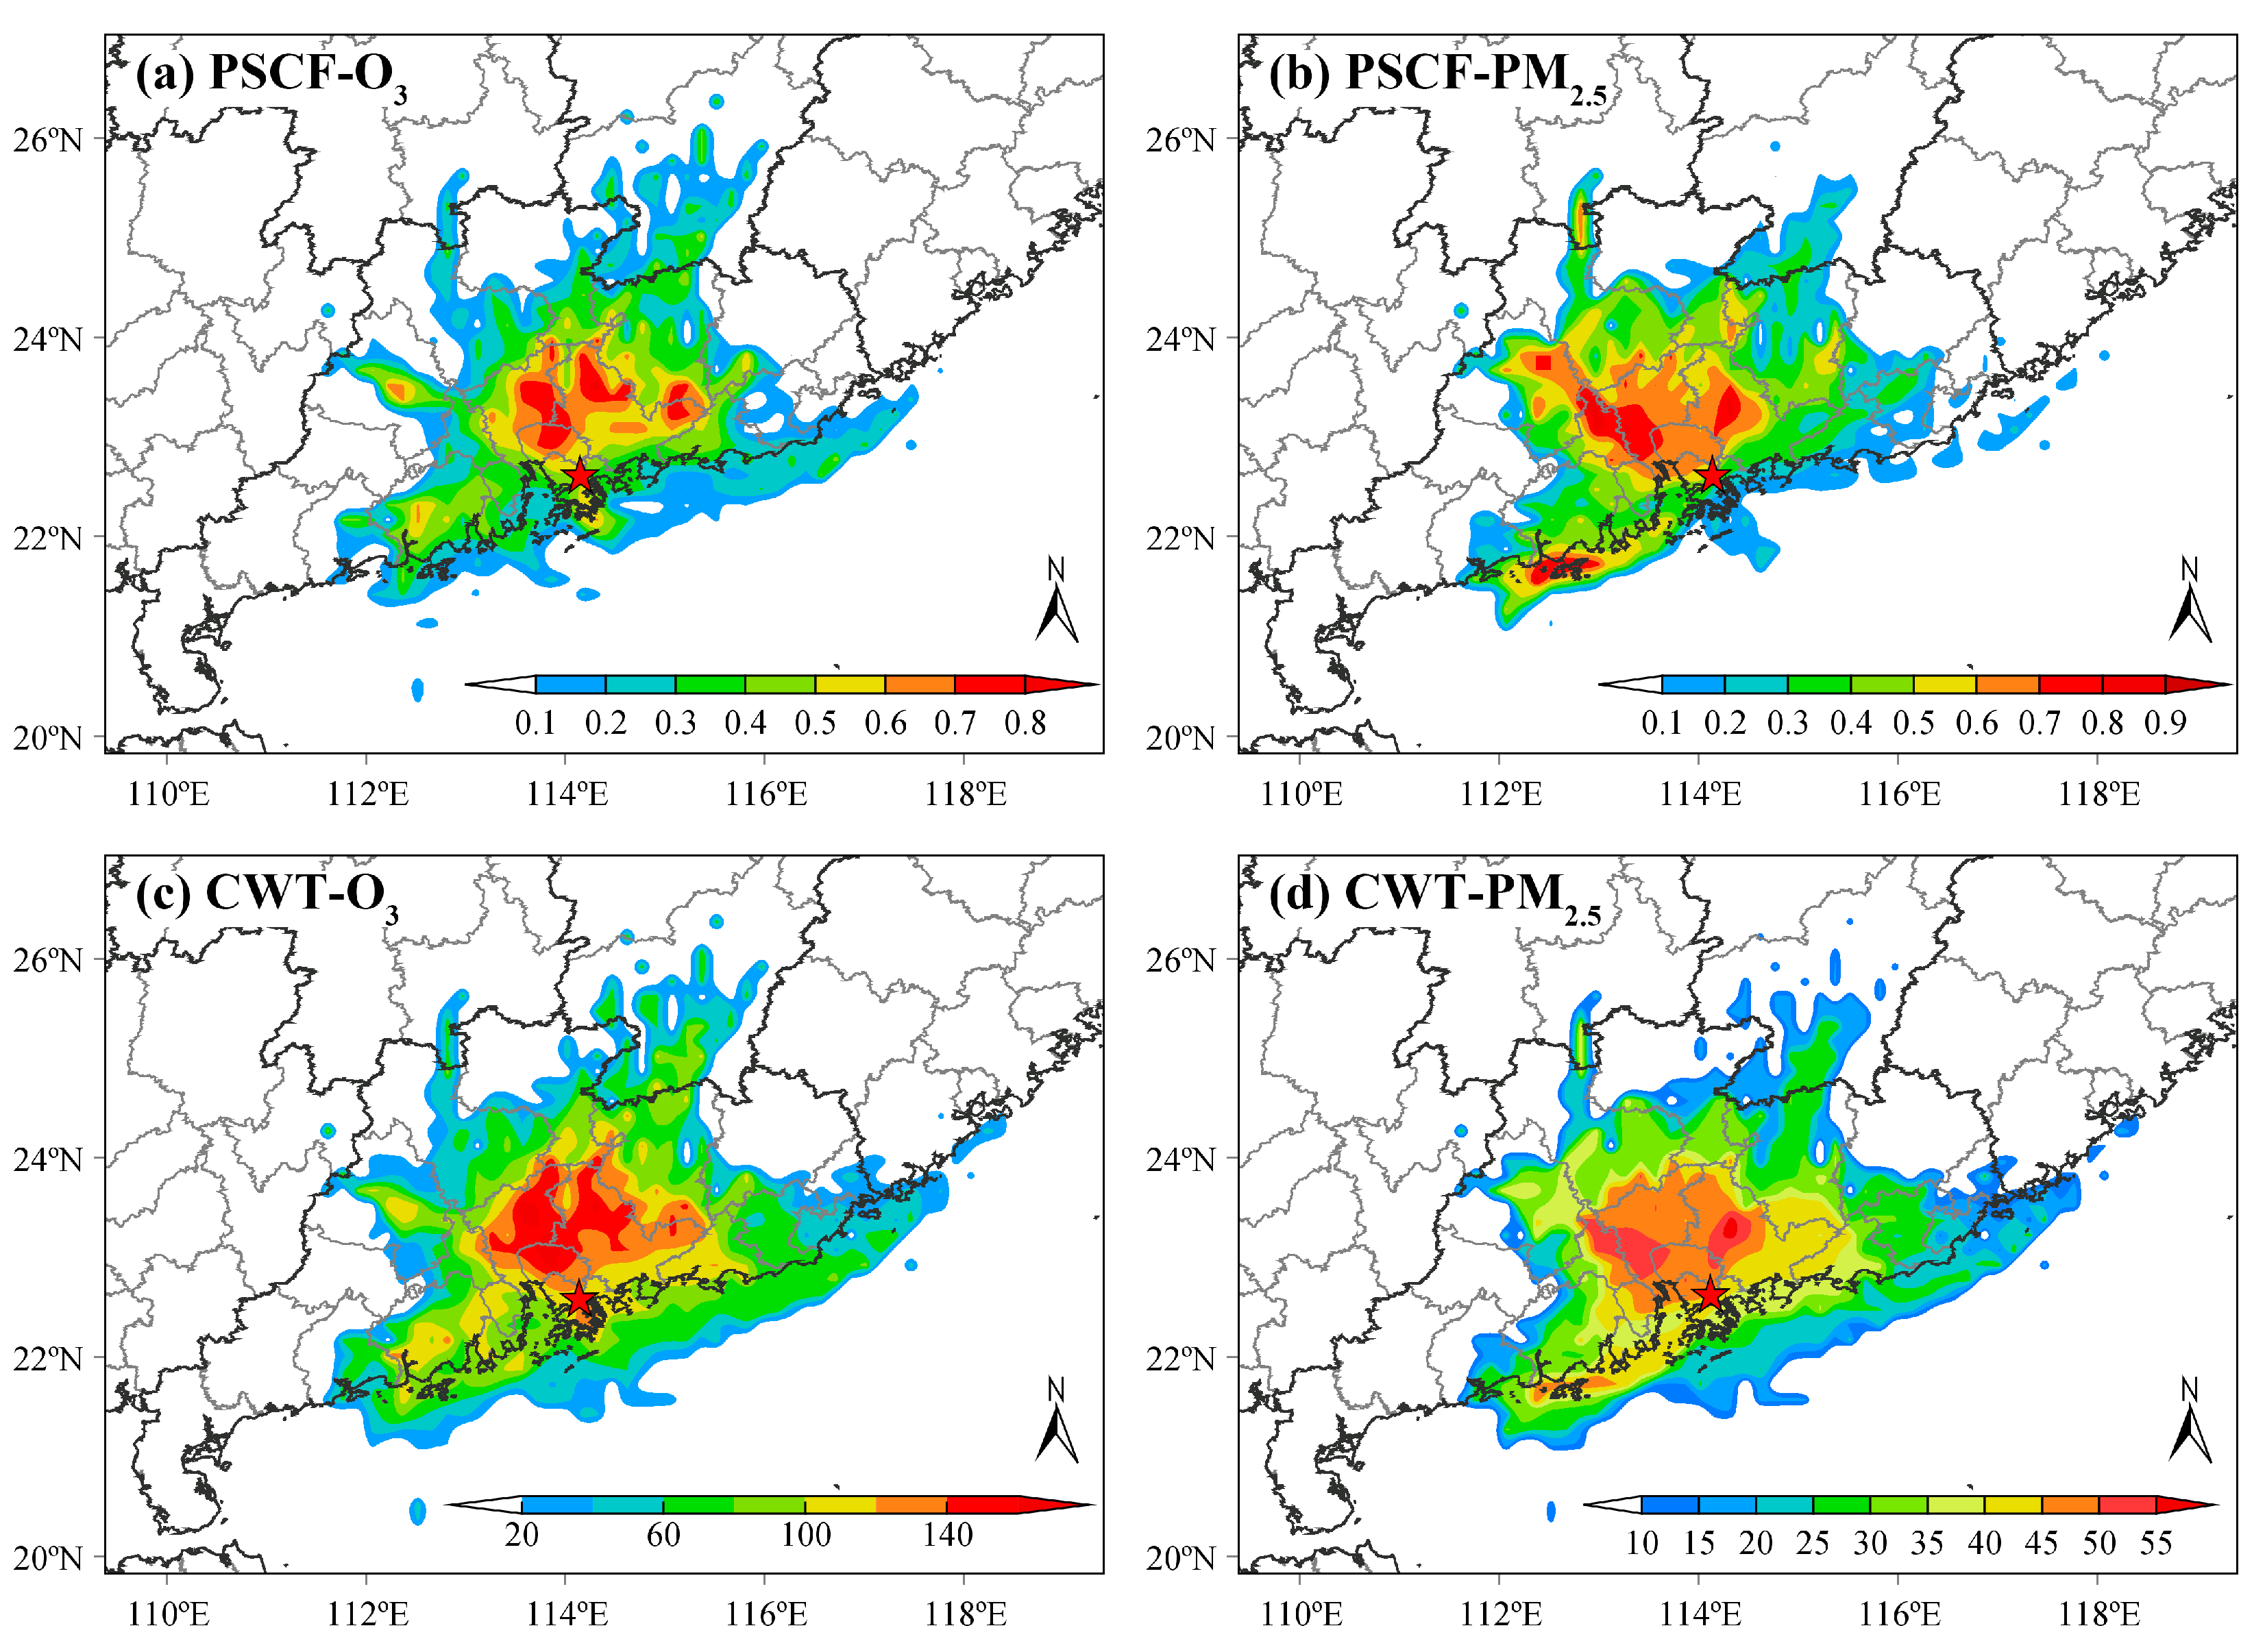
3.4. Potential Source Regions of O3 and PM2.5

Figure 7 depicts the 24 h backward trajectories on 58 high-O3-and-PM2.5 days in Shenzhen from 2016 to 2022. The trajectories were classified into seven clusters based on their directions and traveled regions. The proportions of trajectories for each cluster, the traveled regions, and the corresponding mean O3 and PM2.5 concentrations are presented in Table S7. Over 64.8% of the trajectories originated from inland regions, which could bring polluted air masses to Shenzhen. About 41.5% of the trajectories originated from Guangdong Province, where Shenzhen is located, and showed small-scale and short-distance air transport features, indicating the impact of nearby cities on Shenzhen’s air quality. The O3 levels for clusters 4 (147.4 ± 11.3 μg m−3) and 5 (133.8 ± 10.2 μg m−3) were much higher than the other clusters (p < 0.01). These clusters passed through Guangdong Province and Jiangxi Province. Regarding PM2.5, the values corresponding to clusters 3 and 4 were higher than the others (p < 0.01), with average concentrations of 51.1 ± 1.8 μg m–3 and 48.8 ± 2.1 μg m−3, respectively. Most trajectories in clusters 3 and 4 originated from Guangdong Province.
Figure 8 shows the potential source regions of O3 and PM2.5 calculated via the PSCF and CWT models. The areas with elevated PSCF (PSCF > 0.6) and CWT values (CWT > 140 μg m−3 for O3 and >45 μg m−3 for PM2.5) were all situated in cities within Guangdong Province. The cities of Dongguan, Huizhou, and Guangzhou were identified as potential source areas of O3 via PSCF and CWT models. For PM2.5, the potential source areas were identified as Dongguan, Huizhou, Guangzhou, Foshan, and Jiangmen. The potential source areas of O3 and PM2.5 suggest the importance of coordinated prevention and control of air pollution in Guangdong Province to mitigate O3 and PM2.5. Collaborating on air pollution control with Guangzhou, Dongguan, and Huizhou could effectively reduce O3 and PM2.5 levels in Shenzhen simultaneously.

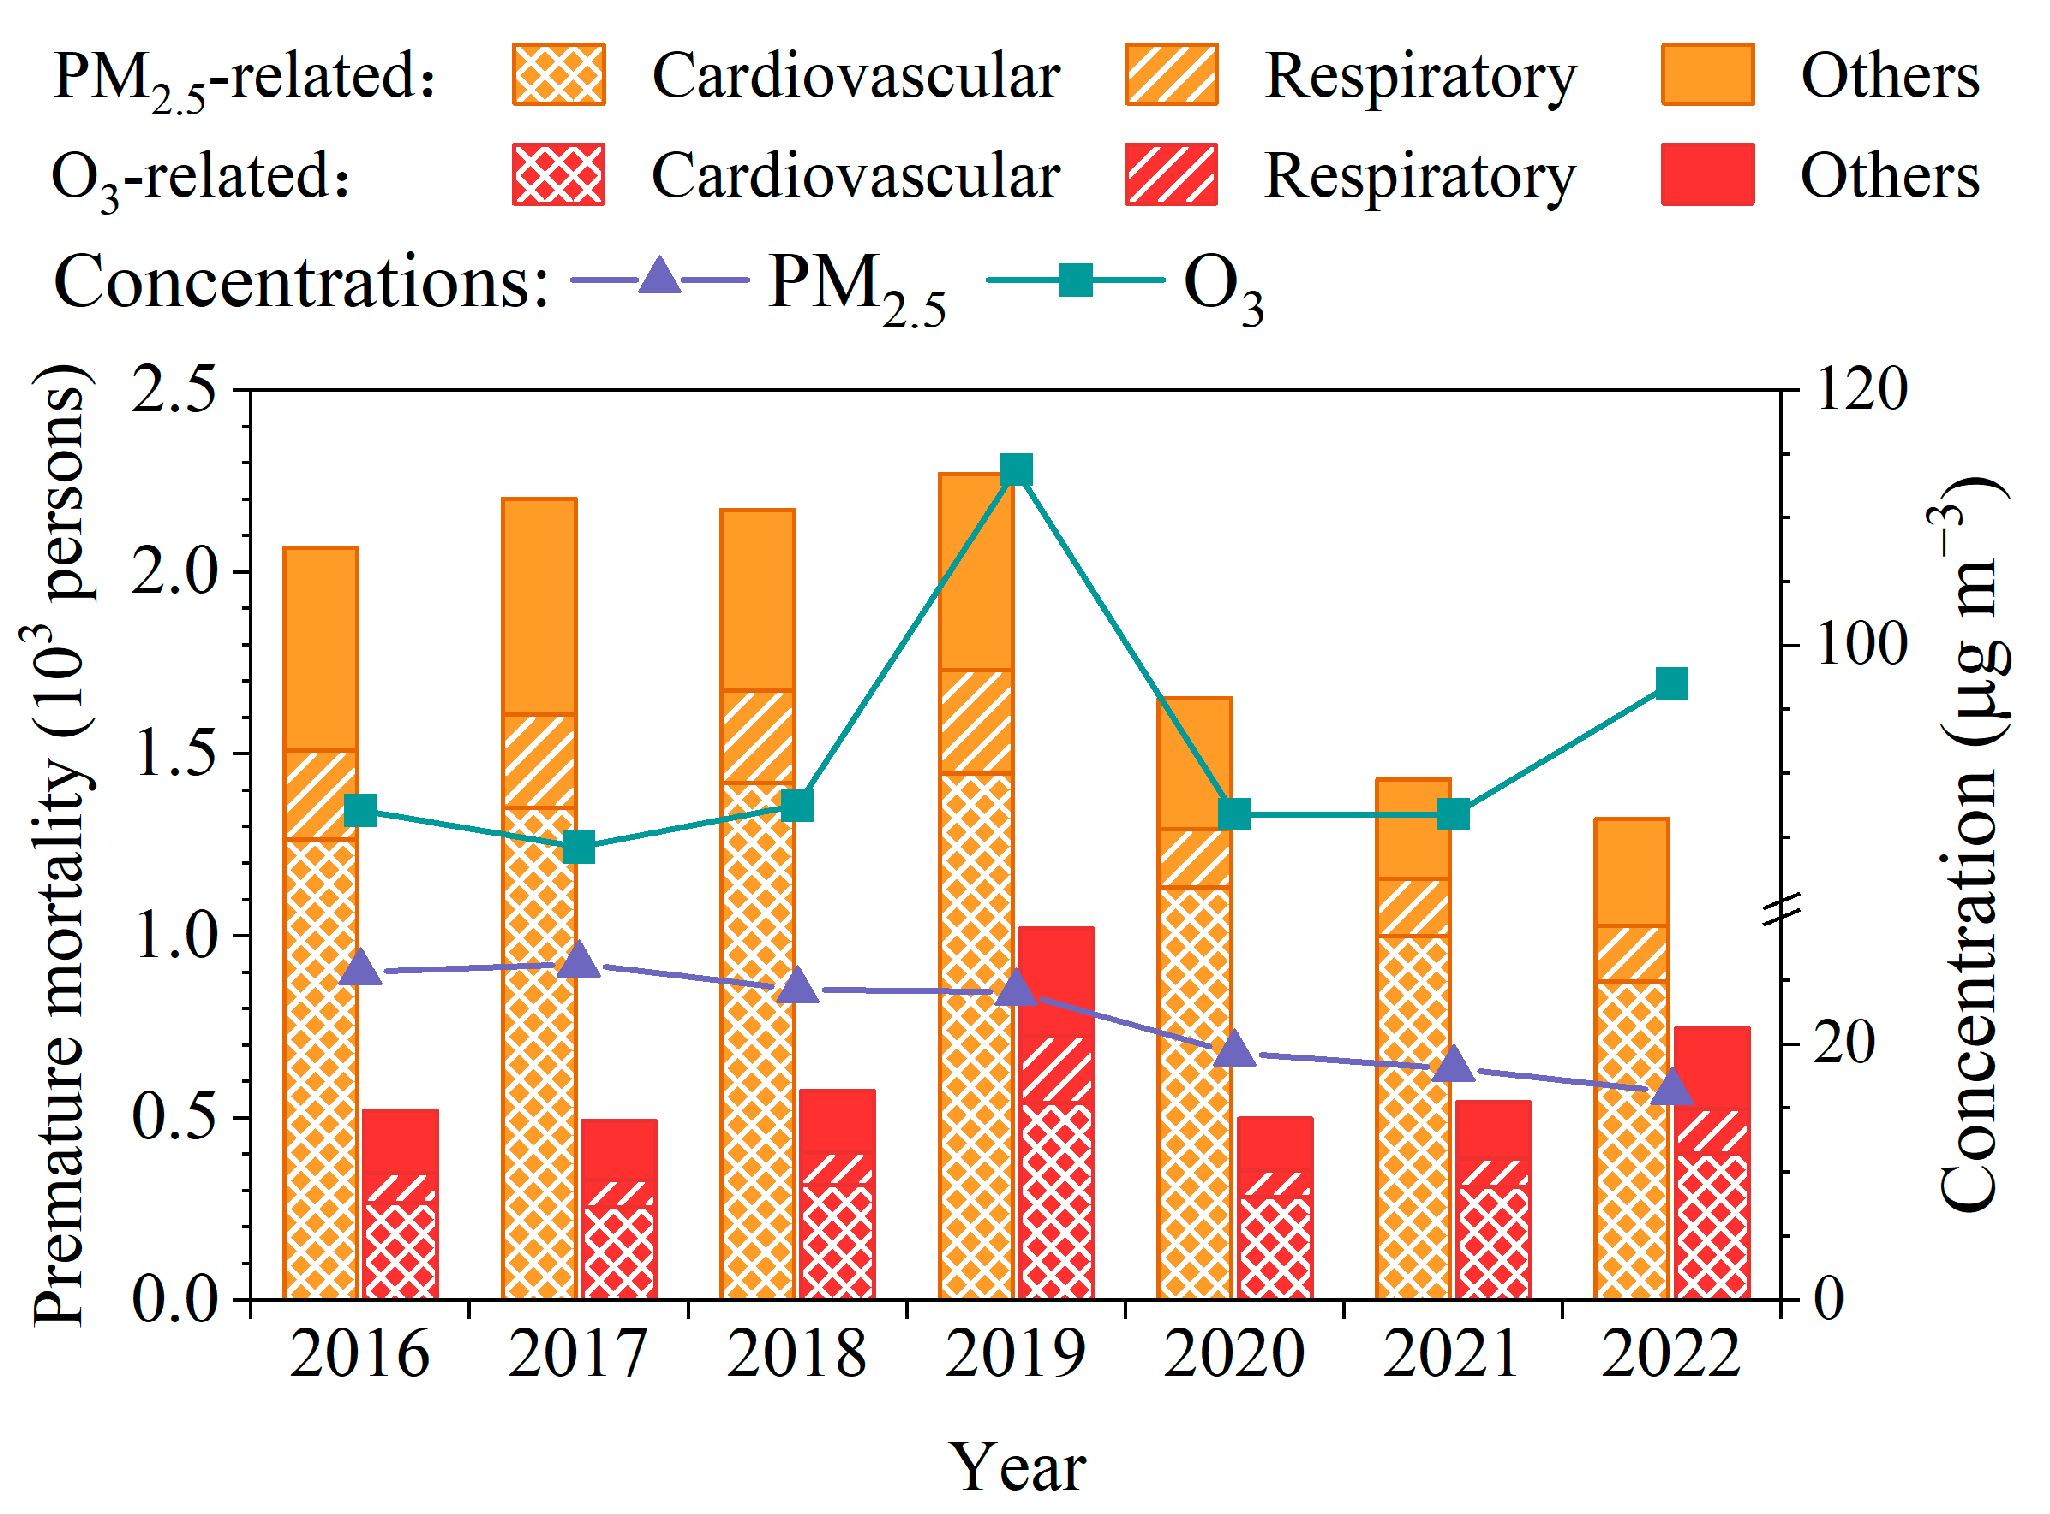
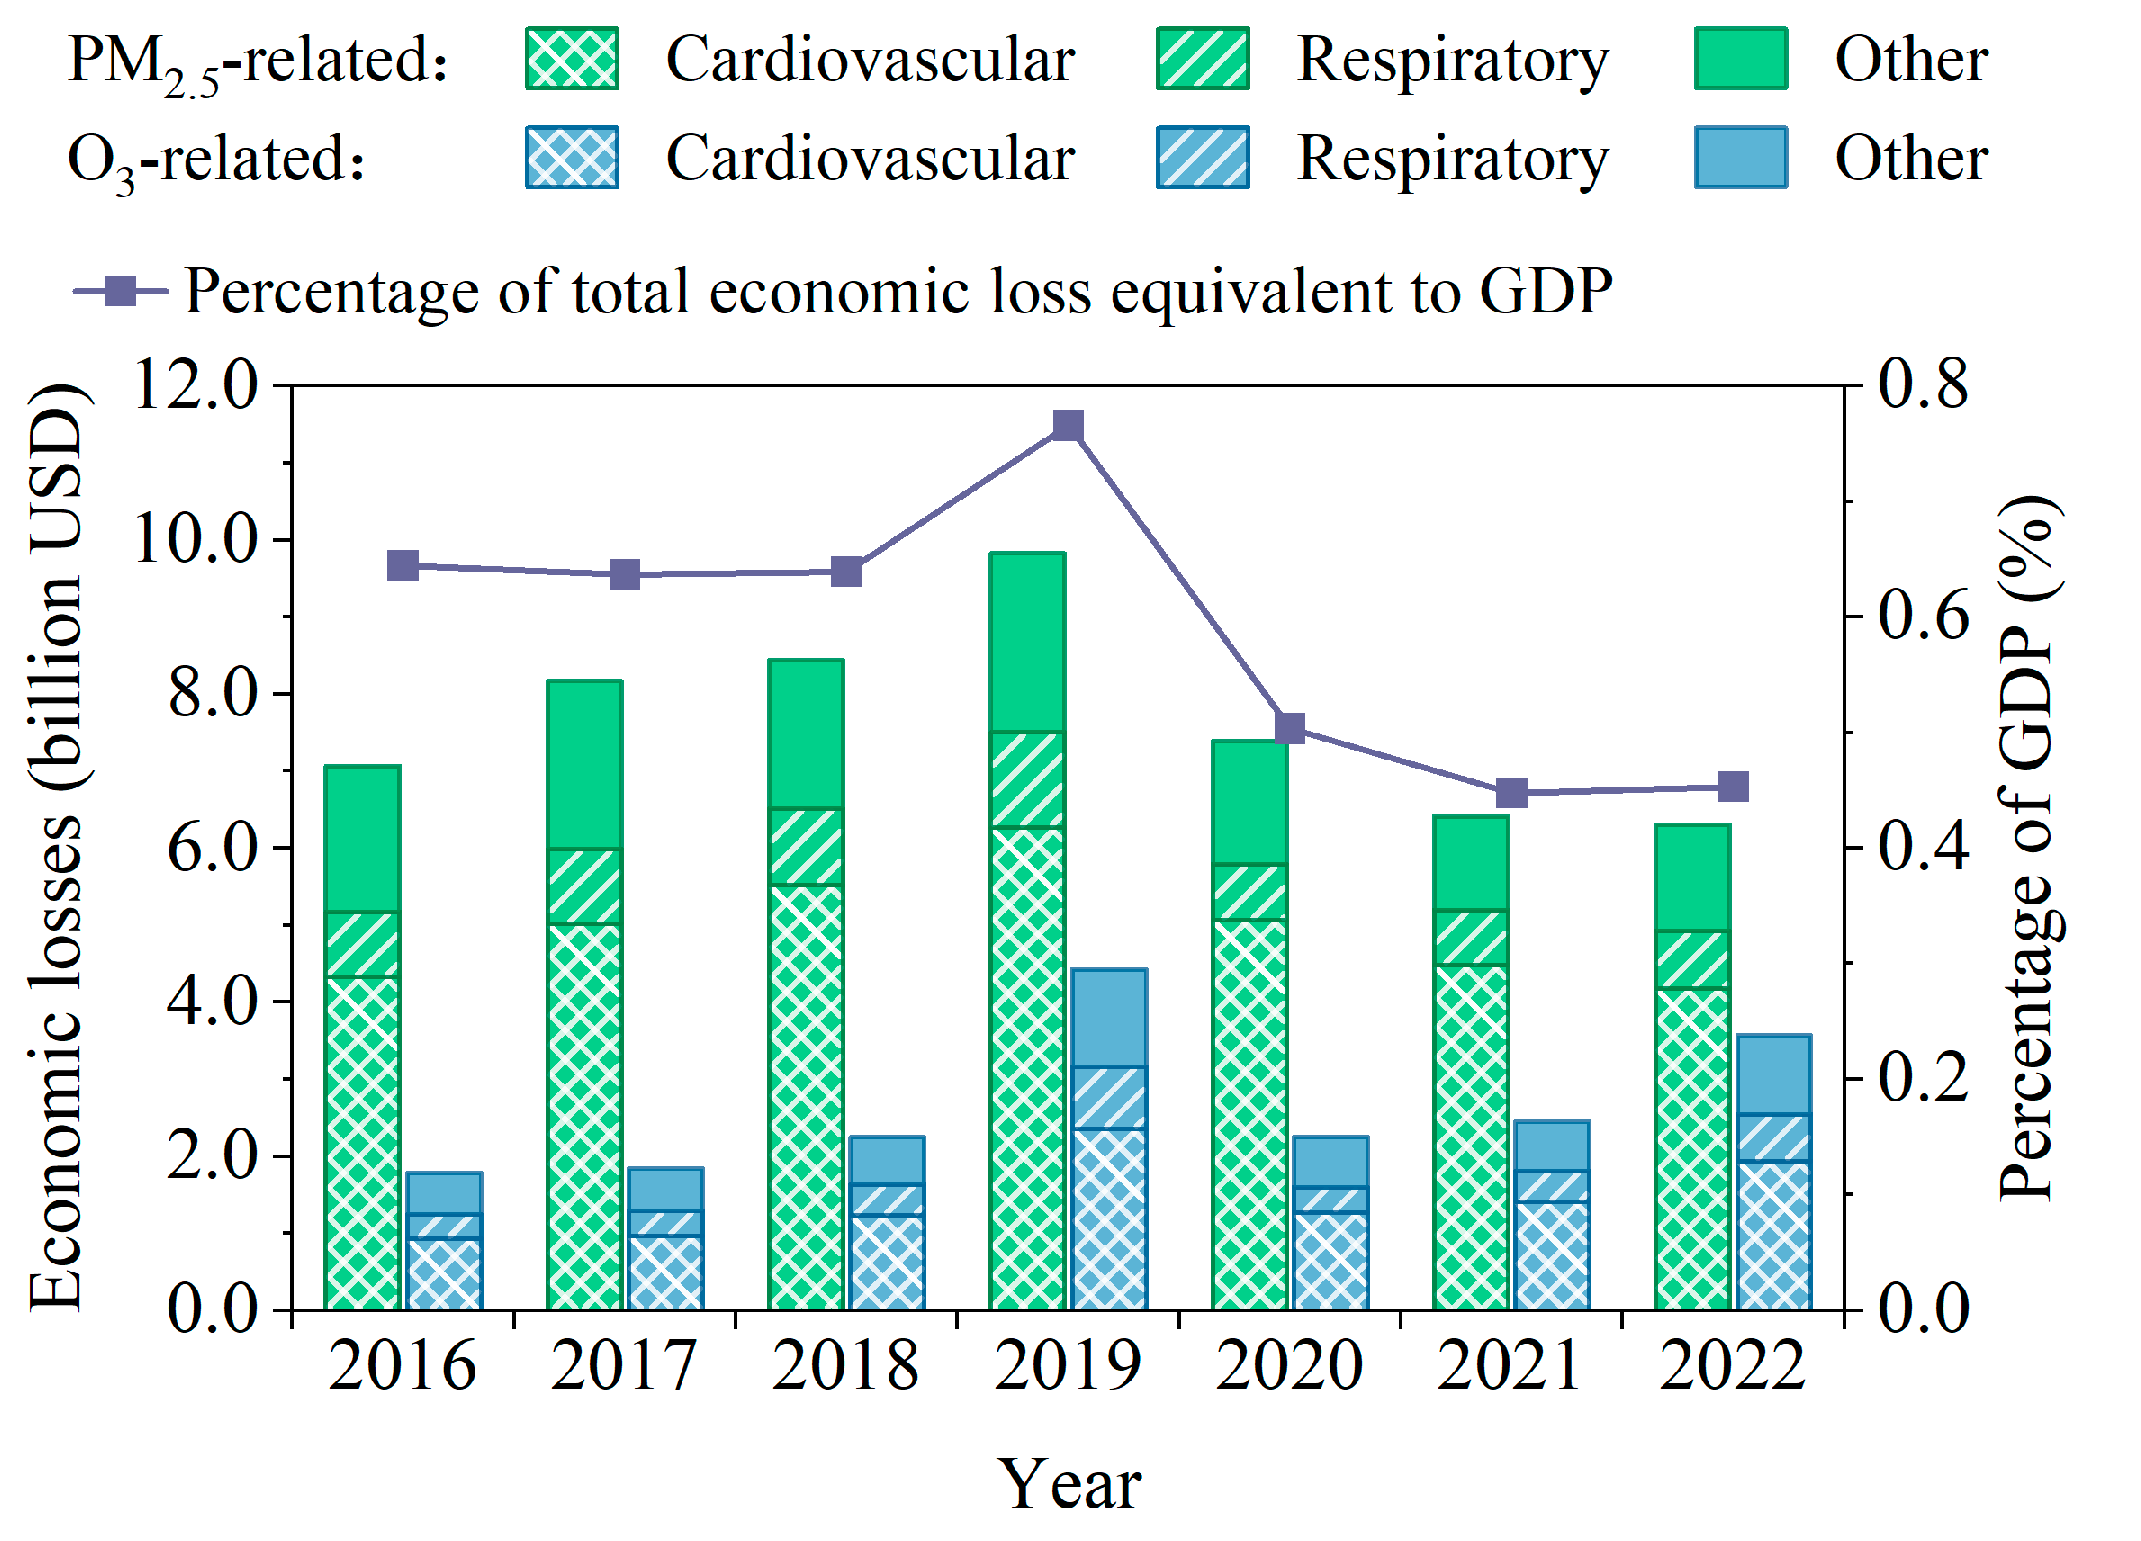
3.5. Health Risk Assessment

Figure 9 shows the premature mortality associated with long-term exposure to O3 and PM2.5 during 2016 and 2022. Among all-cause premature deaths, cardiovascular diseases made the largest contribution, accounting for 51.2%~70.3% of premature deaths between 2016 and 2022. The number of premature deaths due to long-term exposure to PM2.5 was higher than that related to O3 each year, indicating the greater health risk of exposure to PM2.5. This is consistent with the results of an O3- and PM2.5-related health burden study by Zhang et al. [94], which reported 26.1 and 10.3 thousand premature deaths related to long-term PM2.5 and O3 exposure in Guangdong Province in 2020, respectively. From 2016 to 2022, the number of premature deaths attributed to long-term PM2.5 exposure decreased by 36.1%, from 2068 (95% CI: 1600, 2292) in 2016 to 1322 (1013, 1529) in 2022. During the same period, premature deaths due to long-term O3 exposure increased from 521 (338, 699) in 2016 to 747 (486, 1001) in 2022, representing an increase of 43.4%. Notably, the number of premature deaths due to PM2.5 exposure reached its highest value in 2019. The highest level of O3 in 2019 was the primary factor contributing to the highest number of premature deaths related to O3 exposure in that year. The high premature mortality in 2019 can be attributed to a slight decrease in PM2.5 levels and a significant increase in population from 2016 to 2019. The average concentration of PM2.5 decreased by 1.6 µg m−3 in 2019 compared to 2016, while the population increased by about 2.09 million during this period. An increase in the population exposed to PM2.5 leads to an elevation in premature mortality. Despite the increase in O3-related premature deaths, the total number of premature deaths due to O3 and PM2.5 exposure showed a downward trend, decreasing from 2589 (1937, 2991) in 2016 to 2068 (1498, 2530) in 2022. This outcome indicates the improvement in air quality and reduction in health impacts in Shenzhen. Given that premature deaths related to long-term O3 and PM2.5 exposure remain at high levels in Shenzhen, it is imperative to implement more effective O3 and PM2.5 control strategies in the future.
The economic losses caused by long-term exposure to O3 and PM2.5 were calculated and are presented in Figure 10. The economic losses due to long-term PM2.5 exposure increased from 2016 to 2019 but decreased from 2020 to 2022. However, the economic losses related to long-term O3 exposure showed an upward trend from 2016 to 2022. The total economic losses due to long-term O3 and PM2.5 exposure increased from USD 13.3 (10.0, 15.4) billion in 2016 to USD 14.7 (10.7, 18.0) billion in 2022. The total economic loss in 2019 was estimated to be as high as USD 20.7 (15.3, 24.6) billion, representing an increase of 55.1% compared to 2016. Health economic loss is closely related to the VSL, which increases year by year with economic and social development. The increasing total economic losses may be attributed to the increase in VSL values under the circumstances that premature deaths due to long-term O3 and PM2.5 exposure decreased from 2016 to 2022. The share of total economic losses in the city’s GDP has shown a decreasing trend, with the percentage decreasing from 0.64% in 2016 to 0.45% in 2022.

4. Conclusions

In this study, the long-term trends of O3, PM2.5, OX, and their precursors (VOCs, NO2, and SO2), the characteristics of concurrent O3 and PM2.5 pollution, and the health risks of long-term exposure to O3 and PM2.5 were analyzed in Shenzhen. It was found that PM2.5, OX, VOCs, NO2, and SO2 levels decreased significantly from 2016 to 2022, indicating the effectiveness of air pollution control strategies in Shenzhen. Notably, the COVID-19 pandemic between 2019 and 2022 reduced anthropogenic activities and had a non-negligible impact on decreasing concentrations of PM2.5, NO2, VOCs, and SO2. The rising levels of ambient O3 demonstrate the challenge of reducing photochemical pollution. The positive correlation between O3 and PM2.5 provides a good foundation for mitigating them simultaneously. The negative synoptic systems, including the typhoon periphery, uniform pressure system, and subtropical high-pressure system, as well as the low wind speed, were favorable for the occurrence of high-O3-and-PM2.5 days. The concentrations of MDA8 O3, PM2.5, OX, NO2, and SO2 were much higher on high-O3-and-PM2.5 days than during high-O3 days (p < 0.01). However, there was no significant difference in VOC levels (p > 0.05) between these two scenarios.
During high-O3-and-PM2.5 days, five VOC sources were identified, including vehicle exhaust, fuel evaporation, solvent usage, stationary combustion, and biogenic volatile organic compounds (BVOCs). Vehicle emissions (i.e., vehicle exhaust and fuel evaporation) were found to make the largest contribution to VOCs and the formations of O3 and SOA. The investigation into potential source regions indicated that implementing joint prevention and control strategies among Shenzhen and other nearby cities would be beneficial for simultaneously mitigating O3 and PM2.5. From 2016 to 2022, the premature mortality associated with long-term exposure to air pollution reduced significantly in Shenzhen. Nevertheless, the rise in O3-related premature mortality and the high level of PM2.5-related premature mortality underscore the importance of further air pollution control measures in Shenzhen. The outcomes of this study are expected to improve our understanding of O3 and PM2.5 pollution in South China, specifically identifying days with concurrent high O3 and PM2.5 levels. This information will be valuable for air pollution control in other coastal regions with subtropical monsoon climates.

Supplementary Materials

The following supporting information can be downloaded at: https://www.mdpi.com/article/10.3390/atmos14121806/s1, Figure S1: Trends of daily average concentrations of NO2, SO2, and OX in Shenzhen from 2016 to 2022; Figure S2: Trends of daily average TVOCs concentrations at the LH site during 2019 and 2022; Figure S3: Trends of monthly average NO2, SO2, and OX concentrations in different seasons in Shenzhen from 2016 to 2022. The error bar represents the 95% CI of the monthly averages; Figure S4: Trends of monthly average TVOCs concentrations in different seasons at the LH site from 2019 to 2022. The error bar represents the 95% CI of the monthly averages; Figure S5. Frequency of high-O3-and-PM2.5 days at 13 BAQM sites from 2016 to 2022; Table S1: Details of air quality monitoring sites; Table S2: Exposure-response coefficients for the long-term mortality effects of PM2.5 and O3; Table S3: Statistical descriptions of meteorological parameters in different seasons; Table S4: Statistical descriptions of air pollutants under different scenarios; Table S5: Statistical descriptions of meteorological parameters under different scenarios; Table S6: Statistics of synoptic systems during high-O3-and-PM2.5 days from 2017 to 2022; Table S7: Statistics on the ratio of trajectories, pathway areas, and the corresponding PM2.5 and O3 concentrations for each Cluster.

Author Contributions

Conceptualization, P.Z.; Data curation, P.Z., X.H., Z.Q., L.Y., C.L. and L.Z.; Formal analysis, P.Z. and X.H.; Funding acquisition, M.Y. and Z.Z.; Methodology, P.Z.; Software, P.Z.; Supervision, M.Y.; Writing—original draft, P.Z.; Writing—review and editing, P.Z. and Z.Z. All authors have read and agreed to the published version of the manuscript.

Funding

This research was funded by the Shenzhen Science and Technology Innovation Committee, grant number KCXFZ202002011008038; the Shenzhen Municipal Bureau of Ecology and Environment, grant number 202100101034.

Institutional Review Board Statement

Not applicable.

Informed Consent Statement

Not applicable.

Data Availability Statement

Publicly available datasets were analyzed in this study. The synoptic system data can be found here https://data.cma.cn/ (accessed on 5 December 2023). The meteorological data used for the TrajStat model can be found here https://www.ready.noaa.gov/archives.php (accessed on 5 December 2023). The boundary layer height data can be found here https://cds.climate.copernicus.eu/ (accessed on 5 December 2023).

Conflicts of Interest

The funders had no role in the design of the study; in the collection, analyses, or interpretation of data; in the writing of the manuscript; or in the decision to publish the results.

References

  1. Wang, W.; Parrish, D.D.; Wang, S.; Bao, F.; Ni, R.; Li, X.; Yang, S.; Wang, H.; Cheng, Y.; Su, H. Long-Term Trend of Ozone Pollution in China during 2014-2020: Distinct Seasonal and Spatial Characteristics and Ozone Sensitivity. Atmos. Chem. Phys. 2022, 22, 8935–8949. [Google Scholar] [CrossRef]
  2. Lu, X.; Zhang, L.; Wang, X.; Gao, M.; Li, K.; Zhang, Y.; Yue, X.; Zhang, Y. Rapid Increases in Warm-Season Surface Ozone and Resulting Health Impact in China since 2013. Environ. Sci. Technol. Lett. 2020, 7, 240–247. [Google Scholar] [CrossRef]
  3. Zhu, J.; Liao, H.; Mao, Y.; Yang, Y.; Jiang, H. Interannual Variation, Decadal Trend, and Future Change in Ozone Outflow from East Asia. Atmos. Chem. Phys. 2017, 17, 3729–3747. [Google Scholar] [CrossRef]
  4. Wang, Y.; Gao, W.; Wang, S.; Song, T.; Gong, Z.; Ji, D.; Wang, L.; Liu, Z.; Tang, G.; Huo, Y.; et al. Contrasting Trends of PM2.5 and Surface-Ozone Concentrations in China from 2013 to 2017. Natl. Sci. Rev. 2020, 7, 1331–1339. [Google Scholar] [CrossRef] [PubMed]
  5. Qu, L.; Liu, S.; Ma, L.; Zhang, Z.; Du, J.; Zhou, Y.; Meng, F. Evaluating the Meteorological Normalized PM2.5 Trend (2014–2019) in the “2 + 26” Region of China Using an Ensemble Learning Technique. Environ. Pollut. 2020, 266, 115346. [Google Scholar] [CrossRef] [PubMed]
  6. Kan, H.; Chen, R.; Tong, S. Ambient Air Pollution, Climate Change, and Population Health in China. Environ. Int. 2012, 42, 10–19. [Google Scholar] [CrossRef] [PubMed]
  7. Han, C.; Xu, R.; Ye, T.; Xie, Y.; Zhao, Y.; Liu, H.; Yu, W.; Zhang, Y.; Li, S.; Zhang, Z.; et al. Mortality Burden Due to Long-Term Exposure to Ambient PM2.5 above the New WHO Air Quality Guideline Based on 296 Cities in China. Environ. Int. 2022, 166, 107331. [Google Scholar] [CrossRef]
  8. Wang, X.; Zhang, R.; Yu, W. The Effects of PM2.5 Concentrations and Relative Humidity on Atmospheric Visibility in Beijing. J. Geophys. Res. Atmos. 2019, 124, 2235–2259. [Google Scholar] [CrossRef]
  9. IPCC. Climate Change 2021: The Physical Science Basis: Contribution of Working Group I to the Sixth Assessment Report of the Intergovernmental Panel on Climate Change; IPCC: Cambridge, UK; New York, NY, USA, 2021; 2391p, ISBN 9781009157896. [Google Scholar]
  10. Orellano, P.; Reynoso, J.; Quaranta, N.; Bardach, A.; Ciapponi, A. Short-Term Exposure to Particulate Matter (PM10 and PM2.5), Nitrogen Dioxide (NO2), and Ozone (O3) and All-Cause and Cause-Specific Mortality: Systematic Review and Meta-Analysis. Environ. Int. 2020, 142, 105876. [Google Scholar] [CrossRef]
  11. Chen, J.; Hoek, G. Long-Term Exposure to PM and All-Cause and Cause-Specific Mortality: A Systematic Review and Meta-Analysis. Environ. Int. 2020, 143, 105974. [Google Scholar] [CrossRef]
  12. Sun, H.Z.; Yu, P.; Lan, C.; Wan, M.W.L.; Hickman, S.; Murulitharan, J.; Shen, H.; Yuan, L.; Guo, Y.; Archibald, A.T. Cohort-Based Long-Term Ozone Exposure-Associated Mortality Risks with Adjusted Metrics: A Systematic Review and Meta-Analysis. Innovation 2022, 3, 100246. [Google Scholar] [CrossRef]
  13. Alexeeff, S.E.; Liao, N.S.; Liu, X.; Van Den Eeden, S.K.; Sidney, S. Long-Term PM2.5 Exposure and Risks of Ischemic Heart Disease and Stroke Events: Review and Meta-Analysis. J. Am. Heart Assoc. 2021, 10, 1–22. [Google Scholar] [CrossRef]
  14. Abbafati, C.; Abbas, K.M.; Abbasi-Kangevari, M.; Abd-Allah, F.; Abdelalim, A.; Abdollahi, M.; Abdollahpour, I.; Abegaz, K.H.; Abolhassani, H.; Aboyans, V.; et al. Global Burden of 87 Risk Factors in 204 Countries and Territories, 1990–2019: A Systematic Analysis for the Global Burden of Disease Study 2019. Lancet 2020, 396, 1223–1249. [Google Scholar] [CrossRef]
  15. Xiao, Q.; Geng, G.; Xue, T.; Liu, S.; Cai, C.; He, K.; Zhang, Q. Tracking PM2.5 and O3 Pollution and the Related Health Burden in China 2013–2020. Environ. Sci. Technol. 2022, 56, 6922–6932. [Google Scholar] [CrossRef]
  16. WHO. WHO Global Air Quality Guidelines: Particulate Matter (PM2.5 and PM10), Ozone, Nitrogen Dioxide, Sulfur Dioxide and Carbon Monoxide; WHO: Geneva, Switzerland, 2021; ISBN 9789240034228. [Google Scholar]
  17. Ministry of Ecology and Environment. Report on the State of the Ecology and Environment in China 2022; Ministry of Ecology and Environment: Beijing, China, 2022; pp. 3–16.
  18. Monks, P.S.; Archibald, A.T.; Colette, A.; Cooper, O.; Coyle, M.; Derwent, R.; Fowler, D.; Granier, C.; Law, K.S.; Mills, G.E.; et al. Tropospheric Ozone and Its Precursors from the Urban to the Global Scale from Air Quality to Short-Lived Climate Forcer. Atmos. Chem. Phys. 2015, 15, 8889–8973. [Google Scholar] [CrossRef]
  19. Atkinson, R. Atmospheric Chemistry of VOCs and NOx. Atmos. Environ. 2000, 34, 2063–2101. [Google Scholar] [CrossRef]
  20. Li, K.; Jacob, D.J.; Liao, H.; Shen, L.; Zhang, Q.; Bates, K.H. Anthropogenic Drivers of 2013–2017 Trends in Summer Surface Ozone in China. Proc. Natl. Acad. Sci. USA 2019, 116, 422–427. [Google Scholar] [CrossRef] [PubMed]
  21. Tan, Z.; Lu, K.; Ma, X.; Chen, S.; He, L.; Huang, X.; Li, X.; Lin, X.; Tang, M.; Yu, D.; et al. Multiple Impacts of Aerosols on O3Production Are Largely Compensated: A Case Study Shenzhen, China. Environ. Sci. Technol. 2022, 56, 17569–17580. [Google Scholar] [CrossRef] [PubMed]
  22. Shao, M.; Wang, W.; Yuan, B.; Parrish, D.D.; Li, X.; Lu, K.; Wu, L.; Wang, X.; Mo, Z.; Yang, S.; et al. Quantifying the Role of PM2.5 Dropping in Variations of Ground-Level Ozone: Inter-Comparison between Beijing and Los Angeles. Sci. Total Environ. 2021, 788, 147712. [Google Scholar] [CrossRef]
  23. Qin, M.; Hu, A.; Mao, J.; Li, X.; Sheng, L.; Sun, J.; Li, J.; Wang, X.; Zhang, Y.; Hu, J. PM2.5 and O3 Relationships Affected by the Atmospheric Oxidizing Capacity in the Yangtze River Delta, China. Sci. Total Environ. 2022, 810, 152268. [Google Scholar] [CrossRef]
  24. Qiu, Y.; Wu, Z.; Shang, D.; Zhang, Z.; Xu, N.; Zong, T.; Zhao, G.; Tang, L.; Guo, S.; Wang, S.; et al. The Temporal and Spatial Distribution of the Correlation between PM2.5 and O3 Contractions in the Urban Atmosphere of China. Chin. Sci. Bull. 2022, 67, 2008–2017. [Google Scholar] [CrossRef]
  25. Shenzhen Municipal Bureau of Ecology and Environment. Report on the State of the Ecology and Environment in Shenzhen 2022; Bureau of Ecology and Environment of Shenzhen Municipality: Shenzhen, China, 2022; pp. 3–6.
  26. Department of Science and Technology Standards, Ministry of Environmental Protection. Ambient Air Quality Standards; Ministry of Environmental Protection: Beijing, China, 2012; pp. 1–12.
  27. Tang, M.X.; Huang, X.F.; Sun, T.L.; Cheng, Y.; Luo, Y.; Chen, Z.; Lin, X.Y.; Cao, L.M.; Zhai, Y.H.; He, L.Y. Decisive Role of Ozone Formation Control in Winter PM2.5 Mitigation in Shenzhen, China. Environ. Pollut. 2022, 301, 119027. [Google Scholar] [CrossRef]
  28. Yun, L.; Lin, C.-X.; Li, C.-L.; Qiu, Z.C.; Gu, T.F.; Li, G.-C.; Zhang, M.; Guo, J.F. Characteristics of VOCs and Assessment of Emission Reduction Effect During the Epidemic Lockdown Period in Shenzhen Urban Area. Environ. Sci. 2023, 44, 3788–3796. [Google Scholar] [CrossRef]
  29. Liu, C.; Zhang, A.; Fang, Q.; Ye, Y.; Yang, H.; Chen, J.; Wu, W.; Hou, Y.; Mo, J.; Fu, Z. Impacts of COVID-19 Lockdown on Air Quality in Shenzhen in Spring 2022. Environ. Sci. 2023, 44, 3117–3129. [Google Scholar]
  30. Paatero, P. Least Squares Formulation of Robust Non-Negative Factor Analysis. Chemom. Intell. Lab. Syst. 1997, 37, 23–35. [Google Scholar] [CrossRef]
  31. Paatero, P.; Tapper, U. Positive Matrix Factorization: A Non-Negative Factor Model with Optimal Utilization of Error Estimates of Data Values. Environmetrics 1994, 5, 111–126. [Google Scholar] [CrossRef]
  32. Zeng, P.; Guo, H.; Cheng, H.; Wang, Z.; Zeng, L.; Lyu, X.; Zhan, L.; Yang, Z. Aromatic Hydrocarbons in Urban and Suburban Atmospheres in Central China: Spatiotemporal Patterns, Source Implications, and Health Risk Assessment. Atmosphere 2019, 10, 565. [Google Scholar] [CrossRef]
  33. Zeng, P.; Lyu, X.P.; Guo, H.; Cheng, H.R.; Jiang, F.; Pan, W.Z.; Wang, Z.W.; Liang, S.W.; Hu, Y.Q. Causes of Ozone Pollution in Summer in Wuhan, Central China. Environ. Pollut. 2018, 241, 852–861. [Google Scholar] [CrossRef]
  34. Norris, G.; Duvall, R.; Brown, S.; Bai, S. EPA Positive Matrix Factorization (PMF) 5.0 Fundamentals and User Guide; United States Environmental Protection Agency: Washington, DC, USA, 2014; pp. 1–3.
  35. Yang, W.; Zhang, Y.; Wang, X.; Li, S.; Zhu, M.; Yu, Q.; Li, G.; Huang, Z.; Zhang, H.; Wu, Z.; et al. Volatile Organic Compounds at a Rural Site in Beijing: Influence of Temporary Emission Control and Wintertime Heating. Atmos. Chem. Phys. 2018, 18, 12663–12682. [Google Scholar] [CrossRef]
  36. Guo, H.; Cheng, H.R.; Ling, Z.H.; Louie, P.K.K.; Ayoko, G.A. Which Emission Sources Are Responsible for the Volatile Organic Compounds in the Atmosphere of Pearl River Delta? J. Hazard. Mater. 2011, 188, 116–124. [Google Scholar] [CrossRef]
  37. Carter, W.P.L. Updated Maximum Incremental Reactivity Scale and Hydrocarbon Bin Reactivity for Regulatory Applications. Calif. Air Resour. Board Contract 2010, 339, 1–22. [Google Scholar]
  38. Carter, W.P.L. Development of Ozone Reactivity Scales for Volatile Organic Compounds. Air Waste 1994, 44, 881–899. [Google Scholar] [CrossRef]
  39. Grosjean, D. In Situ Organic Aerosol Formation during a Smog Episode: Estimated Production and Chemical Functionality. Atmos. Environ. Part A Gen. Top. 1992, 26, 953–963. [Google Scholar] [CrossRef]
  40. Grosjean, D.; Seinfeld, J.H. Parameterization of the Formation Potential of Secondary Organic Aerosols. Atmos. Environ. 1989, 23, 1733–1747. [Google Scholar] [CrossRef]
  41. Wang, Y.Q.; Zhang, X.Y.; Draxler, R.R. TrajStat: GIS-Based Software That Uses Various Trajectory Statistical Analysis Methods to Identify Potential Sources from Long-Term Air Pollution Measurement Data. Environ. Model. Softw. 2009, 24, 938–939. [Google Scholar] [CrossRef]
  42. Liu, B.; Liang, D.; Yang, J.; Dai, Q.; Bi, X.; Feng, Y.; Yuan, J.; Xiao, Z.; Zhang, Y.; Xu, H. Characterization and Source Apportionment of Volatile Organic Compounds Based on 1-Year of Observational Data in Tianjin, China. Environ. Pollut. 2016, 218, 757–769. [Google Scholar] [CrossRef] [PubMed]
  43. Zhang, K.; Zhou, L.; Fu, Q.; Yan, L.; Bian, Q.; Wang, D.; Xiu, G. Vertical Distribution of Ozone over Shanghai during Late Spring: A Balloon-Borne Observation. Atmos. Environ. 2019, 208, 48–60. [Google Scholar] [CrossRef]
  44. Wang, X.; Zhang, T.; Xiang, Y.; Lv, L.; Fan, G.; Ou, J. Investigation of Atmospheric Ozone during Summer and Autumn in Guangdong Province with a Lidar Network. Sci. Total Environ. 2021, 751, 141740. [Google Scholar] [CrossRef] [PubMed]
  45. Zhu, L.; Huang, X.; Shi, H.; Cai, X.; Song, Y. Transport Pathways and Potential Sources of PM10 in Beijing. Atmos. Environ. 2011, 45, 594–604. [Google Scholar] [CrossRef]
  46. Li, M.; Huang, X.; Zhu, L.; Li, J.; Song, Y.; Cai, X.; Xie, S. Analysis of the Transport Pathways and Potential Sources of PM10 in Shanghai Based on Three Methods. Sci. Total Environ. 2012, 414, 525–534. [Google Scholar] [CrossRef]
  47. Guo, H.; Jiang, F.; Cheng, H.R.; Simpson, I.J.; Wang, X.M.; Ding, A.J.; Wang, T.J.; Saunders, S.M.; Wang, T.J.; Lam, S.H.M.; et al. Concurrent Observations of Air Pollutants at Two Sites in the Pearl River Delta and the Implication of Regional Transport. Atmos. Chem. Phys. 2009, 9, 9747–9791. [Google Scholar] [CrossRef]
  48. Wang, L.; Liu, Z.; Sun, Y.; Ji, D.; Wang, Y. Long-Range Transport and Regional Sources of PM2.5 in Beijing Based on Long-Term Observations from 2005 to 2010. Atmos. Res. 2015, 157, 37–48. [Google Scholar] [CrossRef]
  49. Fang, D.; Wang, Q.; Li, H.; Yu, Y.; Lu, Y.; Qian, X. Mortality Effects Assessment of Ambient PM2.5 Pollution in the 74 Leading Cities of China. Sci. Total Environ. 2016, 569–570, 1545–1552. [Google Scholar] [CrossRef] [PubMed]
  50. WHO. WHO Global Air Quality Guidelines 2021; WHO: Geneva, Switzerland, 2021; ISBN 9789812837134. [Google Scholar]
  51. Liu, J.; Yin, H.; Tang, X.; Zhu, T.; Zhang, Q.; Liu, Z.; Tang, X.L.; Yi, H.H. Transition in Air Pollution, Disease Burden and Health Cost in China: A Comparative Study of Long-Term and Short-Term Exposure. Environ. Pollut. 2021, 277, 116770. [Google Scholar] [CrossRef] [PubMed]
  52. Giannadaki, D.; Giannakis, E.; Pozzer, A.; Lelieveld, J. Estimating Health and Economic Benefits of Reductions in Air Pollution from Agriculture. Sci. Total Environ. 2018, 622–623, 1304–1316. [Google Scholar] [CrossRef]
  53. Maji, K.J.; Ye, W.-F.; Arora, M.; Nagendra, S.M.S. Ozone Pollution in Chinese Cities: Assessment of Seasonal Variation, Health Effects and Economic Burden. Environ. Pollut. 2019, 247, 792–801. [Google Scholar] [CrossRef] [PubMed]
  54. Peng, F.; Li, X.; Ma, G.; Zhou, Y.; Yu, F.; Zhang, Y.; Yang, W. Assessing the Value of a Statistical Life of Air Pollution in Chengdu-Chongqing Area by Contingent Value Method with Single Bounded Dichotomy. Chin. J. Environ. Manag. 2021, 13, 136–141. [Google Scholar] [CrossRef]
  55. Hammitt, J.K.; Robinson, L.A. The Income Elasticity of the Value per Statistical Life: Transferring Estimates between High and Low Income Populations. J. Benefit-Cost Anal. 2011, 2, 1–29. [Google Scholar] [CrossRef]
  56. Zeng, X.; Ruan, F.; Jiang, Y. Spatial Distribution and Health Effects of Ozone Pollution in China. China Environ. Sci. 2019, 39, 4025–4032. [Google Scholar]
  57. OECD. Mortality Risk Valuation in Environment, Health and Transport Policies; OECD Publishing: Paris, France, 2012; ISBN 9789264130760. [Google Scholar]
  58. Li, C.; Hammer, M.S.; Zheng, B.; Cohen, R.C. Accelerated Reduction of Air Pollutants in China, 2017–2020. Sci. Total Environ. 2022, 803, 150011. [Google Scholar] [CrossRef]
  59. Xue, R.; Wang, S.; Li, D.; Zou, Z.; Chan, K.L.; Valks, P.; Saiz-Lopez, A.; Zhou, B. Spatio-Temporal Variations in NO2 and SO2 over Shanghai and Chongming Eco-Island Measured by Ozone Monitoring Instrument (OMI) during 2008–2017. J. Clean. Prod. 2020, 258, 120563. [Google Scholar] [CrossRef]
  60. Wang, Y.; Wang, H.; Guo, H.; Lyu, X.; Cheng, H.; Ling, Z.; Louie, P.K.K.; Simpson, I.J.; Meinardi, S.; Blake, D.R. Long-Term O3–Precursor Relationships in Hong Kong: Field Observation and Model Simulation. Atmos. Chem. Phys. 2017, 17, 10919–10935. [Google Scholar] [CrossRef]
  61. Pei, Z.; Han, G.; Ma, X.; Su, H.; Gong, W. Response of Major Air Pollutants to COVID-19 Lockdowns in China. Sci. Total Environ. 2020, 743, 140879. [Google Scholar] [CrossRef] [PubMed]
  62. Wang, Y.; Wen, Y.; Wang, Y.; Zhang, S.; Zhang, K.M.; Zheng, H.; Xing, J.; Wu, Y.; Hao, J. Four-Month Changes in Air Quality during and after the COVID-19 Lockdown in Six Megacities in China. Environ. Sci. Technol. Lett. 2020, 7, 802–808. [Google Scholar] [CrossRef] [PubMed]
  63. Qi, J.; Mo, Z.; Yuan, B.; Huang, S.; Huangfu, Y.; Wang, Z.; Li, X.; Yang, S.; Wang, W.W.; Zhao, Y.; et al. An Observation Approach in Evaluation of Ozone Production to Precursor Changes during the COVID-19 Lockdown. Atmos. Environ. 2021, 262, 118618. [Google Scholar] [CrossRef] [PubMed]
  64. Slezakova, K.; Pereira, M.C. 2020 COVID-19 Lockdown and the Impacts on Air Quality with Emphasis on Urban, Suburban and Rural Zones. Sci. Rep. 2021, 11, 21336. [Google Scholar] [CrossRef]
  65. Li, X.B.; Yuan, B.; Parrish, D.D.; Chen, D.; Song, Y.; Yang, S.; Liu, Z.; Shao, M. Long-Term Trend of Ozone in Southern China Reveals Future Mitigation Strategy for Air Pollution. Atmos. Environ. 2022, 269, 118869. [Google Scholar] [CrossRef]
  66. Tan, Z.; Lu, K.; Jiang, M.; Su, R.; Wang, H.; Lou, S.; Fu, Q.; Zhai, C.; Tan, Q.; Yue, D.; et al. Daytime Atmospheric Oxidation Capacity in Four Chinese Megacities during the Photochemically Polluted Season: A Case Study Based on Box Model Simulation. Atmos. Chem. Phys. 2019, 19, 3493–3513. [Google Scholar] [CrossRef]
  67. Feng, T.; Bei, N.; Huang, R.J.; Cao, J.; Zhang, Q.; Zhou, W.; Tie, X.; Liu, S.; Zhang, T.; Su, X.; et al. Summertime Ozone Formation in Xi’an and Surrounding Areas, China. Atmos. Chem. Phys. 2016, 16, 4323–4342. [Google Scholar] [CrossRef]
  68. Wang, C.; Huang, X.F.; Zhu, Q.; Cao, L.M.; Zhang, B.; He, L.Y. Differentiating Local and Regional Sources of Chinese Urban Air Pollution Based on the Effect of the Spring Festival. Atmos. Chem. Phys. 2017, 17, 9103–9114. [Google Scholar] [CrossRef]
  69. Ding, A.J.; Fu, C.B.; Yang, X.Q.; Sun, J.N.; Zheng, L.F.; Xie, Y.N.; Herrmann, E.; Nie, W.; Petäjä, T.; Kerminen, V.-M.M.; et al. Ozone and Fine Particle in the Western Yangtze River Delta: An Overview of 1 Yr Data at the SORPES Station. Atmos. Chem. Phys. 2013, 13, 5813–5830. [Google Scholar] [CrossRef]
  70. Zeren, Y.; Zhou, B.; Zheng, Y.; Jiang, F.; Lyu, X.; Xue, L.; Wang, H.; Liu, X.; Guo, H. Does Ozone Pollution Share the Same Formation Mechanisms in the Bay Areas of China? Environ. Sci. Technol. 2022, 56, 14326–14337. [Google Scholar] [CrossRef]
  71. Deng, T.; Wang, T.; Wang, S.; Zou, Y.; Yin, C.; Li, F.; Liu, L.; Wang, N.; Song, L.; Wu, C.; et al. Impact of Typhoon Periphery on High Ozone and High Aerosol Pollution in the Pearl River Delta Region. Sci. Total Environ. 2019, 668, 617–630. [Google Scholar] [CrossRef] [PubMed]
  72. IQAir. 2022 World Air Quality Report; IQAir: Goldach, Switzerland, 2022; pp. 11–12. [Google Scholar]
  73. Wang, L.; Zhao, B.; Zhang, Y.; Hu, H. Correlation between Surface PM2.5 and O3 in Eastern China during 2015–2019: Spatiotemporal Variations and Meteorological Impacts. Atmos. Environ. 2023, 294, 119520. [Google Scholar] [CrossRef]
  74. Li, K.; Jacob, D.J.; Liao, H.; Zhu, J.; Shah, V.; Shen, L.; Bates, K.H.; Zhang, Q.; Zhai, S. A Two-Pollutant Strategy for Improving Ozone and Particulate Air Quality in China. Nat. Geosci. 2019, 12, 906–910. [Google Scholar] [CrossRef]
  75. Atkinson, R. Gas-Phase Tropospheric Chemistry of Volatile Organic Compounds: 1. Alkanes and Alkenes. J. Phys. Chem. Ref. Data 1997, 26, 215–290. [Google Scholar] [CrossRef]
  76. Jia, M.; Zhao, T.; Cheng, X.; Gong, S.; Zhang, X.; Tang, L.; Liu, D.; Wu, X.; Wang, L.; Chen, Y. Inverse Relations of PM2.5 and O3 in Air Compound Pollution between Cold and Hot Seasons over an Urban Area of East China. Atmosphere 2017, 8, 59. [Google Scholar] [CrossRef]
  77. Dai, H.; Zhu, J.; Liao, H.; Li, J.; Liang, M.; Yang, Y.; Yue, X. Co-Occurrence of Ozone and PM2.5 Pollution in the Yangtze River Delta over 2013–2019: Spatiotemporal Distribution and Meteorological Conditions. Atmos. Res. 2021, 249, 105363. [Google Scholar] [CrossRef]
  78. Li, Y.; Wang, T.; Wang, Q.; Qu, Y.; Wu, H.; Xie, M.; Li, M.; Li, S.; Zhuang, B. Spatiotemporal Variations of PM2.5 and O3 Relationship during 2014–2021 in Eastern China. Aerosol Air Qual. Res. 2023, 23, 1–16. [Google Scholar] [CrossRef]
  79. Zhu, J.; Chen, L.; Liao, H.; Dang, R. Correlations between PM2.5 and Ozone over China and Associated Underlying Reasons. Atmosphere 2019, 10, 352. [Google Scholar] [CrossRef]
  80. Zheng, X.Y.; Fu, Y.F.; Yang, Y.J.; Liu, G.S. Impact of Atmospheric Circulations on Aerosol Distributions in Autumn over Eastern China: Observational Evidence. Atmos. Chem. Phys. 2015, 15, 12115–12138. [Google Scholar] [CrossRef]
  81. Wu, X.; Xu, L.; Hong, Y.; Chen, J.; Qiu, Y.; Hu, B.; Hong, Z.; Zhang, Y.; Liu, T.; Chen, Y.; et al. The Air Pollution Governed by Subtropical High in a Coastal City in Southeast China: Formation Processes and Influencing Mechanisms. Sci. Total Environ. 2019, 692, 1135–1145. [Google Scholar] [CrossRef] [PubMed]
  82. Chang, L.; Xu, J.; Tie, X.; Gao, W. The Impact of Climate Change on the Western Pacific Subtropical High and the Related Ozone Pollution in Shanghai, China. Sci. Rep. 2019, 9, 16998. [Google Scholar] [CrossRef] [PubMed]
  83. Xia, L.; Cai, C.; Zhu, B.; An, J.; Li, Y.; Li, Y. Source Apportionment of VOCs in a Suburb of Nanjing, China, in Autumn and Winter. J. Atmos. Chem. 2014, 71, 175–193. [Google Scholar] [CrossRef]
  84. Tong, L.; Liao, X.; Chen, J.; Xiao, H.; Xu, L.; Zhang, F.; Niu, Z.; Yu, J. Pollution Characteristics of Ambient Volatile Organic Compounds (VOCs) in the Southeast Coastal Cities of China. Environ. Sci. Pollut. Res. 2013, 20, 2603–2615. [Google Scholar] [CrossRef] [PubMed]
  85. Liu, Y.; Shao, M.; Fu, L.; Lu, S.; Zeng, L.; Tang, D. Source Profiles of Volatile Organic Compounds (VOCs) Measured in China: Part I. Atmos. Environ. 2008, 42, 6247–6260. [Google Scholar] [CrossRef]
  86. Chin, J.Y.; Batterman, S.A. VOC Composition of Current Motor Vehicle Fuels and Vapors, and Collinearity Analyses for Receptor Modeling. Chemosphere 2012, 86, 951–958. [Google Scholar] [CrossRef]
  87. Yuan, B.; Shao, M.; Lu, S.; Wang, B. Source Profiles of Volatile Organic Compounds Associated with Solvent Use in Beijing, China. Atmos. Environ. 2010, 44, 1919–1926. [Google Scholar] [CrossRef]
  88. Lyu, X.P.; Chen, N.; Guo, H.; Zhang, W.H.; Wang, N.; Wang, Y.; Liu, M. Ambient Volatile Organic Compounds and Their Effect on Ozone Production in Wuhan, Central China. Sci. Total Environ. 2016, 541, 200–209. [Google Scholar] [CrossRef]
  89. Ling, Z.H.; Guo, H. Contribution of VOC Sources to Photochemical Ozone Formation and Its Control Policy Implication in Hong Kong. Environ. Sci. Policy 2014, 38, 180–191. [Google Scholar] [CrossRef]
  90. Li, J.; Zhai, C.; Yu, J.; Liu, R.; Li, Y.; Zeng, L.; Xie, S. Spatiotemporal Variations of Ambient Volatile Organic Compounds and Their Sources in Chongqing, a Mountainous Megacity in China. Sci. Total Environ. 2018, 627, 1442–1452. [Google Scholar] [CrossRef] [PubMed]
  91. Liu, Y.; Shao, M.; Zhang, J.; Fu, L.L.; Lu, S.H. Distributions and Source Apportionment of Ambient Volatile Organic Compounds in Beijing City, China. J. Environ. Sci. Health Part A—Toxic/Hazard. Subst. Environ. Eng. 2005, 40, 1843–1860. [Google Scholar] [CrossRef] [PubMed]
  92. Ou, J.M.; Guo, H.; Zheng, J.Y.; Cheung, K.; Louie, P.K.K.; Ling, Z.H.; Wang, D.W. Concentrations and Sources of Non-Methane Hydrocarbons (NMHCs) from 2005 to 2013 in Hong Kong: A Multi-Year Real-Time Data Analysis. Atmos. Environ. 2015, 103, 196–206. [Google Scholar] [CrossRef]
  93. Peng, X.; Xie, T.-T.; Tang, M.-X.; Cheng, Y.; Peng, Y.; Wei, F.H.; Cao, L.M.; Yu, K.; Du, K.; He, L.Y.; et al. Critical Role of Secondary Organic Aerosol in Urban Atmospheric Visibility Improvement Identified by Machine Learning. Environ. Sci. Technol. Lett. 2023, 10, 976–982. [Google Scholar] [CrossRef]
  94. Zhang, X.; Cheng, C.; Zhao, H. A Health Impact and Economic Loss Assessment of O3 and PM2.5 Exposure in China From 2015 to 2020. GeoHealth 2022, 6, 1–15. [Google Scholar] [CrossRef]
Figure 1. Location of the sampling sites.
Atmosphere 14 01806 g001
Figure 2. Trends of daily average MDA8 O3 and PM2.5 concentrations in Shenzhen from 2016 to 2022.
Atmosphere 14 01806 g002
Figure 3. Trends of monthly average MDA8 O3 and PM2.5 concentrations in different seasons in Shenzhen from 2016 to 2022. The error bar represents the 95% CI of the monthly averages.
Atmosphere 14 01806 g003
Figure 4. Frequency of MDA8 O3 and PM2.5 levels exceeding the NAAQS of China in different seasons at 13 BAQM sites from 2016 to 2022. Red bars in the graph indicate days when MDA8 O3 levels exceeded NAAQS, while purple bars represent days when PM2.5 levels exceeded NAAQS.
Atmosphere 14 01806 g004
Figure 5. Variation of average O3 concentrations with PM2.5 concentrations.
Atmosphere 14 01806 g005
Figure 6. Source profiles of ambient VOCs at the LH site during high-O3-and-PM2.5 days from 2019 to 2022.
Atmosphere 14 01806 g006
Figure 7. Twenty-four-hour backward trajectories during high-O3-and-PM2.5 days in Shenzhen from 2016 to 2022.
Atmosphere 14 01806 g007
Figure 8. PSCF and CWT maps for O3 and PM2.5 during high-O3-and-PM2.5 days in Shenzhen from 2016 to 2022.
Atmosphere 14 01806 g008
Figure 9. Premature mortalities attributable to long-term exposure to O3 and PM2.5.
Atmosphere 14 01806 g009
Figure 10. Economic losses attributed to long-term exposure to O3 and PM2.5.
Atmosphere 14 01806 g010
Table 1. The Spearman correlation coefficients of daily MDA8 O3, OX, and PM2.5 concentrations in different seasons from 2016 to 2022.
SeasonMDA8 O3-PM2.5MDA8 O3-OXPM2.5-OX
Annual0.48 **0.84 **0.65 **
Spring0.40 **0.85 **0.56 **
Summer0.62 **0.86 **0.75 **
Autumn0.53 **0.87 **0.62 **
Winter0.34 **0.75 **0.53 **
** Significant at p < 0.01.
Table 2. Contributions of anthropogenic sources to VOCs, OFPs, and SOAFPs.
SourceContribution (%)
VOCsO3 FormationSOA Formation
Vehicle exhaust43.1 ± 1.5%27.7 ± 0.6%20.8 ± 0.04%
Fuel evaporation15.3 ± 1.1%17.5 ± 0.4%25.8 ± 0.4%
(Vehicle emissions)58.4 ± 1.3%45.3 ± 0.6%46.6 ± 0.4%
Solvent usage20.2 ± 1.3%24.8 ± 0.5%41.7 ± 0.3%
Stationary combustion21.4 ± 1.3%30.0 ± 0.8%11.7 ± 0.1%
Disclaimer/Publisher’s Note: The statements, opinions and data contained in all publications are solely those of the individual author(s) and contributor(s) and not of MDPI and/or the editor(s). MDPI and/or the editor(s) disclaim responsibility for any injury to people or property resulting from any ideas, methods, instructions or products referred to in the content.

