1. Introduction
Storm surges, characterized by rapid rises in sea level caused by tropical cyclones, pose a significant and widespread threat to coastal regions worldwide, resulting in extensive flooding, property damage, loss of life, and socioeconomic disruptions [
1,
2,
3]. The accurate prediction of storm surge events is crucial for effective disaster preparedness, evacuation, and mitigation planning [
4].
These events occur when powerful tropical cyclones, such as hurricanes or typhoons, approach or pass near coastal areas, primarily driven by factors such as low atmospheric pressure, strong winds, and the dynamic interaction between the cyclone and the ocean [
5]. These cyclones displace a substantial volume of water, leading to a rapid increase in sea level. When combined with high tides, storm surges can cause severe coastal inundation, resulting in extensive property damage, infrastructure destruction, and the loss of critical services [
6]. In densely populated areas, the risk of casualties escalates as storm surges engulf residential areas, hindering emergency response efforts. The long-term consequences encompass economic setbacks, population displacement, and ecological disturbances, exacerbating the challenges faced during the recovery process [
7].
The escalating frequency and intensity of tropical cyclones attributed to climate change highlight the paramount importance of accurate storm surge prediction [
8]. Comprehensive data from the official weather department of Macao [
9], meticulously collected and chosen for its credibility, accuracy, and reliability, serves as the foundation for our findings in
Table 1. The data illustrate the destructive impact of significant storms recorded in Macao since 1968.
Figure 1 emphasizes the pressing demand for enhanced prediction capabilities, illustrating the increasing yearly trends in the number of recorded storms and maximum gusts. This pattern underscores the urgency for improved predictive capabilities in the face of escalating storm frequency and intensity. Leveraging comprehensive historical data and advanced prediction techniques, such as the proposed Bidirectional Attention-based LSTM model, our objective is to enhance comprehension and prediction of storm surge events. This interdisciplinary methodology, encompassing meteorological, oceanographic, and climatic factors, empowers decision makers and coastal communities to proactively mitigate risks, bolster resilience, and adapt to evolving climate patterns.
Traditional methods struggle to predict storm surges accurately, especially in changing climates [
10,
11]. Addressing these challenges, this study introduces BALSSA, a bidirectional attention-based LSTM model, enhancing prediction accuracy by focusing on relevant spatiotemporal features [
12,
13,
14,
15,
16,
17]. Climate change intensifies storm surge events, heightening their frequency and impact [
18,
19,
20]. Rising sea levels from melting ice caps and thermal seawater expansion increase the destructive potential of storm surges [
21]. Climate change influences tropical cyclones, the drivers of storm surges, through warmer ocean temperatures and higher atmospheric moisture content, potentially leading to more severe events [
22,
23,
24]. In a changing climate, accurate prediction and early warning systems are vital for effective mitigation, enabling informed decision making and resource allocation [
25,
26,
27]. Enhancing storm surge prediction amidst climate change requires advancements in forecasting methods [
28,
29]. Bidirectional Attention-based LSTM models, which employ deep learning, capture spatiotemporal features, thus improving predictive capabilities [
30,
31]. Accurate predictions are crucial for mitigating increasing storm surge risks [
32,
33]. Implementing advanced models, like BALSSA, provides critical information for preparedness and impact mitigation for decision makers and coastal communities.
Research on storm surge prediction has made significant progress in improving forecasting methods and understanding the impact of climate change [
12,
34]. However, there are still gaps and areas requiring further investigation in this field. Numerical models used for storm surge prediction have limitations in accurately capturing the complex dynamics, especially under evolving climatic conditions [
35]. Traditional numerical weather prediction (NWP) models, although widely employed for short-term flood estimation, face challenges in implementation and have inherent limitations [
36,
37]. Refining these models is necessary to better represent interactions between tropical cyclones and the ocean, incorporating rising sea levels and climate-related factors [
38,
39]. The quantitative assessment of various climate variables and their interactions is needed to understand the impact of climate change on storm surges more comprehensively [
19,
40]. This understanding would enhance prediction accuracy and support the development of targeted mitigation strategies for minimizing damages caused by storm surge events [
41,
42].
Machine learning, which outperforms traditional models in various studies [
43,
44,
45,
46], presents promising results in storm surge prediction with emphasis on precise timing of peaks [
47]. Ensemble approaches [
48], including models like ANN and deep learning techniques [
49,
50], improve accuracy and robustness. Incorporating atmospheric conditions in flood prediction, especially with short lead times, is crucial [
51]. Enhanced statistical models, ANN, and hybrid machine learning models demonstrate higher accuracy in typhoon-induced flood prediction [
17,
52,
53]. Artificial Intelligence (AI) is a powerful tool for addressing climate change [
54,
55,
56]. Attention techniques enhance predictive accuracy by focusing on relevant data portions [
57,
58,
59]. By incorporating multiple variables and determining their interplay and attention weights, prediction accuracy is enhanced [
60,
61,
62]. Recent studies explore attention-based neural networks capturing spatiotemporal correlations and long-term dependencies [
63,
64,
65]. In storm surge prediction, attention-based LSTM models improve accuracy by identifying significant inputs and interactions, capturing spatial and temporal correlations, and hold promise for accurately forecasting water level anomalies [
12].
This study aims to assess the risk of extreme storm surges from tropical cyclones under climate change, highlighting the enhanced predictive capabilities of BALSSA [
29,
66]. By integrating an attention mechanism, BALSSA selectively focuses on relevant input features, effectively addressing the performance degradation observed in conventional LSTM models for longer forecast horizons. The research is particularly valuable for applications requiring extended prediction capabilities, such as disaster risk preparation and timely evacuation, offering reliable forecasts up to 24 h in advance. Leveraging historical storm surge data and relevant meteorological parameters, the study seeks to provide precise and timely information to inform decision makers, emergency responders, and coastal communities. This contributes to improved preparedness and minimizes the impacts of future storm surge events. The research plays a crucial role in advancing storm surge prediction in changing climatic conditions and developing robust systems for effective impact mitigation in coastal regions. By bridging knowledge and methodology gaps, the study delivers accurate predictions, timely warnings, and guidance to vulnerable coastal communities, emergency management agencies, and decision makers. The focus on refining models, incorporating additional climate variables, and enhancing prediction capacity in the face of climate change ultimately contributes to improved disaster management and adaptation strategies for coastal regions worldwide.
In the subsequent sections, we detail our methodology, present analysis results, and engage in a thorough discussion on the implications of our findings. This research aims to significantly contribute to the field of storm surge prediction, ultimately enhancing the resilience of coastal regions in response to the challenges posed by climate change.
Section 2 provides a comprehensive explanation of our proposed model’s architecture, settings, and the procedures for data collection and preprocessing conducted prior to training. It also discusses the evaluation metrics used to assess the model’s performance. Advancing to
Section 3, we showcase real case studies where our proposed model has been applied. This section includes information on the experimental environment, the dataset utilized, and the achieved results. Additionally, we conduct a comparative analysis of the proposed model with various machine learning algorithms.
Section 4 involves a thoughtful discussion on the key highlights of our research, emphasizing the significance of the proposed adaptive system for storm surge prediction and mitigation. Finally, in
Section 5, we present our concluding remarks and offer suggestions for future research endeavors.
2. Methods and Materials
This study employed a diverse range of data sources and variables to comprehensively analyze storm surge dynamics and their interaction with climate change.
Figure 2 captures the evolving climate conditions contributing to the intensification of storm systems, presenting the changes in average (
Figure 2a) and maximum sea surface temperatures (
Figure 2b) recorded at the Ilha Verde tidal stations (SDV) located in Macao in 2022. The dataset, meticulously acquired from Macao’s official weather department [
9], spans a six-year period (2017–2022), encompassing reliable and accurate historical storm surge data, meteorological data, information on tropical cyclones, and climate change data.
Figure 3 and
Table 2 provide a detailed overview of the geographical distribution of weather stations (
Figure 3a) and tidal stations (
Figure 3b), illuminating specific locations where meteorological data, sea surface temperature data, and other information are systematically recorded. This geographical context enhances our understanding of localized climate variations, contributing to a comprehensive analysis of storm surge dynamics. The historical storm surge data provided insights into surge characteristics and behavior, encompassing timing, duration, magnitude, and spatial extent. Meteorological variables such as wind velocity, wind direction, and atmospheric pressure were examined to identify patterns and correlations influencing storm surge formation and intensity. Additionally, data on tropical cyclones allowed for an assessment of their impact, while climate change data provided a broader context for understanding storm surge dynamics. The dataset’s high temporal resolution, recorded at five-minute intervals, facilitated a detailed analysis of meteorological conditions during storm surge events. Overall, this comprehensive dataset enabled a nuanced analysis of storm surge dynamics and their relationship with meteorological and climatic factors.
2.1. Model Structure
In BALSSA [
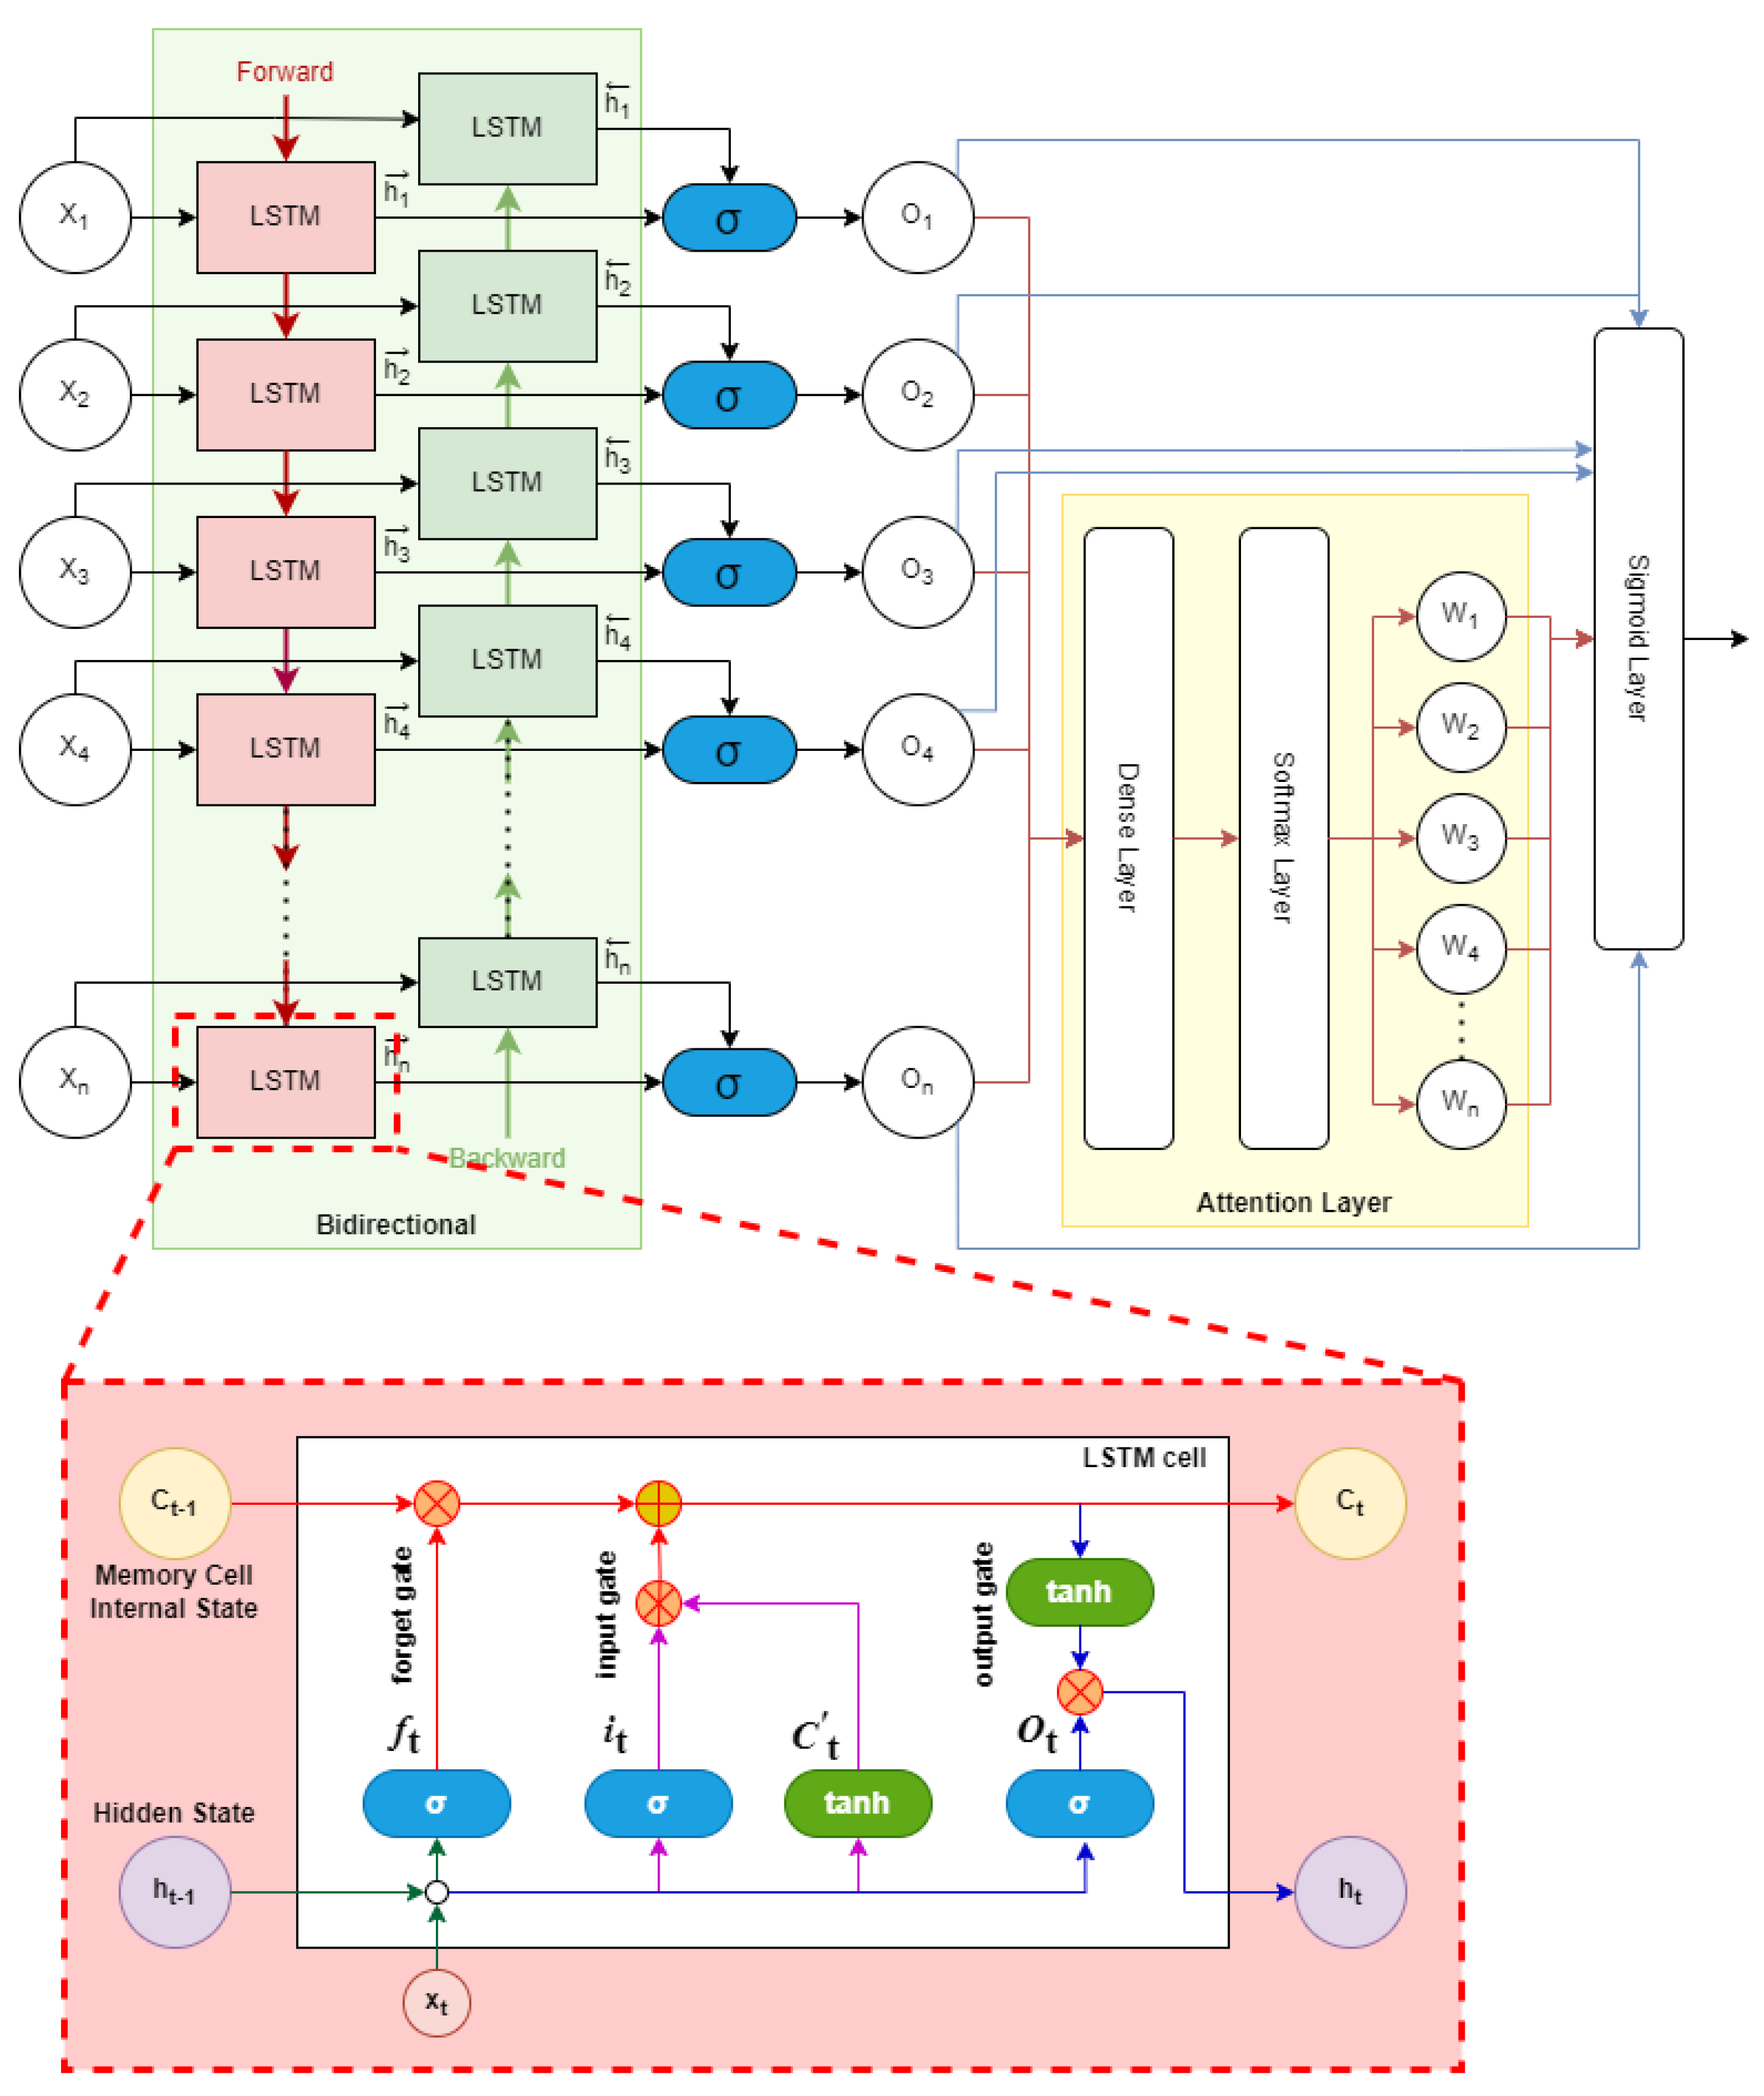
67], we incorporated a bidirectional LSTM layer and an attention layer, as illustrated in
Figure 4. The bidirectional LSTM module transformed the input data into a sequence of output vectors (
), representing historical sea water level information. These output vectors were then passed through the attention layer, which dynamically assigned adaptive weights (
) to the input features, highlighting their significance. By combining the outputs of both layers, we accurately predicted sea water level abnormalities, specifically forecasting the sea level at time
based on past information at time
t and the attention weights. To assess the effectiveness of BALSSA compared to other machine learning methods, we conducted experiments using various approaches implemented with the scikit-learn library. These approaches included commonly used models such as Linear Regression (LR), K-Nearest Neighbor (KNN), Random Forest (RF), Extreme Gradient Boosting (XGBoost), Light Gradient-Boosting Machine (LightGBM), Categorical Boosting (CatBoost), and Gradient Boosting (GB).
2.1.1. Enhancing Temporal Dynamics: Bidirectional LSTM Layer
The LSTM model processes a given sequence of inputs, denoted as
, at timestep
t, generating corresponding output sequences (
) and memory cell sequences (
). These computations are conducted using equations described in Equation (
1) through Equation (
6).
where
is the standard logistic sigmoid function to map the input values to the interval (0, 1);
denote the weight factors; and
signify the bias terms.
Equation (
1) delineates the forget gate (
), determining the extent to which the previous memory cell is erased. This is calculated by applying the sigmoid function (
) to the weighted sum of the preceding hidden state (
), the current input (
), and a bias term (
). Similarly, Equation (
2) introduces the input gate (
), responsible for regulating the amount of new information stored in the memory cell. The input gate is derived by applying the sigmoid function to the weighted sum of
,
, and the bias term (
). Equation (
3) computes the candidate cell state (
) by applying the hyperbolic tangent function (tanh) to the weighted sum of
,
, and the bias term (
). This candidate cell state represents the potential new information that can be incorporated into the memory cell. To calculate the current memory cell state (
) in Equation (
4), the previous memory cell state (
) is combined with the scaled candidate cell state (
), multiplied by the forget gate (
), and added to the product of the input gate (
) and the candidate cell state. Moreover, Equation (
5) introduces the output gate (
), which dictates how much of the current memory cell state is exposed as the output. This is calculated by applying the sigmoid function to the weighted sum of
,
, and the bias term (
). Finally, to compute the hidden state (
) in Equation (
6), the output gate (
) is multiplied by the hyperbolic tangent of the memory cell state (
).
The bidirectional LSTM layer within BALSSA captures a comprehensive temporal context and extracts meaningful representations by employing both forward and backward processing. It is instrumental in forecasting future events, discerning intricate patterns, and optimizing data utilization by encompassing both past and future contexts. This dual approach enhances the model’s data comprehension, facilitated by two LSTM layers operating in opposing directions (
Figure 4). These layers maintain hidden state vectors at each timestep, and their outputs are concatenated to form a unified output vector:
where
and
are the hidden state vectors of the forward and backward LSTM layers at timestep
t, respectively. Outputs from the bidirectional LSTM layer undergo further processing by the activation layer to generate the final output.
2.1.2. Optimizing Relevance and Weighting: Attention Layer
The attention layer in BALSSA assigns variable weights to input features, capturing nuanced data representations, particularly in scenarios involving abrupt changes in wind velocity and pressure. After passing through a dense layer, feature representations are extracted. Subsequently, attention weights are computed through a softmax layer (
Figure 4). These trainable weights effectively capture intricate feature relationships. The weighted sum, obtained by multiplying these weights with corresponding representations, constitutes the final output of the attention layer. This output can undergo additional processing for predictions or classifications. Through backpropagation, the attention layer adjusts both weights and parameters, thereby enhancing model accuracy and optimizing the utilization of input data. This crucial component significantly boosts both the accuracy and interpretability of the model.
In BALSSA, the weight assigned to the additive attention mechanism is determined based on the input and a learnable parameter matrix. This calculation undergoes non-linearity through a hyperbolic tangent function (Equation (
7)). Here,
denotes the ith input feature,
s represents the query vector, and
and
are the matrices of learnable parameters. The resultant scores then undergo further processing using a softmax function to yield attention weights (Equation (
8)). The attention weight
corresponds to the ith input feature, with
n representing the total count of input features. For the computation of the weighted sum of the input, the input features are combined with their respective attention weights (Equation (
9)). An alternative method for calculating the attention weight between a pair of input features
is presented in Equation (
10), where
represents the attention weight for the specific pair of input features. Leveraging these attention weights, the output of the attention layer comprises a sequence of weighted input vectors denoted as
, rather than a single vector
c (Equation (
11)).
The attention layer strategically focuses on task-specific information to augment accuracy and accelerate convergence speed. By transforming input sequences through trainable parameters, it generates transformed vectors, and a softmax layer computes attention weights (
). These weights ascertain the importance of each feature vector, facilitating a weighted sum as the output. Subsequent processing by additional layers, such as the Dual-BALSSA (D-BALSSA) structure introduced later, is contingent on the specific task and model architecture. The softmax function normalizes attention weights, attributing higher importance to salient or informative feature vectors. In contrast to traditional LSTM or RNN-based storm surge prediction models, BALSSA incorporates an attention layer for a more discerning representation of input data [
68,
69,
70]. Trainable attention weights (
) selectively focus on specific feature sequences, enhancing accuracy by prioritizing pertinent features and mitigating the impact of duplicates. This selective emphasis proves advantageous when integrated into another LSTM layer or fused with the input sequence. Through backpropagation, the attention weights are updated, enabling adaptive concentration on various segments of the input sequence and fortifying model accuracy and robustness [
71,
72]. In comparison to conventional models, our attention layer dynamically directs attention based on data, enhancing adaptability. Additionally, attention weights facilitate analysis and visualization, providing insights into the decision-making process and spotlighting salient input regions [
70]. Consequently, the attention layer emerges as a potent tool for performance improvement and interpretability in storm surge prediction.
2.1.3. Enhanced Storm Surge Prediction with Dual-BALSSA (D-BALSSA): Doubling the Bidirectional Attention-Based Structure
To extend and enhance the capabilities of the single-layer BALSSA design, we introduce D-BALSSA, an extended version featuring dual layers of bidirectional LSTM and attention layers. Leveraging bidirectional LSTM, D-BALSSA captures information from both past and future contexts, fostering a comprehensive understanding of temporal dynamics in storm surge time series. This bidirectional approach amplifies the model’s capacity to grasp long-term dependencies and extract meaningful patterns. Furthermore, the integration of attention layers enhances D-BALSSA’s predictive performance by selectively focusing on relevant segments of the input sequence. Placing attention layers after each bidirectional LSTM layer allows D-BALSSA to iteratively refine its representation, adapting attention weights to the evolving context of the input data. This iterative refinement process substantially improves the model’s ability to capture complex temporal dependencies and accurately predict anomalies in sea level.
The architecture of D-BALSSA, which incorporates dual bidirectional LSTM layers and attention mechanisms, is illustrated in
Figure 5. The output of the first attention layer serves as input to the second bidirectional LSTM layer, and the output of the second LSTM layer is utilized by the second attention layer. This multi-layer configuration progressively refines the model’s representation, capturing intricate patterns in storm surge time series. By integrating dual bidirectional LSTM layers and attention mechanisms, D-BALSSA elevates storm surge time series prediction. The bidirectional LSTM layers provide a comprehensive understanding of temporal dynamics, while the attention layers enable selective focus on relevant features, refining pattern extraction. Through iterative refinement and attention mechanisms, D-BALSSA achieves enhanced accuracy and robustness in predicting sea level anomalies.
2.2. Data Collection and Preprocessing
2.2.1. Data Collection
The coastal region of the Pearl River Delta has a longstanding vulnerability to natural disasters, marked by persistent threats from typhoons and storm surges. During the typhoon season, when water levels experience significant rises, timely and reliable forecasts become imperative to safeguard coastal communities. To ensure the accuracy of our training data, we meticulously gathered meteorological and tidal data from the Macao Meteorological and Geophysical Bureau, the city’s official weather department [
9]. Our dataset spans the period from 2017 to 2022 and encompasses various storm surge events triggered by typhoons over six years. It comprises a rich repository of 630,000 records collected at five-minute intervals from ground stations (
Figure 3a) and tidal gauges (
Figure 3b). Additionally, we incorporated observation data for tropical storms within the same timeframe. The southeastern coast of China experienced a concentrated occurrence of typhoon landfalls, resulting in significant storm surge incidents. The frequency of typhoon incidents ranged from 8 to 16 annually. Notably, typhoons such as Hato (2017) and Manghut (2018) made landfall at the southern coast of Zhuhai and the Taishan coast of Jiangmen, respectively (
Figure 6), leading to severe storm surge incidents and substantial economic losses in Macao [
3,
4,
12,
73].
The training parameters listed in
Table 3 encompass sea tidal level, sea temperature, wind velocity, atmospheric pressure, and their corresponding tendency changes [
74,
75]. This comprehensive dataset, with high temporal resolution recorded at five-minute intervals, enables a detailed analysis of meteorological conditions during storm surge events. The wind speed is measured at a height of 10 m above ground level, ensuring accurate representation. Additionally, air pressure data undergoes meticulous reduction to mean sea level pressure for consistency and comparability. With a data availability rate exceeding 99% [
76], achieved through the deployment of redundant measurement instruments in ground stations, this dataset guarantees effective measurement for all meteorological elements. The quality control process, emphasized due to data sourced from the official weather department, includes persistent tests, range checks, spatial consistency checks, outlier detection, and data completeness checks, among others. These rigorous measures collectively ensure the accuracy and reliability of our data. Incorporating tendency fluctuations in air pressure and wind velocity over different time intervals (1 h, 3 h, and 6 h) enhances the model’s ability to capture short-term variations in these parameters, improving the accuracy of storm surge predictions. Furthermore, our model incorporates other auxiliary factors such as typhoon central pressure, central wind velocity, moving speed, and moving direction, recognizing the pivotal role of machine learning methods that necessitate a large number of accurate samples to ensure robust and precise predictions [
77,
78]. This emphasis on the quality and quantity of data is particularly crucial given the comprehensive nature of our training dataset, spanning various storm surge events triggered by typhoons over these six years. It underscores the significance of meticulous attention to data acquisition for the effectiveness and reliability of our storm surge predictions.
Analyzing a significant storm surge event in July 2022 (
Figure 7), we observe strong positive correlations between surge level increments and changes in wind velocity tendency (
Figure 7a). Conversely, a robust inverse relationship is evident between water level anomalies and variations in atmospheric pressure tendencies (
Figure 7b). These correlations, visually represented in the shaded areas of the figures, offer valuable insights into the interplay among wind changes, surge levels, and atmospheric pressure tendencies, contributing to the development of accurate predictive models for storm surges [
79]. Integrating atmospheric pressure and wind velocity tendencies as new feature spaces enhances the predictive capabilities of BALSSA [
46,
80,
81]. Including these tendencies provides models with insights into temporal behavior and changes, resulting in more accurate predictions and forecasts. Independent tests confirm that incorporating tendency variations significantly improves predictive capabilities (see
Figure 8). This integration allows capturing temporal patterns and relationships, facilitating better anticipation and forecasting of storm surge dynamics [
72]. It also enhances BALSSA’s ability to analyze evolving weather dynamics, benefiting decision makers and coastal communities in storm surge preparation and response strategies. Ensuring representative and comprehensive data for feature engineering maintains model quality and reliability.
2.2.2. Data Preprocessing
Predicting storm surge events is challenging due to limited and inconsistent data availability [
82]. To overcome this, various data imputation strategies, such as mean interpolation and restoration based on historical patterns, have been employed [
83]. Preprocessing steps include data normalization, missing value imputation, and identifying meteorological elements strongly correlated with storm surge [
84]. Data normalization involves standardizing the data using Equation (
12), where
represents the standardized data for the meteorological parameter at time
t,
denotes the original measured value of that parameter,
corresponds to the mean value of the data feature, and
represents the standard deviation of the collected data calculated using Equation (
13).
Missing data are addressed using strategies like mean (Equation (
14)), median (Equation (
15)), and regression (Equation (
16)) imputation. Addressing missing data in this particular domain presents a significant challenge due to the intricate interplay between meteorological and tidal factors. To effectively overcome these challenges, meticulous attention was given to selecting appropriate metrics and validation methodologies. This careful approach ensured that the imputation process was performed successfully, considering the complex relationships within the data. Following the preprocessing steps, the dataset was divided into three distinct subsets: the training, validation, and testing sets. The training set, comprising 70% (approximately 441,000 entries, representing approximately 1530 days) of the collected meteorological and tide data, was utilized to train the model. The validation set, consisting of 20% (approximately 126,000 entries, corresponding to approximately 430 days) of the data, served as a means to validate the model’s predictions. The remaining 10% (approximately 63,000 entries, approximately 215 days) of the dataset constituted the testing set, employed for rigorous model testing and evaluation.
where
represents the imputed value for the missing data point at time
t,
denotes the available data points,
N represents the total number of available data points, and
to
are the regression coefficients associated with
to
, which represent observed values of other correlated features.
2.3. Assessment Metrics for Model Evaluation
To effectively assess the performance and prediction accuracy of different models, three evaluation indices were employed. These indices are the Mean Absolute Error (MAE), Mean Squared Error (MSE), and Root Mean Squared Error (RMSE). The mathematical expressions (Equations (
17)–(
19)) for these indices are as follows:
MAE: Measures the average absolute difference between the predicted and actual values, disregarding their direction.
MSE: Calculates the average squared difference between the predicted and actual values, penalizing larger errors more heavily and capturing variance.
RMSE: Derived from MSE, it represents the square root of MSE and provides an interpretable measure in the same unit as the target variable.
where denotes the actual value, represents the predicted value of y, N represents the number of data points, and denotes the mean value of y.
These evaluation metrics enable the assessment of model accuracy and precision in predicting storm surge events. Lower values of MAE, MSE, and RMSE indicate better model performance, reflecting smaller prediction errors. By utilizing these metrics, models can be compared and ranked based on their ability to minimize the disparity between predicted and actual values. Such quantitative assessment aids in selecting the most accurate and reliable model for storm surge prediction.
3. Result Analysis
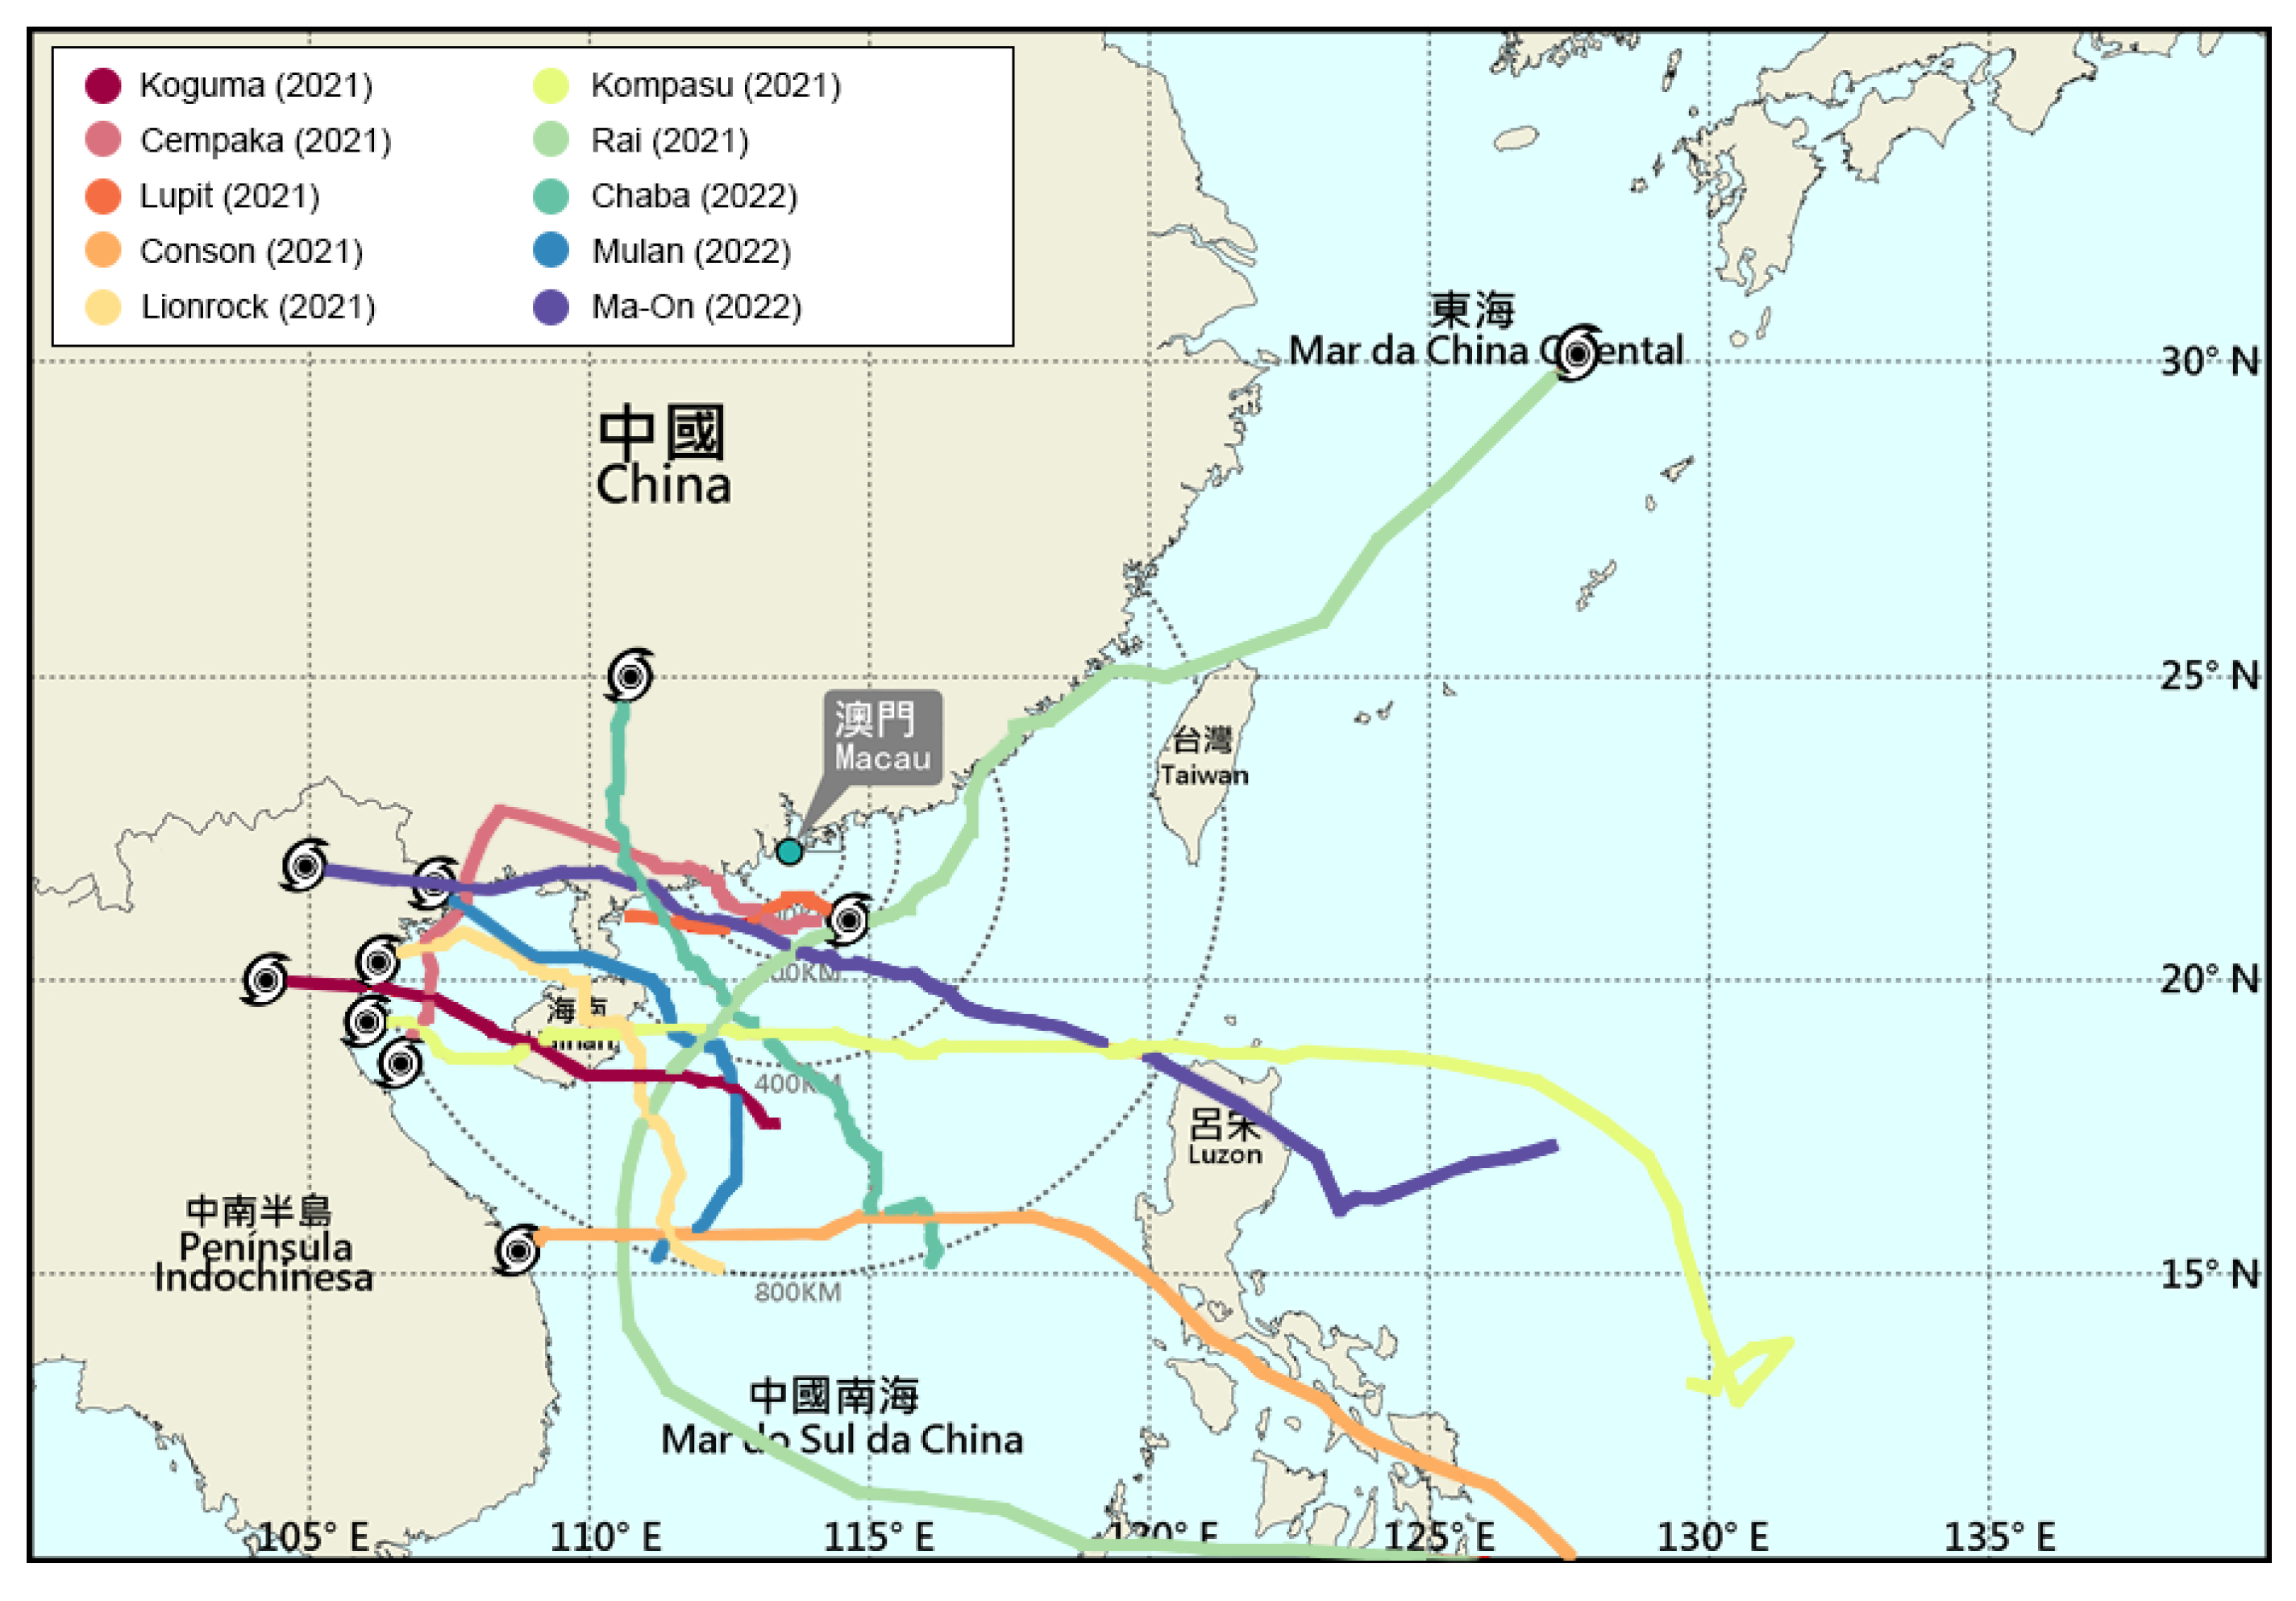
In this section, we focus on evaluating the effectiveness of the proposed model through a comprehensive analysis of ten tropical cyclones (TC) that occurred in Macao between 2021 and 2022. These TC occurrences, trajectories, and their corresponding impact are visually represented in
Figure 9 and
Figure 10.
Figure 10 clearly indicates the time periods during which these TCs took place, with numerical labels and red highlighting within the figure to represent them accordingly. For a thorough understanding of these events, we provide detailed information about each tropical cyclone in
Table 4. To assess the severity of these tropical cyclones, we adhere on the classification system established by the World Meteorological Organization (WMO), which categorizes them based on maximum sustained wind speeds near the center. In
Table 5, we provide the classification and meanings for the six categories. This system assists in evaluating the intensity of TCs and gauging their impact on Macao. The analysis of these ten cyclones offers valuable insights into the performance of BALSSA, particularly its accuracy in predicting and assessing associated sea level anomalies.
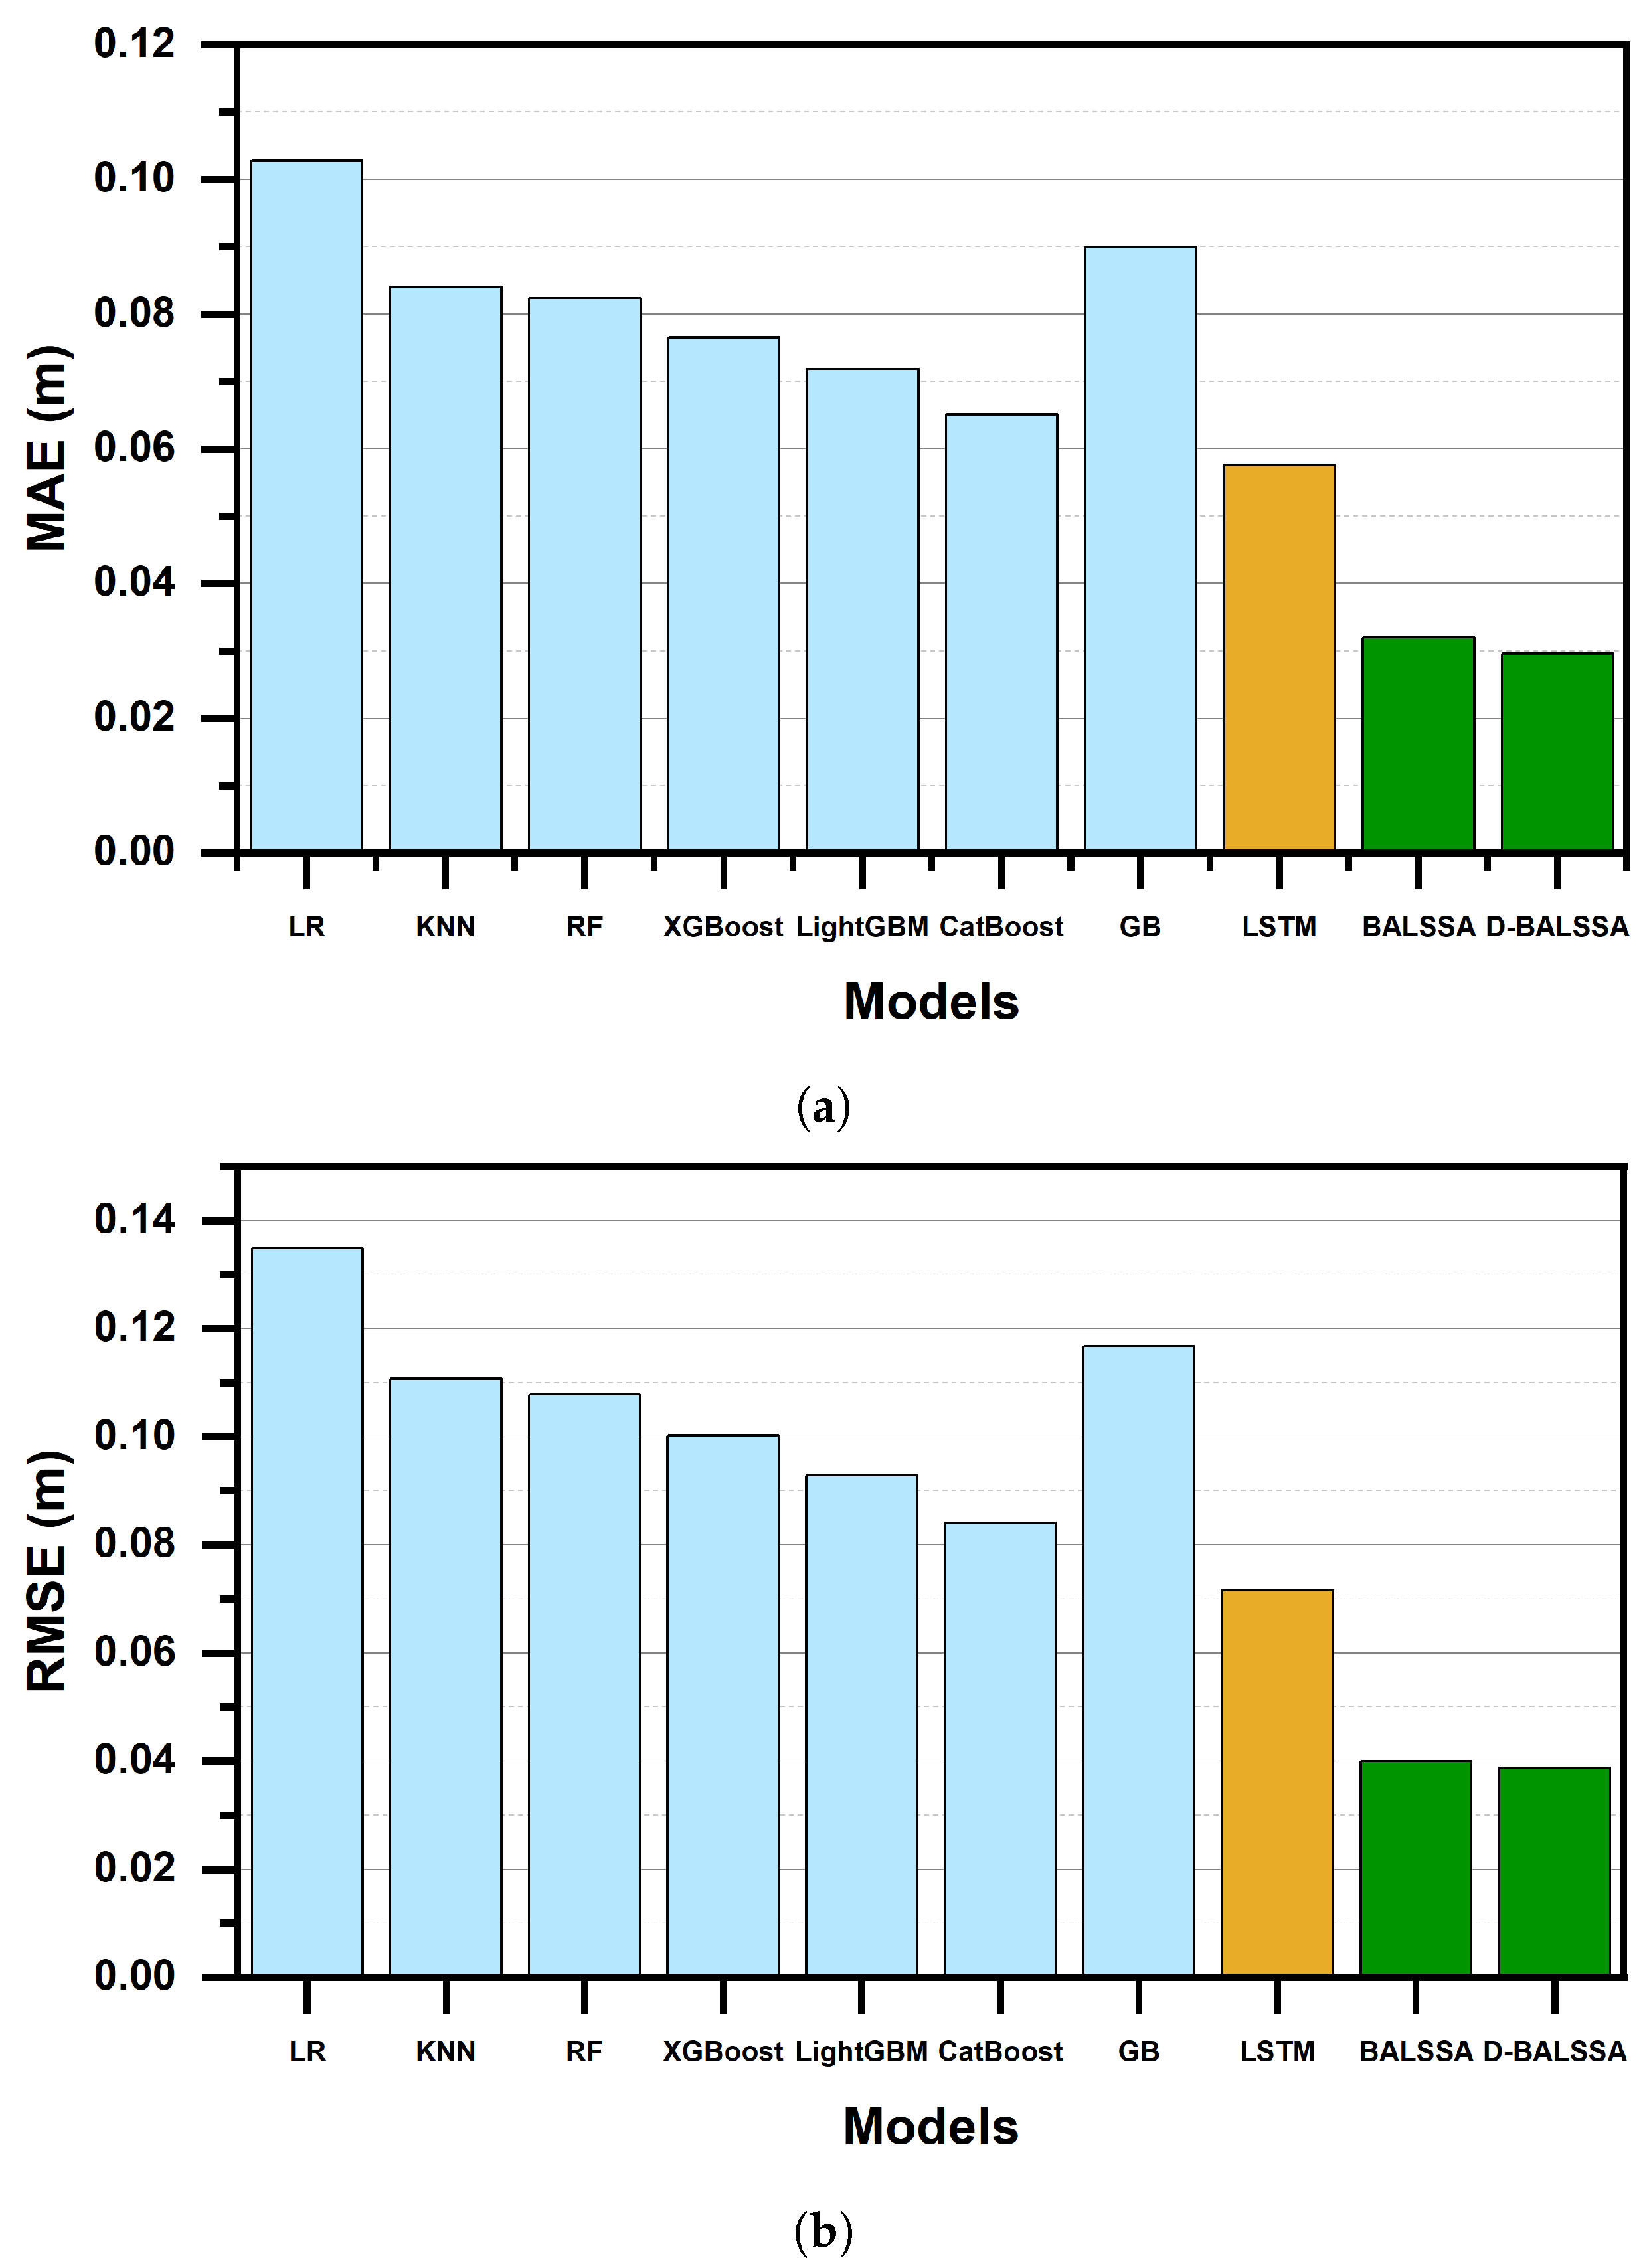
In this study, we performed an extensive performance comparison between BALSSA and various other machine learning (ML) algorithms for time series prediction, as illustrated in
Figure 11. The results unequivocally highlight the superior performance of both the regular LSTM and BALSSA over alternative algorithms. This superiority can be ascribed to the intrinsic capabilities of LSTM-based models in adeptly capturing the intricate non-linear interactions and long-term dependencies inherent in time series data. Notably, BALSSA surpasses the regular LSTM model, as depicted in
Figure 12. The BALSSA models adhere to a nomenclature convention, identified as BALSSA+suffix, to indicate distinct hyperparameter configurations. The suffixes (−128, −256, −256–128, etc.) signify variations in the number of LSTM units, layers, and other relevant factors. This naming convention enhances transparency and simplifies the distinction between various models, underscoring the diverse hyperparameter combinations employed within the BALSSA architecture. The evaluation of the testing set, focusing on mean absolute error (MAE) and root mean squared error (RMSE), spans prediction times from 1 h to 72 h, as depicted in
Figure 12a and
Figure 12b, respectively.
Analyzing the trends reveals a moderate increase in the evaluation metrics of MAE and RMSE for both variations of BALSSA from 1 h to 3 h, succeeded by a slight decrease from 3 h to 24 h. Subsequently, the values stabilize or exhibit slight improvements towards the 72 h forecast lead time. Significantly, the regular LSTM model’s performance, represented by the brown line in
Figure 12, markedly differs from that of the BALSSA models, clearly highlighting its inferior predictive capability. Across the seven prediction times, the average MAE values for BALSSA and the regular LSTM model are 0.0257 m and 0.0484 m, respectively. Visualized in
Figure 13, the superior prediction capability of BALSSA over the regular LSTM model is evident, offering a direct comparison of prediction accuracy between LSTM (85%) and BALSSA (93–95%). These visual representations unmistakably underscore BALSSA’s substantial outperformance over the regular LSTM model. Additionally,
Figure 14 provides a comprehensive and insightful comparison of BALSSA with other applied machine learning algorithms, further solidifying its superior performance in the context of this study.
The integration of the attention mechanism in BALSSA significantly bolsters accuracy by selectively focusing on pertinent input features, capturing dependencies such as wind velocity, atmospheric pressure, tidal levels, and meteorological changes. This aligns seamlessly with our understanding of weather patterns, enabling superior time series forecasting. In contrast, the regular LSTM model’s performance wanes as forecast horizons extend, limiting its precision. BALSSA mitigates this limitation through attention mechanisms, maintaining high accuracy even for extended horizons of up to 24 h. This becomes pivotal for disaster risk preparation and timely evacuation [
85]. The heightened accuracy and extended forecasting capabilities of BALSSA hold particular significance for applications like disaster management, ensuring proactive measures and the safety of affected populations.
To assess the performance accuracy of BALSSA and D-BALSSA, we conducted a comparative evaluation using the same seven forecast lead time intervals as before. We compared single-layered BALSSA models with D-BALSSA and also considered an ensemble mean of the BALSSA models. The evaluation results, illustrated in
Figure 15, showcase the improved performance of D-BALSSA. It consistently achieves the lowest mean absolute error (MAE) and root mean squared error (RMSE) across most measurements, outperforming various BALSSA variations in the majority of cases. However, it is important to note that the observed improvement in performance accuracy may not justify the increased complexity in the overall design. The resources required for training and preparing the D-BALSSA may not be justified by the incremental gains in performance accuracy. In other words, while D-BALSSA demonstrates superior performance, careful consideration is needed to balance the trade-off between performance gains and the increased complexity and resource requirements associated with its implementation.
The effectiveness and accuracy of BALSSA in predicting tide levels are substantiated through a thorough visual comparison across multiple implementations, utilizing the test cases of typhoon Mulan and Ma-On in 2022, as depicted in
Figure 16. The results offer insights into the disparities between actual tide level measurements and our predictions, showcasing promising performance overall. In the Mulan case, discrepancies for tidal level peaks ranged from 0.02 m to 0.03 m, while for the Ma-On case, variations spanned from 0.02 m to 0.05 m. Our predictions closely align with the real-world data curve, indicating a robust agreement between predicted and observed tide levels. However, it is essential to note a minor time lag in our predictions and the occasional potential failure to capture extreme weather conditions. In summary, the visual comparison of various implementations for the test cases provides additional evidence of the high prediction accuracy and effectiveness of BALSSA. The results exhibit slight deviations from actual tide level measurements, acknowledging the presence of a minor time lag and the potential for improved sensitivity to extreme weather conditions in future research endeavors.
4. Discussion
In this study, we propose BALSSA, a bidirectional attention-based LSTM model, as a novel approach to improve the prediction accuracy of storm surge events. Our approach addresses the limitations observed in previous research and effectively handles challenges such as non-stationarity, nonlinear interactions, and long-term dependence in storm surge time series data [
47]. By extracting essential meteorological, tidal, and typhoon features, our model outperforms earlier methodologies [
17,
49,
51].
Through a meticulous evaluation process, our primary objective was to identify optimal datasets for training BALSSA, with a specific emphasis on achieving accurate surge forecasting over an extended lead-time [
17]. Leveraging local tidal and meteorological data [
53], BALSSA exhibits a significant enhancement in prediction accuracy, surpassing the performance of earlier methodologies [
39,
86]. These findings underscore the effectiveness and superiority of our approach in improving prediction accuracy. By adeptly capturing the intricate dynamics of storm surges and incorporating relevant meteorological factors, our model demonstrates remarkable accuracy. It excels in extracting crucial information from the input time series data, resulting in more precise forecasts of surge magnitudes and timings compared to earlier methodologies [
17,
47,
49,
51]. Moreover, the interpretability of our approach empowers decision makers to gain insights into the underlying factors driving the predictions, facilitating informed actions and the development of effective risk reduction strategies. To assess and compare the accuracy of BALSSA with other prediction models [
87], we conducted a comprehensive evaluation of their prediction performance. The results, depicted in
Figure 12,
Figure 13, and
Figure 15, unmistakably demonstrate the superior performance of various implementations of BALSSA. It outperforms previous approaches and provides faster and more accurate predictions by leveraging its ability to retain storm-related information and utilize attention-based capabilities.
Compared to earlier neural network models [
13,
52,
72], our study establishes the superior performance of BALSSA. Compelling evidence in favor of our approach’s advantages in prediction accuracy and extended lead time capabilities is presented in
Figure 14 and
Figure 15. While previous studies [
13] achieved decent performance, they were limited to a one-hour lead time. Similarly, Ref. [
72] incorporated local meteorological information and typhoon characteristics into an ANN, obtaining acceptable predictions with a three-hour lead time. Ref. [
52] developed an ANN-based flood prediction model with lead times of 3, 12, and 19 h to improve estimation performance. In contrast, BALSSA surpasses these earlier models by providing significantly enhanced accuracy over much longer lead times. By harnessing the power of the bidirectional attention-based LSTM architecture, our model effectively captures the intricate dynamics of storm surges and integrates relevant meteorological factors, resulting in improved prediction accuracy. These advancements position BALSSA as a valuable tool for enhancing the estimation performance of storm surge events, surpassing the limitations of previous approaches and enabling more accurate and reliable predictions over extended lead times.
In conclusion, BALSSA marks a substantial advancement in storm surge prediction compared to earlier models. Unlike models susceptible to uncertainties stemming from atmospheric forcing in numerical weather prediction [
88], BALSSA excels in delivering accurate and efficient forecasts, even when extended lead times are required. It adeptly navigates challenges associated with unpredictable atmospheric conditions, yielding dependable and robust results. By addressing prior limitations and harnessing the capabilities of bidirectional attention-based LSTM models, our approach not only enhances accuracy but also ensures a resilient performance. The capacity to handle intricate data and capture temporal dependencies positions BALSSA as an invaluable tool for precise surge forecasting, particularly in coastal regions vulnerable to typhoon-induced events.
4.1. Risk Assessment of Extreme Storm Surges
Analyzing the risk of severe storm surges in Macao yields valuable insights into the vulnerability of coastal areas to high-impact events. Previous research [
89] has quantitatively evaluated the risk of life loss in compound floods resulting from storm surge and rainfall. This aligns with our findings, emphasizing the susceptibility of coastal regions, particularly the western coastal area exhibiting higher mortality rates. In a recent investigation, Long et al. [
90] focused on estimating the potential impacts of storm surge events in Macao, incorporating advanced modeling techniques and considering various environmental factors. Our analysis corroborates Macao’s vulnerability to extreme storm surge events during the monsoon season, revealing an escalating trend in the intensity and frequency of tropical cyclones. These observations underscore the imperative for targeted mitigation measures to address increasing risks. By constructing a comprehensive model that integrates historical data, meteorological factors, and advanced modeling techniques, our study transcends limitations observed in previous research. Crucially, our model substantially enhances accuracy and predictive capabilities, affirming its efficacy in evaluating and managing risks associated with extreme storm surges in Macao.
4.2. Adaptive System for Storm Surge Prediction and Mitigation
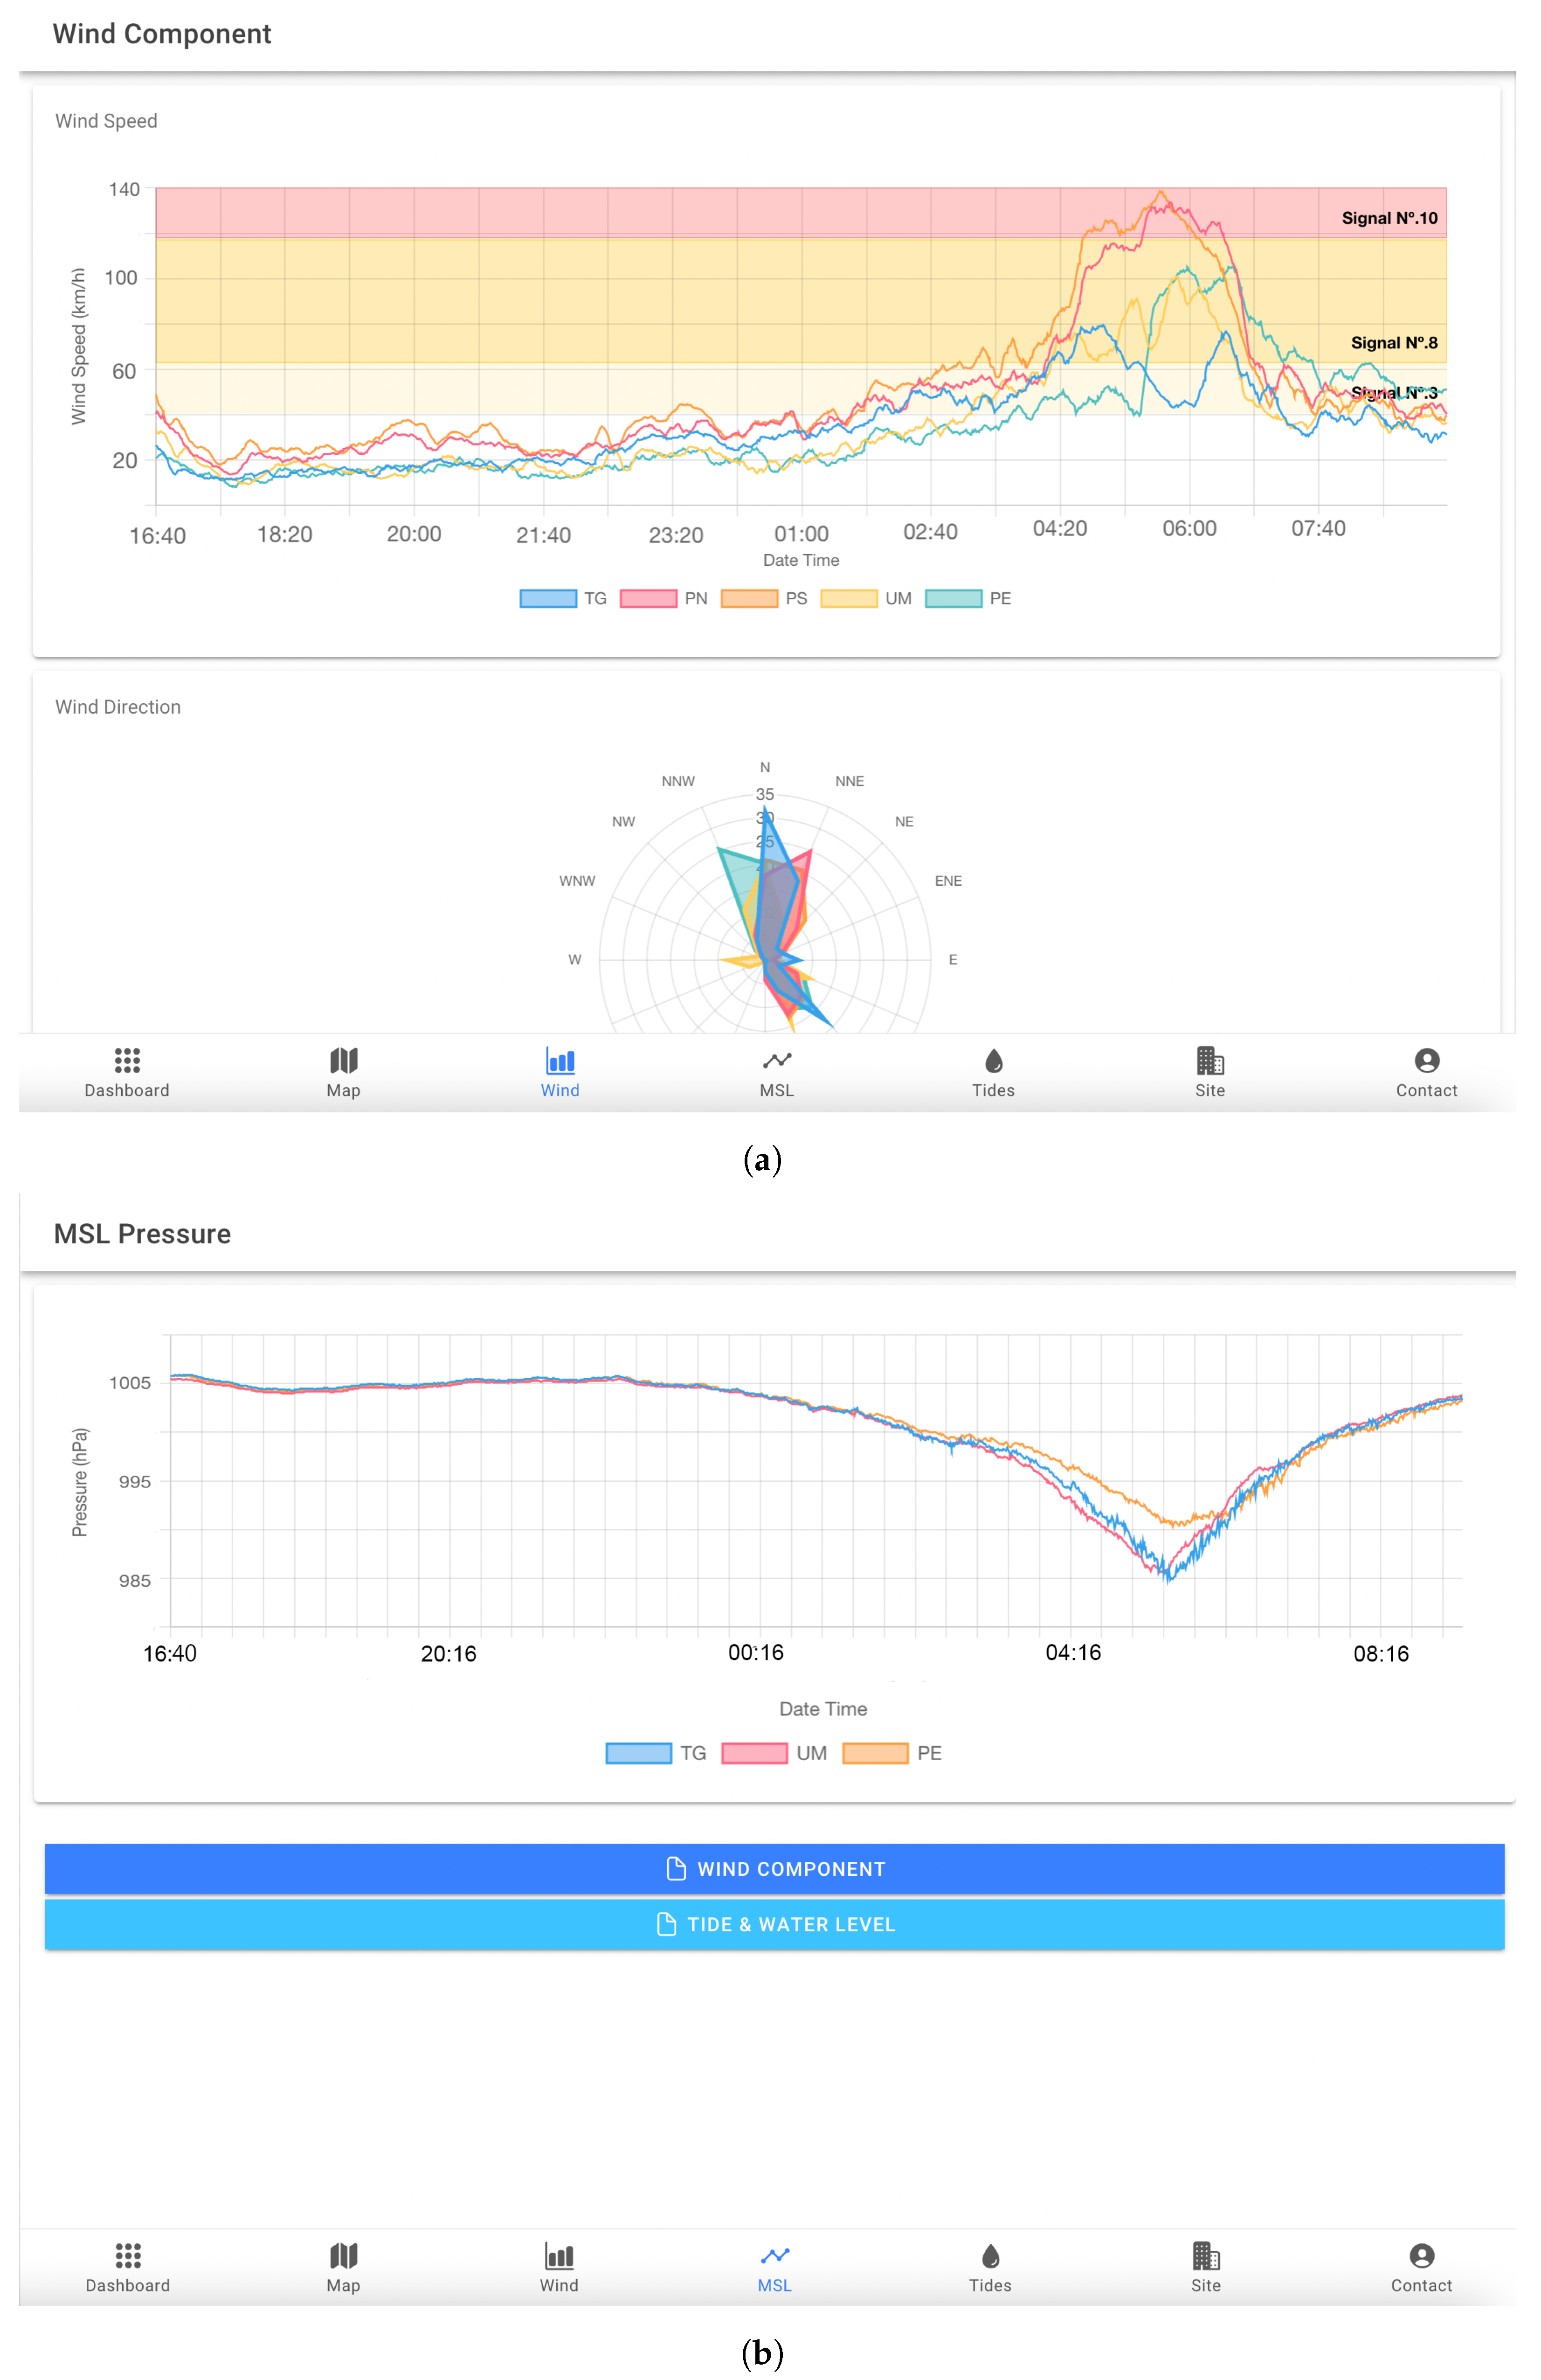
A sophisticated storm surge prediction and mitigation system, built on the Ionic Angular platform, harnesses state-of-the-art technologies to improve the visualization and comprehension of storm-related phenomena (
Figure 17). By employing Overleaf for map display and wind velocity movement, as well as Chart.js for chart visualization, this system provides an inclusive and user-friendly interface for storm surge prediction and mitigation. It seamlessly incorporates real-time alerts, tropical cyclone tracking (
Figure 18), visualization of wind and pressure patterns (
Figure 19), monitoring of tides and storm surges (
Figure 20), and accurate reference measurements. This equips decision makers, emergency managers, and coastal communities with the tools to make informed decisions, enhance preparedness initiatives, and efficiently mitigate the potential impacts of natural disasters.
A pivotal feature of this system is its real-time alert browser (
Figure 18a). Utilizing predictions generated by the BALSSA model, the alert browser empowers users to gauge the severity of potential storm surges. This timely information enables proactive measures for emergency managers, coastal communities, and stakeholders. Early warnings facilitate the implementation of evacuation plans, infrastructure reinforcement, and resource allocation, minimizing the impact on life and property. Furthermore, the tropical cyclone (TC) chaser component (
Figure 18b) enhances the system’s ability to visualize the movement tracks of tropical cyclones. This feature offers valuable insights into past and future trajectories, aiding in planning and response coordination. Analyzing the projected path allows authorities to efficiently allocate resources, pre-position emergency supplies, and issue evacuation orders to at-risk populations. Anticipating the cyclone’s trajectory contributes to more effective preparedness and response strategies.
The wind and pressure visualization tools (
Figure 19) offer a comprehensive grasp of the storm’s intensity and spatial distribution. This clarity enables targeted mitigation, structural reinforcement, advisory issuance, and coordinated emergency services. Accurate depictions of wind (
Figure 19a) and pressure (
Figure 19b) patterns enhance situational awareness, aiding decision making. The tide option (
Figure 20a), incorporating historical measurements and future predictions, plays a crucial role in anticipating storm surges. Monitoring tidal patterns and anomalies provides vital information about potential water level rises, enabling timely warnings, evacuation plans, and prioritized protective measures for at-risk coastal regions. The reference site measurement component (
Figure 20b) ensures precise data for comparison and verification, instilling confidence in the system’s predictions and recommendations.
The adaptive system represents a significant advancement in visualizing and understanding storm-related phenomena. It integrates diverse functionalities, including real-time alerts, tropical cyclone tracking, wind and pressure pattern visualization, tide and storm surge monitoring, and accurate reference measurements. This comprehensive platform empowers users to make informed decisions, strengthen preparedness, and mitigate the consequences of natural disasters. By seamlessly integrating these components, the system facilitates proactive strategies, swift responses, and effective mitigation of storm surge impacts, safeguarding lives and minimizing property damage.
4.3. Factors Contributing to Storm Surge Risk and Disasters in Macao
Macao, located on China’s southern coast, faces inherent risks from storm surges and associated disasters due to its geographical vulnerability and frequent occurrence of tropical cyclones and typhoons. Identifying and examining the key factors contributing to storm surge risks in Macao is crucial. This understanding enables policymakers, urban planners, and disaster management authorities to formulate effective strategies, mitigate risks, strengthen preparedness measures, and ensure the safety of the coastal region and its residents. Factors contributing to storm surge risk and disasters in Macao include:
Geographical Vulnerability: Macao’s southern coastal location along the South China Sea heightens its susceptibility to storm surges, particularly in the low-lying western and north-western regions.
Tropical Cyclones and Typhoons: Frequent encounters with tropical cyclones and typhoons subject Macao to strong winds, intensifying the risk of significant storm surges. Anticipated increases in the frequency and intensity of these weather events due to climate change further amplify the threat.
Bathymetry and Topography: Macao’s shallow coastal waters and low-lying terrain enhance the impact and propagation of storm surge waves, influencing inundation levels and associated damages.
Sea Level Rise: Climate-induced rising sea levels elevate the baseline for storm surge events in Macao, heightening the vulnerability to flooding and inundation.
Coastal Development and Infrastructure: Urbanization, land reclamation, and critical infrastructure in coastal areas disrupt natural drainage, impeding water flow and elevating vulnerability to storm surge impacts.
Population Density: Macao’s high population density in low-lying coastal zones exposes it to increased flood hazards, infrastructure damage, and threats to public safety, playing a pivotal role in the severity of storm surge disasters.
Understanding and considering these key factors are crucial for assessing and managing the risk of storm surges and disasters in Macao. By incorporating these factors into risk assessment models, urban planning, and disaster management strategies, authorities can work towards mitigating the impacts and enhancing the resilience of the coastal region.
5. Final Remarks and Future Work
5.1. Research Conclusions
In conclusion, our research presents BALSSA, an innovative LSTM model featuring bidirectional attention mechanisms, tailored for precise forecasting of sea water level anomalies during storm surges in the South China Sea region. The incorporation of bidirectional LSTM layers and attention mechanisms yields a substantial enhancement in prediction accuracy, effectively capturing the intricate temporal dynamics inherent in storm systems, as substantiated by the results.
BALSSA’s training process drew upon a comprehensive dataset, amalgamating meteorological and tide level data from 77 typhoon incidents in Macao spanning 2017 to 2022. A novel aspect of our approach involves considering tendency changes in meteorological parameters, such as wind velocity and atmospheric pressure, variables previously overlooked in similar studies. Rigorous evaluation against diverse machine learning and deep learning models consistently affirms the superior performance of BALSSA, yielding notably more accurate forecasts of storm surge magnitude and timing. Remarkably, BALSSA attains high accuracy, with MAE and RMSE values of 0.0287 m and 0.0357 m, respectively. Additionally, the model demonstrates excellent performance in predicting water levels with minimal error for up to 72 h. These results underscore the practical significance of BALSSA, enabling decision makers to formulate effective disaster risk reduction strategies, encompassing early warning systems and evacuation plans, to safeguard lives during natural disasters. Moreover, this research contributes significantly to the fields of meteorology, climate extremes, and climate change by providing accurate predictions of storm surges and enhancing the understanding of their impacts on coastal regions. The forecasts generated by BALSSA facilitate the identification and assessment of potential risks associated with storm surges, empowering decision makers to mitigate the adverse effects of climate change on vulnerable coastal communities. The integration of BALSSA into the adaptive system developed in this research enhances its monitoring and response capabilities, furnishing real-time information for improved decision making and resource allocation.
This research signifies a notable stride forward in storm surge prediction, showcasing BALSSA’s exceptional accuracy and adept handling of the complexities inherent in storm system dynamics. By providing precise storm surge predictions, this study contributes to our comprehension of weather, climate extremes, and climate change, offering decision makers essential tools to mitigate these events’ impacts on coastal communities. The adaptive system developed for BALSSA enhances the practical applicability of this research. Future endeavors should explore additional data features and validate the model’s effectiveness across diverse locations globally. The potential for ongoing research in this field is expansive, holding the promise of substantial progress in forecasting and mitigating the consequences of natural disasters.
5.2. Limitations and Future Directions of Research
While this study sheds light on storm surge risk in Macao, it recognizes limitations and suggests future research directions. The reliance on existing literature and data introduces potential accuracy, coverage, and relevance constraints, impacting this study’s findings. Future research should prioritize enhanced data collection and analysis, incorporating localized data on historical storm surge events, bathymetric measurements, and socio-economic data. A more comprehensive understanding can be achieved by exploring potentially overlooked factors, quantitatively assessing their importance, and integrating modeling techniques. Moreover, addressing climate change impacts, developing integrated coastal zone management strategies, and engaging stakeholders through decision support systems are crucial directions for more accurate assessments and enhanced coastal resilience in Macao.


