Article

Optimization of a Do-It-Yourself Air Cleaner Design to Reduce Residential Air Pollution Exposure for a Community Experiencing Environmental Injustices

1
Paul M. Rady Department of Mechanical Engineering, University of Colorado Boulder, 1111 Engineering Drive, Boulder, CO 80309, USA
2
Environmental Engineering Program, University of Colorado Boulder, 4001 Discovery Drive, Boulder, CO 80302, USA
*
Author to whom correspondence should be addressed.
Current adress: Department of Psychological and Brain Sciences, University of California Santa Barbara, Santa Barbara, CA 93106, USA.
Atmosphere 2023, 14(12), 1734; https://doi.org/10.3390/atmos14121734
Submission received: 25 September 2023 / Revised: 11 November 2023 / Accepted: 22 November 2023 / Published: 25 November 2023
(This article belongs to the Section Air Quality)

Abstract

:
The large-scale deployment of Do-it-yourself (DIY) air cleaners, especially in communities that historically bear the brunt of air pollution exposure-related injustices, provides communities a cost-effective option to reduce personal indoor exposure to particulate matter. In this study, we developed nine air cleaner prototypes, altering filter depth and the number and type of filters, and compared their PM2.5 removal effectiveness and maintenance-related parameters prior to deployment in North Denver, Colorado homes. Prototypes containing multiple high efficiency particulate air filters with a minimum reporting value of 13 (MERV13) had higher clean air delivery rates (CADR, >300 m3 h−1) compared to prototypes using a single filter (100–200 m3 h−1), but single-filter designs had comparable values of CADR normalized by initial and annual operating costs. Based on performance, cost, build time, and feedback from the community regarding concerns related to volatile organic compound exposure, the selected prototype (P9) used a combination of an activated carbon filter and single MERV13 filter with a 10.16 cm (4-inch) depth. Following this assessment, 120 of the selected air cleaner prototypes were built and deployed in homes around the communities in North Denver for two separate cohorts; feedback regarding their usage over the course of the deployment showed that in addition to the increased noise levels perceived by the participants, factors such as cold air flow from the air cleaner impacting the thermal comfort and aesthetics of the design reduced their usage time in homes. Future designs of DIY air cleaners could incorporate this feedback to help design improved features such as quieter air cleaners and real-time pollutant monitoring feedback to prompt users to keep them operational at all times of the day.

1. Introduction

Fine particulate matter (PM2.5) exposure has been linked to several adverse health effects including cardiovascular and pulmonary system-related comorbidities [1,2]. These health effects lead to increased mortality rates among the general population depending upon the intensity and duration of exposure [3,4]. In the United States alone, ~300,000 deaths in 2012 could be attributed to total PM2.5 exposure, whereas globally this number rises to more than 4 million deaths as per the 2019 risk assessment report by the State of Global Air [5,6]. Another class of air pollutants, volatile organic compounds (VOCs) that are often generated alongside particulate matter (PM) through various indoor and outdoor sources, could also pose serious health risks, including chronic respiratory diseases and even cancer [7,8,9,10]. Certain VOCs also cause odor-related health concerns and can impact community well-being [11,12].
Health burden risks associated with air pollution exposure are disproportionately higher for populations residing in low-income neighborhoods (net income being more than 60% lower than that of the national median) [3,13,14,15,16,17]. Reasons for these disparities include the proximity of these neighborhoods to increased traffic activity and industrial areas, outdated residential building designs that often lead to higher air change rates with unfiltered outdoor air, and a higher prevalence of tobacco smoking indoors [16,18,19,20,21]. Nowadays, such neighborhoods are referred to as Environmental Justice impacted communities (EJ communities) to highlight the collective impact of historical or ongoing social, economic, and environmental injustices resulting in disproportionately higher pollution exposure levels for the residents in these communities as compared to the other sections of society [22]. Some of the governments around the world have tried to tackle these issues by retrofitting residential buildings in similar neighborhoods with energy efficiency improvements (such as increasing air tightness and installing energy efficient appliances) to address the issue of fuel poverty and improve comfort of the occupants [23,24,25]. However, such improvements can still have negative effects on indoor air quality, as emissions from daily indoor activities (e.g., cooking, cleaning, smoking, and personal care product use) might result in elevated PM and VOC concentrations indoors over longer durations due to reduced ventilation rates [19,21,26].
There is an urgent need to find effective intervention measures for exposure reduction that can be readily used by residents in EJ communities, especially indoors where people in general spend the majority of their daily time (~90%) [27]. Since the residents of these communities often find themselves limited in their options when it comes to combating the high levels of pollutants in ambient air, they could benefit from adopting commonly used indoor exposure mitigation techniques to reduce their exposure levels. A potential solution could be installing air cleaning capability indoors, as the increased air changes associated with air cleaner usage could lead to ~70% reduction in PM exposure levels [28,29]. While the use of commercial-grade portable air cleaners (PACs) could be an effective technique for mitigating indoor PM2.5 exposure, due to the increased cost burden with long-term PAC use (high initial purchase cost and regular maintenance such as the replacement cost of manufacturer-recommended filters), the widespread adoption of this intervention in EJ neighborhoods might be a difficult initiative to accomplish [30,31,32,33,34,35,36].
Do-it-yourself (DIY) PAC usage is one cost-effective alternative that might benefit these communities. A DIY air cleaner prototype usually consists of a fan attached to a high filtration efficiency such as MERV13 or high-efficiency particulate air (HEPA) filter(s); early designs were developed in the 2000s to reduce indoor exposures because of overwhelming air pollution episodes in China [37]. More recently, the interest in DIY cleaner development was renewed in light of the COVID-19 pandemic; several new modifications have been proposed by the scientific community for use in different indoor environments [38,39,40]. Several variations of DIY air cleaner designs have been characterized for reducing indoor PM levels and specifically for achieving increased effective air change rates for reducing viral transmission through respiratory aerosol and reducing exposure from wildfires [29,41,42,43]. Results from previous studies in different lab and real-life chamber conditions have shown promising results for their use against mitigating PM2.5 exposure and reducing VOCs levels, albeit with an inherent caveat of the increased noise associated with their use [41,44,45,46]. Thus, the mass-scale adoption of these DIY air cleaner in EJ communities could help solve few of the key challenges associated with addressing exposure disparities.
In this study, we first tested nine different DIY air cleaner designs in a lab setting to optimize the air cleaning capacity, and minimize cost, build time, and physical size. We then built and deployed ~120 DIY PACs of the most suitable option in homes in EJ communities in North Denver (Globeville, Elyria-Swansea, Cole, and Clayton) located near interstate highways and industrial areas, as part of the Social Justice and Environmental Quality in Denver study (SJEQ-D, https://www.sjeqdenver.com/, accessed on 1 April 2023). Following the PAC deployment for two different study periods (cohorts) spanning the Fall and Winter seasons of 2022–2023, feedback from a subset of participants was collected with surveys and phone interviews regarding PAC usage and design issues that future DIY PACs should incorporate to ensure their use in disproportionately impacted neighborhoods.

2. Methods

2.1. Experimental Design

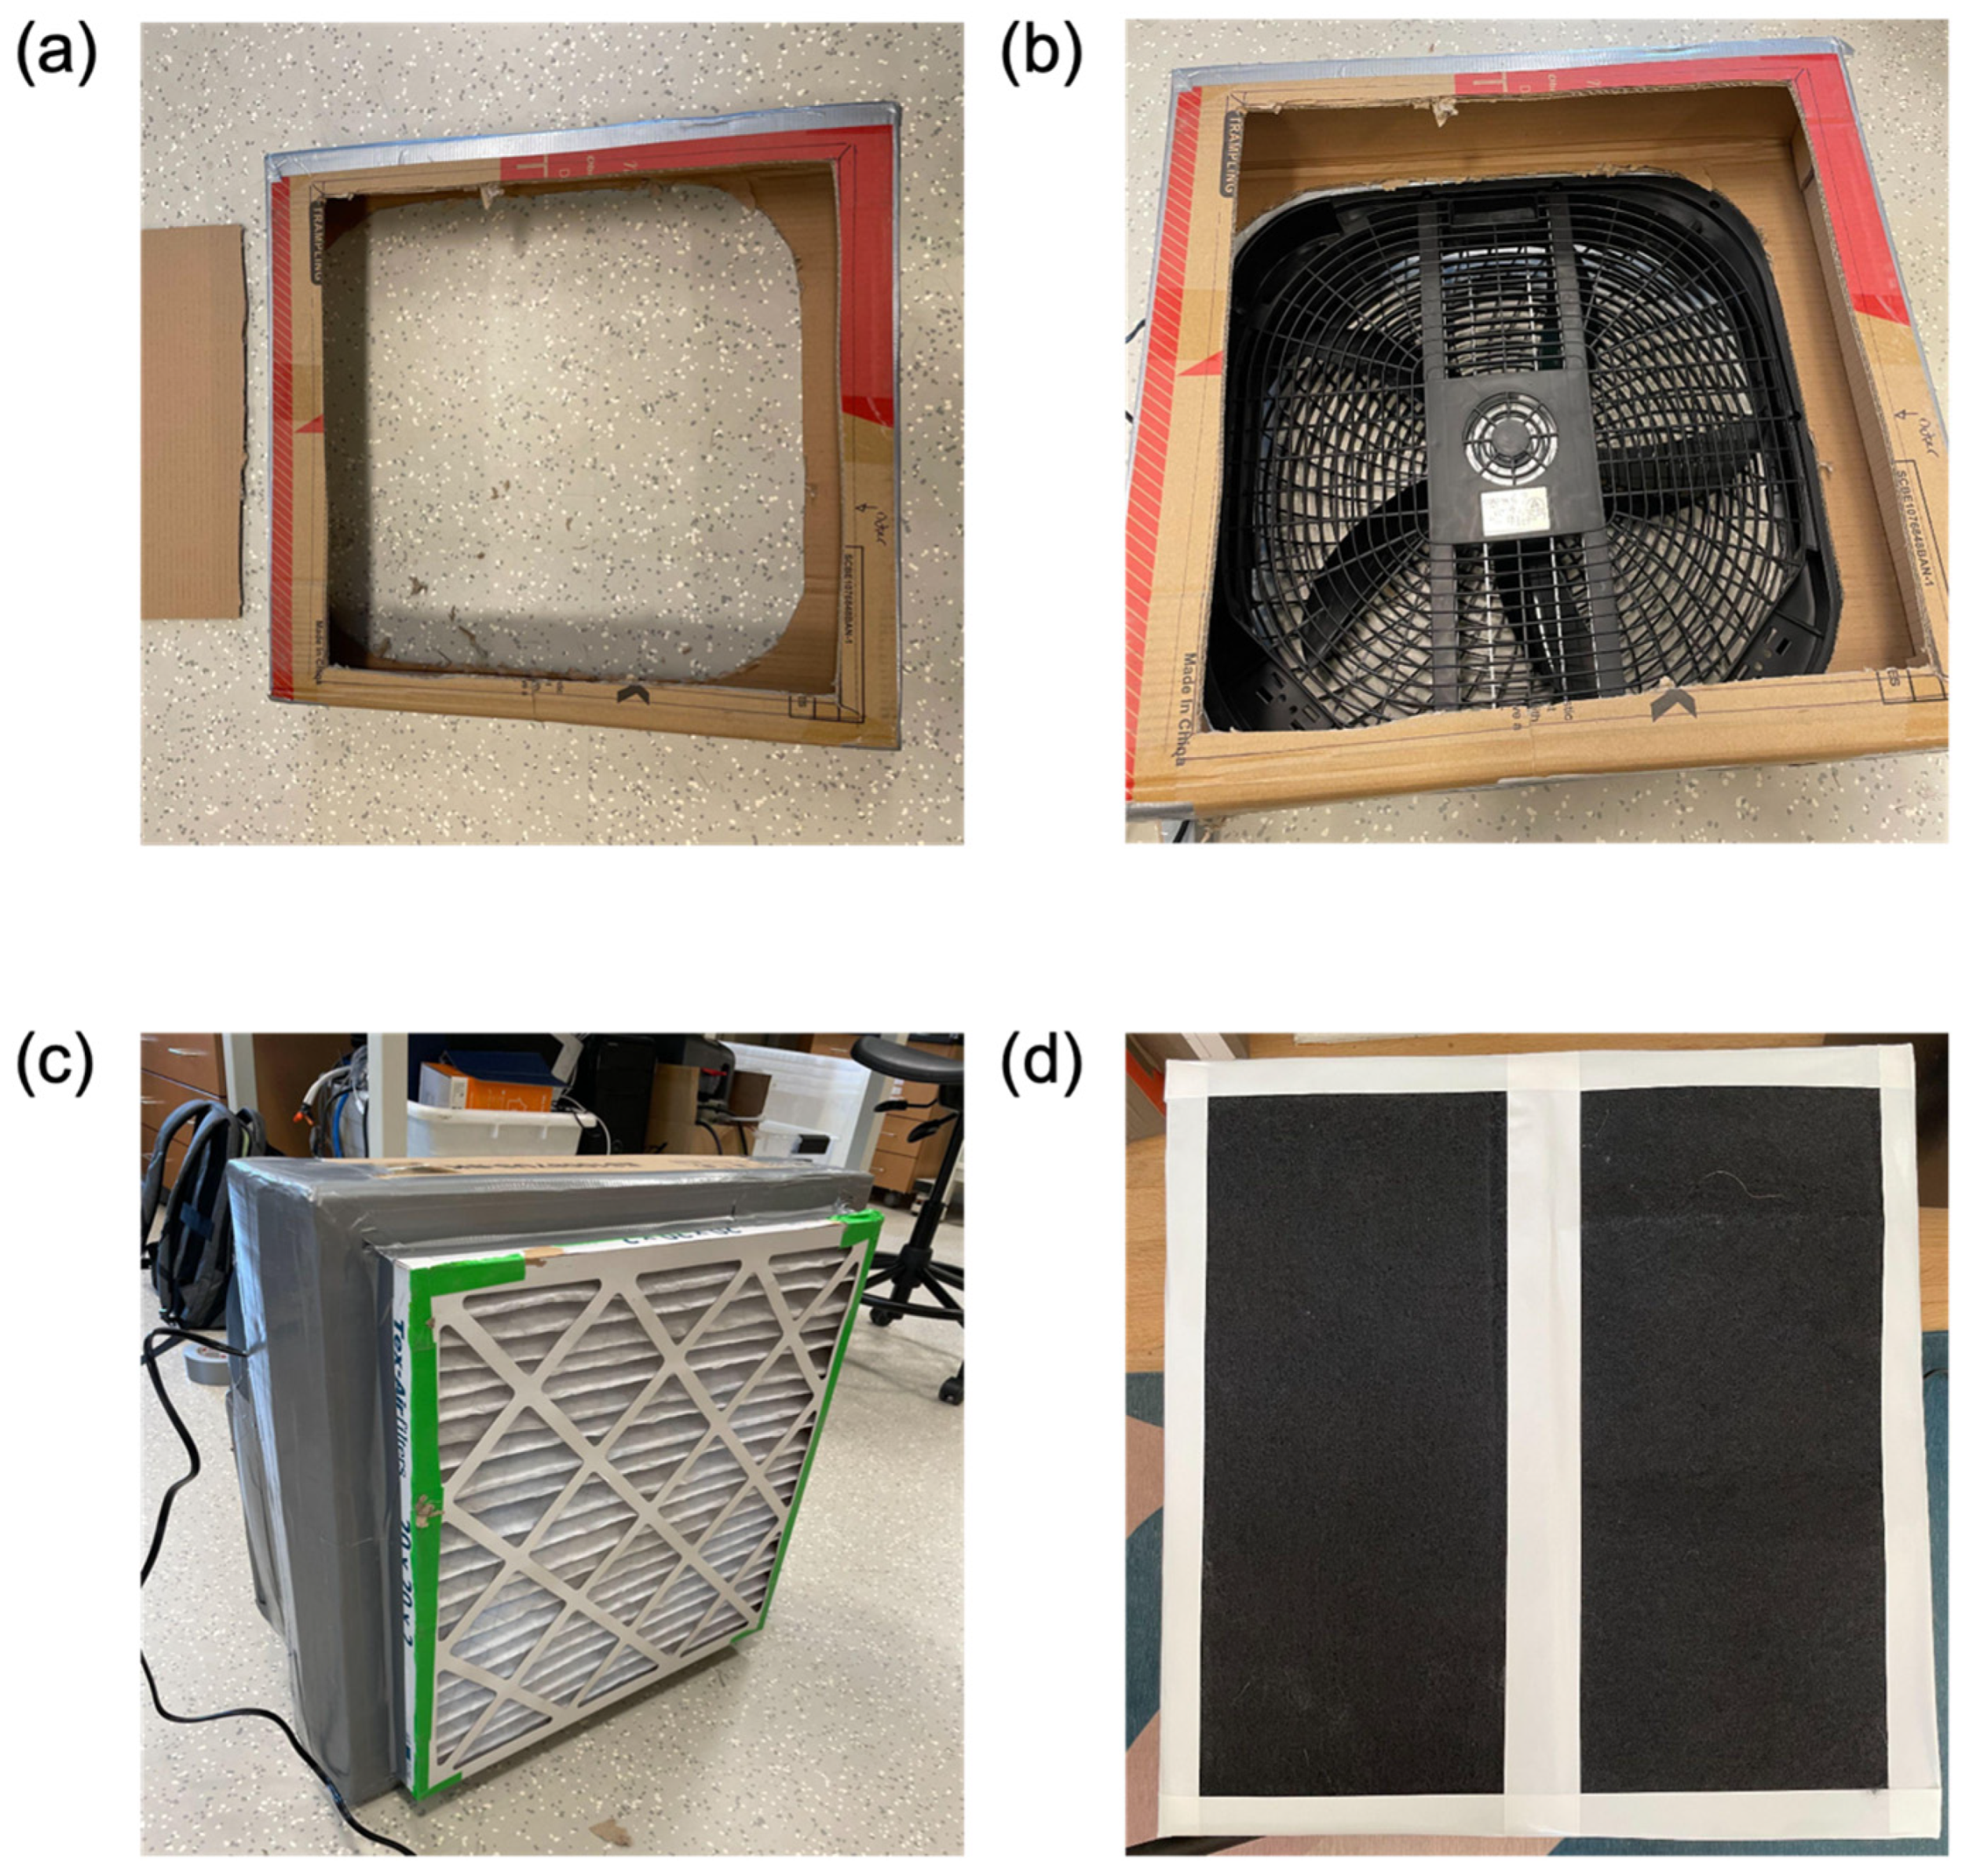
2.1.1. DIY Air Cleaner Prototypes

DIY air cleaner prototypes (P1-P9) were assembled with a box fan (0.54 m × 0.53 m × 0.17 m, Costway, Model ES10087US-BK, China) duct taped to one, two, or four 50 × 50 cm MERV-13 filters (20 × 20 inch Tex-Air Filters, AirRelief Technologies, Inc., Austin, TX, USA). Table 1 summarizes the differences in the individual components among the nine different prototypes used in the study. The two- and four-filter designs used 5 cm thick (2 in) filters, and one-filter designs were tested with 2.5, 5, and 10 cm filter depths. An activated carbon (AC) filter was taped to the MERV-13 filter for one prototype (P9) to address odor and VOC exposure concerns from the North Denver community members. Six prototypes (P1-P6) used a fan shroud, which has been shown to improve airflow around the corners of the fan by preventing air recirculation [41,45]. Detailed steps for building the prototypes are included in the Supplementary Materials (Section S1, Figures S1–S6).
Prototype P1 was made from four MERV13 air filters oriented vertically and attached to a box fan and square cardboard bottom, forming a cube. For this design, the fan was placed on top and oriented in the horizontal direction, facing upwards. Prototype P2 was built using a vertical triangular prism design, with filters on two sides and the fan on the third side. Two cardboard triangles were used to fill the gaps on the top and bottom of prototype P2. Prototypes P3, P4, and P5 had varied filter depths (2.5, 5, and 10 cm, respectively), while maintaining a consistent design using one filter attached to the fan, with both oriented vertically.
A uniform gap of 15 cm between the MERV13 filter and the box fan was added to these designs to ensure a better seal and airflow. The gap was built with a cardboard separator, made from either the fan’s shipping box or four pieces of cardboard duct-taped together. The shipping box for the fan was used as the cardboard separator (fan box separator) to reduce the overall build time when compared to the four pieces of cardboard separator (DIY separator), though the DIY separator did not have an extra internal air volume like the fan box separator. Prototypes P5, P6, P7, and P8 characterized the effect of the different separator types while including and excluding a fan shroud. Prototype P9 was identical to P8 but included a sheet of AC taped over the MERV-13 filter to test the effect of adding AC on the VOC removal. Pictures of the components used for building P9 are included in Figure 1.

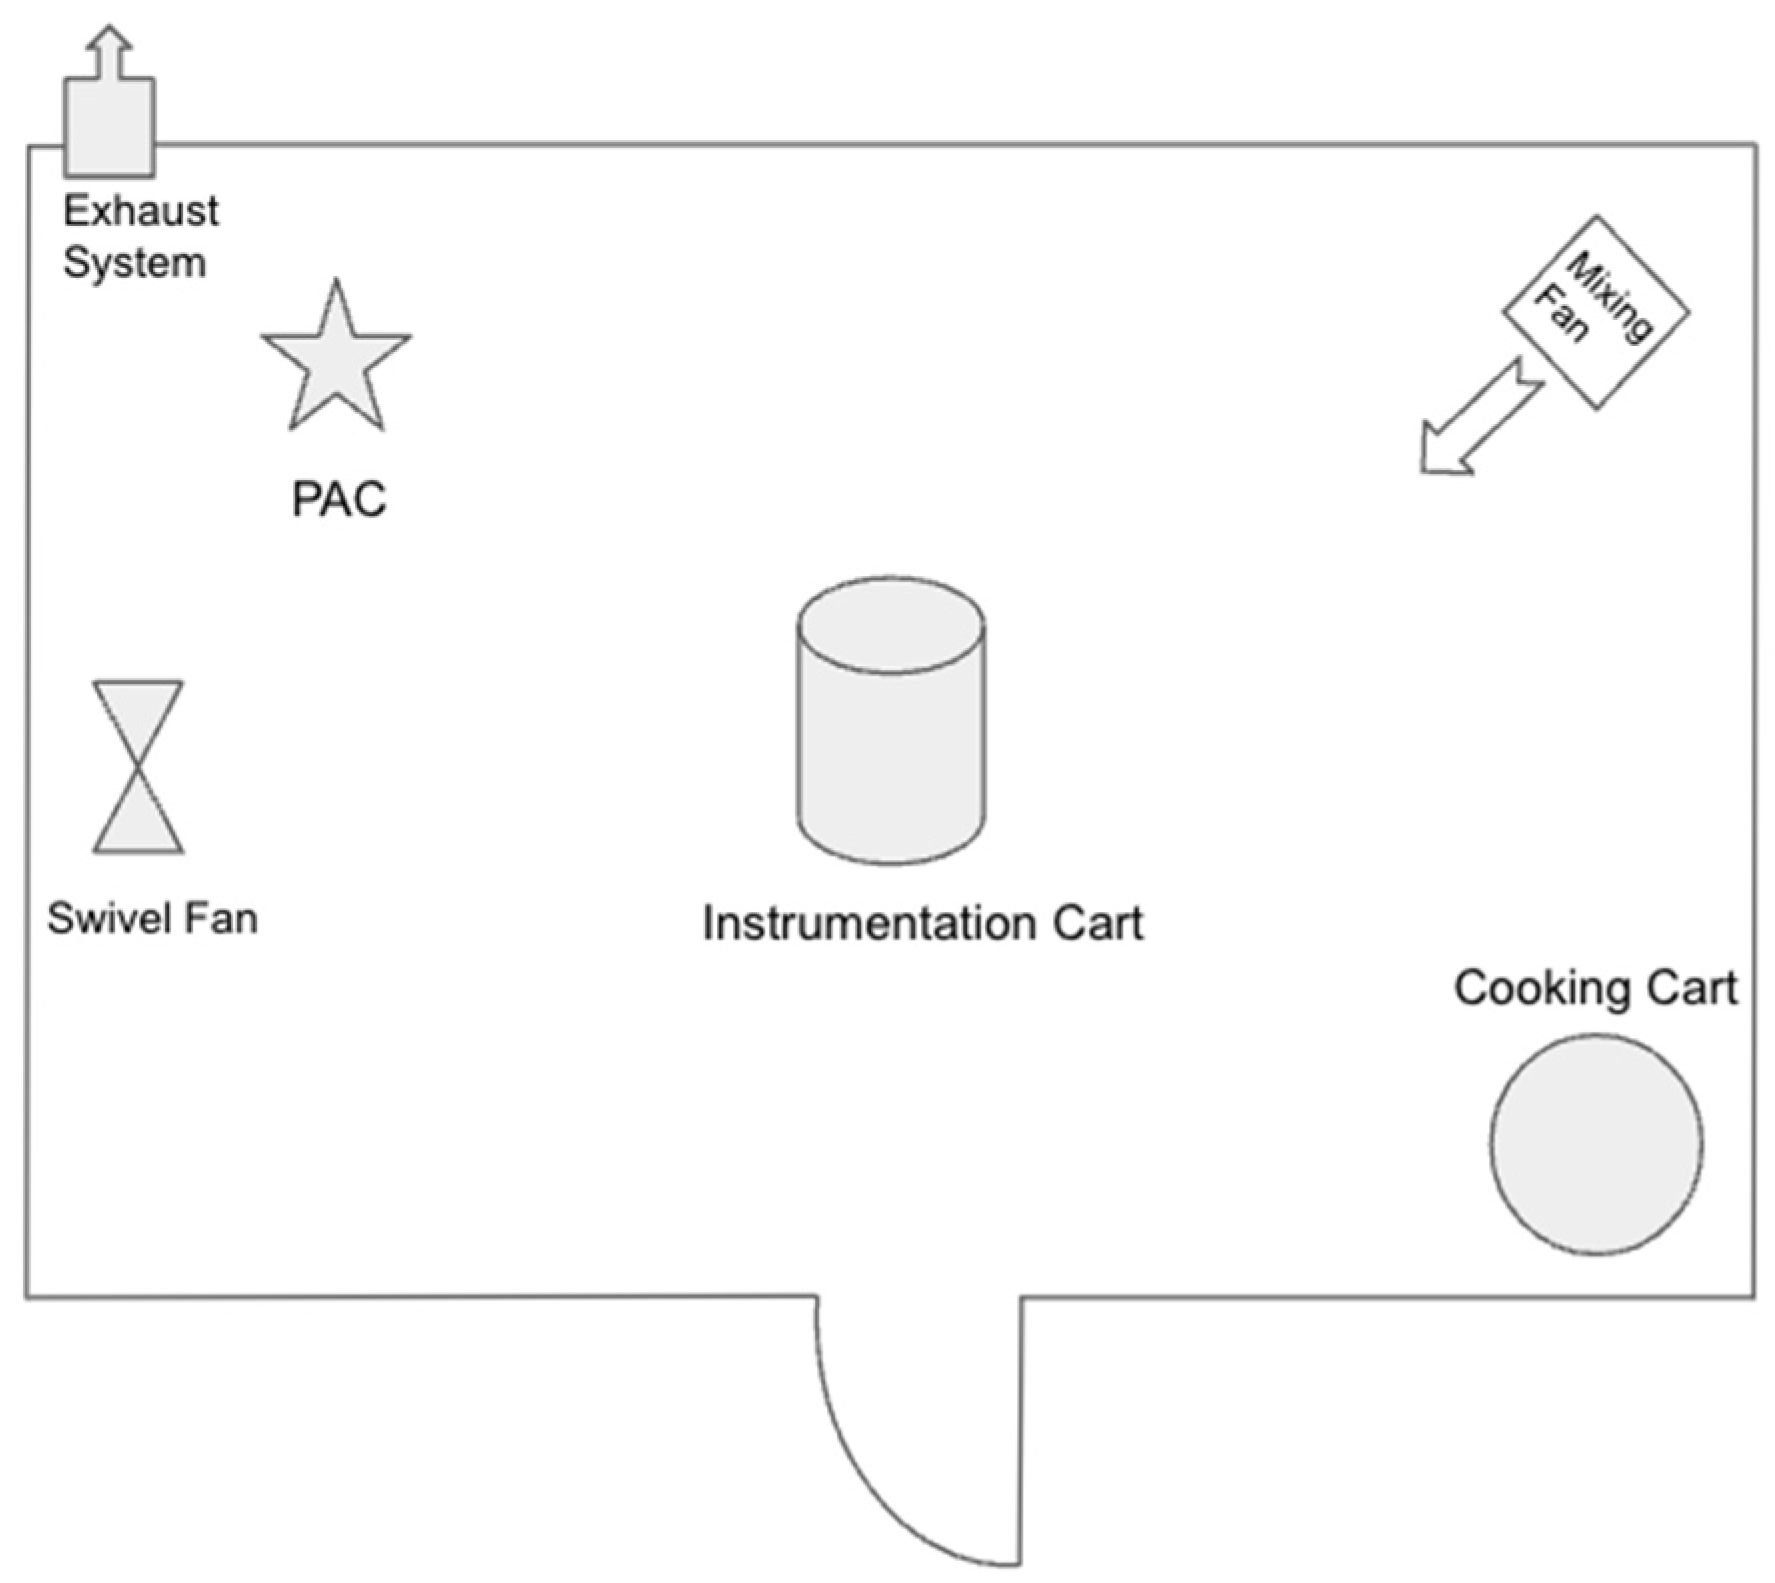
2.1.2. Setup and Testing Protocol

Particle removal rate tests were conducted in a sealed aerosol testing room (L × W × H = 3.1 m × 3.7 m × 3.3 m, volume of 37.9 m3) with a dedicated exhaust damper system turned on after each test to flush contaminants (Figure 2). Instruments were kept on a cart (height of 1 m) placed at the center of the room and cooking was conducted on a separate table in one of the corners. One box fan and a swivel fan were also used to promote mixing inside the test room.
Particle concentrations were measured using an Aerodynamic Particle Sizer spectrometer instrument (APS 3321, TSI St. Paul, MN, USA) and 2 identical consumer-grade air quality Atmotube Pro monitors with a Sensirion SP30 particulate matter sensor (ATM, Atmotech Inc., San Francisco, CA, USA) [47]. TVOC (total volatile organic compound) concentrations were measured using a Graywolf instrument with a photoionization detector sensor (GrayWolf Direct Sense II, GrayWolf, Shelton, CT, USA). Prior to each test, background particle concentrations were monitored for 15 min. To produce aerosols found in the indoor environment, the experimental protocol consisted of cooking hamburger patties with vegetable oil on a frying pan over a coil hot plate. Once PM2.5 concentrations reached 800–1300 #/cc or upwards of 300 µg/m3 (for the APS and ATM instrumentation, respectively) and TVOC concentrations reached 0.1–3.3 ppm peak levels, the cooking process was terminated, the researcher removed the cooking materials, and left the room immediately after switching on an air cleaner prototype at the highest fan speed setting (level 3). Particle reduction rates were then observed for 30–50 min. A background removal rate test was conducted, in which no PAC was operated to measure the removal rate due to uncontrolled ventilation and deposition. Between tests, a commercial-grade portable air cleaner with HEPA and activated carbon filters (Oreck Air Response, Oreck Corporation, Nashville, TN, USA) was used to clean the air of the test room before the start of a new experiment.
The aerosol number distribution data between the 0.5–5 μm size range from the APS was used for quantifying size-resolved PM removal rates, based on recommendations from a similar study on the evaluation of DIY air cleaner effectiveness in lab environments [41]. PM2.5 data from the two ATM monitors were used to assess whether these types of consumer-grade monitors could be used for similar citizen science projects that do not have access to lab-grade instruments. The effect of the AC filter on TVOC removal was assessed for a selection of prototypes (P4, P5, P6, P7, and P9).

2.2. Data Analysis

2.2.1. Study Parameters

We compared the performance of different DIY air cleaner prototypes in terms of the clean air delivery rate (CADR), initial cost, CADR normalized by initial and annual cost, size, and ease of build. To estimate the CADR, the effective air changes per hour (eACH) for PM2.5, total particle counts, per particle size bin, and TVOC was calculated as the negative slope of the natural-log transformed concentration time series during the removal rate test. The average eACH from the control experiments was subtracted from PAC eACH values to remove the effect of background losses. The CADR was then calculated by multiplying the eACH with the chamber volume (37.9 m3). The build cost was estimated based on the initial cost of supplies that were purchased for building these prototypes, whereas the annual cost was estimated by adding the costs associated with the replacement of filters twice a year (assuming a replacement frequency of 3–6 months for the filters). Air cleaner size was quantified in terms of the floor area each prototype occupies, and the ease of build was a subjective parameter (easy, medium, hard, and very hard) based on the number of steps involved in building each prototype.

2.2.2. Survey Responses

A survey regarding DIY air cleaner usage by study participants was conducted as part of the SJEQ-D study (University of Colorado Boulder IRB Protocol #20-0318). Residents were recruited into the SJEQ-D study from the North Denver communities of Globeville, Elyria-Swansea, Cole, and Clayton. These neighborhoods were impacted by major construction activities associated with the interstate I-70 renovation project from about January 2019 to December 2022 and exist within a ~3 km radius of a major industrial activity hub that includes a pet food manufacturing plant, wastewater treatment facility, petroleum refinery, asphalt production, and a natural gas power plant. A map showing the location of these four neighborhoods is also given in Supplementary Materials File (Figure S7). These neighborhoods have been classified as disproportionately impacted per the interactive environmental justice tool prepared by the Colorado Department of Public Health and Environment (CDPHE EnviroScreen) [48]. Additional details regarding the sociodemographic data for the residents of these four neighborhoods derived from the CDPHE EnviroScreen Tool are in Table S1.
DIY air cleaner use was one of the interventions implemented in the SJEQ-D study to mitigate air pollution exposures in these communities. Participants were instructed to install and use DIY air cleaner prototypes on the highest fan setting in the kitchen or the living room of their home during two periods (cohorts): 1 October–10 November 2022 (Fall 2022 Cohort) and 20 February–20 March 2023 (Winter 2023 Cohort). Information regarding the number of homes in each neighborhood that used P9 protypes during the Fall and Winter Cohorts is given in Supplementary Materials (Table S2). PAC usage surveys were collected after each intervention period from a subset of participants (~50 in each cohort) who were participating in the personal exposure characterization aspect of the study and were instructed to wear a portable air quality personal exposure monitor throughout the two cohorts. In this survey, participants reported the percentage of the intervention period that air cleaners were turned on in increments of 25% over text messages. Participants also received calls from research team members regarding their general feedback and any suggestions over the PAC deployment period.

3. Results and Discussions

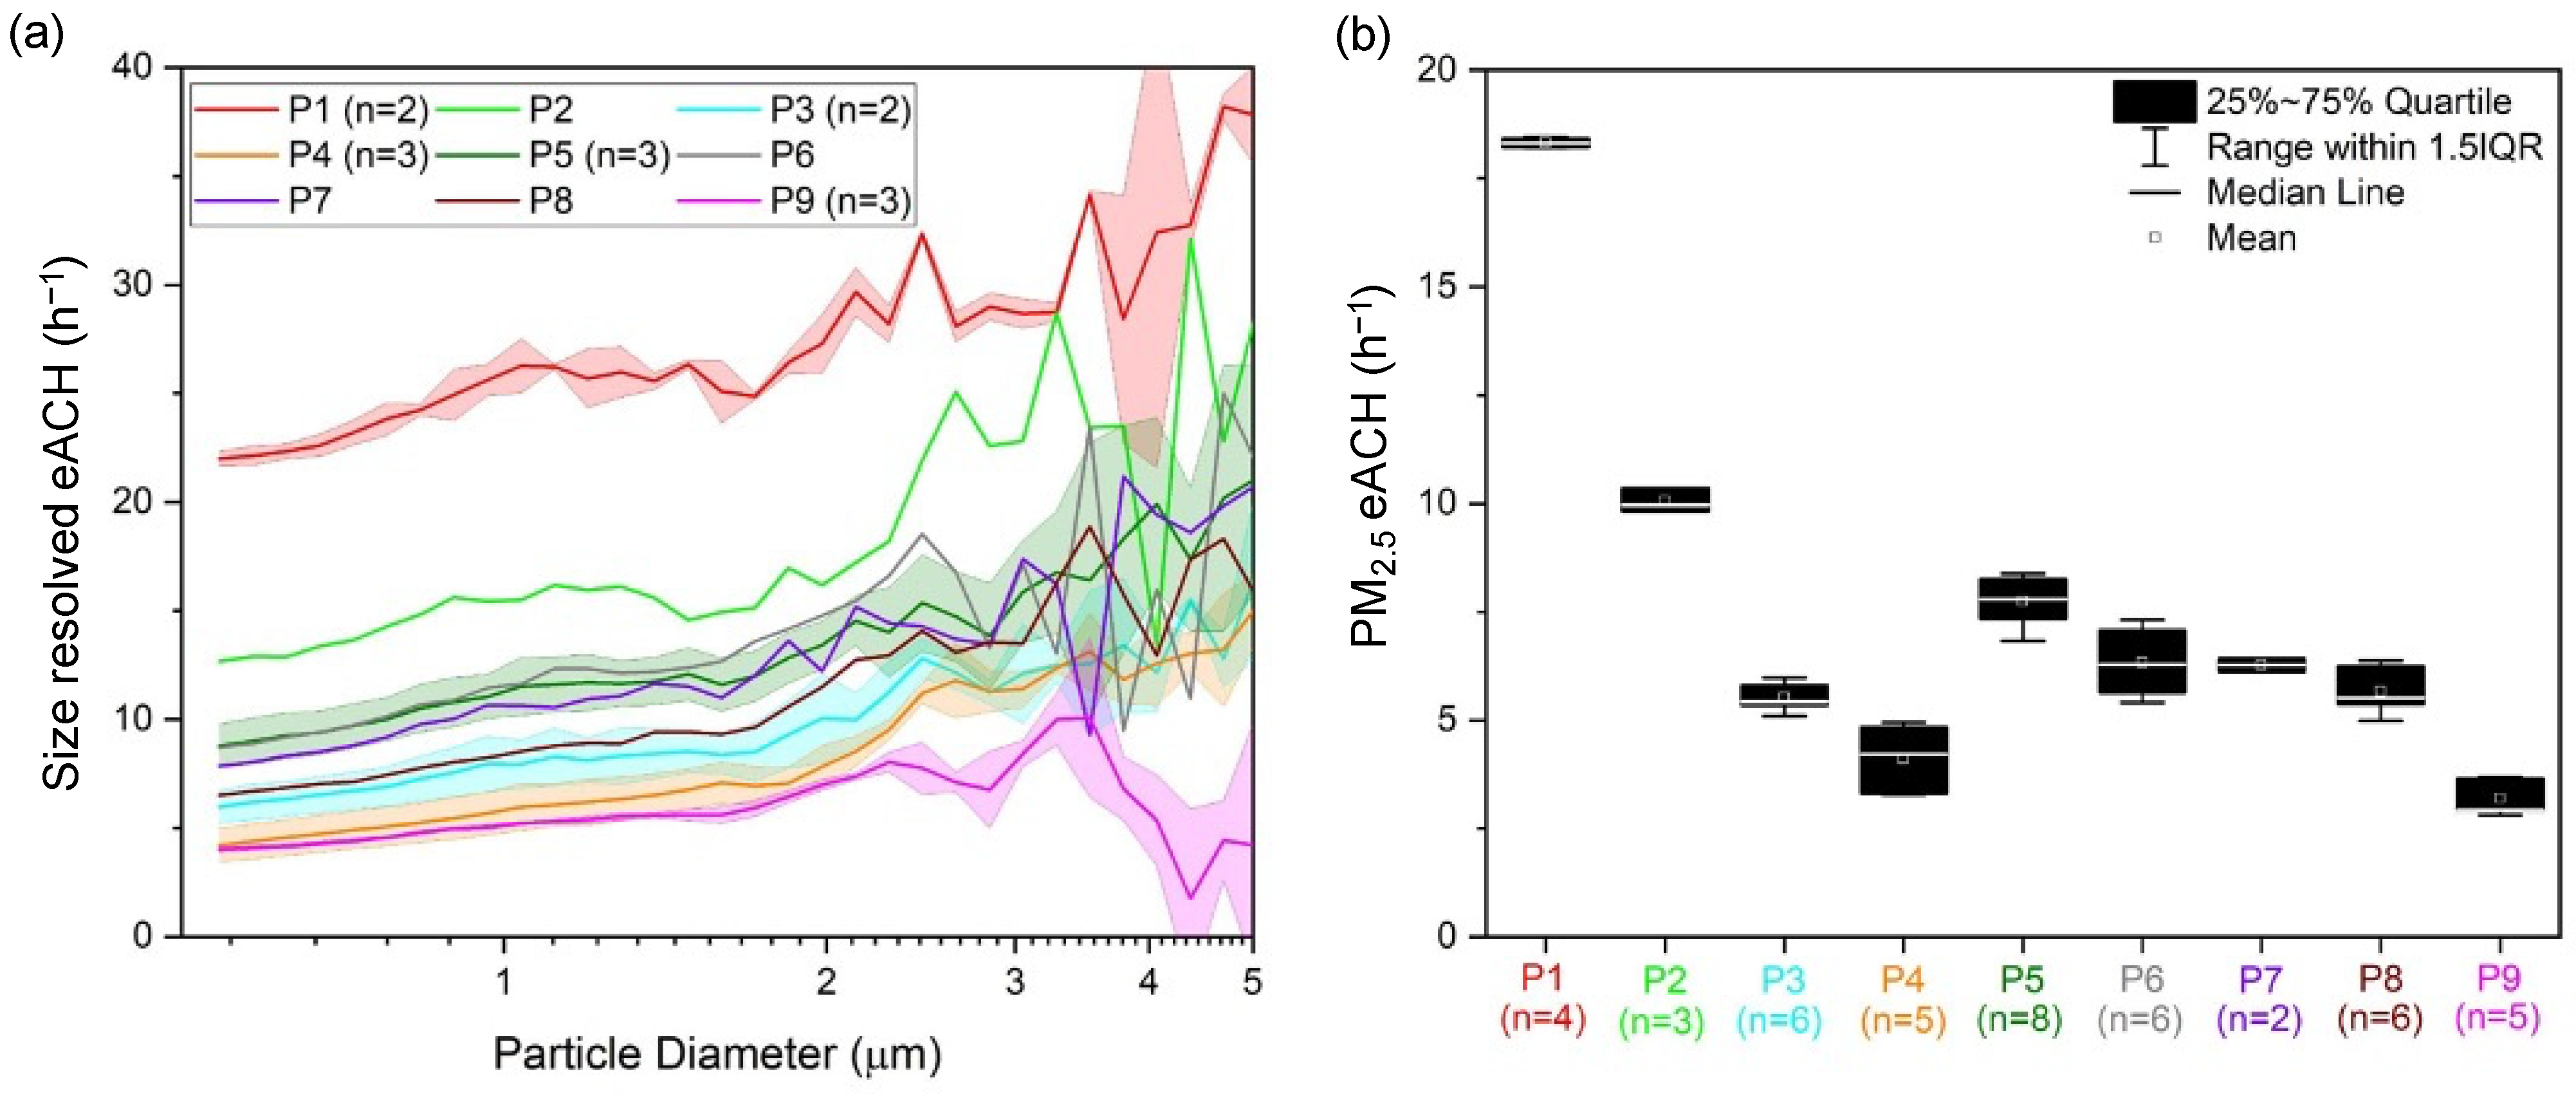
3.1. Pollutant Removal Rates

Size-resolved PM removal rates for each prototype calculated using the APS number distributions and the corresponding PM2.5 removal rates calculated from the ATMs are presented in Figure 3. Size-resolved PM removal rates show a slight upward trend as the particle size increases from 0.5 to 2.5 µm. However, for particles greater than 2.5 µm, the dataset starts to show increased noise that could be due to relatively high values calculated for background removal rates during control experiments (Figure S8).
All PAC prototypes increased the eACH above control conditions in the 4–32 h−1 range for particles sized between a 0.5 and 2.5 µm size range. P1 and P2 prototypes, with more than one filter, were associated with up to two times higher eACH values when compared to that of single-filter prototypes. Filter thickness also plays an important role in pollutant removal, as evidenced by a lower eACH estimated for P3 and P4 when compared to most of the other prototypes that also used a single-filter configuration but with a deeper MERV13 filter. The lowest average eACH was calculated for P9, likely due to the added activated carbon layer resulting in increased backpressure. The addition of this layer increased the TVOC removal rate by 0.7 h−1 and was the highest removal rate among all prototypes tested for the TVOC removal (Table S3).
PM2.5 removal rates calculated from the ATM dataset followed the same trends across air cleaners as the APS dataset. The median PM2.5 eACH value for P1 was the highest (18 h−1) followed by P2 (10 h−1); for the single-filter prototypes, the value ranged between 3 and 8 h−1, with P5 being associated with the highest value in the range and P9 with the lowest value. Because the ATMs are much easier to use and cost much less than research instruments for measuring airborne particulate matter compared to the APS, similar studies of air cleaners designed for a citizen science initiative could use the ATMs to determine the best air cleaner option. This is explained in greater detail in the next section, where we used the ATM data for a comparative analysis for the prototypes, since often during the study the APS availability was limited. However, it is also important to mention that many consumer-grade air quality monitors provide mass concentration data using an unknown algorithm that has been shown to exhibit nonlinear decay concentrations when compared to the APS number and volume distribution data; thus, results from these monitors should be used for a comparative analysis if their performance hasn’t been validated against a reference instrument [41].

3.2. Performance Comparison among Different Prototypes

Table 2 shows the performance comparison in terms of different parameters pertaining to their removal effectiveness and the build characteristics for all air cleaner prototypes used in the study. Prototypes with single filters had a comparable, or, in some cases, a higher value for the Average CADR/Annual Cost metric (2.4–8 m3 h−1 $−1) when compared with prototypes containing multiple MERV-13 filters (3.9–6.1 m3 h−1 $−1), which suggests that single-filter DIY prototypes could be used for mass deployment in communities where economic feasibility becomes a primary factor behind the wide-scale adoption of DIY air cleaners used for addressing air pollution exposure inequalities.
The highest average CADR values were calculated for prototypes involving four MERV-13 filters, P1 (709 m3 h−1) followed by P2 (389 m3 h−1), and the CADR values for the remaining single-filter prototypes varied between 100 and 300 m3 h−1 depending upon different components, including filter depth, shroud, separator type, and inclusion of the AC filter. The presence of the shroud led to a significant 1.5 h−1 increase in effective air change values (p < 0.1) when compared to tests for single-filter prototypes with no shroud, but it also increased the complexity of the build. These results agree with previous studies that have also shown that the presence of a shroud can lead to an improvement in CADR values due to the plugging of leaks around the fan [29,45]. Using the DIY box instead of the fan box increased eACH by 1.4 h−1 while increasing the number of steps involved in the final build. Adding a layer of AC led to an increase in TVOC removal rate but it also resulted in reduced CADR values for PM.
After testing, we chose P9 as the final air cleaner design because it satisfied most of the conditions that we were looking for; it addressed the air quality problems (mainly odor complaints) in their neighborhoods from the participants, it had the least number of steps involved in the construction to accommodate for the demand of building more than 100 prototypes with limited volunteer support, and it had a compact stackable design for easier transportation. However, these results show that if the ease of build and transport are not major limiting factors, then community outreach efforts could select other prototypes with different configurations that had higher CADR values and comparable costs. Note that the removal rate of particles below 0.5 microns was not quantified in this study. Therefore, a higher rating of MERV filters (HEPA filter) could be tested for deployment in areas of the world that are currently dealing with the issues of high ambient PM pollution. However, a higher MERV rating also results in increased backpressure. Thus, there would be a need to balance the removal effectiveness across particle sizes with eACH and with size-resolved testing for different MERV ratings.

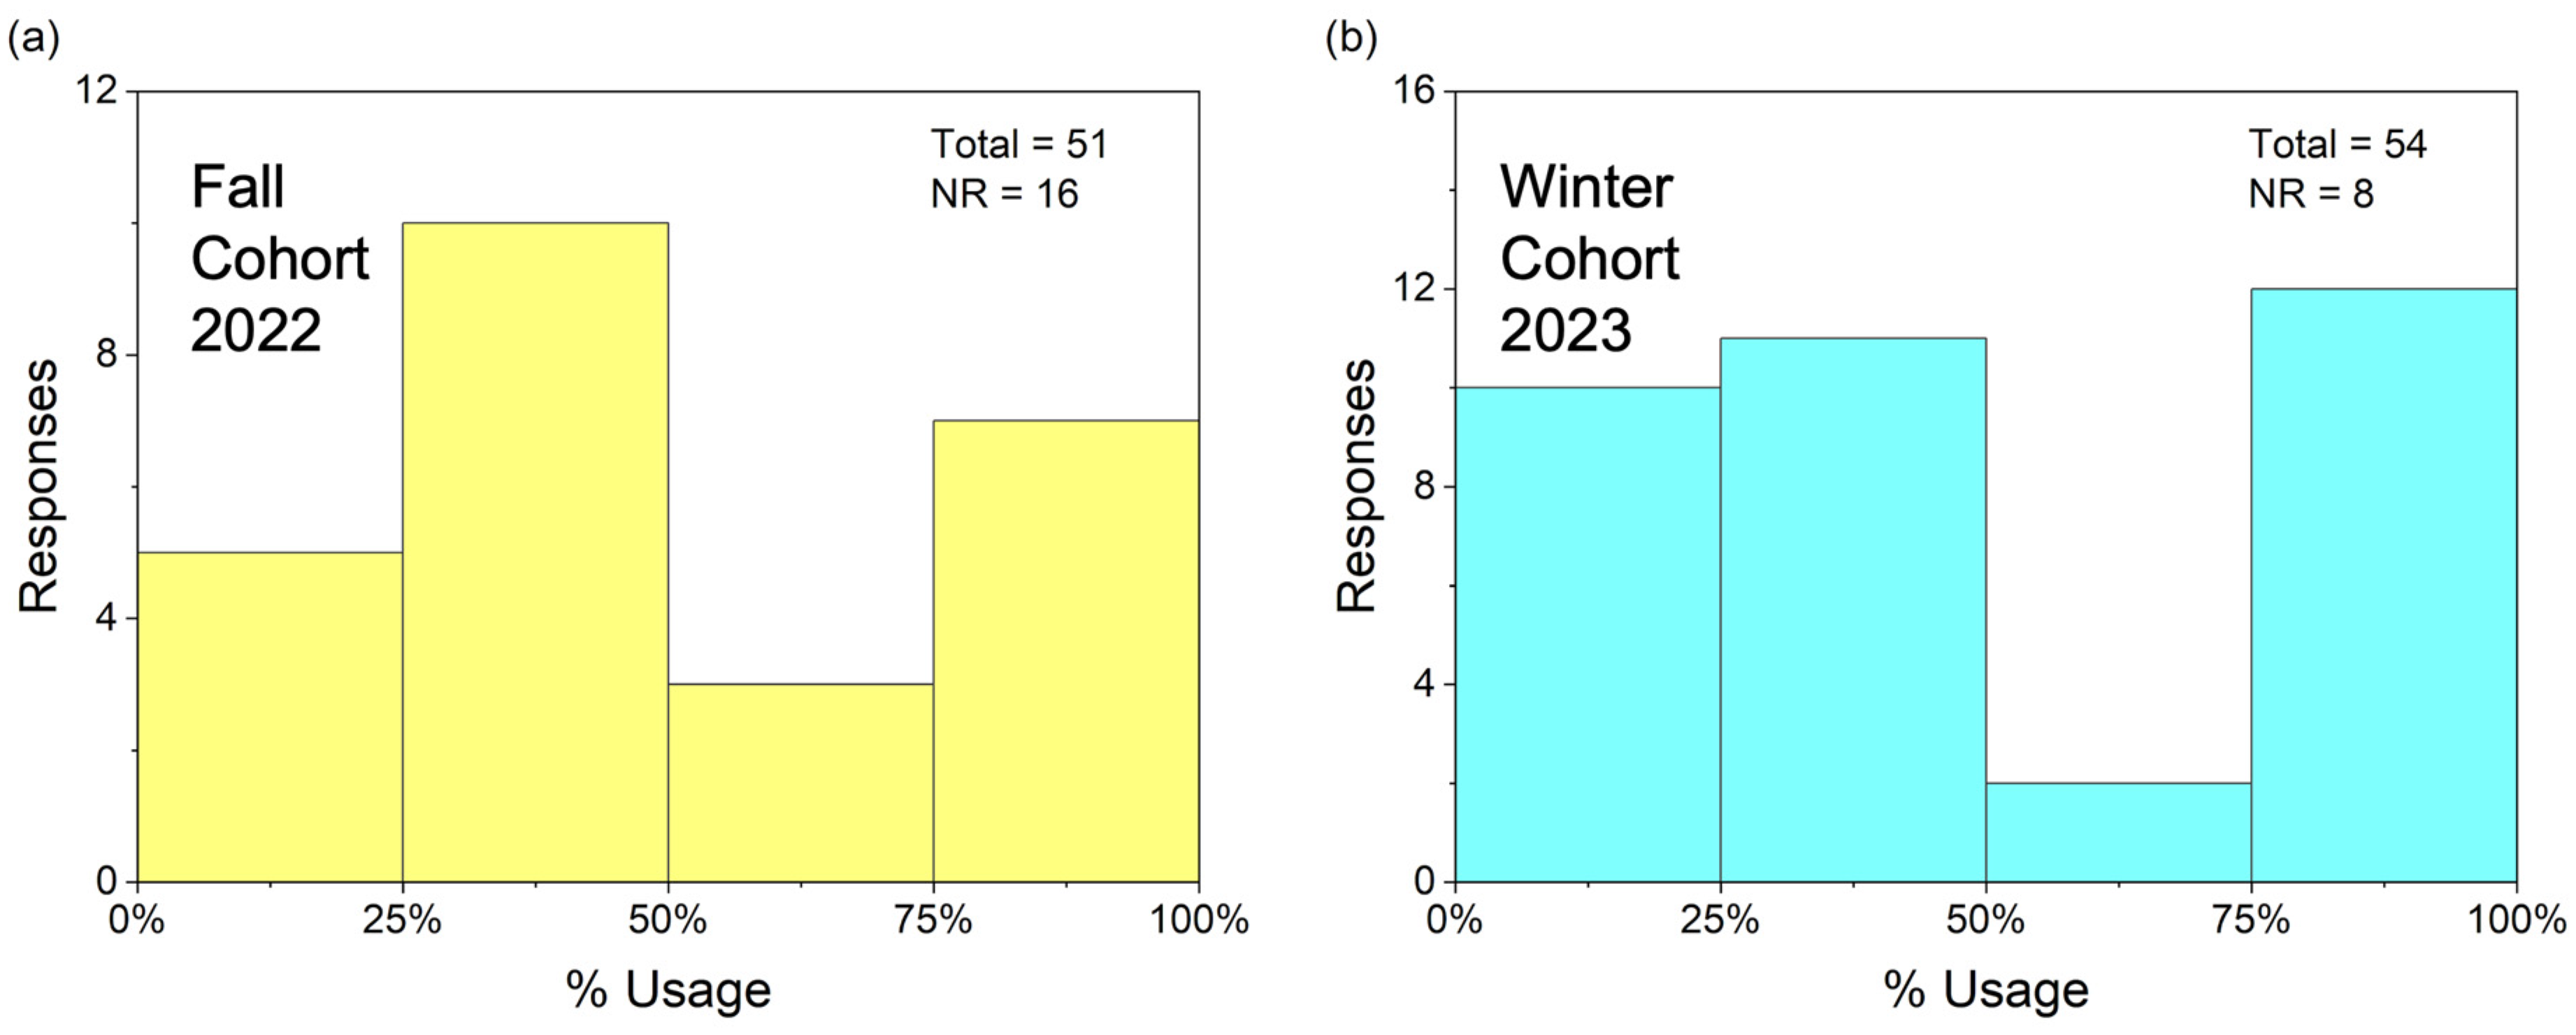
3.3. Feedback from Occupants Regarding P9 Deployment

A histogram showing the percentage of use for the P9 prototype among participants is in Figure 4. Most participants reported less than 50% usage during the deployment period, suggesting that future air cleaner designs need to accommodate lifestyle preferences of the users to ensure the maximum usage in home environments.
Among people who reported usages less than 50%, the most common complaint was increased noise levels associated with PAC use. Many participants also pointed out that the cold air flow associated with operating the air cleaner prevented them from always keeping it on, especially in the winter. Several participants also reported that due to the bulkiness of the prototype, they found it difficult to use in their living rooms. It is important to mention that P9 was selected for the deployment specifically because it had the lowest size footprint among all prototypes. Some of the participants also mentioned that the bulky air cleaner did not go well with the décor of their homes, and they were unwilling to use them in the living room, especially when entertaining guests. Therefore, to address the ubiquitous issue of noise and bulkiness complaints, smaller sized fans or quieter fans should be used for future deployments. Even though we deliberately chose a fan advertised as quiet, our preliminary noise measurements for the single-filter prototype P5 were recorded to be ~50 dbA (Supplementary Materials, Section S2), which is comparable to commercial air cleaner noise levels; [43] however, the noise still proved to be a significant deterrent for their continuous and consistent use in homes.
A possible solution to address the noise and cold air flow issue could be to use the fan at lower speeds; to compensate for the reduced CADR because of the lower flow rate from the fan, multiple DIY air cleaners can be deployed. For commercial air cleaners, this option has been shown to be more effective in terms of PM removal; it can also lead to more energy savings when compared to running a single powerful air cleaner [49]. An ideal addition to the future design of DIY air cleaners would be including real-time air quality monitoring to achieve a level of automation. This enhancement would activate the air cleaners when PM and TVOC levels increase above a specific threshold. This might encourage users to keep them plugged in consistently throughout the day and trust they will come on when needed. Lastly, some design upgrades to improve the aesthetics of these prototypes, while keeping the cost reasonable, should be investigated to encourage occupants to use these prototypes more often without the fear of embarrassment when hosting guests (friends, relatives, and other house guests) as evident from the feedback gathered from the surveys.

4. Conclusions

In this study, we developed nine different DIY PAC prototypes using a combination of a MERV13 filter(s), box fan, and AC filter; we tested them in a lab setting to compare their performance in terms of several key parameters associated with their PM and TVOC removal effectiveness, in addition to their build characteristics. Prototypes with multiple MERV13 filter configurations (P1 and P2) had higher values of PM2.5 CADR (~400–700 m3 h−1) when compared to single-filter configurations (P5–P8, ~150–250 m3 h−1). However, when these prototypes were compared in terms of their economic feasibility using the Average CADR/Annual Cost metric, some of the single-filter prototypes had higher values when compared to multiple filter configurations, due to fewer costs associated with replacing these filters over a year.
Prototype P9, consisting of a 10-cm MERV13 filter and AC filter, was chosen as a suitable option for deployment in communities that often report odor concerns and elevated PM concentrations. Despite lower removal rates, P9 was selected because of its smaller area footprint and ease of build. An important point to mention here is that these prototypes have not been tested for their removal effectiveness against other classes of commonly found indoor pollutants such as ozone, nitrogen dioxide, ultrafine particles, and some specific VOCs that have been known to affect human health. Therefore, future studies could focus on investigating the removal effectiveness of these prototypes on a much more comprehensive scale. Moreover, in some areas of the world routinely facing episodes of high ambient pollution, electricity costs could become an additional deterrent behind the continuous usage of these prototypes.
Around 120 of the P9 prototypes in total were distributed among the residents of the EJ communities in the Denver area; feedback regarding their usage was collected from a subset of ~50 participants who were recruited in the personal exposure characterization part of the study over two cohorts in the Fall and Winter seasons of 2022–2023. The survey results highlighted the importance of regular feedback between the researchers and residents so that the future designs of PACs could be optimized to increase their adoption and continued use among the communities. The study also highlights the scope of the integration of these prototypes with real-time monitoring of air quality that could encourage the residents to continue using these prototypes, despite the inherent issue of increased noise levels and other deterrents that were reported by some survey participants reporting less than 50% usage. Lastly, some individuals reported that they were able to draw positive associations between an improvement in their air pollution exposures and the use of the air cleaner, since they were continuously checking their personal exposure data and were participating regularly in focus groups to engage with SJEQ researchers with their air quality concerns. Therefore, increasing awareness of the negative health effects of indoor PM pollution could encourage households to use air cleaners more consistently, especially during cooking or high outdoor pollution episodes.

Supplementary Materials

The following supporting information can be downloaded at: https://www.mdpi.com/article/10.3390/atmos14121734/s1. Section S1. Steps involved in construction of different DIY air cleaner prototypes. Section S2. Noise measurements for single filter prototype. Figure S1. Materials used for construction of different prototypes. Figure S2. The design for prototype 1 (P1) used four 2-inch-thick MERV filters, a box fan, and a cardboard shroud. Figure S3. The design for prototype 2 (P2) used two 2-inch-thick MERV filters, a box fan, and a cardboard shroud. Figure S4. The design for prototypes 3–5 (P3–5) used one MERV filter with varying thicknesses, a box fan, and a cardboard shroud. This design used the cardboard DIY box separator between the fan and filter. Note: Prototype 7 (P7) used the same design shown above without the shroud included. Figure S5. The design for prototypes 6, 8, and 9 (P6–9) used the fan box as the cardboard separator with a space cut out for the fan and the filter respectively. Figure S6. The design for prototype 9 (P9) used the same no-shroud design as prototype 8 but includes a layer of activated carbon over the filter. Figure S7. Map of the study area highlighting the four neighborhoods and the major industries in the North Denver area. Map source: OpenStreetMap. Figure S8. Size resolved PM removal rates due to ventilation and wall deposition mechanisms calculated for control experiments during which no PAC prototype was used during the decay phase of the experiment. The shaded region represents standard deviation. Table S1. Sociodemographic Data for the Four Neighborhoods Provided by the Colorado Department of Public Health and Environment EnviroScreen. Table S2. Number of Homes in each of the Four Neighborhoods that used the P9 Prototype during the Fall and Winter Cohorts. Table S3. TVOC Removal Rates for Different Prototypes.

Author Contributions

S.S., Writing—review and editing, Writing—original draft, Formal Analysis, Visualization, Validation, and Conceptualization. N.C., Writing—review and editing, Investigation, Formal Analysis, Methodology, Project administration, and Conceptualization. A.H., Writing—review and editing, Investigation, Data Curation, and Resources. A.K.H., Writing—review and editing, Investigation, and Data Curation. D.G.-B., Writing—review and editing, Investigation, and Data Curation. J.A., Investigation and Resources. C.M., Investigation and Resources. L.L., Writing—review and editing, Investigation, and Resources. S.L.M., Writing—review and editing, Supervision, Funding Acquisition, and Conceptualization. All authors have read and agreed to the published version of the manuscript.

Funding

This study was funded through the National Science Foundation, Award Number:1952223. SCC-IRG Track 1: Empowering Environmental Justice Communities with Smart and Connected Technology: Air and Noise Pollution, Wellbeing, and Social Relations in Times of Disruption.

Institutional Review Board Statement

The study was conducted according to the guidelines of the Declaration of Helsinki and approved by the Institutional Review Board of the University of Colorado Boulder (Protocol # 20-0318 and approved exempt 26 May 2021).

Informed Consent Statement

Informed consent was obtained from all subjects involved in the study.

Data Availability Statement

The data is contained within the article.

Acknowledgments

We would like to acknowledge the members of the social team with helping out with the distribution of P9 prototypes around homes in Denver.

Conflicts of Interest

The authors declare no conflict of interest.

References

  1. Brook, R.D.; Rajagopalan, S.; Pope, C.A.; Brook, J.R.; Bhatnagar, A.; Diez-Roux, A.V.; Holguin, F.; Hong, Y.; Luepker, R.V.; Mittleman, M.A.; et al. Particulate Matter Air Pollution and Cardiovascular Disease. Circulation 2010, 121, 2331–2378. [Google Scholar] [CrossRef] [PubMed]
  2. Pope, C.A., III; Burnett, R.T.; Thun, M.J.; Calle, E.E.; Krewski, D.; Ito, K.; Thurston, G.D. Lung Cancer, Cardiopulmonary Mortality, and Long-Term Exposure to Fine Particulate Air Pollution. JAMA 2002, 287, 1132–1141. [Google Scholar] [CrossRef] [PubMed]
  3. Di, Q.; Wang, Y.; Zanobetti, A.; Wang, Y.; Koutrakis, P.; Choirat, C.; Dominici, F.; Schwartz, J.D. Air Pollution and Mortality in the Medicare Population. N. Engl. J. Med. 2017, 376, 2513–2522. [Google Scholar] [CrossRef] [PubMed]
  4. Pope, C.A.; Burnett, R.T.; Turner, M.C.; Cohen, A.; Krewski, D.; Jerrett, M.; Gapstur, S.M.; Thun, M.J. Lung Cancer and Cardiovascular Disease Mortality Associated with Ambient Air Pollution and Cigarette Smoke: Shape of the Exposure–Response Relationships. Environ. Health Perspect. 2011, 119, 1616–1621. [Google Scholar] [CrossRef] [PubMed]
  5. Azimi, P.; Stephens, B. A Framework for Estimating the US Mortality Burden of Fine Particulate Matter Exposure Attributable to Indoor and Outdoor Microenvironments. J. Expo. Sci. Environ. Epidemiol. 2020, 30, 271–284. [Google Scholar] [CrossRef] [PubMed]
  6. Impacts on Your Health|State of Global Air. Available online: https://www.stateofglobalair.org/health (accessed on 6 November 2023).
  7. Atkinson, R.; Arey, J. Atmospheric Degradation of Volatile Organic Compounds. Chem. Rev. 2003, 103, 4605–4638. [Google Scholar] [CrossRef] [PubMed]
  8. Ji, W.; Zhao, B. Contribution of Outdoor-Originating Particles, Indoor-Emitted Particles and Indoor Secondary Organic Aerosol (SOA) to Residential Indoor PM2.5 Concentration: A Model-Based Estimation. Build. Environ. 2015, 90, 196–205. [Google Scholar] [CrossRef]
  9. Ware, J.H.; Spengler, J.D.; Neas, L.M.; Samet, J.M.; Wagner, G.R.; Coultas, D.; Ozkaynak, H.; Schwab, M. Respiratory and Irritant Health Effects of Ambient Volatile Organic Compounds: The Kanawha County Health Study. Am. J. Epidemiol. 1993, 137, 1287–1301. [Google Scholar] [CrossRef]
  10. Cheng, S.; Chang-Chien, G.-P.; Huang, Q.; Zhang, Y.-B.; Yan, P.; Zhang, J.; Wang, Y.; Zhang, D.; Teng, G. Global Research Trends in Health Effects of Volatile Organic Compounds during the Last 16 Years: A Bibliometric Analysis. Aerosol Air Qual. Res. 2019, 19, 1834–1843. [Google Scholar] [CrossRef]
  11. Morgan, B.; Hansgen, R.; Hawthorne, W.; Miller, S.L. Industrial Odor Sources and Air Pollutant Concentrations in Globeville, a Denver, Colorado Neighborhood. J. Air Waste Manag. Assoc. 2015, 65, 1127–1140. [Google Scholar] [CrossRef]
  12. Eltarkawe, M.A.; Miller, S.L. The Impact of Industrial Odors on the Subjective Well-Being of Communities in Colorado. Int. J. Environ. Res. Public Health 2018, 15, 1091. [Google Scholar] [CrossRef] [PubMed]
  13. Jbaily, A.; Zhou, X.; Liu, J.; Lee, T.-H.; Kamareddine, L.; Verguet, S.; Dominici, F. Air Pollution Exposure Disparities across US Population and Income Groups. Nature 2022, 601, 228–233. [Google Scholar] [CrossRef] [PubMed]
  14. Bell, M.L.; Ebisu, K. Environmental Inequality in Exposures to Airborne Particulate Matter Components in the United States. Environ. Health Perspect. 2012, 120, 1699–1704. [Google Scholar] [CrossRef] [PubMed]
  15. Cushing, L.; Morello-Frosch, R.; Wander, M.; Pastor, M. The Haves, the Have-Nots, and the Health of Everyone: The Relationship Between Social Inequality and Environmental Quality. Annu. Rev. Public Health 2015, 36, 193–209. [Google Scholar] [CrossRef] [PubMed]
  16. Kolokotsa, D.; Santamouris, M. Review of the Indoor Environmental Quality and Energy Consumption Studies for Low Income Households in Europe. Sci. Total Environ. 2015, 536, 316–330. [Google Scholar] [CrossRef] [PubMed]
  17. Saha, P.K.; Presto, A.A.; Hankey, S.; Marshall, J.D.; Robinson, A.L. Racial-Ethnic Exposure Disparities to Airborne Ultrafine Particles in the United States. Environ. Res. Lett. 2022, 17, 104047. [Google Scholar] [CrossRef]
  18. Houston, D.; Wu, J.; Ong, P.; Winer, A. Structural Disparities of Urban Traffic in Southern California: Implications for Vehicle-Related Air Pollution Exposure in Minority and High-Poverty Neighborhoods. J. Urban. Aff. 2004, 26, 565–592. [Google Scholar] [CrossRef]
  19. Ferguson, L.; Taylor, J.; Davies, M.; Shrubsole, C.; Symonds, P.; Dimitroulopoulou, S. Exposure to Indoor Air Pollution across Socio-Economic Groups in High-Income Countries: A Scoping Review of the Literature and a Modelling Methodology. Environ. Int. 2020, 143, 105748. [Google Scholar] [CrossRef]
  20. Humphrey, J.L.; Lindstrom, M.; Barton, K.E.; Shrestha, P.M.; Carlton, E.J.; Adgate, J.L.; Miller, S.L.; Root, E.D. Social and Environmental Neighborhood Typologies and Lung Function in a Low-Income, Urban Population. Int. J. Environ. Res. Public Health 2019, 16, 1133. [Google Scholar] [CrossRef]
  21. Shrestha, P.M.; Humphrey, J.L.; Barton, K.E.; Carlton, E.J.; Adgate, J.L.; Root, E.D.; Miller, S.L. Impact of Low-Income Home Energy-Efficiency Retrofits on Building Air Tightness and Healthy Home Indicators. Sustainability 2019, 11, 2667. [Google Scholar] [CrossRef]
  22. US EPA. Environmental Justice and National Environmental Policy Act. Available online: https://www.epa.gov/environmentaljustice/environmental-justice-and-national-environmental-policy-act (accessed on 6 November 2023).
  23. Ahrentzen, S.; Erickson, J.; Fonseca, E. Thermal and Health Outcomes of Energy Efficiency Retrofits of Homes of Older Adults. Indoor Air 2016, 26, 582–593. [Google Scholar] [CrossRef]
  24. D’Alpaos, C.; Bragolusi, P. Prioritization of Energy Retrofit Strategies in Public Housing: An AHP Model. In New Metropolitan Perspectives; Calabrò, F., Della Spina, L., Bevilacqua, C., Smart Innovation Systems and Technologies, Eds.; Springer International Publishing: Cham, Switzerland, 2019; pp. 534–541. [Google Scholar] [CrossRef]
  25. Monteiro, C.S.; Causone, F.; Cunha, S.; Pina, A.; Erba, S. Addressing the Challenges of Public Housing Retrofits. Energy Procedia 2017, 134, 442–451. [Google Scholar] [CrossRef]
  26. Broderick, Á.; Byrne, M.; Armstrong, S.; Sheahan, J.; Coggins, A.M. A Pre and Post Evaluation of Indoor Air Quality, Ventilation, and Thermal Comfort in Retrofitted Co-Operative Social Housing. Build. Environ. 2017, 122, 126–133. [Google Scholar] [CrossRef]
  27. Klepeis, N.E.; Nelson, W.C.; Ott, W.R.; Robinson, J.P.; Tsang, A.M.; Switzer, P.; Behar, J.V.; Hern, S.C.; Engelmann, W.H. The National Human Activity Pattern Survey (NHAPS): A Resource for Assessing Exposure to Environmental Pollutants. J. Expo. Sci. Env. Epidemiol. 2001, 11, 231–252. [Google Scholar] [CrossRef]
  28. Patel, S.; Rim, D.; Sankhyan, S.; Novoselac, A.; Vance, M.E. Aerosol Dynamics Modeling of Sub-500 Nm Particles during the HOMEChem Study. Environ. Sci. Process. Impacts 2021, 23, 1706–1717. [Google Scholar] [CrossRef]
  29. Derk, R.C.; Coyle, J.P.; Lindsley, W.G.; Blachere, F.M.; Lemons, A.R.; Service, S.K.; Martin, S.B.; Mead, K.R.; Fotta, S.A.; Reynolds, J.S.; et al. Efficacy of Do-It-Yourself Air Filtration Units in Reducing Exposure to Simulated Respiratory Aerosols. Build. Environ. 2023, 229, 109920. [Google Scholar] [CrossRef] [PubMed]
  30. Sankhyan, S.; Witteman, J.K.; Coyan, S.; Patel, S.; Vance, M.E. Assessment of PM 2.5 Concentrations, Transport, and Mitigation in Indoor Environments Using Low-Cost Air Quality Monitors and a Portable Air Cleaner. Environ. Sci. Atmos. 2022, 2, 647–658. [Google Scholar] [CrossRef]
  31. Zhu, Y.; Song, X.; Wu, R.; Fang, J.; Liu, L.; Wang, T.; Liu, S.; Xu, H.; Huang, W. A Review on Reducing Indoor Particulate Matter Concentrations from Personal-level Air Filtration Intervention under Real-world Exposure Situations. Indoor Air 2021, 31, 1707–1721. [Google Scholar] [CrossRef]
  32. Riederer, A.M.; Krenz, J.E.; Tchong-French, M.I.; Torres, E.; Perez, A.; Younglove, L.R.; Jansen, K.L.; Hardie, D.C.; Farquhar, S.A.; Sampson, P.D.; et al. Effectiveness of Portable HEPA Air Cleaners on Reducing Indoor Endotoxin, PM 10, and Coarse Particulate Matter in an Agricultural Cohort of Children with Asthma: A Randomized Intervention Trial. Indoor Air 2021, 31, 1926–1939. [Google Scholar] [CrossRef]
  33. Ciuzas, D.; Prasauskas, T.; Krugly, E.; Jurelionis, A.; Seduikyte, L.; Martuzevicius, D. Indoor Air Quality Management by Combined Ventilation and Air Cleaning: An Experimental Study. Aerosol Air Qual. Res. 2016, 16, 2550–2559. [Google Scholar] [CrossRef]
  34. Tran, P.T.M.; Adam, M.G.; Tham, K.W.; Schiavon, S.; Pantelic, J.; Linden, P.F.; Sofianopoulou, E.; Sekhar, S.C.; Cheong, D.K.W.; Balasubramanian, R. Assessment and Mitigation of Personal Exposure to Particulate Air Pollution in Cities: An Exploratory Study. Sustain. Cities Soc. 2021, 72, 103052. [Google Scholar] [CrossRef]
  35. Sharma, R.; Balasubramanian, R. Assessment and Mitigation of Indoor Human Exposure to Fine Particulate Matter (PM2.5) of Outdoor Origin in Naturally Ventilated Residential Apartments: A Case Study. Atmos. Environ. 2019, 212, 163–171. [Google Scholar] [CrossRef]
  36. Pei, J.; Dong, C.; Liu, J. Operating Behavior and Corresponding Performance of Portable Air Cleaners in Residential Buildings, China. Build. Environ. 2019, 147, 473–481. [Google Scholar] [CrossRef]
  37. Larson, C. Beijing’s DIY Clean Air Movement: If You Can’t Buy an Expensive Air Filter, Build One. Bloomberg.com. 16 May 2014. Available online: https://www.bloomberg.com/news/articles/2014-05-15/beijing-s-diy-clean-air-movement-if-you-can-t-buy-an-expensive-air-filter-build-one (accessed on 6 September 2023).
  38. Sun, L.H. After Three Years of Covering Covid, I Built My Own Air Filter. Washington Post. 14 January 2023. Available online: https://www.washingtonpost.com/health/2023/01/13/air-filter-diy-covid/ (accessed on 6 September 2023).
  39. CleanAirCrew. DIY Box Fan Filters—Corsi-Rosenthal Box—Clean Air Crew. Available online: https://cleanaircrew.org/box-fan-filters/ (accessed on 5 May 2023).
  40. Puget Sound Clean Air Agency. DIY Air Filter | Puget Sound Clean Air Agency, WA. Available online: https://www.pscleanair.gov/525/DIY-Air-Filter (accessed on 6 September 2023).
  41. Dal Porto, R.; Kunz, M.N.; Pistochini, T.; Corsi, R.L.; Cappa, C.D. Characterizing the Performance of a Do-It-Yourself (DIY) Box Fan Air Filter. Aerosol Sci. Technol. 2022, 56, 564–572. [Google Scholar] [CrossRef]
  42. Srikrishna, D. Can 10× Cheaper, Lower-Efficiency Particulate Air Filters and Box Fans Complement High-Efficiency Particulate Air (HEPA) Purifiers to Help Control the COVID-19 Pandemic? Sci. Total Environ. 2022, 838, 155884. [Google Scholar] [CrossRef]
  43. Angela Eykelbosh. Do-It-Yourself (DIY) Air Cleaners: Evidence on Effectiveness and Considerations for Safe Operation; National Collaborating Centre for Environmental Health. 2023. Available online: https://ccnse.ca/sites/default/files/DIY%20air%20cleaners%20evidence%20review%20Jan%2018%202023%20-%20FINAL%20ENGLISH.pdf (accessed on 9 May 2023).
  44. Dodson, R.E.; Manz, K.E.; Burks, S.R.; Gairola, R.; Lee, N.F.; Liu, Y.; Pennell, K.D.; Walker, E.D.; Braun, J.M. Does Using Corsi–Rosenthal Boxes to Mitigate COVID-19 Transmission Also Reduce Indoor Air Concentrations of PFAS and Phthalates? Environ. Sci. Technol. 2023, 57, 415–427. [Google Scholar] [CrossRef] [PubMed]
  45. Holder, A.L.; Halliday, H.S.; Virtaranta, L. Impact of Do-It-Yourself Air Cleaner Design on the Reduction of Simulated Wildfire Smoke in a Controlled Chamber Environment. Indoor Air 2022, 32, e13163. [Google Scholar] [CrossRef]
  46. Xiang, J.; Huang, C.-H.; Shirai, J.; Liu, Y.; Carmona, N.; Zuidema, C.; Austin, E.; Gould, T.; Larson, T.; Seto, E. Field Measurements of PM2.5 Infiltration Factor and Portable Air Cleaner Effectiveness during Wildfire Episodes in US Residences. Sci. Total Environ. 2021, 773, 145642. [Google Scholar] [CrossRef]
  47. (South Coast AQMD), South Coast Air Quality Management District. Atmotube—Pro. Sensor Detail. Available online: http://www.aqmd.gov/aq-spec/sensordetail/atmotube---pro (accessed on 28 April 2023).
  48. CDPHE, Colorado Department of Public Health. Colorado EnviroScreen Environmental Justice Mapping Tool. Available online: https://teeo-cdphe.shinyapps.io/COEnviroScreen_English/ (accessed on 28 April 2023).
  49. Lowther, S.D.; Deng, W.; Fang, Z.; Booker, D.; Whyatt, J.D.; Wild, O.; Wang, X.; Jones, K.C. Factors Affecting Real-World Applications of HEPA Purifiers in Improving Indoor Air Quality. Environ. Sci. Adv. 2023, 2, 235–246. [Google Scholar] [CrossRef]
Figure 1. The four main components, (a) separator, (b) box fan, (c) MERV-13 filter, and (d) AC filter, used for constructing prototype P9.
Atmosphere 14 01734 g001
Figure 2. Top view of the test room layout showing positions of portable air cleaner (PAC), mixing fan (stationary box fan), swivel fan (rotating fan head on a vertical stand), instrumentation cart, and the cooking cart.
Atmosphere 14 01734 g002
Figure 3. Size-resolved eACH calculated from APS number concentration data for different prototypes is shown in (a). The shaded region represents the standard deviation around the average. Note that the x-axis is in logarithmic scale. The boxplot distributions for eACH values calculated using the PM2.5 mass concentration data from the ATM monitors are shown in (b).
Atmosphere 14 01734 g003
Figure 4. Histogram showing the responses for P9 usage among the participants during the Fall 2022 and Winter 2023 cohorts are given in (a) and (b) respectively. Information regarding the total number of participants in each cohort who responded to the survey alongside the number of no responses (NR) is also given as an inset.
Atmosphere 14 01734 g004
Table 1. Characteristics of the components used for building different DIY air cleaner prototypes.
Model Number of FiltersFilter Depth (Inches) πShroud IncludedSeparator Type
P142YesNA
P222YesNA
P312YesDIY box
P411YesDIY box
P514YesDIY box
P614YesFan box
P714NoDIY box
P814NoFan box
P9 *14NoFan box
* Includes both MERV13 filter and AC filter; NA refers to not applicable. π Actual dimensions of these filters were slightly less than the advertised value due to the external covering.
Table 2. Comparison table for the Performance parameters of different air cleaner prototypes.
ParametersP1P2P3P4P5P6P7P8P9
CADR (m3 h−1) ¥709 ± 5
(n = 4)
389 ± 10
(n = 3)
213 ± 12
(n = 6)
159 ± 30
(n = 5)
300 ± 22
(n = 8)
245 ± 29
(n = 6)
242 ± 8
(n = 2)
219 ± 20
(n = 6)
124 ± 17
(n = 5)
eACH (h−1)18.3 ± 0.110.0 ± 0.35.5 ± 0.34.1 ± 0.87.7 ± 0.66.3 ± 0.86.3 ± 0.25.7 ± 0.53.2 ± 0.4
Initial (Annual) Cost ($)113 (184)81 (64)65 (32)59 (20)72 (46)72 (46)72 (46)72 (46)75 (51)
Average CADR/Initial Cost (m3 h−1 $−1)6.34.83.32.74.23.43.43.01.7
Average CADR/Annual Cost (m3 h−1 $−1)3.96.16.78.06.55.35.34.82.4
Size (m2)0.240.130.160.140.180.180.180.180.18
Ease of Build (Easiest = 1; Hardest = 7)675553412
¥ Calculated for PM2.5 mass concentration from AtmotubePro.
Disclaimer/Publisher’s Note: The statements, opinions and data contained in all publications are solely those of the individual author(s) and contributor(s) and not of MDPI and/or the editor(s). MDPI and/or the editor(s) disclaim responsibility for any injury to people or property resulting from any ideas, methods, instructions or products referred to in the content.

