Article

City-Scale Aerosol Loading Changes in the Sichuan Basin from 2001 to 2020 as Revealed by MODIS 1 km Aerosol Product

Plateau Atmospheric and Environment Laboratory of Sichuan Province, School of Atmospheric Sciences, Chengdu University of Information Technology, Chengdu 610225, China
*
Author to whom correspondence should be addressed.
Atmosphere 2023, 14(12), 1715; https://doi.org/10.3390/atmos14121715
Submission received: 26 September 2023 / Revised: 25 October 2023 / Accepted: 15 November 2023 / Published: 21 November 2023
(This article belongs to the Special Issue Aerosol Environmental Remote Sensing)

Abstract

:
Long-term high-resolution monitoring of aerosol optical depth (AOD) is necessary to understand air pollution problems and climate change at regional to urban scales. Based on the 1 km AOD dataset retrieved by the MODIS Multi-Angle Implementation of Atmospheric Correction algorithm (MAIAC), the spatial-temporal evolutionary trends of AOD in the Sichuan Basin (SCB), Southwest China, and its 17 subordinate cities were analyzed from 2001 to 2020. In the past 20 years, the annual average AOD in SCB gradually decreased from south to north. The highest AOD of SCB in spring was 0.62, followed by an average AOD value of 0.60 in winter. At the city scale, Zigong, Neijiang, and Ziyang were identified as the three most polluted cities within the SCB. The average AOD in the SCB increased to 0.68 and 0.69 in February and March, respectively, and significantly decreased to 0.41 and 0.43 in June and July, respectively. The interannual AOD in the SCB presented an increasing trend from 2001 to 2010, with a range of 0.50 to 0.70, whereas it showed a decreasing trend from 2011 to 2020, with a range of 0.68 to 0.35. In spring, the annual average AOD at the district level showed significant high values from 2005 to 2012. In winter, the interannual AOD increased significantly, with high values concentrated in 2008, 2010, 2011, and 2013. The occurrence frequency of AOD in the SCB was mainly distributed between 0.2~0.5 and 1.5. There also was an increasing trend of AOD in the SCB from 2001 to 2008 and a decreasing trend from 2009 to 2020. The results of this study hold significance for further understanding the climatic characteristics and environmental effects of regional atmospheric aerosols.

1. Introduction

Atmospheric aerosols play an important role not only in regional but also in global climate change. The optical properties of atmospheric aerosols present some uncertainties in predicting global climate change, so it is very important to evaluate the radiation effects of atmospheric aerosols and climate change in different regions according to the optical properties of aerosols [1]. On the one hand, they can directly change the total amount and distribution of global radiation by scattering and absorbing solar radiation; on the other hand, they can also act as cloud condensation nuclei to change the formation of clouds and affect the size distribution of cloud droplets, thereby indirectly affecting global climate [2,3,4]. Atmospheric aerosol sources can be divided into anthropogenic sources and natural sources, with different sizes, shapes, chemical compositions, and mixed states. Therefore, the optical properties of atmospheric aerosols have strong spatiotemporal variability, and the contribution of meteorological factors and emissions to inter-decadal aerosol optical properties has received extensive attention [5,6,7,8,9,10].
Long-term aerosol monitoring based on ground measurements is of great scientific significance for studying the distribution of aerosol optical properties. The global deployment of large-scale solar photometer networks such as the Aerosol Robotic Network (AERONET) [11] and its subsets, PHOtométrie pour le Traitement Opérationnel de Normalisation Satellitaire (PHOTONS) [12], the Canadian Sun-Photometer Network (AEROCAN) [13], the SKYrad Network (SKYNET) [14], the EuropeanAerosol Research Lidar Network (EARLINET) [15], and the World Meteorological Association Global Atmosphere Watch (GAW) Programme Precision Filter Radiometers Network [16,17], is helpful for continuous and in-depth studies of regional and global atmospheric aerosol optical characteristics. The famous ground-based observation networks with aerosol optical and radiation properties in China mainly include the China Aerosol Remote Sensing Network (CARSNET) [18], the Chinese Sun Hazemeter Network (CSHNET) [19], and the Sun-Sky radiometer Observation NETwork (SONET) [20]. The simultaneous observation of aerosol key optical properties (AOD, single scattering albedo, absorption AOD) as well as their microphysical properties can fully reveal the distribution of aerosol optical radiation properties in different regions of China and obtain the response and feedback of atmospheric aerosols to climate and environmental effects under different regional background conditions [21,22,23,24].
Ground-based LIDAR can provide vertical information of aerosol extinction profiles to obtain direct remote sensing aerosol optical profiles [15,25]. However, the spatio-temporal distribution of atmospheric aerosols is not uniform, so ground-based observation and LIDAR have certain limitations in terms of aerosol optical characteristics in spatial and temporal distribution. The sensor carried by a satellite plays an important role in the vertical observation of aerosols. The spatial distribution characteristics of aerosols are revealed through the observation of the whole vertical space of the aerosol from top to bottom by satellite remote sensing [26,27,28].
The Moderate Resolution Imaging Spectroradiometer (MODIS), the Multiangle Imaging Spectroradiometer (MISR), the Ozone Monitor Instrument (OMI), Cloud Aerosol LIDAR and Infrared Pathfinder Satellite Observation (CALIPSO), the Advanced Very High Resolution Radiometer (AVHRR), the Total Ozone Mapping Spectrometer (TOMS), the Sea-viewing Wide Field-of-view sensor (SeaWiFS), and other satellite sensors have been used to provide aerosol optical inversion products under global long-term uninterrupted space coverage [29,30,31]. Therefore, using satellite remote sensing monitoring data to study the spatio-temporal distribution of aerosol optical properties can make up for the limitations of short time scale and small space coverage in ground-based observation and has important scientific significance for further revealing the direct radiation effect of aerosols. The MODIS MAIAC (Multi-Angle Implementation of Atmospheric Correction) algorithm can provide a 1 km high spatial resolution aerosol optical depth (AOD) of all land and ocean surfaces except ice and snow. The surface Bidirectional Reflectance Distribution Function (BRDF) as well as aerosol parameters retrieved from dark and bright surfaces are obtained.
The Sichuan Basin (SCB) is bounded to the west by the Qinghai-Tibet Plateau, to the north by the Qin Mountains and the Loess Plateau, to the east by the Yangtze Gorges, and to the south by the Yunnan-Guizhou Plateau (Figure 1). Based on MODIS MAIAC AOD data, we analyzed the spatial and temporal distribution and interannual variation trend of AOD in the SCB from 2001 to 2020. The interannual trend and frequency of AOD occurrence were discussed at the city scale. On the basis of satellite observation with high spatial coverage and strong temporal continuity, the aerosol loading and its optical properties in Southwest China were revealed, and the research provided powerful scientific support for fine tuning the remote sensing of regional AOD. The rest of this paper is organized as follows: In Section 2, the study area, data sources, and emission inventory are described. Section 3 shows the spatial distribution and interannual trend of AOD at the city scale. In addition, the frequency occurrence of different AOD levels in different districts is also analyzed. Section 4 concludes the study.

2. Study Region and Data

The basin floor of the Sichuan Basin is mostly below 500 m above sea level and surrounded by towering mountains above 1500 m above sea level. The closed topography of the Sichuan Basin leads to low wind speed, high humidity, and high atmospheric stability in the basin, which makes it easy for geodetic inversion to form and is not conducive to the diffusion of atmospheric pollutants [32]. The analysis of aerosol optical characteristics in Southwest China is very necessary for the study of environmental problems and climate change in this region, which helps to improve the important understanding of aerosol composition and sources in Southwest China and is conducive to evaluating the impact of human activities on atmospheric aerosols, which is of great significance for further understanding atmospheric aerosols and their environmental effects in Southwest China.
Concentrated urban distribution, large population density, and an extensive economy and energy consumption structure dominated by fossil fuels in the Sichuan Basin (Figure 1) lead to large primary pollutant emissions, and aerosol optical depth (AOD) has remained at a high level for a long time [33]. The SCB is one of the four regions with the most serious air pollution in China [34]. The annual AOD from 1980–2016 showed a significant upward trend located in the SCB compared to the significant downward trends observed in the whole of Europe and the eastern United States [35]. In addition to emissions and topography, the pollution in the basin in winter is also affected by meteorological conditions, such as no cold air activity and weak atmospheric level activity, which makes it easy for static and stable weather to form, which is favorable to the accumulation of pollutants. Without cold air entering the basin, the static and stable weather is destroyed, and the increase in vertical convection enhances the diffusion of air pollutants in the near surface and the regional pollution process is weakened. The most important reason for visibility degradation in this area is due to the light extinction of aerosol particles [36]. This study divided the SCB into 17 main districts, namely, Chengdu (CD), Bazhong (BZ), Dazhou (DZ), Deyang (DY), Guangan (GA), Guangyuan (GY), Leshan (LS), Luzhou (LZ), Meishan (MS), Mianyang (MY), Nanchong (NC), Neijiang (NJ), Suining (SN), Ya’an (YA), Yibin (YB), Ziyang (ZY), and Zigong (ZG).
CD is the most densely populated city in the SCB, with about 60,000 persons per 5 km × 5 km grid box, followed by the NJ and ZG districts in the south, with about 20,000–30,000 persons per 5 km × 5 km grid box. The population density of SN, NC, and GA in the northern part of the SCB is about 10,000–20,000 persons per 5 km × 5 km grid box. Less densely populated areas of the SCB were reduced to 1000 persons per 5 km × 5 km grid box. The distribution of SO2 emissions in the SCB is basically consistent with the distribution of the population density (Figure 2b), and the highest emissions of SO2 (about 60 tons/km2/year) were in the CD district, followed by in NJ and ZG and the surrounding areas, with about 20 tons/km2/year. Low SO2 emissions (less than 1 ton/km2/year) were observed in areas with lower population density in the SCB. Regional distribution of SO2 emissions in the SCB suggests that anthropogenic emissions are critical to the effect of gaseous pollutants in this region.
The MODIS sensors onboard the Terra and Aqua satellites observe the earth every 1–2 days at local overpass time: 10:38 a.m. and 1:38 p.m., respectively, collecting optical data of aerosol from the visible to thermal infrared spectrum [30,37]. The MODIS sensor has a large spectral range, high spatial resolution, and daily global coverage, which is more helpful for global climate change observation and monitoring [38]. The MODIS MAIAC algorithm is used for processing and improving cloud or snow detection, aerosol inversion, and atmospheric correction and for providing land surface AOD (excluding snow and ice) and ocean AOD with a 1 km spatial resolution [39,40]. In this study, AOD products from the MODIS MAIAC algorithm were obtained from the National Aeronautics and Space Administration (https://search.earthdata.nasa.gov/; accessed on 24 September 2023). In this study, 550 nm MAIAC AOD products were resampled at a spatial resolution of 1 km on a uniform 0.01° latitude and longitude grid using the nearest neighbor interpolation method. We only extracted AOD retrieval with a quality assurance flag classified as “best quality”. Meanwhile, quality assurance flags indicating cloud, land, water, or snow contamination (including the adjacency mask of cloud/snow) were used to remove invalid AOD values. Validation based on AERONET showed that the MAIAC AODs were highly consistent with the AERONET AODs (correlation coefficient = 0.943), with a root mean square error (RMSE) of 0.148 [40]. Note that we needed each grid pixel to satisfy at least two valid retrievals in order to be used in the calculation of the monthly mean. Meteorological data, including planetary boundary layer height (PBLH), precipitation (PPT), and wind speed at 10 m (WS), came from ECMWF Reanalysis V5 (ERA5) of the European Centre for Medium-Range Weather Forecasts (https://cds.climate.copernicus.eu/; accessed on 24 September 2023). The data had a spatial resolution of 0.25° × 0.25° and the coverage period was 2001–2020. The data of the population were collected by using the 2015 Gridded Population of the World Version 4 dataset from the NASA Socioeconomic Data and Applications Center at Columbia University (https://sedac.ciesin.columbia.edu/data/collection/gpw-v4; accessed on 24 September 2023).
In addition to meteorological conditions, the effects of anthropogenic emissions on the spatial-temporal evolution trend of AOD were also discussed. Anthropogenic emissions data were derived from MEIC (Multi-resolution Emission Inventory for China, http://meicmodel.org.cn/; accessed on 24 September 2023). MEIC is an anthropogenic air emissions simulation platform developed by Tsinghua University. It distributes multiple multi-scale data sets, including greenhouse gas and air pollutant emissions, and has been widely used in air-quality simulation and policy evaluation. In this study, the v1.4 version of the department-wide average emissions source list of four major pollutants, including fine particulate matter (PM2.5), sulfur dioxide (SO2), organic carbon (OC), and nitrogen oxides (NOx), was obtained from the MEIC platform. These different species of atmospheric pollutants have been shown to directly or indirectly affect aerosol extinction.
The trend analysis was carried out for region-averaged AOD time series at the city scale by using the Mann–Kendall tau test and the Sen’s slope method. This study used the Sen’s slope to evaluate the strength of the trend value, and the M-K statistical test was applied to test whether these estimated trends were significant at the 90% significance level.

3. Results and Discussion

3.1. Spatial Distribution of Annual and Seasonal AOD in the SCB from 2001 to 2020

The spatial distribution of the annual mean and region-averaged AOD in the SCB in the 17 districts from 2001 to 2020 is shown in Figure 3. In the past 20 years, the annual average AOD in the southern region of the SCB was high, and the maximum value reached 1.0. The average annual AOD in the central region of the SCB decreased to 0.6~0.7. The average annual AOD in the northern part of the SCB decreased to about 0.4. The lowest AOD values occurred in the mountainous areas in the northern and western SCB, with an average annual AOD of less than 0.1. The average annual AOD in other areas of the SCB ranged from 0.4 to 0.6. At the district scale, the maximum AOD of the SCB occurred in ZG (AOD~0.87), followed by NJ (AOD~0.82). ZG is located in the southern part of the SCB, where it is difficult for air pollutants to be transported and dispersed and the quality of atmospheric environment is adversely affected by terrain and meteorology. However, NJ, as a typical agricultural district, is significantly affected by biomass-burning emissions. Liao et al. [41] indicated that the influence of mineral dust aerosols on the aerosol extinction capability of the SCB is very important. In addition, local biomass burning and trans-regional transport of biomass burning in the Indo-China peninsula also have an important correlation with the contribution of AOD in the SCB. The average AOD in the MS, ZY, YB, SN, and GA regions was around 0.7. Among them, the AOD values in MY, GY, and BZ were low (AOD~0.39–0.42), and the average value of annual AOD in YA was the lowest, at 0.24. YA is a national ecological functional reserve in China and one of the cities with the best air quality in Sichuan province, with lower aerosol optical extinction [42]. From the spatial distribution of AOD, it can be seen that AOD in the SCB area gradually decreased from south to north and from east to west. Che et al. [8] found that the AOD value of the SCB (Chengdu 1.17) was higher than that of Northeast China (Shenyang 0.89), North China (Zhengzhou 0.99), and Central China (Wuhan 1.00). Compared with other regions in the world, the AOD value of the SCB was also much higher than that of the Middle East (Urmia Lake 0.45), South Asia (India 0.37), and Eastern Europe (Moldova 0.21) [43,44].
Figure 4 shows the spatial distribution of seasonal AOD in the SCB from 2001 to 2020. In this paper, the year is divided into four seasons: spring, from March to May; summer, from June to August; autumn, from September to November; and winter, from December to February. The seasonal mean AOD in the SCB was larger in spring and winter and smaller in summer and autumn. The highest AOD in the SCB in spring was 0.62, followed by an average AOD value of 0.60 in winter. The mean AOD in the SCB decreased to 0.46 in summer and autumn. Based on the spatial distribution of seasonal AOD, the average AOD in the central and southern SCB in spring was about 1.0, whereas AOD in the northern SCB decreased to 0.6–0.8. The spring AOD in the western region of the SCB was less than 0.1–0.2. In summer, AOD in the SCB decreased in general, among which AOD in the CD district was about 0.8, and AOD in other areas was about 0.6. The average AOD of the SCB in autumn was the same as that in summer. The highest AOD value was concentrated in the NJ and ZG districts, at about 0.8–1.0, and the average AOD of the other areas was about 0.6. In winter, AOD increased significantly in the south in SCB, NJ, ZG, and the surrounding areas by 1.0, and the average AOD in the north was about 0.6–0.8. The large aerosol extinction in Southwest China in spring and winter may also have been related to frequent fire activities in the SCB and the surrounding areas [45]. Cai et al. [46] pointed out that the SCB is affected by frequent high-altitude dust transport, with a large proportion of dust aerosols of about 30–35%.

3.2. Spatial Distribution of Monthly AOD in the SCB from 2000 to 2020

Figure 5 shows the multi-year distribution of the monthly average value of AOD in the SCB during 2001–2020. The average AOD in January was 0.64. The maximum monthly mean value of AOD appeared in the northern NJ, ZG, YB, and LZ districts, and the mean value of AOD was larger than 1.0. The average AOD in the SCB increased to 0.68 and 0.69 in February and March, respectively. The maximum value of AOD in the ZG, YB, and LZ districts was higher than 1.20, and the average monthly AOD increased to 1.0 in other districts. The increase in PM10 concentration and proportion in the SCB in spring may have been due to the influence of dust and sandstorms in the north [37]. After April, the AOD value in the SCB showed a declining trend, with an average value of 0.61. The maximum monthly average AOD still occurred in the southern district (about 1.0). The average monthly AOD in other districts decreased to about 0.8, and the average value of monthly AOD in other northern districts was small, at 0.6. The spatial distribution of AOD in May was basically the same as that in April, and the average AOD decreased to 0.56. The monthly average of AOD in the central and southern districts, with higher AOD, was less than 1.0. The average AOD in the SCB decreased significantly from June to July, and the average value of AOD was 0.41 and 0.43, respectively. AOD in the SCB began to increase in August, and the average AOD was 0.52. The average monthly maximum of AOD occurred in the southern and western districts, and the maximum AOD was about 0.8. In summer, the SCB was affected by the prevailing air flow increasing the atmospheric water vapor content, and the moisture absorption of fine particles led to intense aerosol extinction and large AOD [44]. The monthly average AOD in the SCB in September was similar than that in August, at about 0.51. It is worth noting that, in September, the distribution range of high AOD values in the SCB was relatively concentrated, and the maximum AOD appeared in the ZG, NJ, and YB districts in the south, with a maximum AOD higher than 1.0. In October, the average monthly AOD in the SCB decreased to 0.40. The average monthly maximum AOD was about 0.8. In November and December, the monthly average AOD in the SCB increased to 0.48 and 0.50, respectively. According to the monthly variation in AOD in the SCB, the monthly variation in AOD in Southwest China has an important correlation with the geographical location. The larger AOD in the SCB from January to April may have been related to adverse meteorological factors such as terrain and low boundary layer height, which is not conducive to the dispersion of pollutants [47].

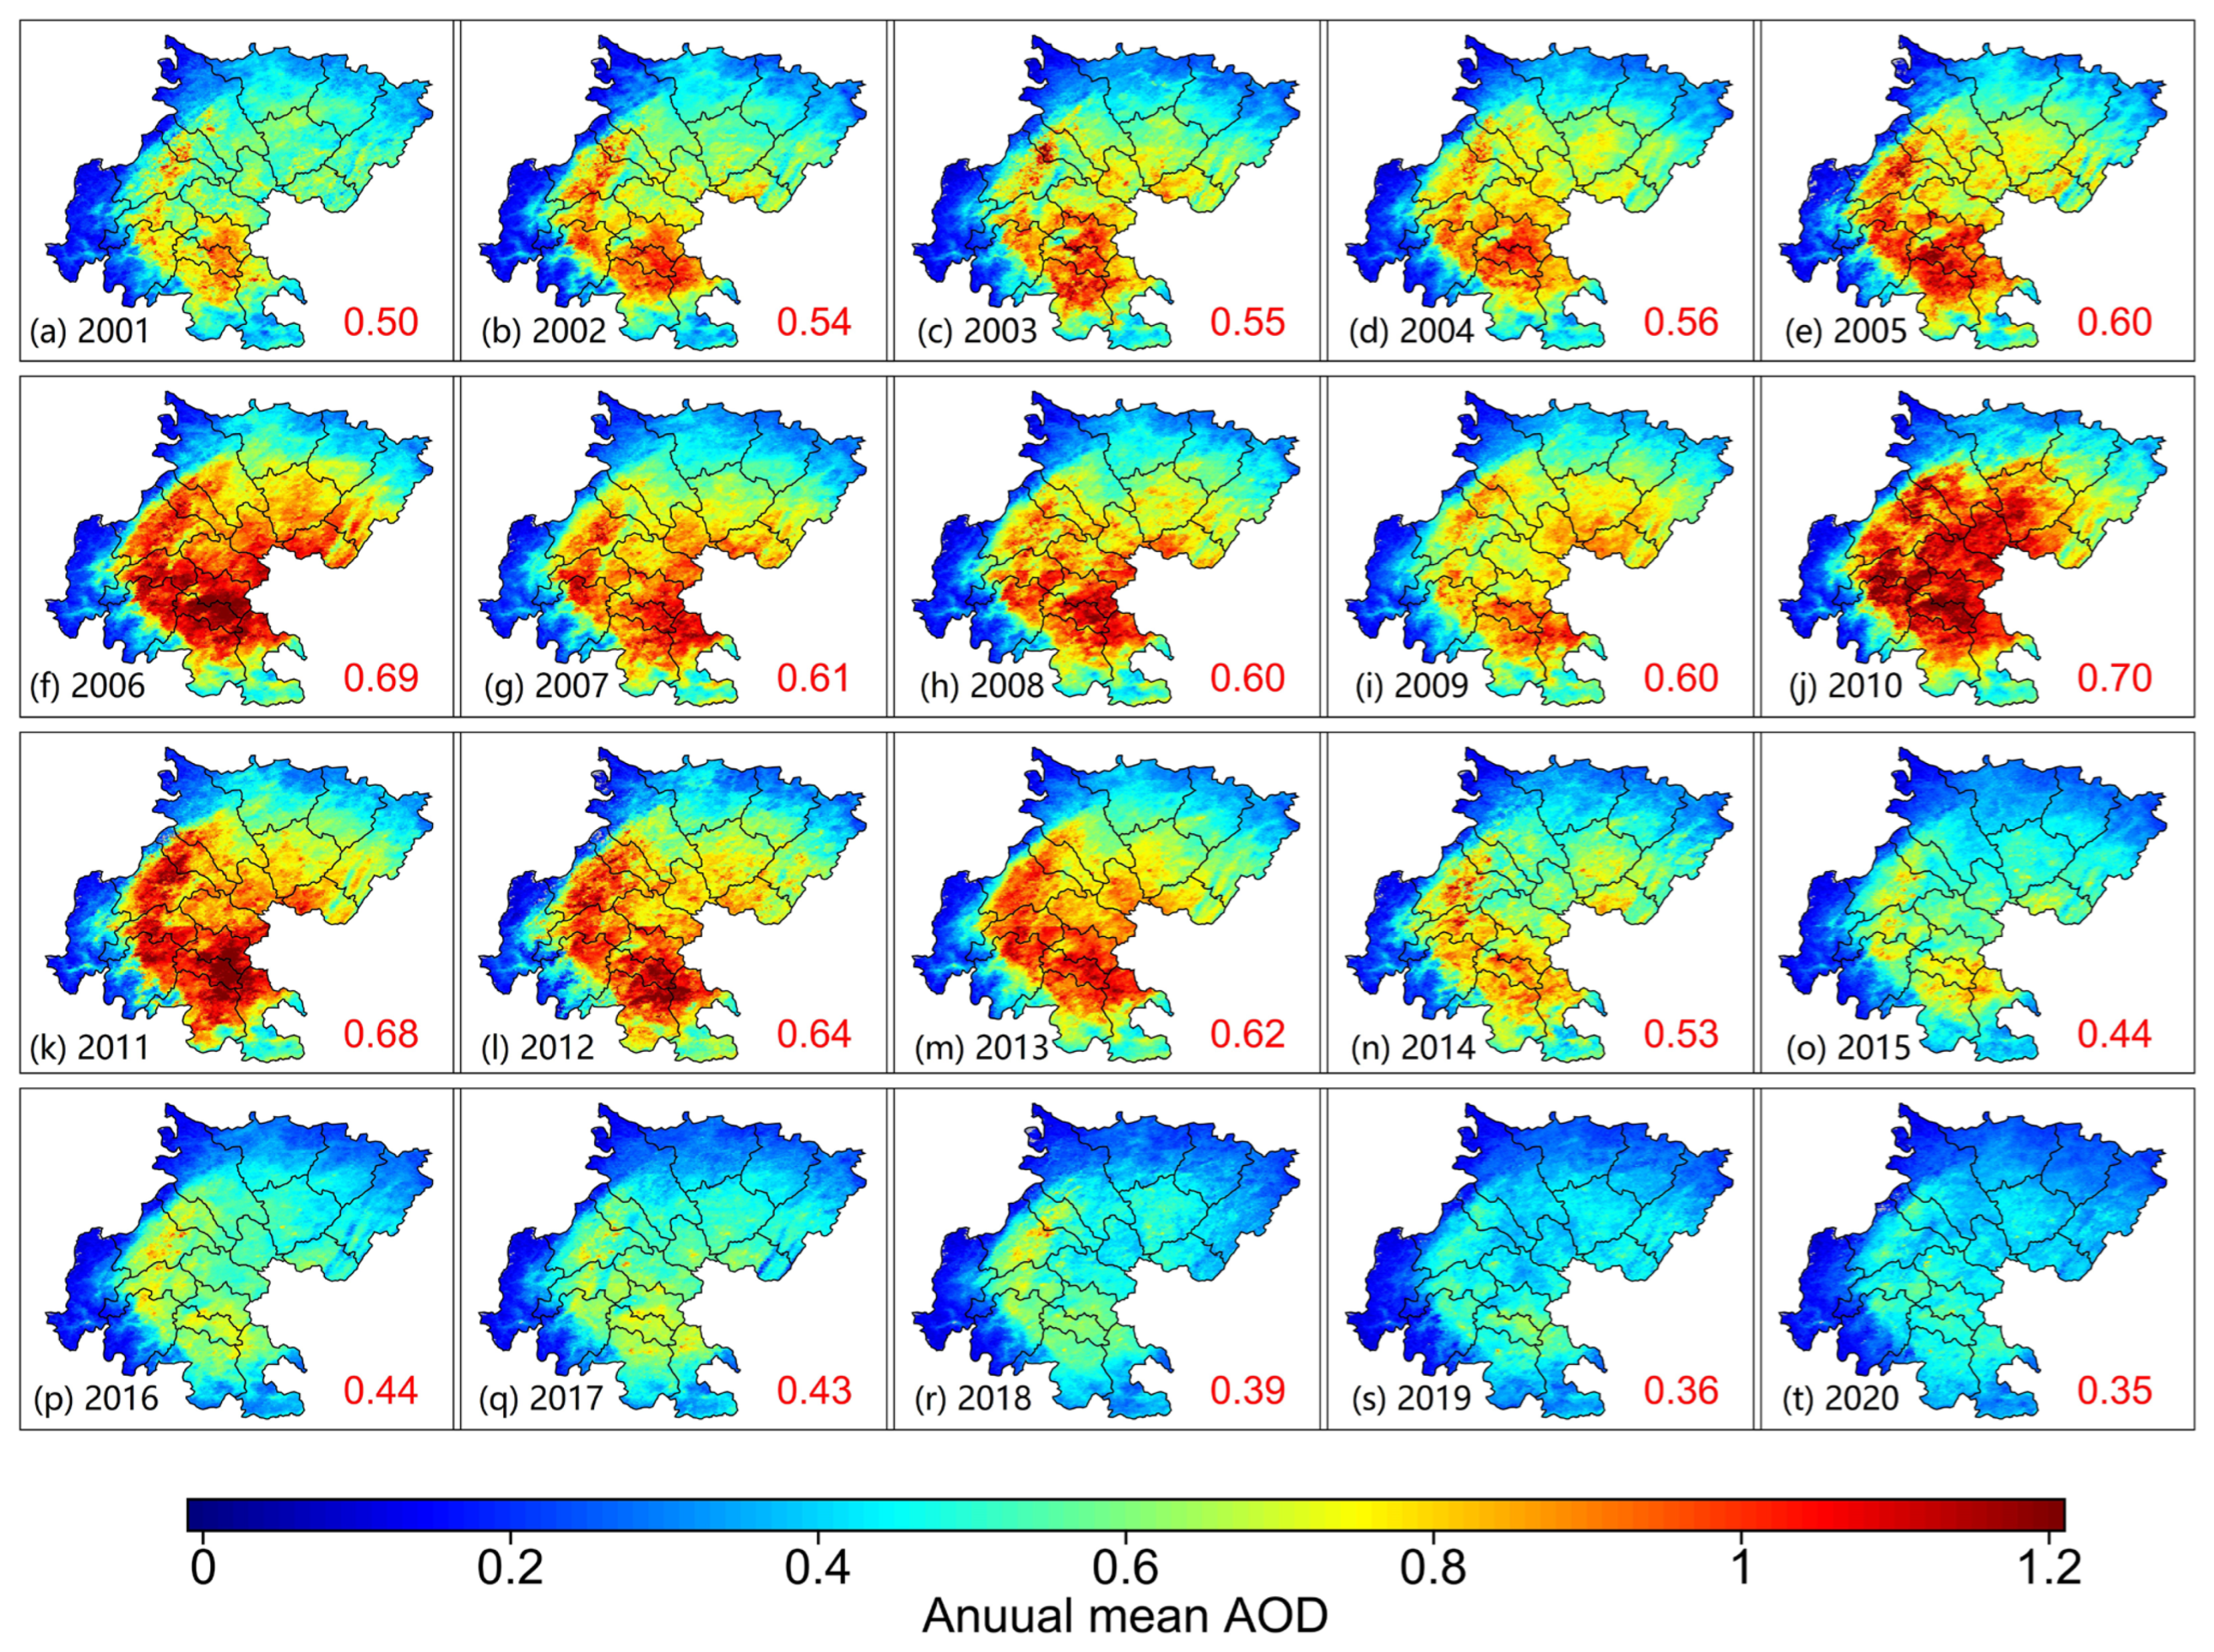
3.3. Spatial Distribution of Interannual AOD in the SCB from 2000 to 2020

The interannual change and spatial distribution of AOD in the SCB from 2001 to 2020 are shown in Figure 6. In 2001, the annual AOD in the SCB was 0.50, the maximum AOD appeared in the southern ZG and NJ districts, the average AOD was about 0.8, and the AOD in other districts was about 0.4~0.56. After 2002, the annual average AOD in the SCB showed an increasing trend, with an overall mean value of 0.54 and the maximum value of AOD increasing to about 1.0. In 2003 and 2004, the average annual AOD in the SCB was 0.55 and 0.56, respectively, and the maximum regional AOD was still concentrated in the southern region. In 2005, the average annual AOD of the SCB increased to 0.60, the distribution area of the higher annual AOD increased, and the maximum value was greater than 1.0. In 2006, the average annual AOD in the SCB increased to 0.69. The distribution range of the highest AOD value increased further, and, in addition to the NJ and ZG districts, the annual average AOD value in the CD and MS districts also increased to 1.0–1.2. From 2007 to 2009, the annual average AOD dropped to about 0.60, and the maximum AOD in the southern SCB decreased to 0.8–0.1. The average annual AOD in the SCB increased to 0.70 in 2010. The range of high AOD districts in the whole region obviously expanded, and the maximum AOD reached 1.2. Similar to the spatial distribution of the annual AOD in 2010, the average annual AOD in 2011 was 0.68, which decreased to 0.64 and 0.62 in 2012 and 2013 in the SCB, respectively. After 2014, the average annual AOD showed a significant decreasing trend in the SCB. The average AOD value in 2014 was 0.53, and the maximum annual AOD in typical regions was about 0.8. The annual mean of AOD in the SCB decreased to 0.44 in 2015–2016 and then further decreased to 0.43 in 2017. From 2018 to 2020, the average value of annual AOD decreased significantly from 0.39 to 0.35 in the SCB. Thus, the interannual variability of AOD in the SCB presented an increasing tendency from 2001 to 2010, with a range of 0.50 to 0.70, whereas AOD presented a declining trend from 2011 to 2020, with a range of 0.68 to 0.35 in the SCB. The interannual variation in AOD is related to emission and meteorological factors, which are discussed in detail in Section 3.5.

3.4. Interannual Variation in Regional AOD at the District Level from 2000 to 2020

As shown in Figure 7, we further investigated the interannual variation in regional AOD in the 17 districts in the SCB from 2001 to 2020. At the seasonal scale, the interannual variation in AOD in the SCB showed a significant trend. Except for DZ, BZ, GY, LS, YA, and MY of the 17 districts, the annual average AOD of the other 11 districts showed significant high values during the spring of 2005 to 2012. In 2003, the highest AOD value in YB was 0.99, and in 2005, the average AOD value in ZG was 1.25, followed by an average AOD value in YB and NJ of 1.0. From 2006 to 2008, high-value AOD areas began to increase, and the three-year average AOD of the ZG and NJ districts was 1.18, 1.12, and 1.18 and 1.11, 1.05, and 1.09, respectively. In 2009, AOD in the SCB decreased, and the AOD values in the 17 districts were all lower than 1.0. From 2010 to 2012, the AOD value of the 17 districts in the SCB began to increase; the maximum AOD value still appeared in ZG, and the average AOD value from 2010 to 2012 was 1.15, 1.14, and 1.18, respectively. In particular, in 2012, the annual AOD of 8 out of the 17 districts exceeded 1.0. From 2013 to 2014, the average value of annual AOD in the ZG and NJ districts in the SCB was about 1.0, and after 2015, the average AOD in the 17 districts showed a decreasing trend, reaching below 0.6–0.5. In summer, the districts with higher interannual AOD had significantly lower values than those in spring. The highest AOD values of the 17 districts in the SCB mostly appeared in 2006 in ZG, NJ, ZY, MS, DY, and CD, with an average AOD value of about 1.00. In 2010, the highest AOD appeared in NC, SN, ZY, and DY, and the value of AOD was 1.01, 1.11, 1.03, and 1.21, respectively. From 2011 to 2012, the highest annual AOD in summer in the SCB was found in ZG and NJ, and the average value was about 1.00. Different from the district scale of summer AOD in the SCB, the maximum annual AOD in autumn in the SCB was concentrated in the ZG, NJ, ZY, and MS districts, especially from 2002 to 2006, and the maximum AOD was 1.46 in ZG in 2006. The interannual change of AOD in the SCB increased significantly in winter. Compared with the average annual high value of AOD in spring before 2012, the average annual high value of AOD in winter in the SCB was concentrated in 2008, 2010, 2011, and 2013. In 2011, the highest annual AOD values appeared in the ZG and NJ districts, with an average AOD of 1.36 and 1.44, respectively.

3.5. Frequency of Occurrence and Interannual Trend of AOD from 2000 to 2020

We analyzed the interannual variation in the occurrence frequency of different AOD levels from 2001 to 2020 in the SCB (Figure 8). We divided the AOD value into 13 levels as follows: 0.0 ≤ AOD < 0.1, 0.1 ≤ AOD < 0.2, 0.2 ≤ AOD < 0.3, 0.3 ≤ AOD < 0.4, 0.4 ≤ AOD < 0.5, 0.5 ≤ AOD < 0.6, 0.6 ≤ AOD < 0.7, 0.7 ≤ AOD < 0.8, 0.8 ≤ AOD < 0.9, 0.9 ≤ AOD < 1.0, 1.0 ≤ AOD < 1.5, 1.5 ≤ AOD < 2.0, and AOD > 2.0.
Except for the YA district, the occurrence frequency in 16 districts of the SCB was small, in the range of 0.0 ≤ AOD < 0.1, indicating that the occurrence frequency of most SCB districts under extreme cleaning conditions was <2%. In the range of 0.0 ≤ AOD < 0.1, the occurrence frequency in YA was significantly higher than that in other districts, greater than 10%. When 0.1 ≤ AOD < 0.2, the frequency occurrence of AOD increased significantly in the 17 districts, among which the frequency of 0.1 ≤ AOD < 0.2 occurrence in MY and LS was between 15 and 20%. In other districts, the occurrence frequency was about 10%. When 0.2 ≤ AOD < 0.3, the highest AOD frequency occurrence in GY, BZ, and DZ was about 20%, and the occurrence frequency in other districts was almost less than 10%. With the further increase in AOD to 0.3 ≤ AOD < 0.4, the maximum frequency of occurrence also appeared in GY, BZ, and DZ at about 20%, and the occurrence frequency in other districts also showed an increasing trend. Within the range of 0.4 ≤ AOD < 0.5, the frequency occurrence in GY, BZ, and DZ began to decrease to about 15%, whereas the occurrence frequency in other districts began to increase to about 10%. The AOD frequency occurrence in the 17 districts was decreased with the increase in AOD when AOD > 0.5. When 0.5 ≤ AOD < 0.6, the AOD frequency occurrence decreased to 10–15% in the 17 districts. When AOD > 0.6, the AOD frequency occurrence in different districts was similar and showed a decreasing trend. In the range of 0.6–1.0, the frequency occurrence of AOD in each district decreased from 10% to 5%, respectively. When 1.0 ≤ AOD < 1.5, the AOD frequency of occurrence increased significantly in each district, which could have been related to the effect of aerosol pollution on aerosol concentration explosion and atmospheric extinction. ZG and NJ had the highest frequency of about 25%. Cai et al. [47] found that the proportion of dust aerosols in NJ and ZG in the SCB was relatively high, accounting for about 30–35%, whereas that in other districts was approximately 10–20%. When AOD > 1.5, the frequency occurrence of AOD in each district was low, and when AOD > 2.0, the AOD frequency occurrence in the 17 districts was less than 1%. The above results show that the frequency of AOD in different districts of the SCB was mainly distributed between 0.2~0.5 and 1.5, accounting for nearly 30% of the total proportion.
We further studied the decadal trend of AOD in the SCB from 2001–2008 and 2009–2020 at the 95% confidence level. In the past 20 years, AOD in the SCB showed different interannual trends. Figure 9 clearly shows an increasing trend of AOD in the SCB from 2001 to 2008, with the highest value occurring in ZY (about 0.4/decade). Interannual AOD in SN, MS, ZG, and LZ increased rapidly at about 0.3/decade, followed by in CD and NJ at a rate of about 0.2/decade and in other districts at a rate of about 0.1/decade. However, the interannual AOD showed a declining trend from 2009 to 2020. The NJ and ZG districts showed a more significant decline in AOD, with a value of −0.7/decade.
Regional AOD variation is closely related to meteorological conditions and anthropogenic emissions, especially mineral dust and biomass-burning emissions, which have significant effects on regional AOD decadal trends [48,49]. The decrease in pollutant emissions in regions such as North America and Europe and the increase in pollutant emissions in regions such as India and China can be explained to some extent by regional AOD variation based on long-term satellite aerosol data records [50,51,52,53,54]. We focused on analyzing the variation in AOD, emissions (SO2, OC, NO2, and PM2.5), and meteorological elements (PBLH, WS, and PPT) in the SCB from 2000 to 2020 (Figure 10). These results show that PM2.5, SO2, and OC were all at high concentration levels in the SCB in 2000, and NO2 concentration also showed a significant positive trend from 2000 to 2013. Therefore, the interannual increase trend of AOD in the SCB before 2008 was closely related to that of anthropogenic emissions. At the same time, the interannual change in meteorological elements in the SCB showed fluctuating variations, which indicates that the interannual variation in AOD is more influenced by anthropogenic emission intensity than meteorological factors.

4. Conclusions

The long-term change in aerosols has a significant effect on the atmospheric environment in different regions of China. It is of great significance to further understand the environmental and climatic effects of aerosols from the perspective of their optical properties. This study analyzed the spatial distribution, interannual change, and frequency of AOD in the SCB from 2001 to 2020 in Southwest China. The aerosol optical properties in Southwest China at the city scale were revealed, and the results show significant long-term variation and high spatial and temporal resolution at the city-scale. The results of this study are of great significance for improving the scientific understanding of aerosol optical characteristics in Southwest China.
The SCB has a high aerosol loading, and AOD is higher than in Northeast, North, and Central China, as well as in the Middle East, South Asia, and Eastern Europe. The annual average AOD in the southern region of the SCB was the highest, and the maximum value reached 1.0. The lowest AOD values occurred in the mountainous areas in the northern and western SCB, with an average annual AOD of less than 0.1. At the district scale, the maximum AOD of the SCB occurred in ZG (AOD~0.87), followed by NJ (AOD~0.82). Terrain and meteorology, as well as local and trans-regional transport of biomass burning, may contribute to the large AOD in the SCB.
The average AOD in the SCB increased to 0.69 in March and was affected by frequent dust transport. The maximum AOD in the ZG, YB, and LZ districts was higher than 1.20, and the average monthly AOD increased to 1.0 in other districts. AOD in the SCB reached the maximum value in August, with an average AOD of 0.52, with fine particles leading to intense aerosol extinction. In November and December, the monthly average AOD in the SCB increased to 0.48 and 0.50, respectively, which could have been related to the pollution emissions, accompanied by the terrain and adverse meteorological elements.
The occurrence frequency of the SCB was less than 2%, in the range of 0.0 ≤ AOD < 0.1, under extreme cleaning conditions. Within the range of 0.1 ≤ AOD < 0.2, the frequency occurrence of AOD increased obviously in the SCB, with ZG and NJ showing the highest occurrence frequency of about 25% when 1.0 ≤ AOD < 1.5. The proportion of dust aerosols in NJ and ZG in the SCB was relatively high due to the influence of dust and sandstorm transport in North China.
There was an increasing trend of AOD in the SCB from 2001 to 2008 and a decreasing trend of AOD from 2009 to 2020. The interannual increasing trend of AOD in the SCB before 2008 was closely related to anthropogenic emissions. The interannual AOD variation in the SCB may have mainly been affected by anthropogenic emissions. Regional AOD variations are closely related to meteorological conditions and anthropogenic emissions, especially mineral dust and biomass-burning emissions, which have significant effects on regional AOD decadal trends. The findings of this paper point out the interannual trend of aerosol loading at the city scale in Southwest China, which is conducive to evaluating the degree of influence of human activities on atmospheric aerosol extinction in Southwest China, and provide a scientific basis for analyzing the change in regional aerosol climate characteristics.
Furthermore, COVID-19 has also had a significant impact on aerosol loading in China. Due to the restriction of human activities, emissions of polluting gases were reduced during the COVID-19 lockdown period. Liang et al. [55] pointed out that aerosol optical depth is affected by natural aerosols, anthropogenic emissions, and meteorological factors, and it shows a trend of decreasing or increasing in different regions of China. Thus, further exploration of the interaction of aerosol optical properties with weather and climate is still needed in future studies.

Author Contributions

Conceptualization, H.C.; methodology, H.C.; software, R.W.; validation, R.W. and H.C.; formal analysis, R.W.; investigation, R.W.; resources, H.C.; data curation, R.W.; writing—original draft preparation, R.W.; writing—review and editing, H.C.; visualization, R.W.; supervision, H.C.; project administration, H.C.; funding acquisition, H.C. All authors have read and agreed to the published version of the manuscript.

Funding

This research was jointly funded by the National Natural Science Foundation of China (U20A2097, 42075087) and the National Key Research and Development Program of China (2021YFC3000902).

Institutional Review Board Statement

Not applicable.

Informed Consent Statement

Not applicable.

Data Availability Statement

AOD products from the MODIS MAIAC algorithm were obtained from the National Aeronautics and Space Administration (https://search.earthdata.nasa.gov/; accessed on 24 September 2023). Meteorological data, including planetary boundary layer height (PBLH), precipitation (PPT), and wind speed at 10 m (WS), came from ECMWF Reanalysis V5 (ERA5) of the European Centre for Medium-Range Weather Forecasts (https://cds.climate.copernicus.eu/; accessed on 24 September 2023). The data of the population were collected by using the 2015 Gridded Population of the World Version 4 dataset from the NASA Socioeconomic Data and Applications Center at Columbia University (https://sedac.ciesin.columbia.edu/data/collection/gpw-v4; accessed on 24 September 2023). Anthropogenic emissions data were derived from MEIC (Multi-resolution Emission In-ventory for China, http://meicmodel.org.cn/; accessed on 24 September 2023).

Acknowledgments

NASA’s MODIS MAIAC team is gratefully acknowledged for making the high-resolution aerosol products publicly accessible and for their efforts to improve aerosol retrieval algorithms.

Conflicts of Interest

The authors declare no conflict of interest.

References

  1. Hansen, J.; Sato, M.; Ruedy, R.; Lacis, A.; Oinas, V. Global warming in the twenty-first century: An alternative scenario. Proc. Natl. Acad. Sci. USA 2000, 97, 9875–9880. [Google Scholar] [CrossRef]
  2. Twomey, S.A.; Piepgrass, M.; Wolfe, T.L. An assessment of the impact of pollution on the global cloud Albedo. Tellus 1984, 36B, 356–366. [Google Scholar] [CrossRef]
  3. Gui, K.; Che, H.; Li, L.; Zheng, Y.; Zhang, L.; Zhao, H.; Zhong, J.; Yao, W.; Liang, Y.; Wang, Y.; et al. The significant contribution of small-sized and spherical aerosol particles to the decreasing trend in total aerosol optical depth over land from 2003 to 2018. Engineering 2022, 16, 82–92. [Google Scholar] [CrossRef]
  4. Zhao, H.; Gui, K.; Ma, Y.; Wang, Y.; Wang, Y.; Wang, H.; Zheng, Y.; Li, L.; Zhang, L.; Che, H.; et al. Climatology and trends of aerosol optical depth with different particle size and shape in northeast China from 2001 to 2018. Sci. Total Environ. 2021, 763, 142979. [Google Scholar] [CrossRef]
  5. Dubovik, O.; Holben, B.N.; Eck, T.F.; Smirnov, A.; Kaufman, Y.J.; King, M.D.; Tanre, D.; Slutsker, I. Variability of absorption and optical properties of key aerosol types observed in worldwide locations. J. Atmos. Sci. 2002, 59, 590–608. [Google Scholar] [CrossRef]
  6. Giles, D.M.; Holben, B.N.; Tripathi, S.N.; Eck, T.F.; Newcomb, W.W.; Slutsker, I.; Dickerson, R.R.; Thompson, A.M.; Mattoo, S.; Wang, S.; et al. Aerosol properties over the Indo-Gangetic Plain: A mesoscale perspective from the TIGERZ experiment. J. Geophys. Res. Atmos. 2011, 116, D18203. [Google Scholar] [CrossRef]
  7. García, O.E.; Díaz, J.P.; Expósito, F.J.; Díaz, A.M.; Dubovik, O.; Dubuisson, P.; Roger, J.-C.; Eck, T.F.; Sinyuk, A.; Derimian, Y.; et al. Validation of AERONET estimates of atmospheric solar fluxes and aerosol radiative forcing by groundbased broadband measurements. J. Geophys. Res. 2008, 113, D21207. [Google Scholar] [CrossRef]
  8. Che, H.; Xia, X.; Zhao, H.; Dubovik, O.; Holben, B.N.; Goloub, P.; Cuevas-Agulló, E.; Estelles, V.; Wang, Y.; Zhu, J.; et al. Spatial distribution of aerosol microphysical and optical properties and direct radiative effect from the China Aerosol Remote Sensing Network. Atmos. Chem. Phys. 2019, 19, 11843–11864. [Google Scholar] [CrossRef]
  9. Gui, K.; Che, H.; Tian, L.; Wang, Y.; Shi, C.; Yao, W.; Liang, Y.; Li, L.; Zheng, Y.; Zhang, L.; et al. Columnar optical, microphysical and radiative properties of the 2022 Hunga Tonga volcanic ash plumes. Sci. Bull. 2022, 67, 2013–2021. [Google Scholar] [CrossRef]
  10. Gui, K.; Yao, W.; Che, H.; An, L.; Zheng, Y.; Li, L.; Zhao, H.; Zhang, L.; Zhong, J.; Wang, Y.; et al. Record-breaking dust loading during two mega dust storm events over northern China in March 2021: Aerosol optical and radiative properties and meteorological drivers. Atmos. Chem. Phys. 2022, 22, 7905–7932. [Google Scholar] [CrossRef]
  11. Holben, B.N.; Eck, T.F.; Slutsker, I.; Tanré, D.; Buis, J.P.; Setzer, A.; Vermote, E.; Reagan, J.A.; Kaufman, Y.J.; Nakajima, T.; et al. AERONET—A federated instrument network and data archive for aerosol characterization. Remote Sens. Environ. 1998, 66, 1–16. [Google Scholar] [CrossRef]
  12. Goloub, P.; Li, Z.; Dubovik, O.; Blarel, L.; Podvin, T.; Jankowiak, I.; Lecoq, R.; Deroo, C.; Chatenet, B.; Morel, J.P.; et al. PHOTONS/ AERONET sunphotometer network overview: Description, activities, results. In Proceedings of the Fourteenth International Symposium on Atmospheric and Ocean Optics/atmospheric Physics, Buryatia, Russia, 24–30 June 2007. [Google Scholar]
  13. Bokoye, A.I.; Royer, A.; O’Neill, N.T.; Fedosejevs, G.; Teillet, P.M.; McArthur, B. Characterization of atmospheric aerosols across Canada. Assessment from a ground-based sunphotometer network: AEROCAN. Atmos. Ocean 2001, 39, 429–456. [Google Scholar] [CrossRef]
  14. Takamura, T.; Nakajima, T. Overview of SKYNET and its activities. Opt. Pura Apl. 2004, 37, 3303–3308. [Google Scholar]
  15. Pappalardo, G.; Amodeo, A.; Apituley, A.; Comeron, A.; Freudenthaler, V.; Linné, H.; Ansmann, A.; Bosenberg, J.; D’Amico, G.; Mattis, I.; et al. EARLINET: Towards an advanced sustainable European aerosol lidar network. Atmos. Meas. Tech. 2014, 7, 2389–2409. [Google Scholar] [CrossRef]
  16. Estellés, V.; Campanelli, M.; Utrillas, M.P.; Expósito, F.; Martínezlozano, J.A. Comparison of AERONET and SKYRAD4.2 inversion products retrieved from a Cimel CE318 sunphotometer. Atmos. Meas. Tech. 2012, 4, 569–579. [Google Scholar] [CrossRef]
  17. Wehrli, C. Calibration of filter radiometers for the GAW aerosol optical depth network at jungfraujoch and mauna loa. In Proceedings of the ARJ Workshop, SANW Congress, Davos, Switzerland, 18 September 2002; pp. 70–71. [Google Scholar]
  18. Che, H.; Zhang, X.; Chen, H.; Damiri, B.; Goloub, P.; Li, Z.; Zhang, X.; Wei, Y.; Zhou, H.; Dong, F.; et al. Instrument calibration and aerosol optical depth validation of the China Aerosol Remote Sensing Network. J. Geophys. Res. 2009, 114, D03206. [Google Scholar] [CrossRef]
  19. Li, Z.Q.; Xu, H.; Li, K.T.; Li, D.H.; Xie, Y.S.; Li, L.; Zhang, Y.; Gu, X.F.; Zhao, W.; Tian, Q.J.; et al. Comprehensive study of optical, physical, chemical, and radiative properties of total columnar atmospheric aerosols over China: An overview of Sun–Sky Radiometer Observation Network (SONET) measurements. Bull. Am. Meteorol. Soc. 2018, 99, 739–755. [Google Scholar] [CrossRef]
  20. Xin, J.; Wang, Y.; Li, Z.; Wang, P.; Hao, W.M.; Nordgren, B.L.; Wang, S.; Liu, G.; Wang, L.; Wen, T.; et al. Aerosol optical depth (AOD) and Ångström exponent of aerosols observed by the Chinese Sun Hazemeter Network from August 2004 to September 2005. J. Geophys. Res. 2007, 112, D05203. [Google Scholar] [CrossRef]
  21. Che, H.; Xia, X.; Zhu, J.; Li, Z.; Dubovik, O.; Holben, B.; Goloub, P.; Chen, H.; Estelles, V.; Cuevas-Agulló, E.; et al. Column aerosol optical properties and aerosol radiative forcing during a serious haze-fog month over North China Plain in 2013 based on ground-based sunphotometer measurements. Atmos. Chem. Phys. 2014, 14, 2125–2138. [Google Scholar] [CrossRef]
  22. Che, H.; Qi, B.; Zhao, H.; Xia, X.; Eck, T.F.; Goloub, P.; Dubovik, O.; Estelles, V.; Cuevas-Agulló, E.; Blarel, L.; et al. Aerosol optical properties and direct radiative forcing based on measurements from the China Aerosol Remote Sensing Network (CARSNET) in eastern China. Atmos. Chem. Phys. 2018, 18, 405–425. [Google Scholar] [CrossRef]
  23. Zhao, H.; Che, H.; Zhang, X.; Ma, Y.; Wang, Y.; Wang, X.; Liu, C.; Hou, B.; Che, H. Aerosol optical properties over urban and industrial region of Northeast China by using ground-based sun-photometer Measurement. Atmos. Environ. 2013, 75, 270–278. [Google Scholar] [CrossRef]
  24. Zhao, H.; Che, H.; Xia, X.; Wang, Y.; Wang, H.; Wang, P.; Ma, Y.; Yang, H.; Liu, Y.; Wang, Y.; et al. Multi-year ground-based measurements of aerosol optical properties and direct radiative effect over different surface types in northeastern China. J. Geophys. Res. Atmos. 2018, 123, 13887–13916. [Google Scholar] [CrossRef]
  25. Zhao, H.; Che, H.; Zhang, L.; Gui, K.; Ma, Y.; Wang, Y.; Wang, H.; Zheng, Y.; Zhang, X. How aerosol transport from the North China plain contributes to air quality in northeast China. Sci. Total Environ. 2020, 738, 139555. [Google Scholar] [CrossRef] [PubMed]
  26. Gui, K.; Che, H.; Zheng, Y.; Zhao, H.; Yao, W.; Li, L.; Zhang, L.; Wang, H.; Wang, Y.; Zhang, X. Three-dimensional climatology, trends, and meteorological drivers of global and regional tropospheric type-dependent aerosols: Insights from 13 years (2007–2019) of CALIOP observations. Atmos. Chem. Phys. 2021, 21, 15309–15336. [Google Scholar] [CrossRef]
  27. Levy, R.C.; Mattoo, S.; Munchak, L.A.; Remer, L.A.; Sayer, A.M.; Hsu, N.C. The collection 6 MODIS aerosol products over land and ocean. Atmos. Meas. Tech. 2013, 6, 2989–3034. [Google Scholar] [CrossRef]
  28. Remer, L.A.; Kaufman, Y.J.; Tanre, D.; Mattoo, S.; Chu, D.A.; Martins, J.V.; Li, R.R.; Ichoku, C.; Levy, R.C.; Kleidman, R.G.; et al. The MODIS aerosol algorithm, products, and validation. J. Atmos. Sci. 2005, 62, 947–973. [Google Scholar] [CrossRef]
  29. Kahn, R.; Gaitley, B.J.; Garay, M.J.; Diner, D.J.; Eck, T.F.; Smirnov, A.; Holben, B.N. Multiangle Imaging SpectroRadiometer global aerosol product assessment by comparison with the Aerosol Robotic Network. J. Geophys. Res. Atmos. 2010, 115, D23209. [Google Scholar] [CrossRef]
  30. Salomonson, V.V.; Barnes, W.L.; Maymon, P.W.; Montgomery, H.E.; Ostrow, H. MODIS: Advanced facility instrument for studies the Earth as a system. IEEE Trans. Geosci. Remote. Sens. 1989, 27, 145–153. [Google Scholar] [CrossRef]
  31. Kahn, R.A.; Gaitley, B.J. An analysis of global aerosol type as retrieved by MISR. J. Geophys. Res. Atmos. 2015, 120, 4248–4281. [Google Scholar] [CrossRef]
  32. Chen, Y.; Xie, S. Temporal and spatial visibility trends in the Sichuan Basin, China, 1973 to 2010. Atmos. Res. 2012, 112, 25–34. [Google Scholar] [CrossRef]
  33. Luo, Y.F.; Li, W.L.; Zhou, X.J.; He, Q.; Qing, J.Z. Analysis of the atmospheric aerosol optical depth over China in 1980s. Acta Meteorol. Sin. 2000, 14, 490–502. [Google Scholar]
  34. Zhang, X.; Sun, J.; Wang, Y.; Li, W.; Zhang, Q.; Wang, W.; Quan, J.; Cao, G.; Wang, J.; Yang, Y.; et al. Factors contributing to haze and fog in China. Chin. Sci. Bull. 2013, 58, 1178–1187. [Google Scholar]
  35. Che, H.; Gui, K.; Xia, X.; Wang, Y.; Holben, B.N.; Goloub, P.; Cuevas-Agulló, E.; Wang, H.; Zheng, Y.; Zhao, H.; et al. Large contribution of meteorological factors to interdecadal changes in regional aerosol optical depth. Atmos. Chem. Phys. 2019, 19, 10497–10523. [Google Scholar] [CrossRef]
  36. Li, Y.; Chen, Q.; Zhao, H.; Wang, L.; Tao, R. Variations in PM10, PM2.5 and PM1.0 in an Urban Area of the Sichuan Basin and Their Relation to Meteorological Factors. Atmosphere 2015, 6, 150–163. [Google Scholar] [CrossRef]
  37. Sayer, A.M.; Munchak, L.A.; Hsu, N.C.; Levy, R.C.; Bettenhausen, C.; Jeong, M.-J. MODIS Collection 6 aerosol products: Comparison between Aqua’s e-Deep Blue, Dark Target, and “merged” data sets, and usage recommendations. J. Geophys. Res. Atmos. 2014, 119, 13965–13989. [Google Scholar] [CrossRef]
  38. Kaufman, Y.J.; Tanré, D.; Boucher, O. A satellite view of aerosols in the climate system. Nature 2002, 419, 215–223. [Google Scholar] [CrossRef]
  39. Lyapustin, A.I.; Wang, Y.; Laszlo, I.; Hilker, T.; Hall, F.G.; Sellers, P.J.; Tucker, C.J.; Korkin, S.V. Multi-angle implementation of atmospheric correction for MODIS (MAIAC): 3. Atmospheric correction. Remote Sens. Environ. 2012, 127, 385–393. [Google Scholar] [CrossRef]
  40. Lyapustin, A.; Wang, Y.; Korkin, S.; Huang, D. MODIS Collection 6 MAIAC algorithm. Atmos. Meas. Tech. 2018, 11, 5741–5765. [Google Scholar] [CrossRef]
  41. Liao, T.; Gui, K.; Li, Y.; Wang, X.; Sun, Y. Seasonal distribution and vertical structure of different types of aerosols in southwest China observed from CALIOP. Atmos. Environ. 2021, 246, 118145. [Google Scholar] [CrossRef]
  42. Liu, X.; Chen, Q.; Che, H.; Zhang, R.; Gui, K.; Zhang, H.; Zhao, T. Spatial distribution and temporal variation of aerosol optical depth in the Sichuan basin, China, the recent ten years. Atmos. Environ. 2016, 147, 434–445. [Google Scholar] [CrossRef]
  43. Godhani, N.; Joshi, H.; Jana, S.; Gogoi, M.M.; Babu, S.S. Columnar aerosol optical depth, water vapor and ozone over a semi-arid urban location of western India: Potential sources and direct radiative effects. Adv. Space Res. 2022, 70, 3092–3106. [Google Scholar] [CrossRef]
  44. Rupakheti, D.; Aculinin, A.; Rupakheti, M.; Dahal, S.; Rai, M.; Yin, X.; Yu, X.; Abdullaev, S.F.; Hu, J. Insights on aerosol properties using two decades-long ground-based remote sensing datasets in Moldova, Eastern Europe. Environ. Pollut. 2023, 337, 122535. [Google Scholar] [CrossRef] [PubMed]
  45. Cai, H.; Wang, Y.; Luo, W.; Chen, Q. City-level variations in aerosol optical properties and aerosol type identification derived from long-term MODIS/Aqua observations in the Sichuan Basin, China. Urban Clim. 2021, 38, 100886. [Google Scholar] [CrossRef]
  46. Cai, H.; Gui, K.; Jiang, W.; Mao, Y.; Yang, Y.; Zhao, Z. Climatology and interannual variability of type-dependent aerosol optical depth and vertical distribution over southwest China and northern India from multiple satellite and aerosol reanalysis datasets. Atmos. Environ. 2023, 294, 119528. [Google Scholar] [CrossRef]
  47. Zhao, H.; Che, H.; Xia, X.; Wang, Y.; Wang, H.; Wang, P.; Ma, Y.; Yang, H.; Liu, Y.; Wang, Y.; et al. Climatology of mixing layer height in China based on multi-year meteorological data from 2000 to 2013. Atmos. Environ. 2019, 213, 90–103. [Google Scholar] [CrossRef]
  48. Pozzer, A.; de Meij, A.; Yoon, J.; Tost, H.; Georgoulias, A.K.; Astitha, M. AOD trends during 2001–2010 from observations and model simulations. Atmos. Chem. Phys. 2015, 15, 5521–5535. [Google Scholar] [CrossRef]
  49. Klingmüller, K.; Pozzer, A.; Metzger, S.; Stenchikov, G.L.; Lelieveld, J. Aerosol optical depth trend over the Middle East. Atmos. Chem. Phys. 2016, 16, 5063–5073. [Google Scholar] [CrossRef]
  50. Hammer, M.S.; Martin, R.V.; Li, C.; Torres, O.; Manning, M.; Boys, B.L. Insight into global trends in aerosol composition from 2005 to 2015 inferred from the OMI Ultraviolet Aerosol Index. Atmos. Chem. Phys. 2018, 18, 8097–8112. [Google Scholar] [CrossRef]
  51. Zheng, B.; Tong, D.; Li, M.; Liu, F.; Hong, C.; Geng, G.; Li, H.; Li, X.; Peng, L.; Qi, J.; et al. Trends in China’s anthropogenic emissions since 2010 as the consequence of clean air actions. Atmos. Chem. Phys. 2018, 18, 14095–14111. [Google Scholar] [CrossRef]
  52. de Meij, A.; Pozzer, A.; Lelieveld, J. Trend analysis in aerosol optical depths and pollutant emission estimates between 2000 and 2009. Atmos. Environ. 2012, 51, 75–85. [Google Scholar] [CrossRef]
  53. Itahashi, S.; Uno, I.; Yumimoto, K.; Irie, H.; Osada, K.; Ogata, K.; Fukushima, H.; Wang, Z.; Ohara, T. Interannual variation in the fine-mode MODIS aerosol optical depth and its relationship to the changes in sulfur dioxide emissions in China between 2000 and 2010. Atmos. Chem. Phys. 2012, 12, 2631–2640. [Google Scholar] [CrossRef]
  54. Feng, Y.; Chen, D.; Ouyang, X.; Zhang, X. Variability of satellite-based total aerosols and the relationship with emission, meteorology and landscape in North China during 2000–2016. Environ. Earth Sci. 2018, 77, 499. [Google Scholar] [CrossRef]
  55. Liang, Y.; Gui, K.; Che, H.; Li, L.; Zheng, Y.; Zhang, X.; Zhang, D.; Zhang, P.; Zhang, X. Changes in aerosol loading before, during and after the COVID-19 pandemic outbreak in China: Effects of anthropogenic and natural aerosol. Sci. Total Environ. 2023, 857, 159435. [Google Scholar] [CrossRef] [PubMed]
Figure 1. Terrain and distribution of the 17 districts of the SCB.
Atmosphere 14 01715 g001
Figure 2. Spatial distribution of (a) the population density and (b) SO2 emissions in the SCB.
Atmosphere 14 01715 g002
Figure 3. Multi-year climatology of (a) the AOD distribution in the SCB and (b) region-averaged values for 17 subordinate cities.
Atmosphere 14 01715 g003
Figure 4. Seasonal spatial distribution of AOD in the SCB, (a) MAM stands for the spring, (b) JJA stands for the summer, (c) SON stands for the autumn, (d) DJF stands for the winter. The number in the lower right corner of each panel indicates the region-averaged AOD value in the SCB.
Atmosphere 14 01715 g004
Figure 5. Spatial distribution of monthly AOD in the SCB. The number in the lower right corner of each panel indicates the region-averaged AOD in the SCB.
Atmosphere 14 01715 g005
Figure 6. Spatial distribution of interannual AOD in the SCB. The number in the lower right corner of each panel indicates the region-averaged AOD in the SCB.
Atmosphere 14 01715 g006
Figure 7. Interannual variation in AOD in the 17 districts of the SCB from 2001 to 2020.
Atmosphere 14 01715 g007
Figure 8. AOD occurrence frequency in the 17 districts of the SCB during 2001–2020.
Atmosphere 14 01715 g008
Figure 9. Interannual variation in average regional (a) AOD, (b) emissions, and (c) meteorological changes in the SCB.
Atmosphere 14 01715 g009
Figure 10. Annual trends of AOD in the 17 districts of the SCB. The trend values with a black circle symbol indicate trends above the 90% significance level.
Atmosphere 14 01715 g010
Disclaimer/Publisher’s Note: The statements, opinions and data contained in all publications are solely those of the individual author(s) and contributor(s) and not of MDPI and/or the editor(s). MDPI and/or the editor(s) disclaim responsibility for any injury to people or property resulting from any ideas, methods, instructions or products referred to in the content.

