Application of Portable CH4 Detector Based on TDLAS Technology in Natural Gas Purification Plant

Abstract
:1. Introduction
2. Materials and Methods
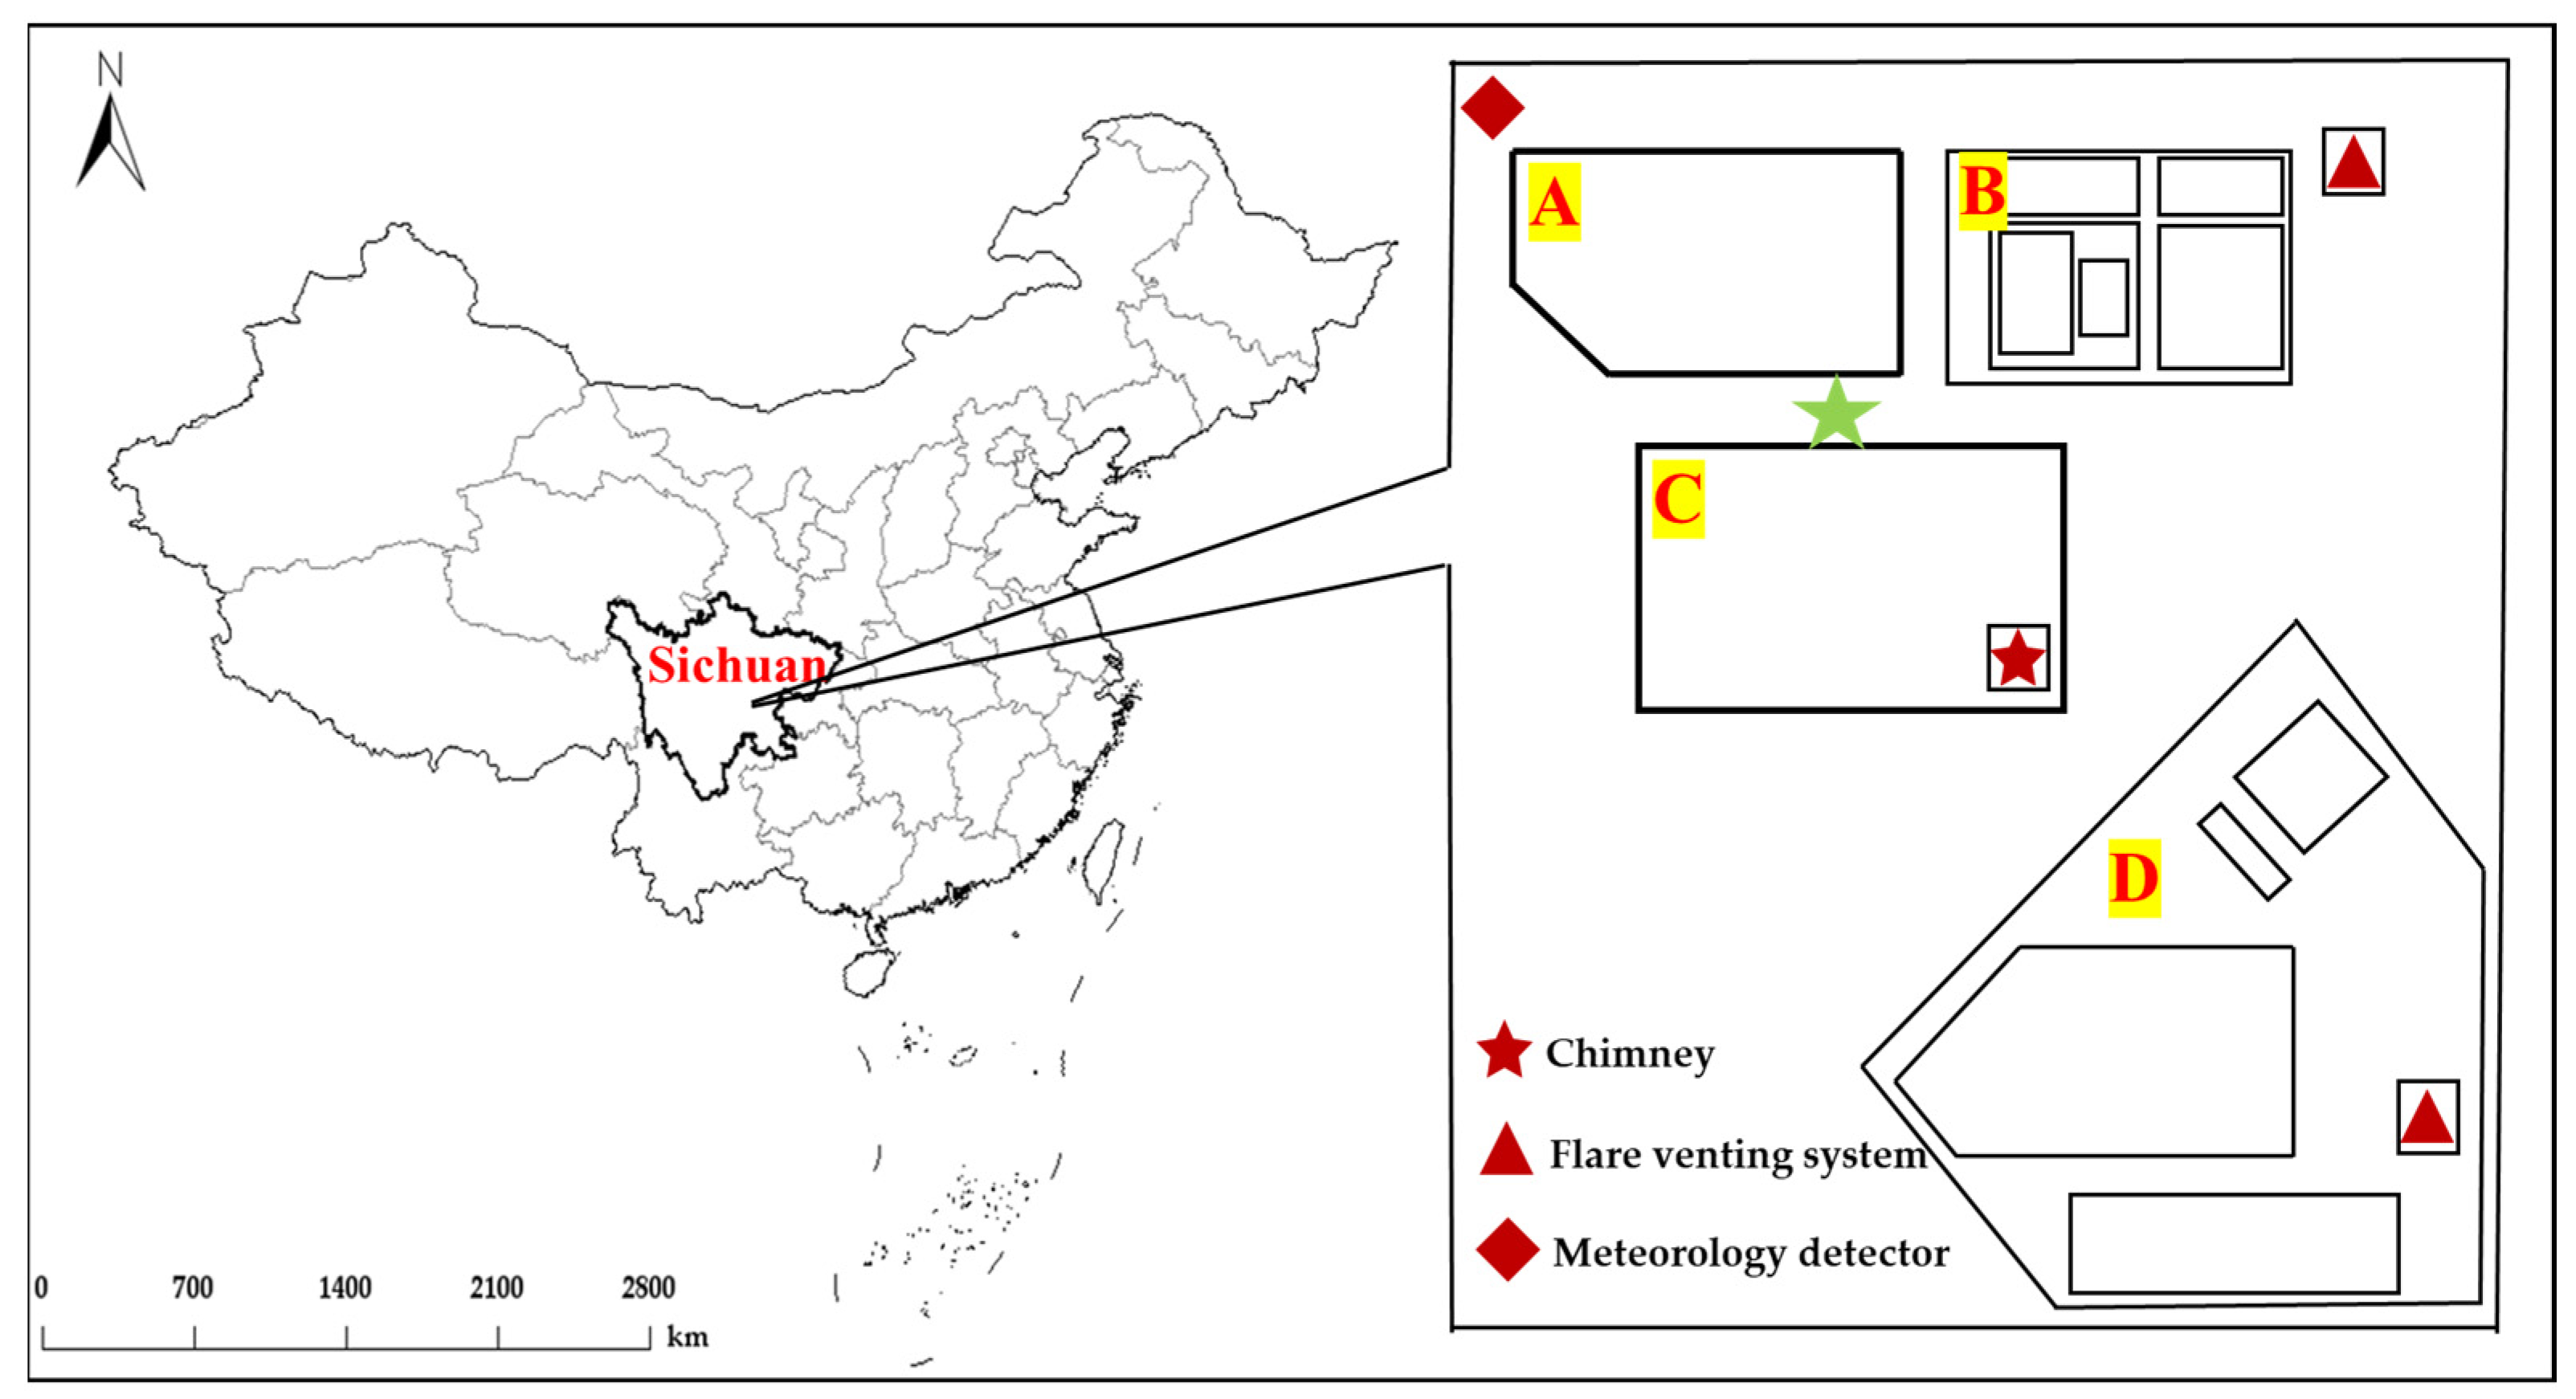
2.1. Sampling Site
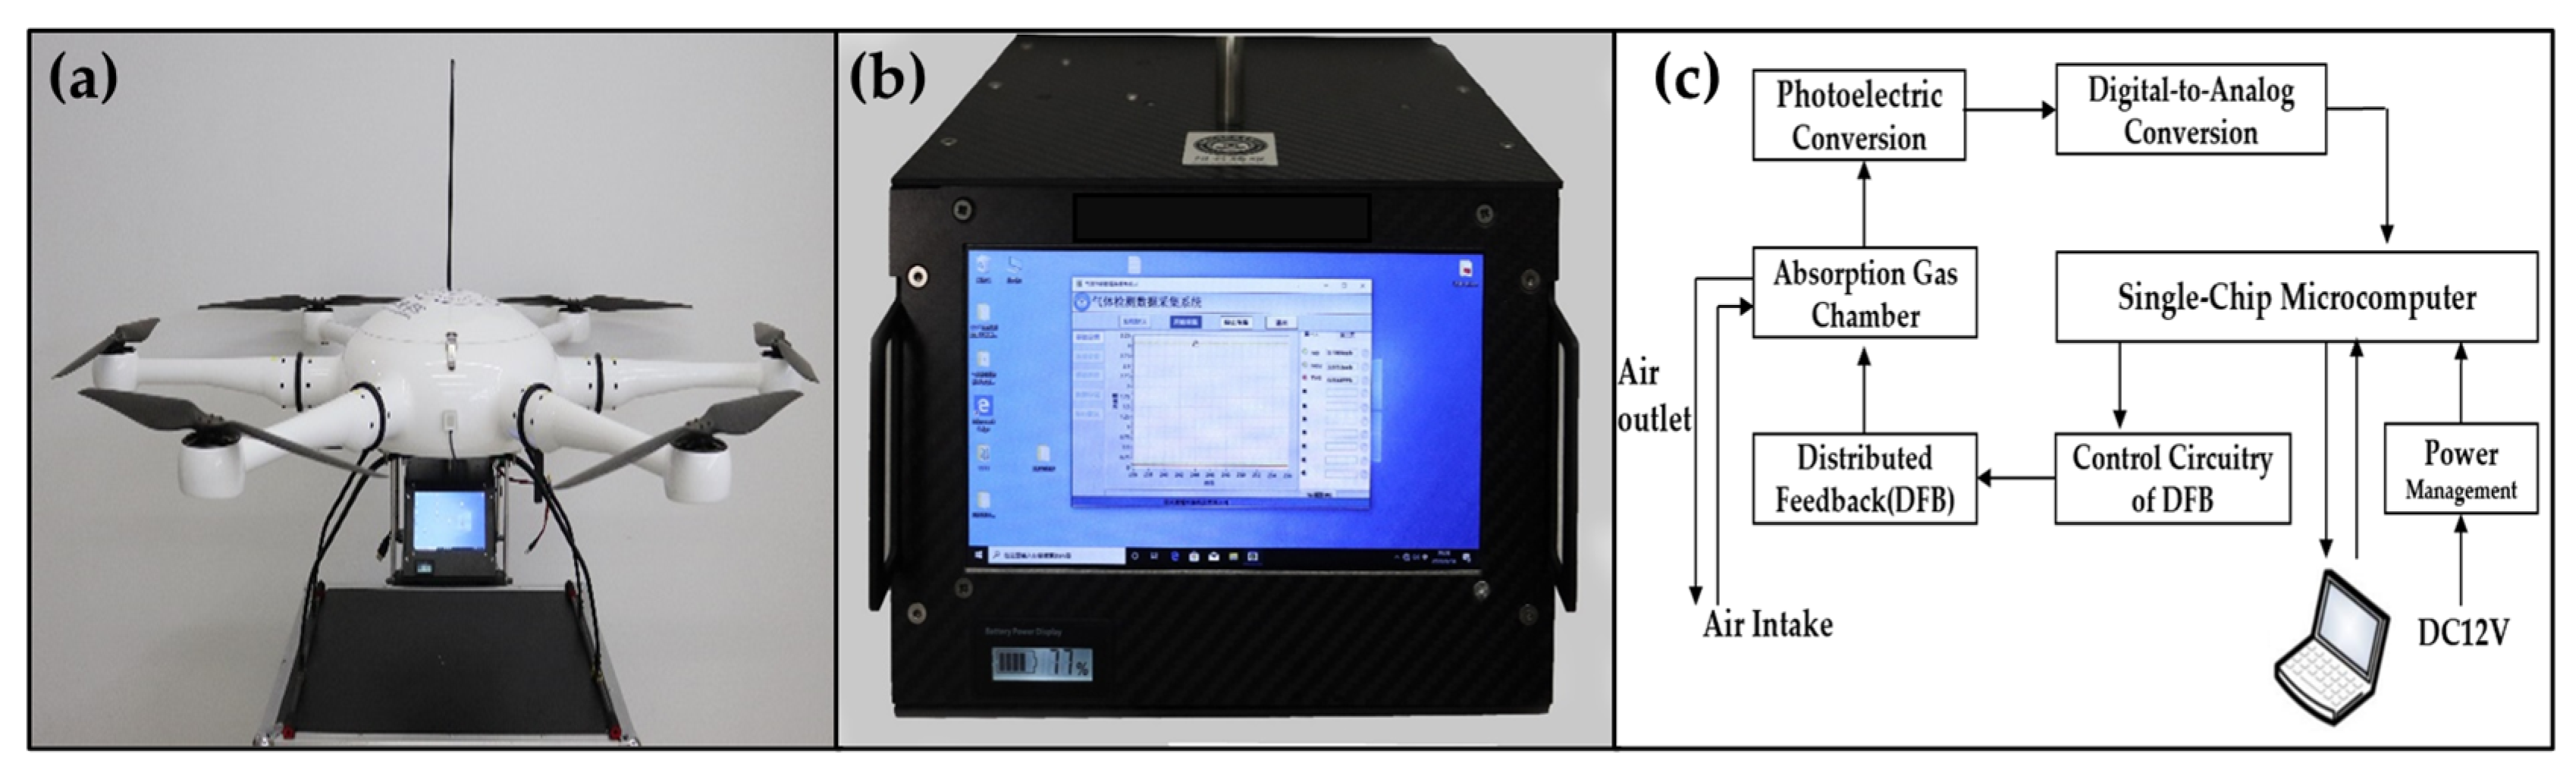
2.2. Apparatus
2.3. Experimental Process
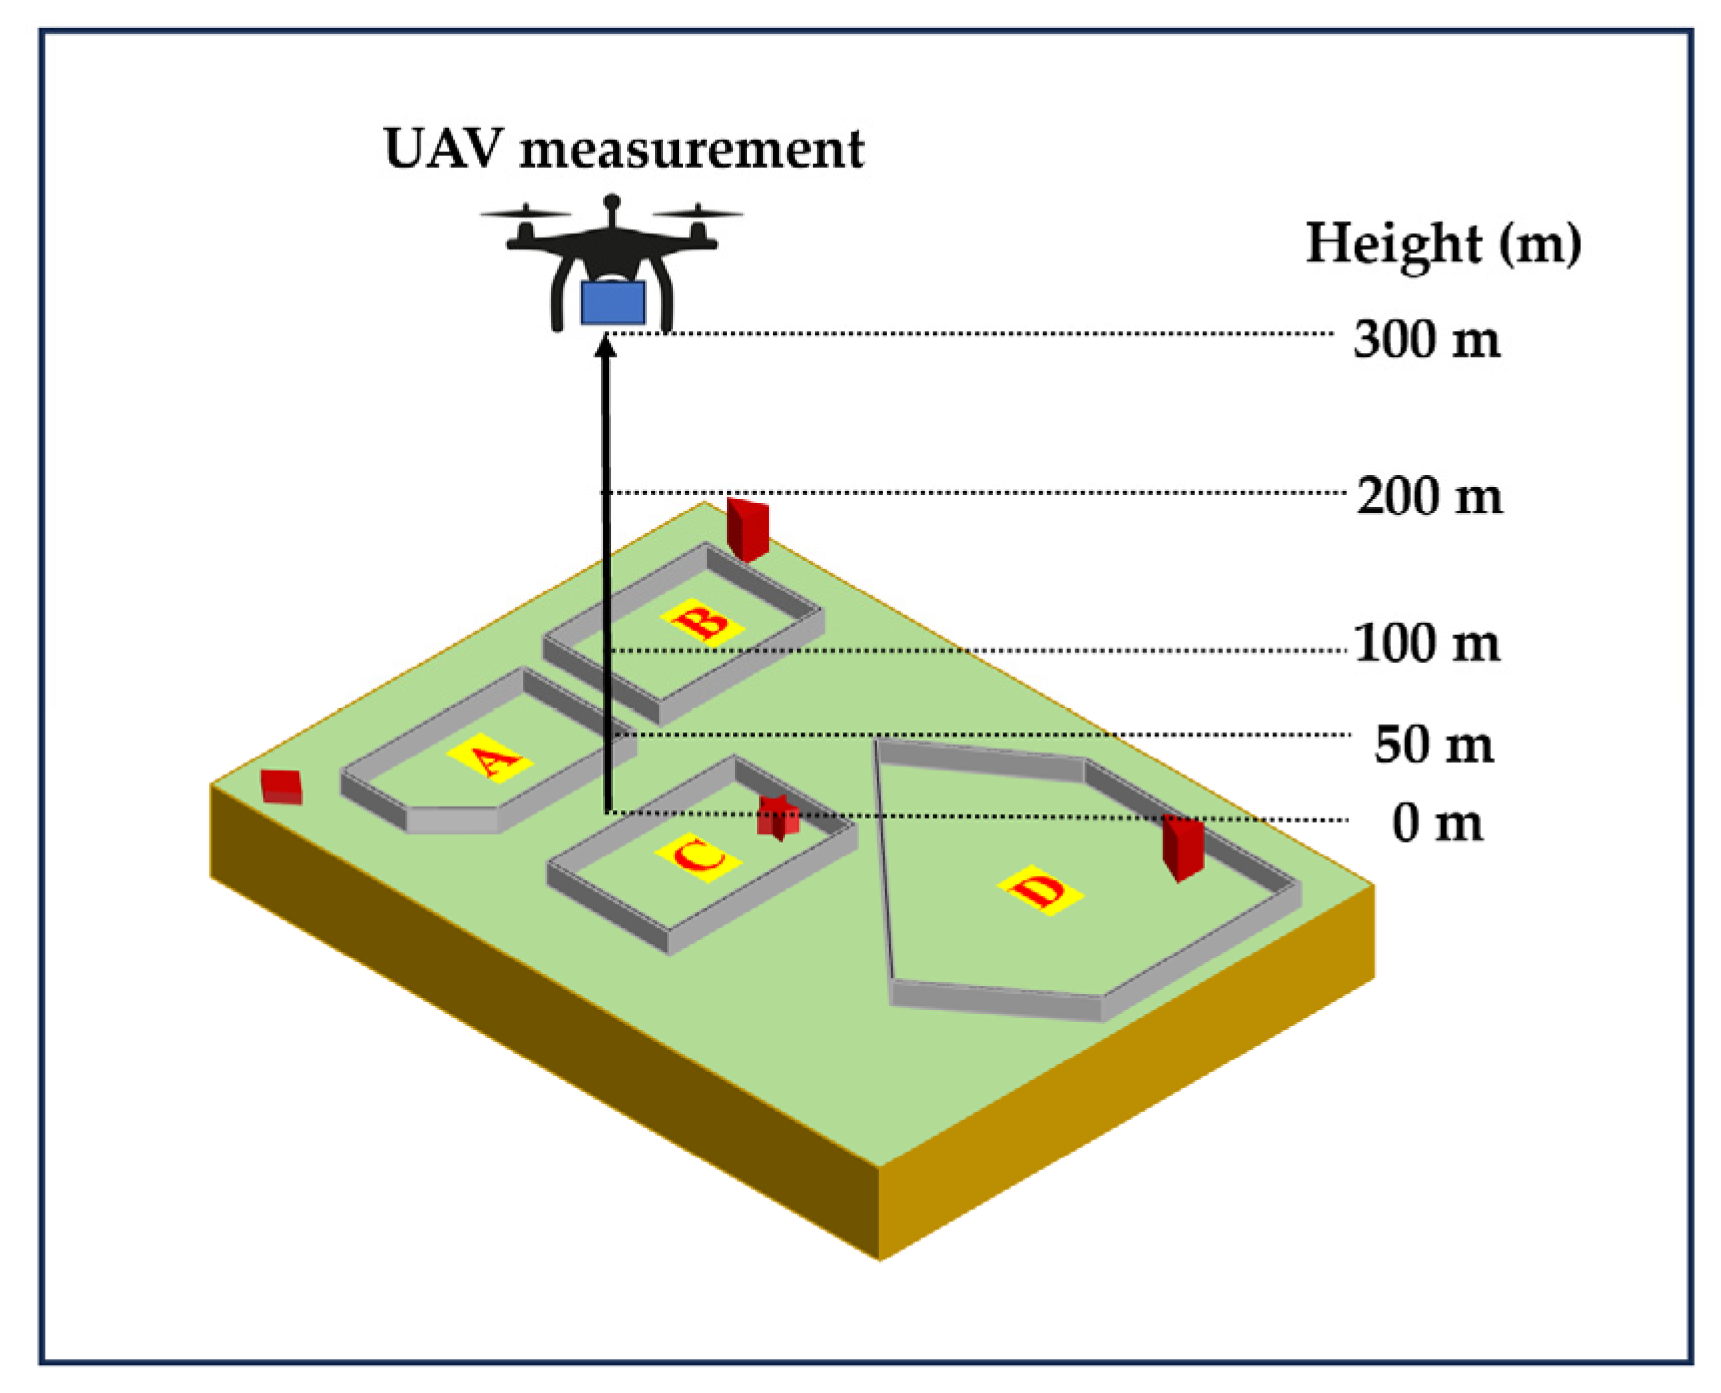
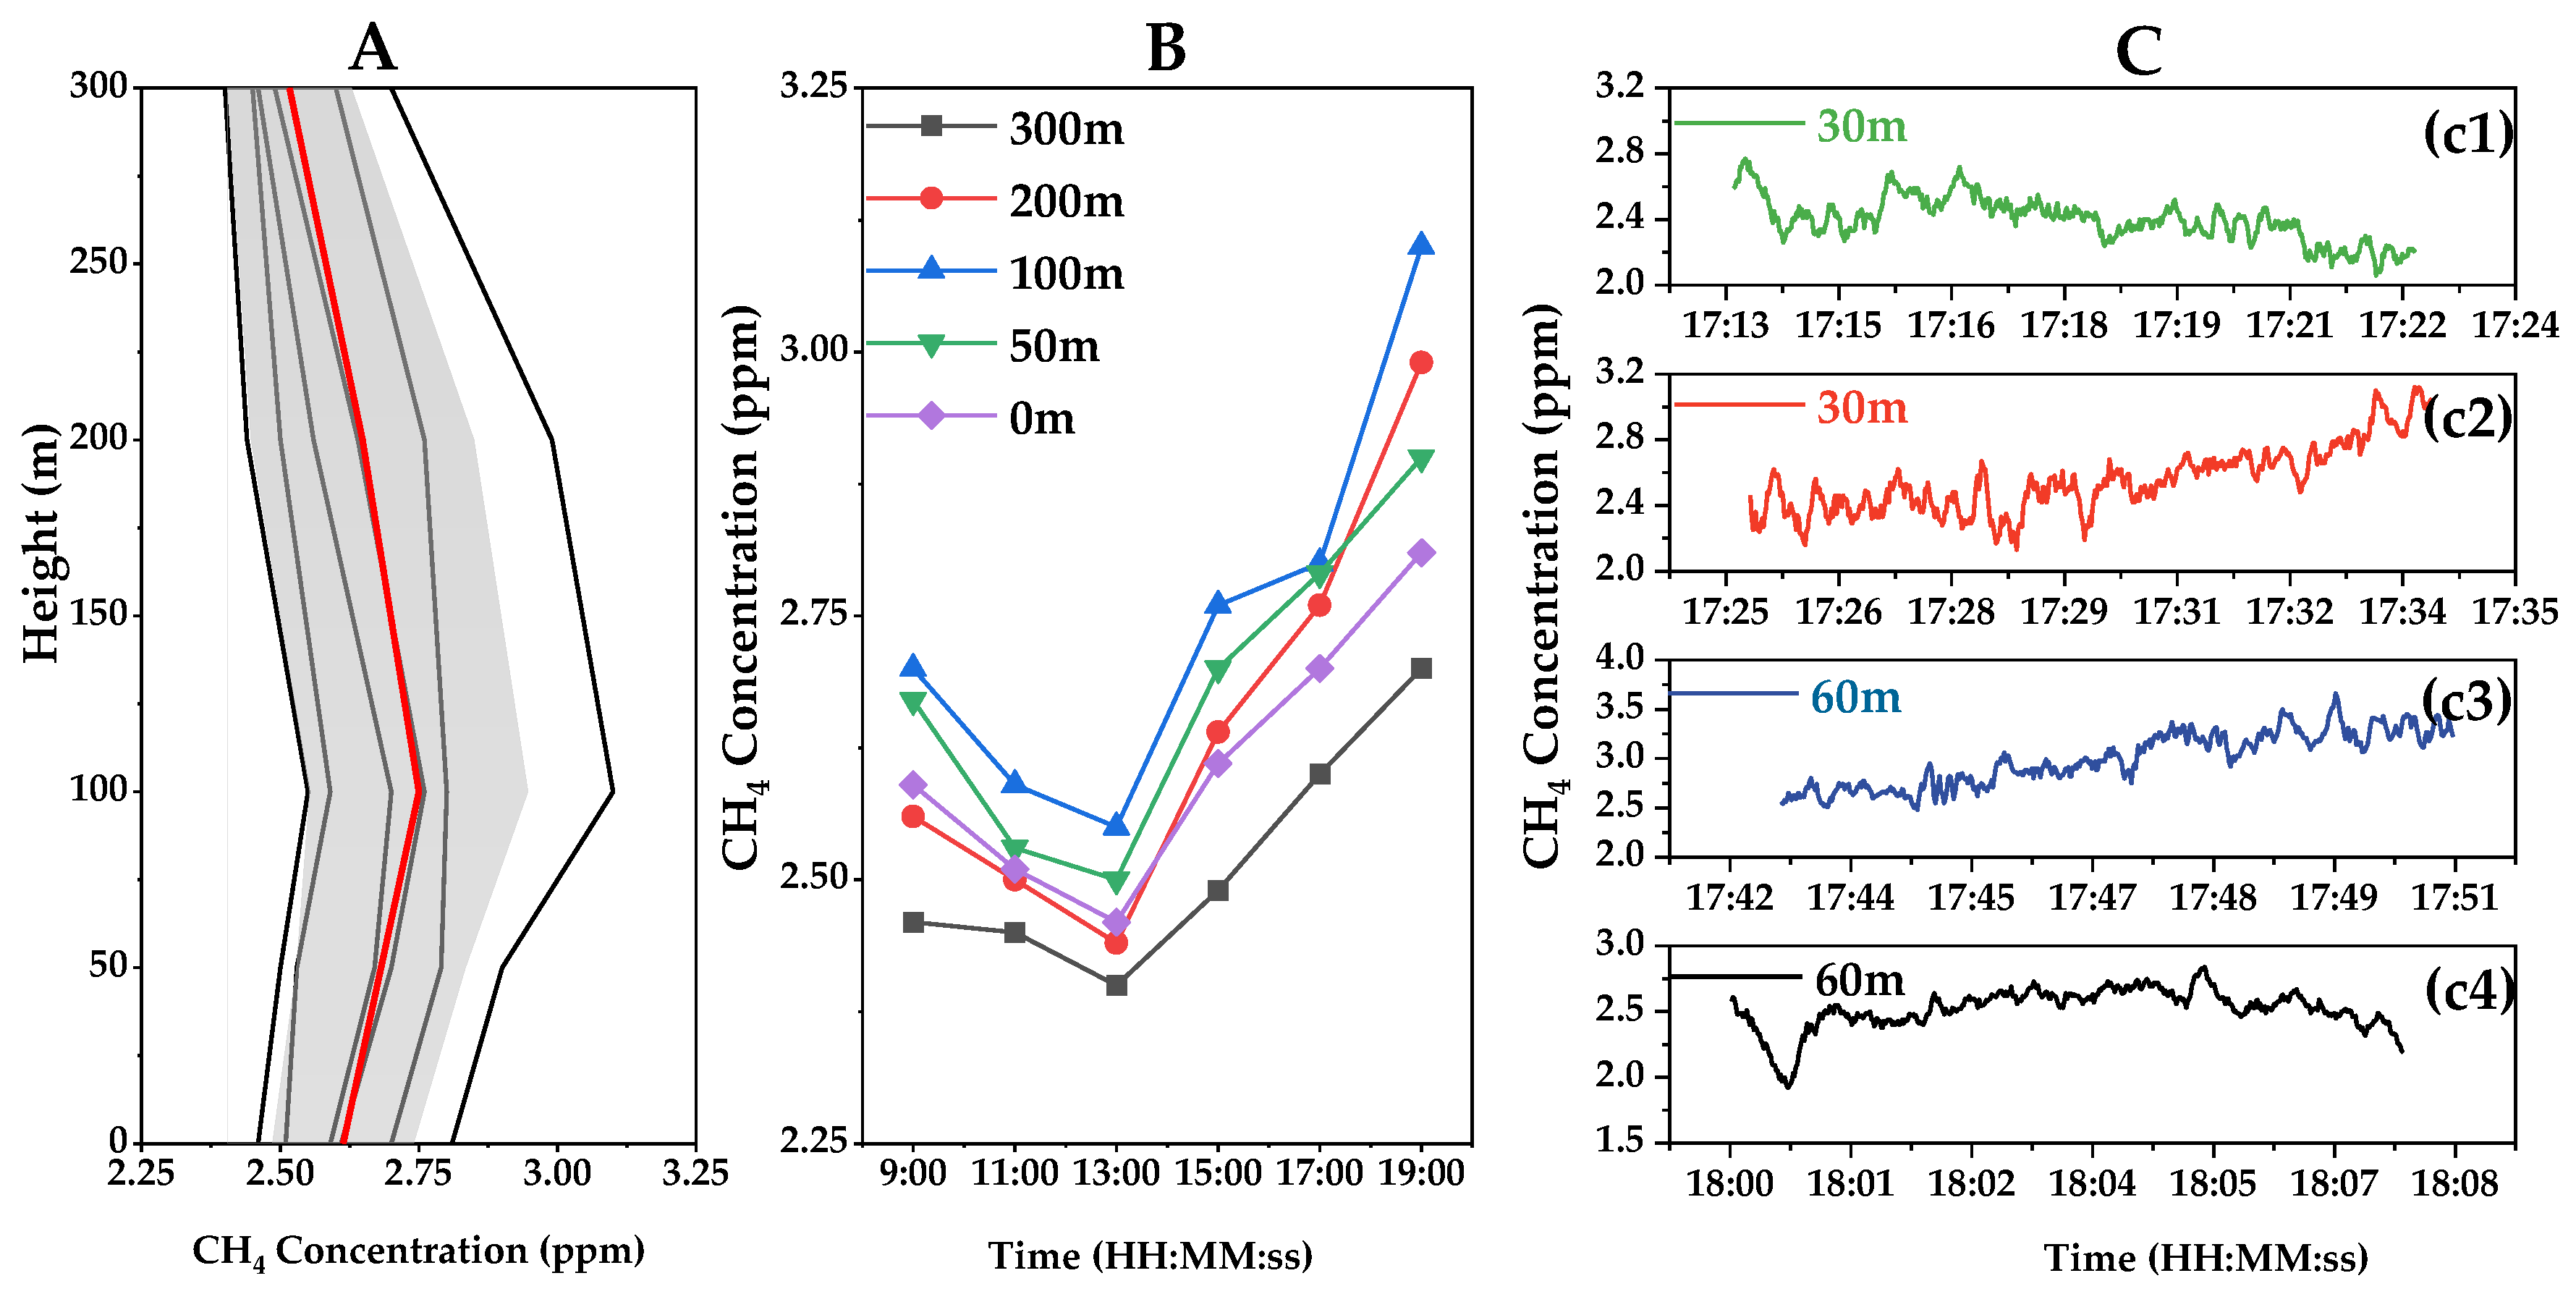
2.3.1. Vertical Measurement of CH4
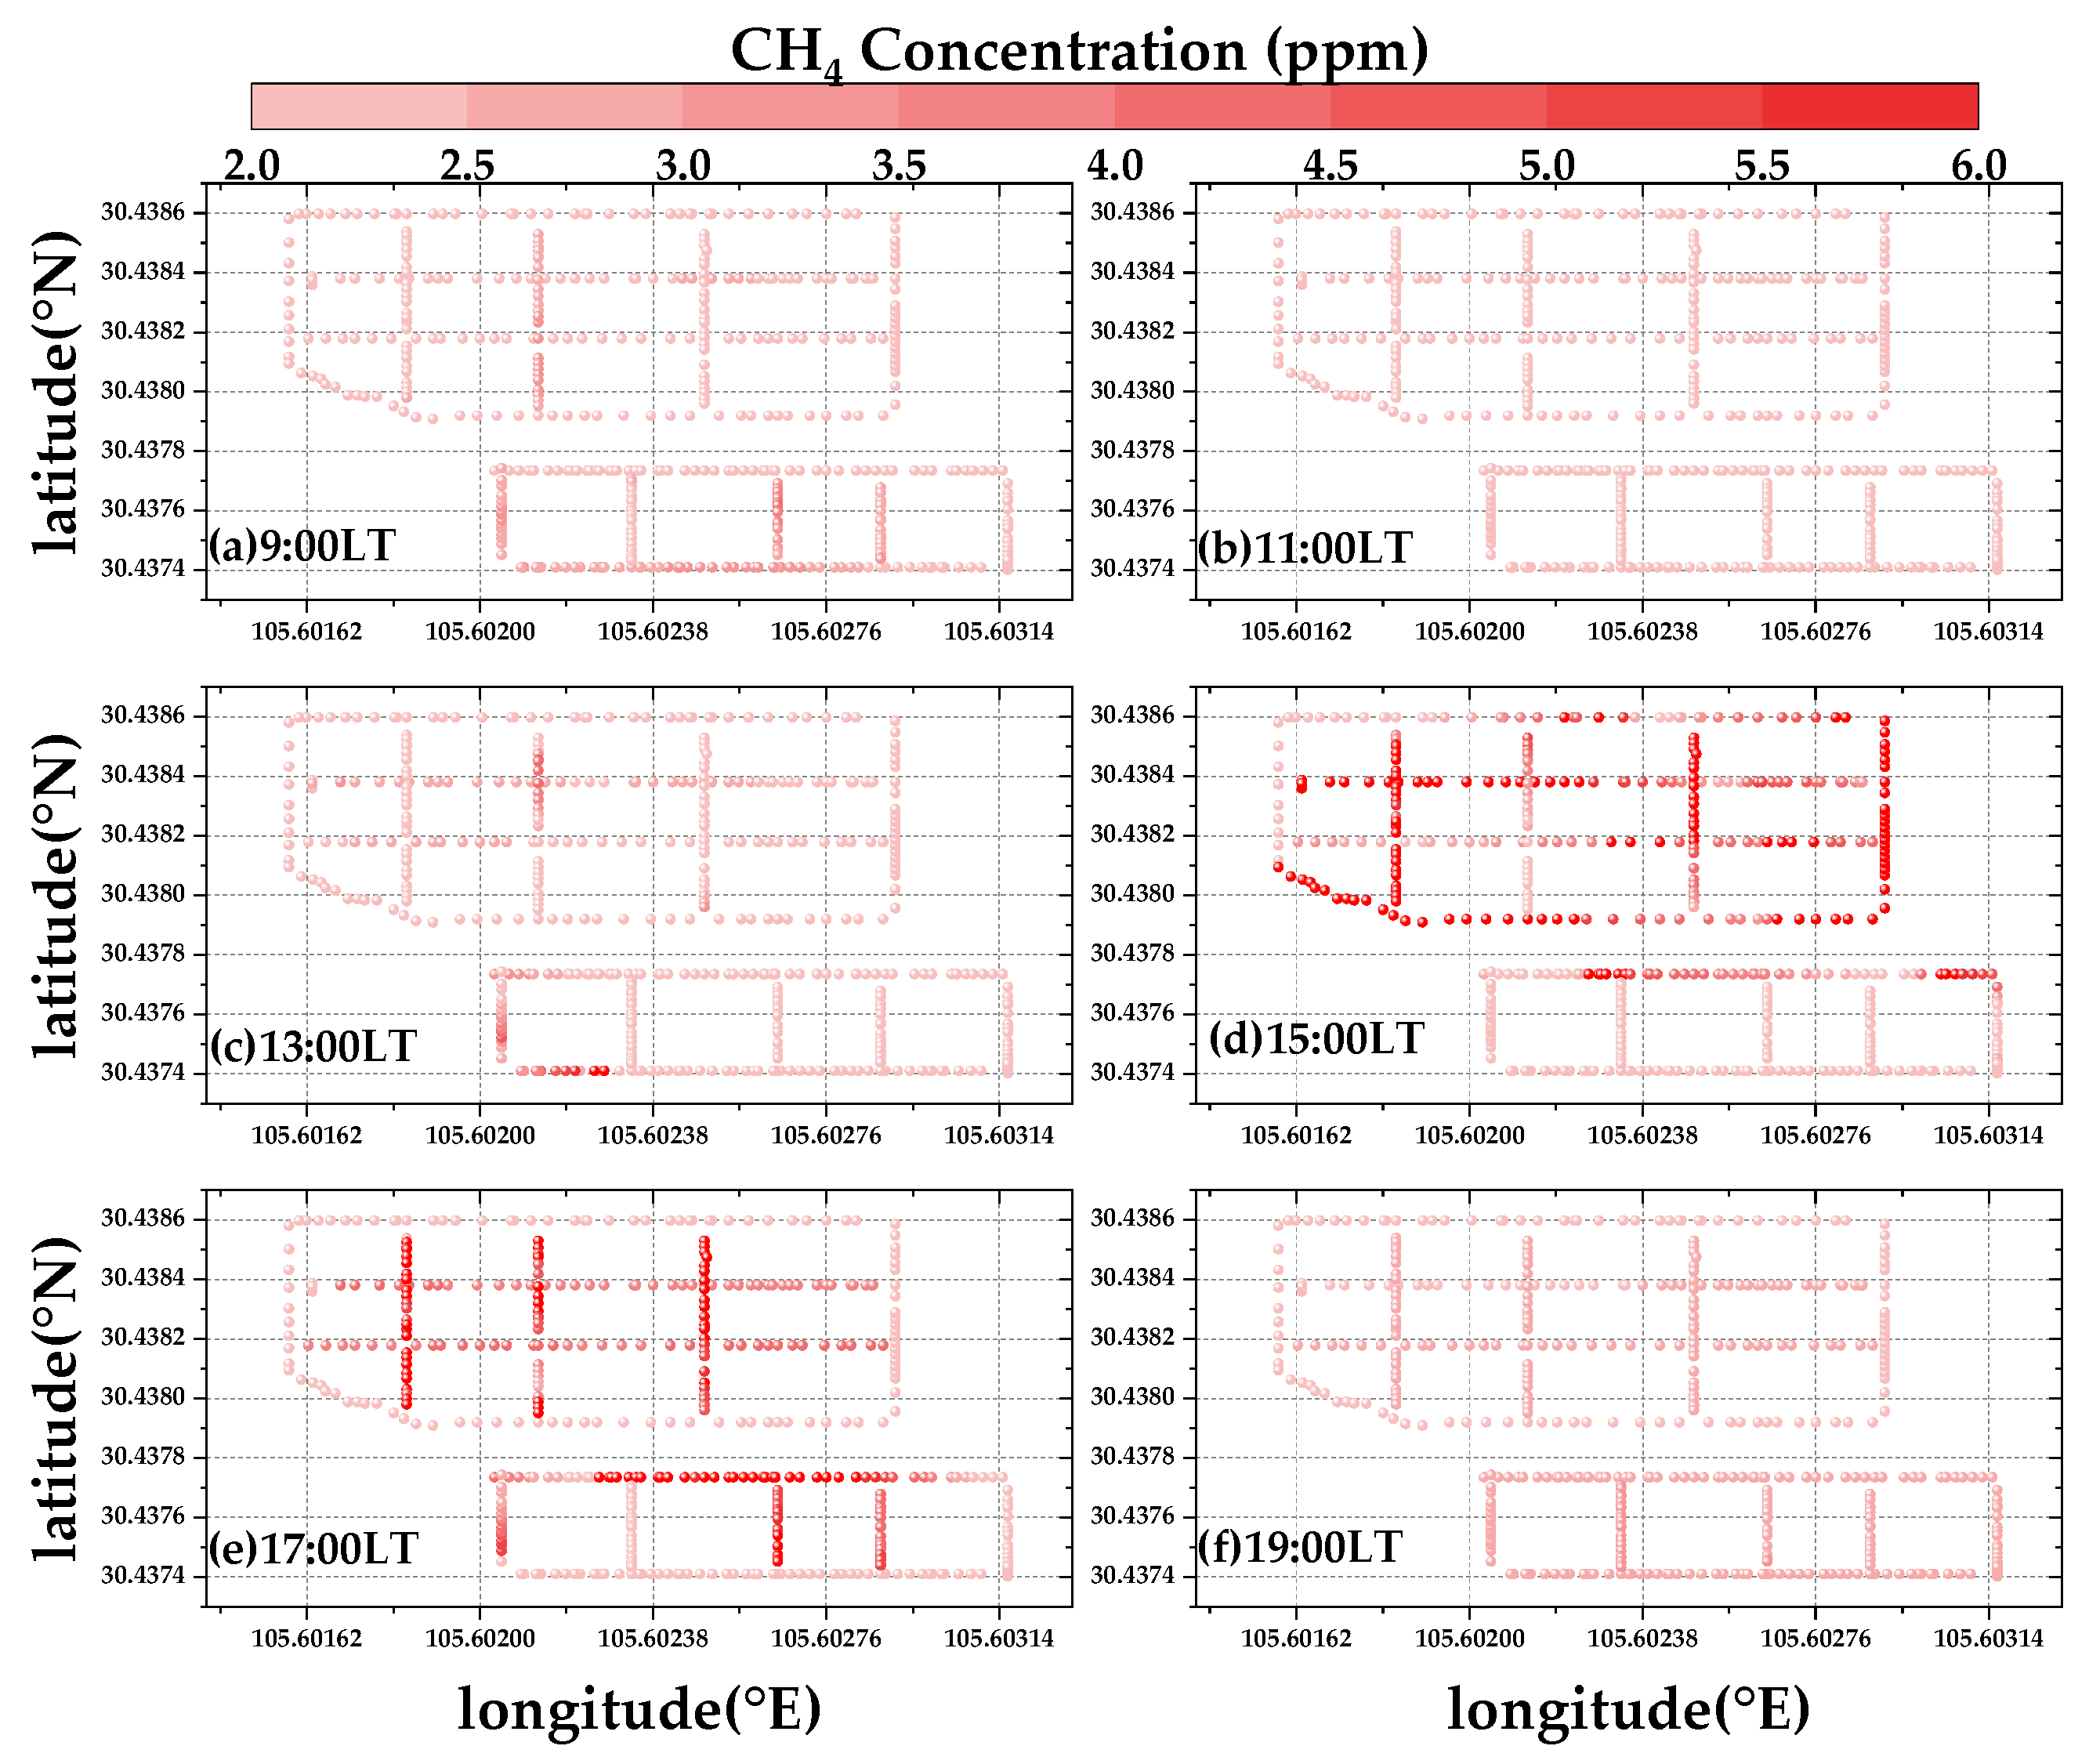
2.3.2. Horizontal Measurement of CH4
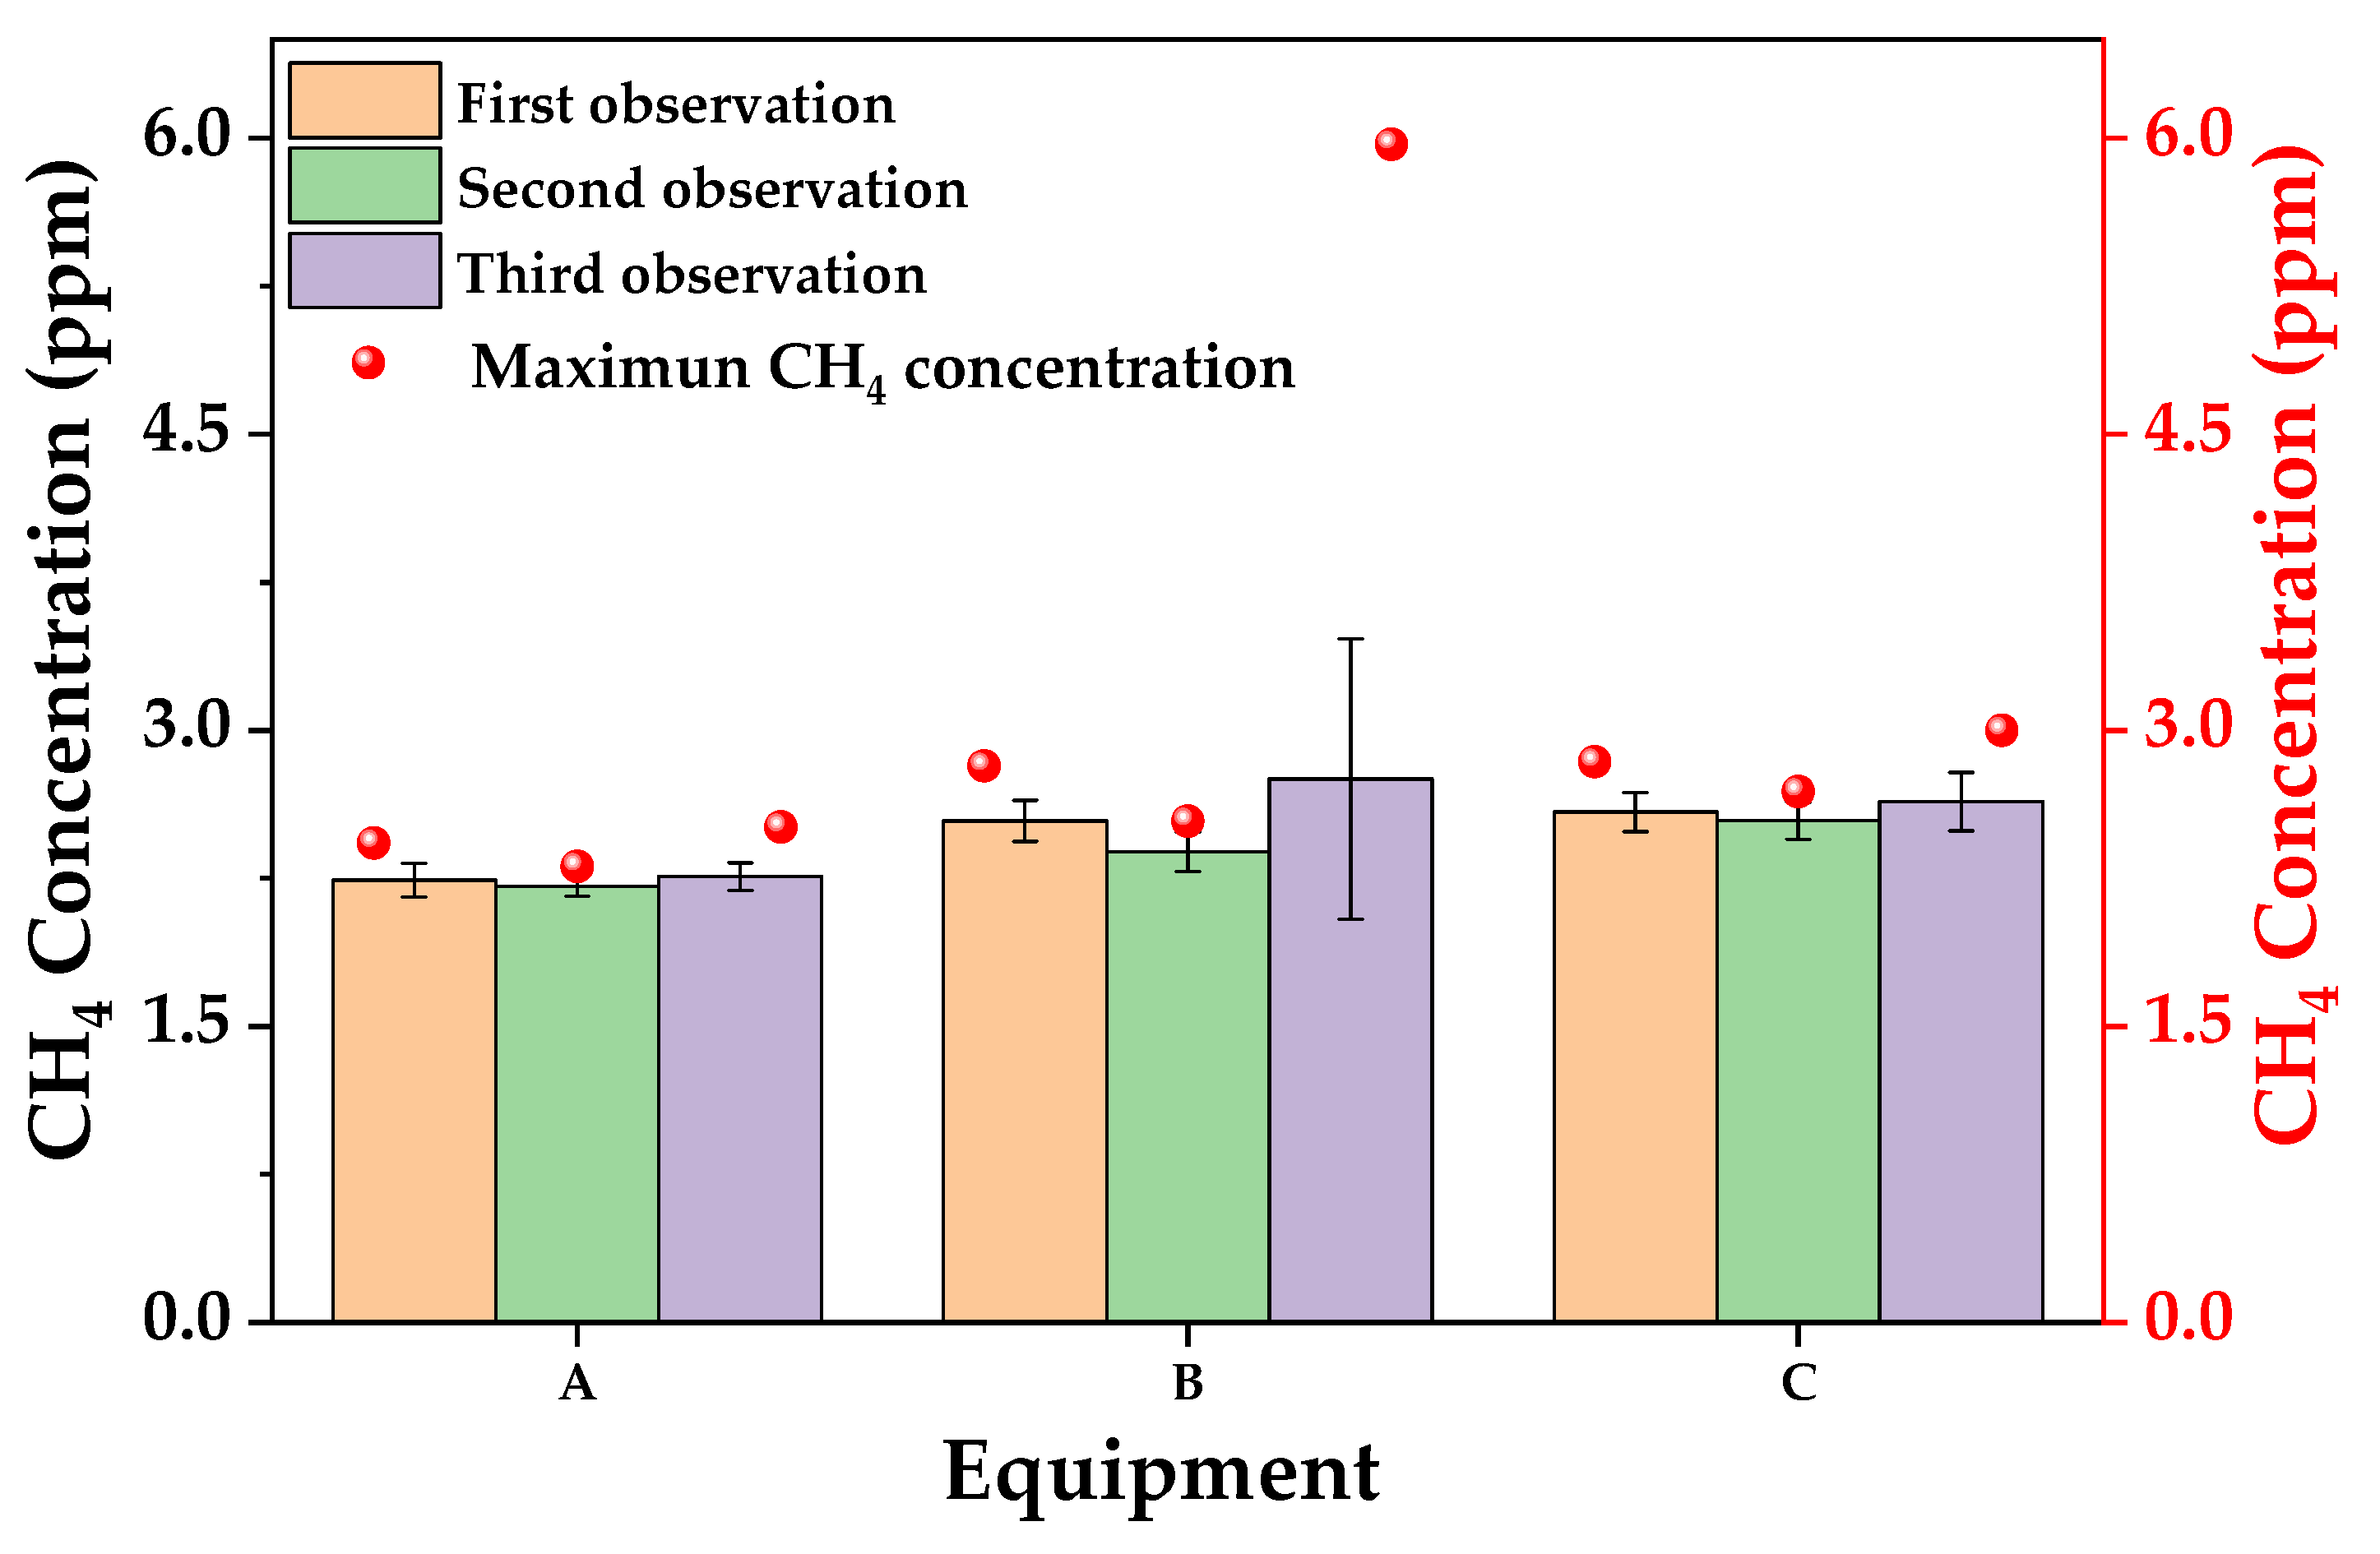
2.3.3. Measurement of CH4 from the Torches and Chimneys
2.3.4. Mobile Observation of CH4
2.3.5. Flux Quantification of CH4
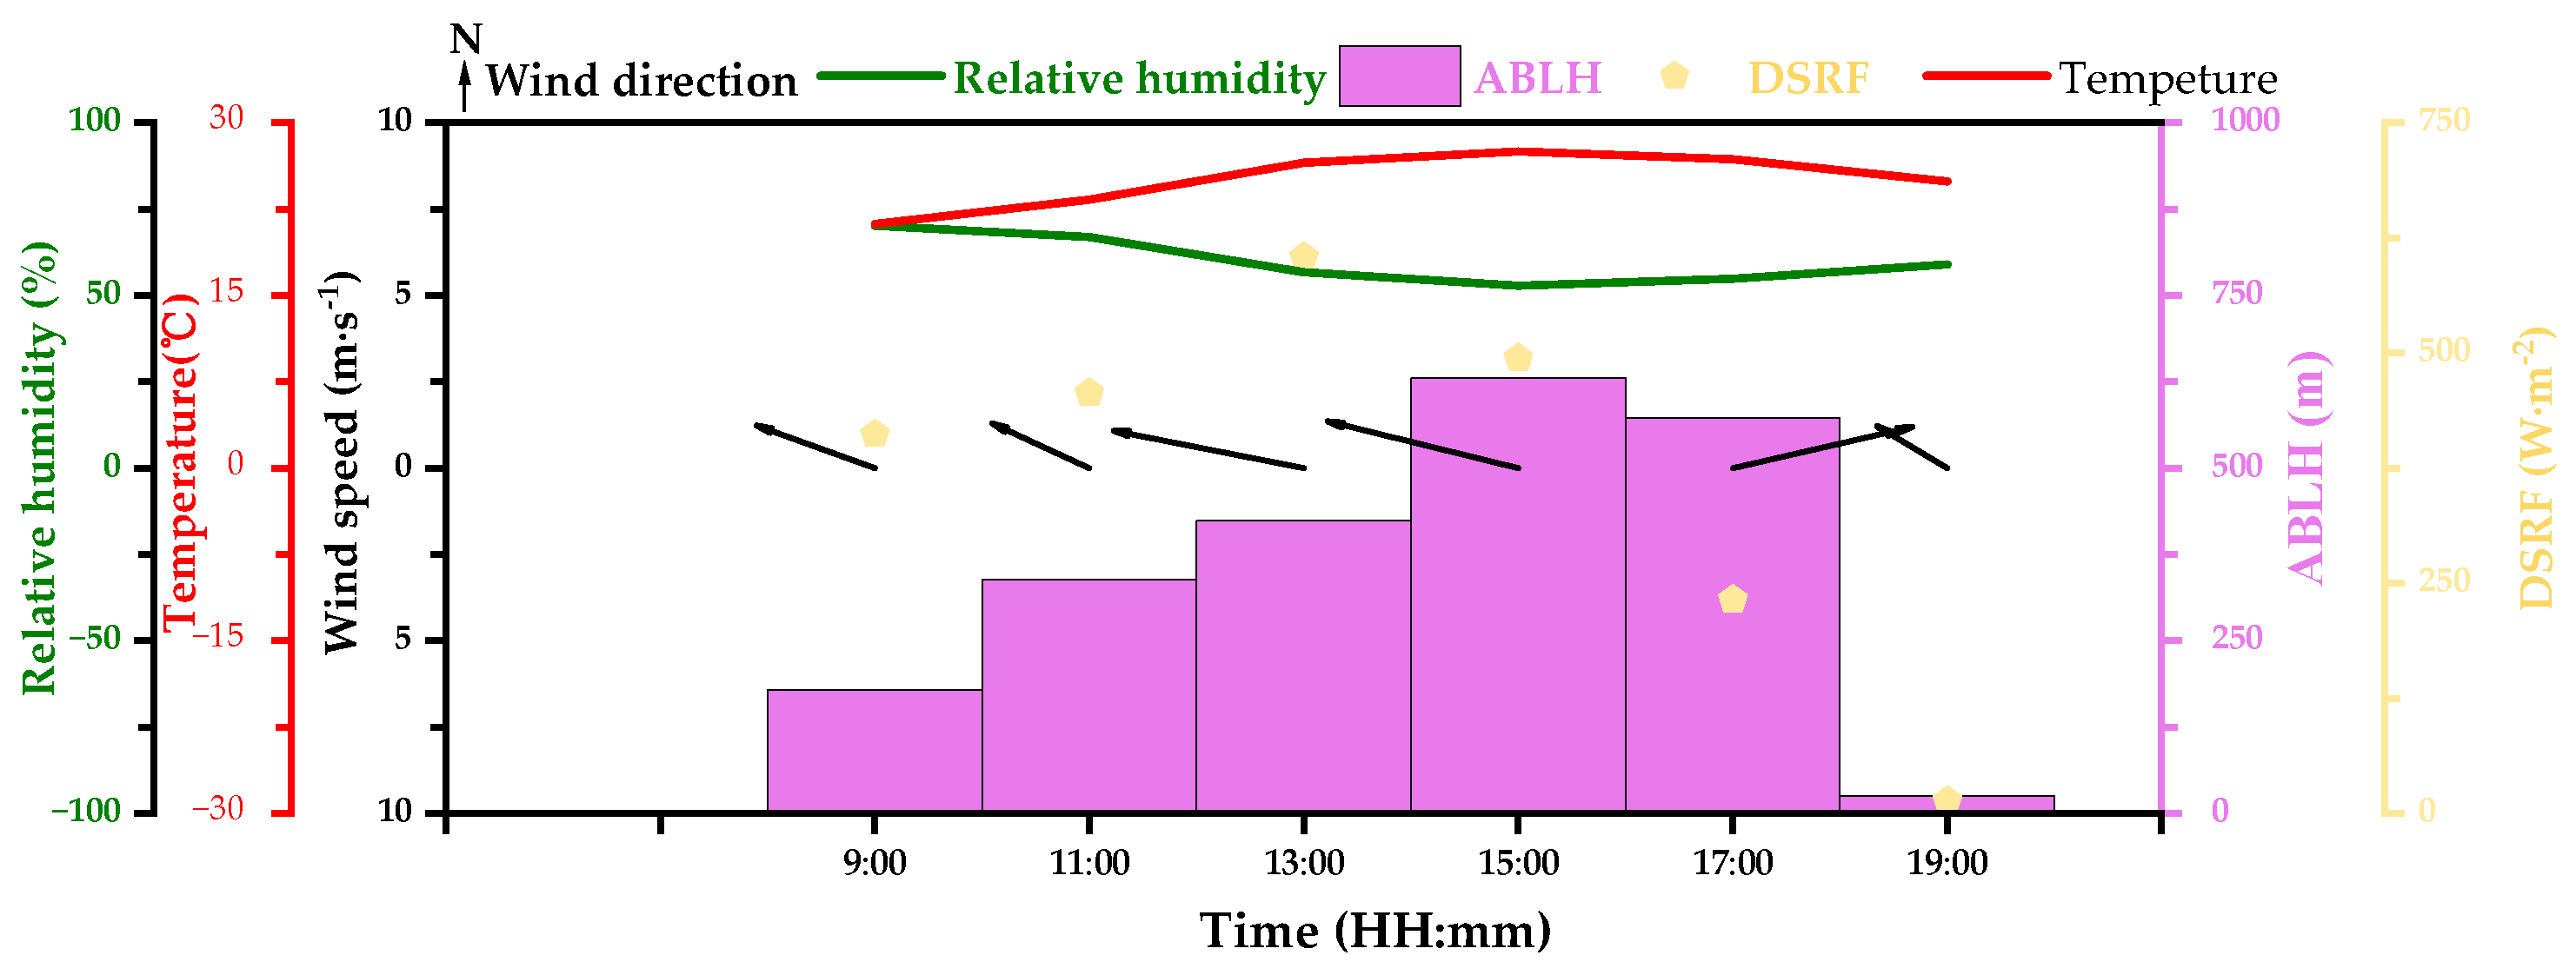
2.4. Data Quality Assurance
3. Results and Discussion
3.1. High-Altitude Emission of CH4
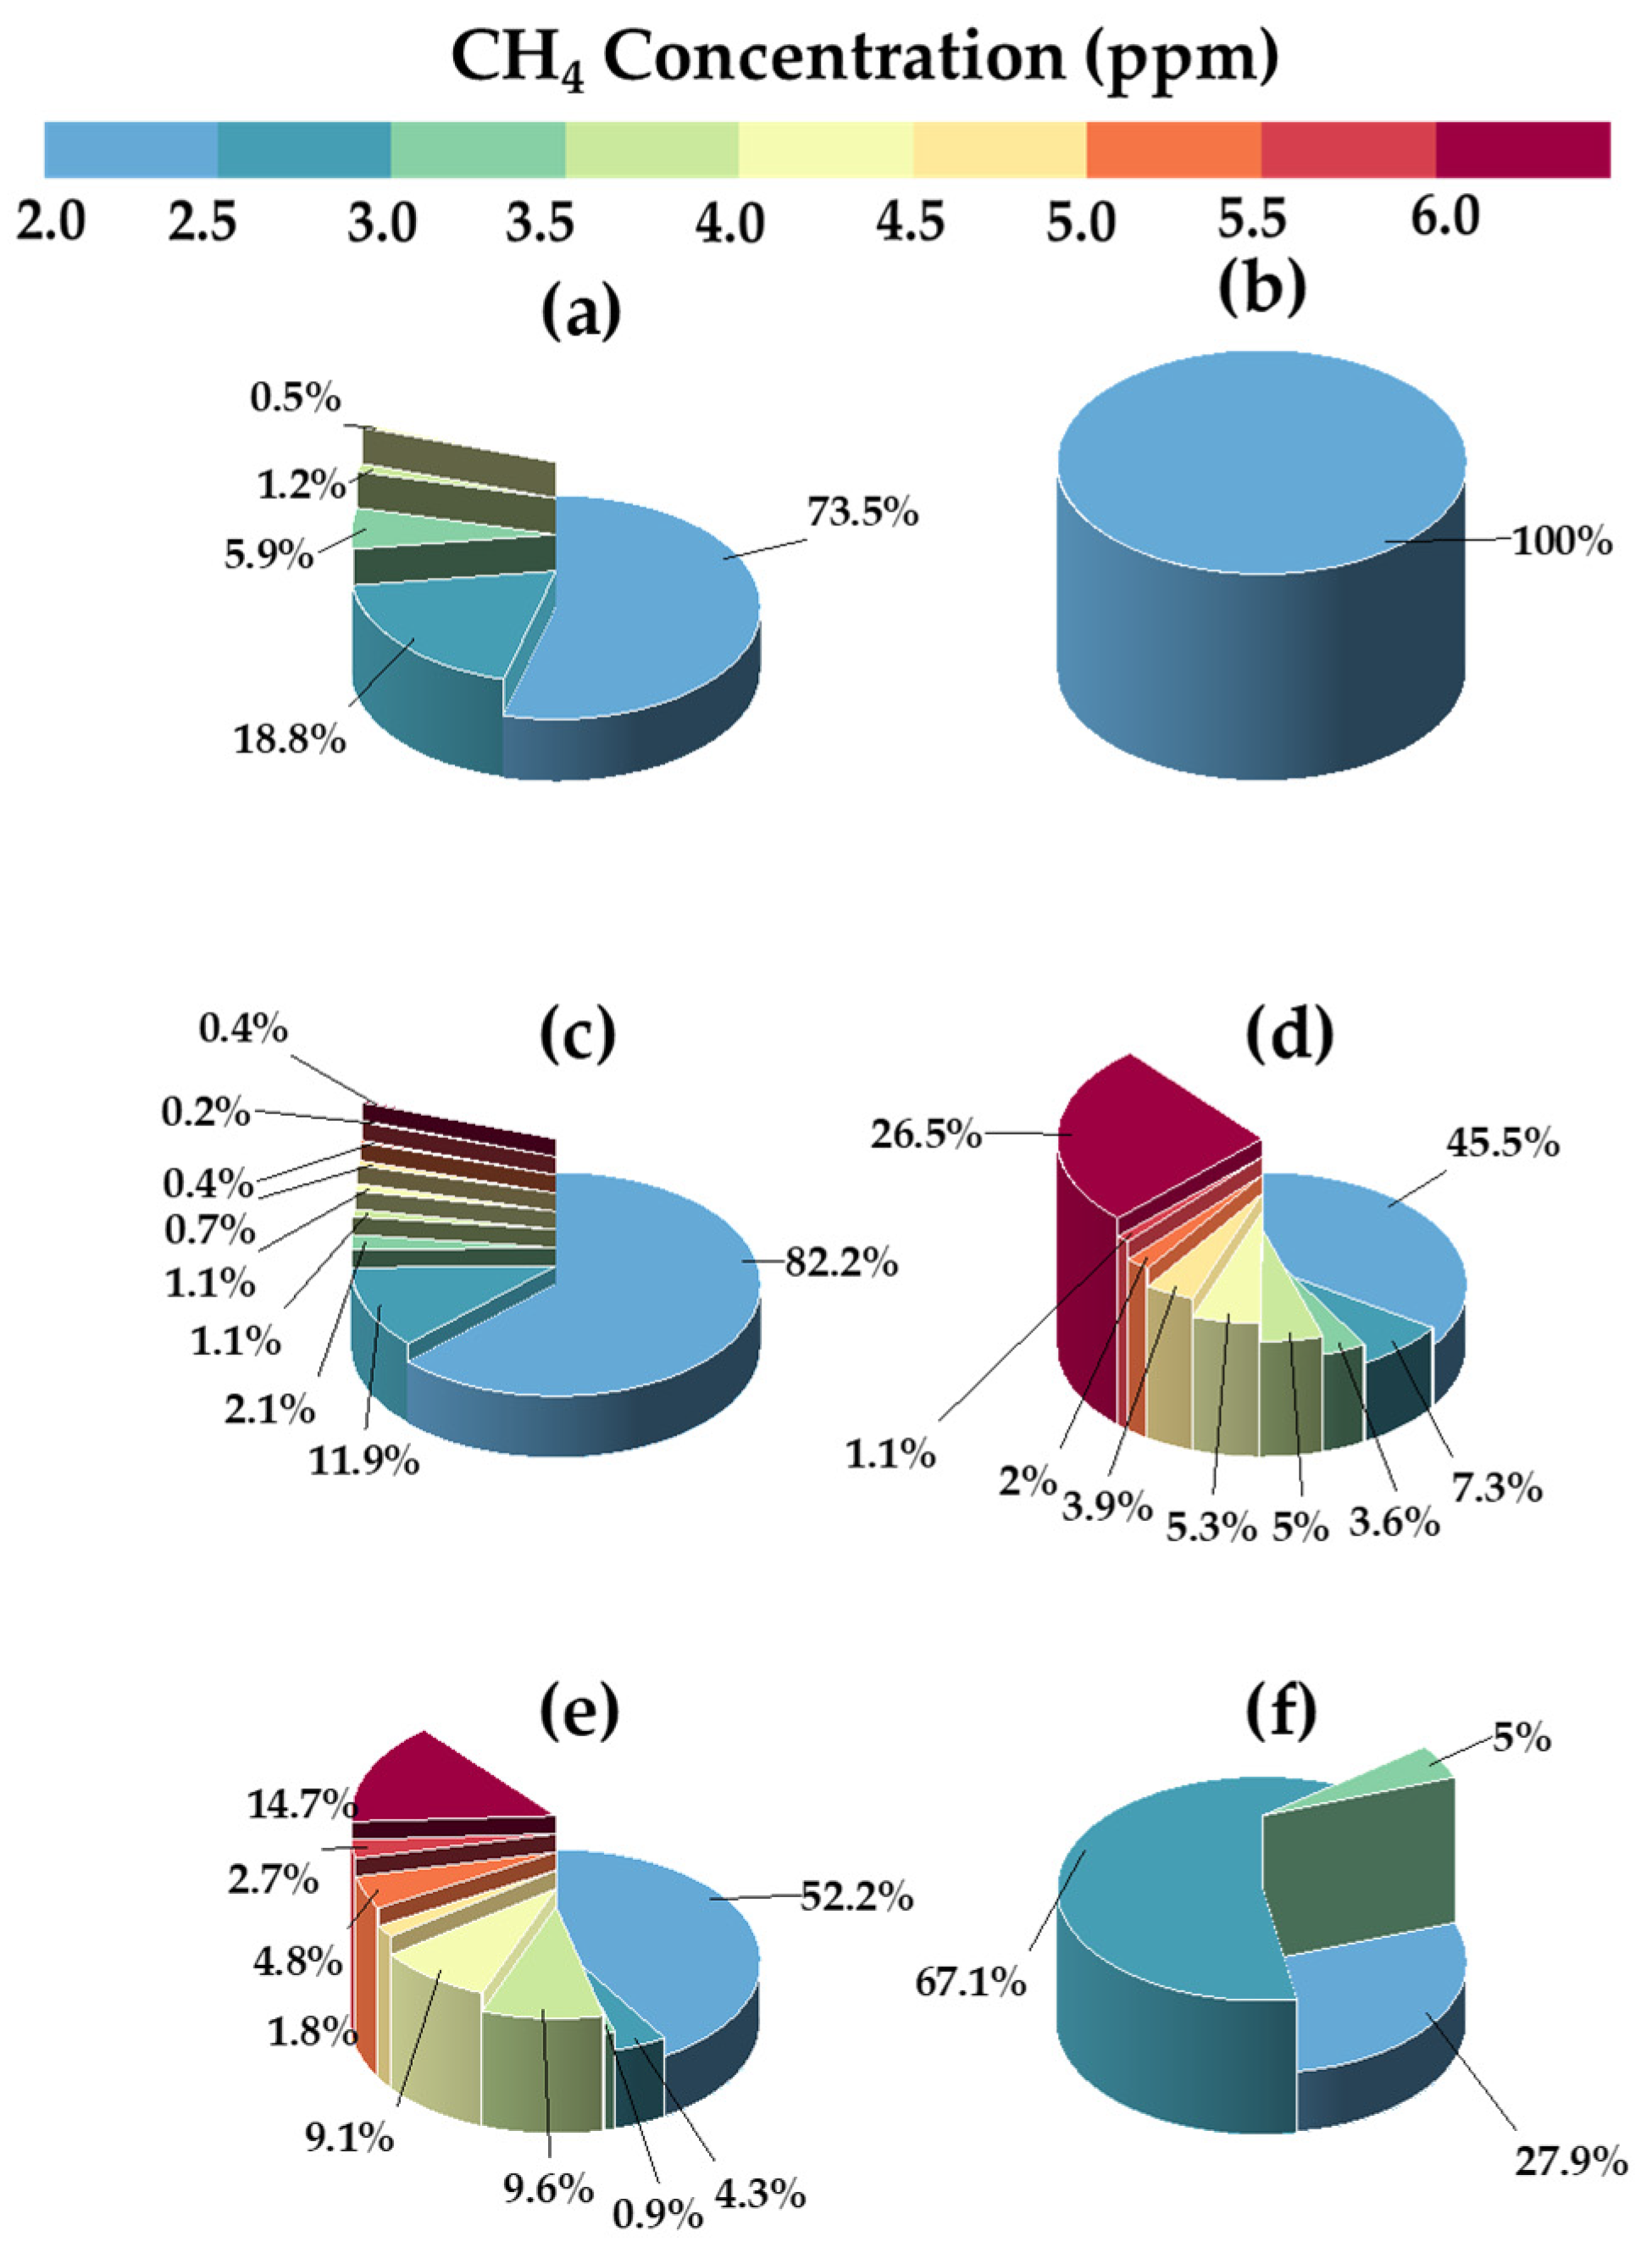
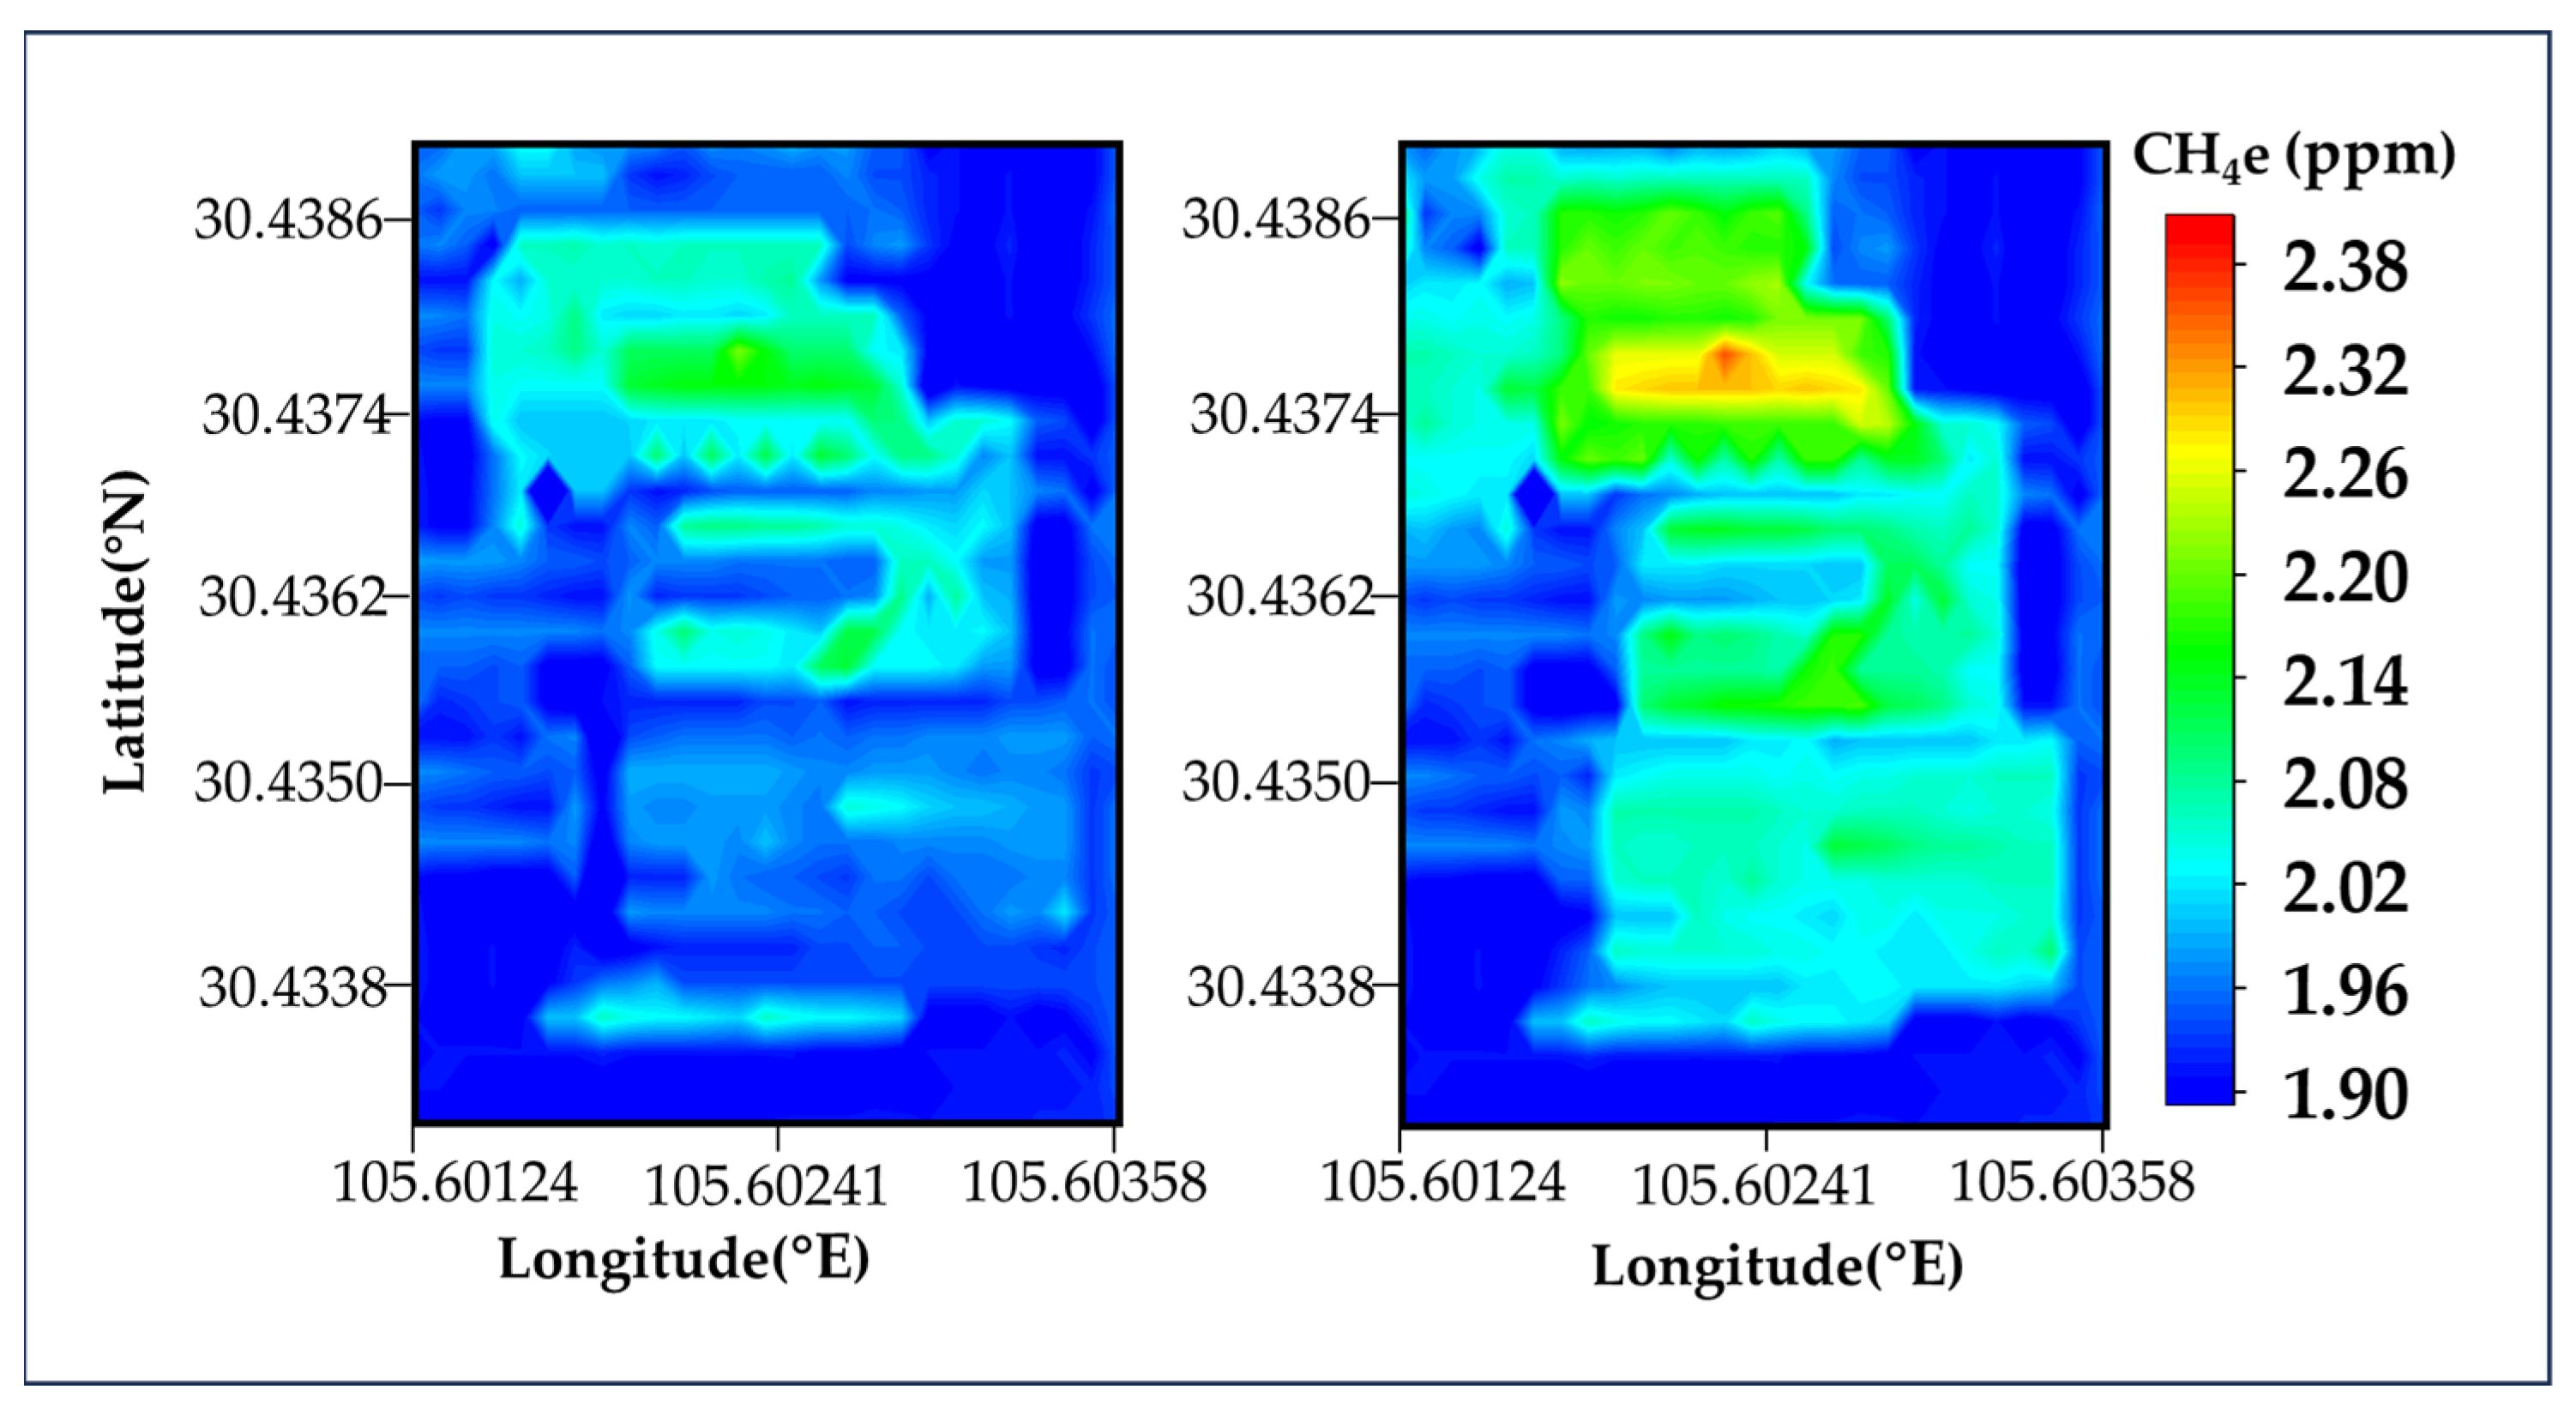
3.2. Spatial Distribution of CH4
3.3. Flux Quantification of CH4
3.4. Treatment and Preventive Measures for Equipment Leakage
4. Conclusions
Author Contributions
Funding
Institutional Review Board Statement
Informed Consent Statement
Data Availability Statement
Conflicts of Interest
References
- Alvarez, R.A.; Zavala-Araiza, D.; Lyon, D.R.; Allen, D.T.; Barkley, Z.R.; Brandt, A.R.; Davis, K.J.; Herndon, S.C.; Jacob, D.J.; Karion, A.; et al. Assessment of methane emissions from the US oil and gas supply chain. Science 2018, 361, 186–188. [Google Scholar]
- Erland, B.M.; Thorpe, A.K.; Gamon, J.A. Recent Advances Toward Transparent Methane Emissions Monitoring: A Review. Environ. Sci. Technol. 2022, 56, 16567–16581. [Google Scholar] [CrossRef]
- Petrenko, V.V.; Smith, A.M.; Schaefer, H.; Riedel, K.; Brook, E.; Baggenstos, D.; Harth, C.; Hua, Q.; Buizert, C.; Schilt, A.; et al. Minimal geological methane emissions during the Younger Dryas-Preboreal abrupt warming event. Nature 2017, 548, 443–446. [Google Scholar] [CrossRef]
- Hmiel, B.; Petrenko, V.V.; Dyonisius, M.N.; Buizert, C.; Smith, A.M.; Place, P.F.; Harth, C.; Beaudette, R.; Hua, Q.; Yang, B.; et al. Preindustrial, (CH4)-C-14 indicates greater anthropogenic fossil CH4 emissions. Nature 2020, 578, 409. [Google Scholar] [CrossRef]
- Chen, G.; Yang, S.; Lv, C.; Zhong, J.; Wang, Z.; Zhang, Z.; Fang, X.; Li, S.; Yang, W.; Xue, L. An improved method for estimating GHG emissions from onshore oil and gas exploration and development in China. Sci. Total Environ. 2017, 574, 707–715. [Google Scholar] [CrossRef]
- Mackay, K.; Lavoie, M.; Bourlon, E.; Atherton, E.; O’connell, E.; Baillie, J.; Fougere, C.; Risk, D. Methane emissions from upstream oil and gas production in Canada are underestimated. Sci. Rep. 2021, 11, 8041. [Google Scholar] [CrossRef]
- Yacovitch, T.I.; Herndon, S.C.; Petron, G.; Kofler, J.; Lyon, D.; Zahniser, M.S.; Kolb, C.E. Mobile Laboratory Observations of Methane Emissions in the Barnett Shale Region. Environ. Sci. Technol. 2015, 49, 7889–7895. [Google Scholar] [CrossRef]
- Thoma, E.D.; Squier, B.C.; Olson, D.; Eisele, A.P.; Dewees, J.M.; Segall, R.R.; Amin, M.S.; Modrak, M.T. Assessment of Methane and VOC Emissions from Select Upstream Oil and Gas Production Operations Using Remote Measurements, Interim Report on Recent Survey Studies. In Proceedings of the 105th Annual Conference on Air Waste Management Assocociation, Durham, NC, USA, 24–26 April 2012. [Google Scholar]
- Xueref-Remy, I.; Zazzeri, G.; Bréon, F.M.; Vogel, F.; Ciais, P.; Lowry, D.; Nisbet, E.G. Anthropogenic methane plume detection from point sources in the Paris megacity area and characterization of their δ13C signature. Atmos. Environ. 2020, 222, 117055. [Google Scholar] [CrossRef]
- Pangerl, J.; Müller, M.; Rück, T.; Weigl, S.; Bierl, R. Characterizing a sensitive compact mid-infrared photoacoustic sensor for methane, ethane and acetylene detection considering changing ambient parameters and bulk composition, (N2, O2 and H2O). Sens. Actuators B Chem. 2022, 352, 130962. [Google Scholar] [CrossRef]
- Karion, A.; Sweeney, C.; Kort, E.A.; Shepson, P.B.; Brewer, A.; Cambaliza, M.; Conley, S.A.; Davis, K.; Deng, A.; Hardesty, M.; et al. Aircraft-Based Estimate of Total Methane Emissions from the Barnett Shale Region. Environ. Sci. Technol. 2015, 49, 8124–8131. [Google Scholar] [CrossRef]
- Allen, D.T.; Torres, V.M.; Thomas, J.; Sullivan, D.W.; Harrison, M.; Hendler, A.; Herndon, S.C.; Kolb, C.E.; Fraser, M.P.; Hill, A.D.; et al. Measurements of methane emissions at natural gas production sites in the United States. Proc. Natl. Acad. Sci. USA 2013, 110, 17768–17773. [Google Scholar] [CrossRef]
- Yuan, B.; Kaser, L.; Karl, T.; Graus, M.; Peischl, J.; Campos, T.L.; Shertz, S.; Apel, E.C.; Hornbrook, R.S.; Hills, A.; et al. Airborne flux measurements of methane and volatile organic compounds over the Haynesville and Marcellus shale gas production regions. J. Geophys. Res. Atmos. 2015, 120, 6271–6289. [Google Scholar] [CrossRef]
- Peischl, J.; Ryerson, T.B.; Aikin, K.C.; Gouw, J.A.; Gilman, J.B.; Holloway, J.S.; Lerner, B.M.; Nadkarni, R.; Neuman, J.A.; Nowak, J.B.; et al. Quantifying atmospheric methane emissions from the Haynesville, Fayetteville, and northeastern Marcellus shale gas production regions. J. Geophys. Res. Atmos. 2015, 120, 2119–2139. [Google Scholar] [CrossRef]
- Wang, F.; Jia, S.; Wang, Y.; Tang, Z. Recent Developments in Modulation Spectroscopy for Methane Detection Based on Tunable Diode Laser. Appl. Sci. 2019, 9, 2816. [Google Scholar] [CrossRef]
- Burgues, J.; Marco, S. Environmental chemical sensing using small drones: A review. Sci. Total Environ. 2020, 748, 141172. [Google Scholar] [CrossRef]
- D’amato, F.; De Rosa, M. Tunable diode lasers and two-tone frequency modulation spectroscopy applied to atmospheric gas analysis. Opt. Lasers Eng. 2002, 37, 533–551. [Google Scholar] [CrossRef]
- Titchener, J.; Millington-Smith, D.; Goldsack, C.; Harrison, G.; Dunning, A.; Ai, X.; Reed, M. Single photon Lidar gas imagers for practical and widespread continuous methane monitoring. Appl. Energy 2022, 306, 118086. [Google Scholar] [CrossRef]
- Allen, G.; Hollingsworth, P.; Kabbabe, K.; Pitt, J.R.; Mead, M.I.; Illingworth, S.; Roberts, G.; Bourn, M.; Shallcross, D.E.; Percival, C.J. The development and trial of an unmanned aerial system for the measurement of methane flux from landfill and greenhouse gas emission hotspots. Waste Manag. 2019, 87, 883–892. [Google Scholar] [CrossRef]
- Pang, X.; Chen, L.; Shi, K.; Wu, F.; Chen, J.; Fang, S.; Wang, J.; Xu, M. A lightweight low-cost and multipollutant sensor package for aerial observations of air pollutants in atmospheric boundary layer. Sci. Total Environ. 2021, 764, 142828. [Google Scholar] [CrossRef]
- Nakajima, K.; Yamanaka, T.; Ooka, R.; Kikumoto, H.; Sugawara, H. Observational assessment of applicability of Pasquill stability class in urban areas for detection of neutrally stratified wind profiles. J. Wind. Eng. Ind. Aerodyn. 2020, 206, 104337. [Google Scholar] [CrossRef]
- Robertson, A.M.; Edie, R.; Snare, D.; Soltis, J.; Field, R.A.; Burkhart, M.D.; Bell, C.S.; Zimmerle, D.; Murphy, S.M. Variation in Methane Emission Rates from Well Pads in Four Oil and Gas Basins with Contrasting Production Volumes and Compositions. Environ. Sci. Technol. 2017, 51, 8832–8840. [Google Scholar] [CrossRef]
- Edie, R.; Robertson, A.M.; Field, R.A.; Soltis, J.; Snare, D.A.; Zimmerle, D.; Bell, C.S.; Vaughn, T.L.; Murphy, S.M. Constraining the accuracy of flux estimates using OTM 33A. Atmos. Meas. Tech. 2020, 13, 341–353. [Google Scholar] [CrossRef]
- MATLAB, Version 8.5.0, (R2015a); The MathWorks Inc.: Natick, MA, USA, 2015.
- Sreenivas, G.; Mahesh, P.; Mahalakshmi, D.V.; Kanchana, A.L.; Chandra, N.; Patra, P.K.; Raja, P.; Sesha Sai, M.V.R.; Sripada, S.; Rao, P.V.N.; et al. Seasonal and annual variations of CO2 and CH4 at Shadnagar, a semi-urban site. Sci. Total Environ. 2022, 819, 153114. [Google Scholar] [CrossRef]
- Wei, C.; Wang, M.; Fu, Q.; Dai, C.; Huang, R.; Bao, Q. Temporal characteristics of greenhouse gases, (CO2 and CH4) in the megacity Shanghai, China: Association with air pollutants and meteorological conditions. Atmos. Res. 2020, 235, 104759. [Google Scholar] [CrossRef]
- Fujita, R.; Morimoto, S.; Maksyutov, S.; Kim, H.S.; Arshinov, M.; Brailsford, G.; Aoki, S.; Nakazawa, T. Global and regional CH4 emissions for 1995–2013 derived from atmospheric CH4, δ13C–CH4, and δD–CH4 observations and a chemical transport model. J. Geophys. Res. Atmos. 2020, 125, e2020JD032903. [Google Scholar] [CrossRef]
- Feng, X.; Wei, S.; Wang, S. Temperature inversions in the atmospheric boundary layer and lower troposphere over the Sichuan Basin, China: Climatology and impacts on air pollution. Sci. Total Environ. 2020, 726, 138579. [Google Scholar] [CrossRef]
- Fang, S.; Du, R.; Qi, B.; Ma, Q.; Zhang, G.; Chen, B.; Li, J. Variation of carbon dioxide mole fraction at a typical urban area in the Yangtze River Delta, China. Atmos. Res. 2022, 265, 105884. [Google Scholar] [CrossRef]
- Cao, G.M.; Xu, X.L.; Long, R.J.; Wang, Q.L.; Wang, C.T.; Du, Y.G.; Zhao, X.Q. Methane emissions by alpine plant communities in the Qinghai-Tibet Plateau. Biol. Lett. 2008, 4, 681–684. [Google Scholar] [CrossRef]
- Frankenberg, C.; Thorpe, A.K.; Thompson, D.R.; Hulley, G.; Kort, E.A.; Vance, N.; Borchardt, J.; Krings, T.; Gerilowski, K.; Sweeney, C.; et al. Airborne methane remote measurements reveal heavy-tail flux distribution in Four Corners region. Proc. Natl. Acad. Sci. USA 2016, 113, 9734–9739. [Google Scholar] [CrossRef]
- Zhang, Z.; Guo, Y.; Wang, D.; Li, G.; Peng, D. A Noisy-OR gate based fuzzy fault tree approach for micro-leakage evaluation of bolt-gasket-flange connection, (BGFC). J. Loss Prev. Process Ind. 2021, 71, 104521. [Google Scholar] [CrossRef]
- Yiweil, Z.; Ming, X.; Xingchun, L.; Guangquan, L.; Shuangxing, L.; Xuewen, S. Application of Vehicle-mounted Methane Detection Method in the Oil and Gas Industry. Environ. Prot. Oil Gas. Fields 2021, 31, 1–6, 10. [Google Scholar]


| Category | Detailed Parameters |
|---|---|
| Size | 13 (length) × 20 (width) × 29 cm (height) |
| Overall weight | 2 kg |
| Operating voltage | 12 V |
| Sampling flow | 0.4~0.6 L/min |
| Range of detection | 0~100 ppm |
| Measurement error | ±1% |
| Precision | 0.01 ppm |
| Time of response | ≤1 s |
| Endurance | 10 h |
| Pump | 19 (width) × 53.2 mm (length), 23.1 g |
| Sheathing material | Carbon fiber |
| Cost of investment | $14,000 |
| Category | Detailed Parameters |
|---|---|
| Size | 60 (height) × 230 cm (width) |
| Material | Carbon fiber |
| Endurance | 0.5 h |
| Maximum load weight | 6 kg |
| Maximum flying altitude | 500 m |
| Farthest plane flight distance | 1000 m |
| Flight control system | DJI-A3 |
| Image and control system | DJI-lightbridge2 |
| Cost of investment | $20,000 |
| Units in kg/s | Height of Flight | |
|---|---|---|
| 30 m AGL | 60 m AGL | |
| Mean flux | 0.012 | 0.034 |
| total uncertainty | 0.00504 | 0.01598 |
| Wind uncertainty | 0.0009576 | 0.0003995 |
| Background uncertainty | 0.0031752 | 0.0131036 |
| Measurement uncertainty | 0.0001008 | 0.0003196 |
| Downwind uncertainty | 0.0008064 | 0.00204544 |
Disclaimer/Publisher’s Note: The statements, opinions and data contained in all publications are solely those of the individual author(s) and contributor(s) and not of MDPI and/or the editor(s). MDPI and/or the editor(s) disclaim responsibility for any injury to people or property resulting from any ideas, methods, instructions or products referred to in the content. |
© 2023 by the authors. Licensee MDPI, Basel, Switzerland. This article is an open access article distributed under the terms and conditions of the Creative Commons Attribution (CC BY) license (https://creativecommons.org/licenses/by/4.0/).
Share and Cite
Liu, Y.; Shang, Q.; Chen, L.; Wang, E.; Huang, X.; Pang, X.; Lu, Y.; Zhou, L.; Zhou, J.; Wang, Z.; et al. Application of Portable CH4 Detector Based on TDLAS Technology in Natural Gas Purification Plant. Atmosphere 2023, 14, 1709. https://doi.org/10.3390/atmos14121709
Liu Y, Shang Q, Chen L, Wang E, Huang X, Pang X, Lu Y, Zhou L, Zhou J, Wang Z, et al. Application of Portable CH4 Detector Based on TDLAS Technology in Natural Gas Purification Plant. Atmosphere. 2023; 14(12):1709. https://doi.org/10.3390/atmos14121709
Chicago/Turabian StyleLiu, Yi, Qianqian Shang, Lang Chen, Erxiao Wang, Xinyu Huang, Xiaobing Pang, Youhao Lu, Lei Zhou, Jue Zhou, Zhiwen Wang, and et al. 2023. "Application of Portable CH4 Detector Based on TDLAS Technology in Natural Gas Purification Plant" Atmosphere 14, no. 12: 1709. https://doi.org/10.3390/atmos14121709