Article

Numerical Analysis of Various Heat Countermeasures: Effects on Energy Consumption and Indoor Thermal Comfort in Densely Built Wooden House Area

1
Department of Architecture and Building Engineering, Tokyo Institute of Technology, Yokohama 226-8501, Japan
2
Heat Island Group, Lawrence Berkeley National Laboratory, Berkeley, CA 94720, USA
3
Graduate School of Environmental and Life Science, Okayama University, Okayama 700-8530, Japan
*
Author to whom correspondence should be addressed.
Atmosphere 2023, 14(10), 1566; https://doi.org/10.3390/atmos14101566
Submission received: 19 June 2023 / Revised: 9 October 2023 / Accepted: 13 October 2023 / Published: 16 October 2023
(This article belongs to the Special Issue Urban Heat Islands and Global Warming (2nd Edition))

Abstract

:
Densely built areas with poor thermal insulation suffer from high thermal environmental risks and generally consume high energy in summer. Determining the relationship between density and energy consumption is necessary, particularly when implementing urban heat island (UHI) countermeasures. This study evaluated the effects of density and UHI countermeasures on the energy consumption and indoor thermal comfort of a detached house in a typical densely built wooden house area in Yokohama City, Japan. Three densities and six countermeasures were considered. Annual hourly simulations based on the SCIENCE-Vent thermal environment simulation model yielded the following results: in densely built wooden house areas, the energy consumption and thermal discomfort increased with density. The green roof yielded the largest energy savings in the cooling and heating seasons, demonstrating the highest annual energy savings with 5.7%. Density had little impact on rooftop countermeasures, but the effect of the high-reflectance walls increased with density, and the reduction in annual energy consumption (air conditioning and lighting) is 2.6%, 3.0%, 3.6% in 37%, 47%, and 59% density cases, respectively. The impact of thermal countermeasures on indoor thermal comfort varied according to the thermal control mechanism.

1. Introduction

The annual mean temperature in major cities, such as Tokyo and Osaka, has increased by 2–3 °C over the past century. This increase is attributed to urban meteorological changes caused by global warming (GW) and the urban heat island (UHI) effect [1]. Furthermore, future temperature trends predict an increase of approximately 4.8 °C by 2100, indicating a continuous temperature rise [2]. Extreme heat during summer significantly affects energy consumption [3] and agriculture [4,5] and poses a natural hazard [6,7].
In Japan, such a background has raised the issue of the thermal environment in high-density wooden residential areas. Detached wooden buildings are a traditional and popular type of residential construction in Japan, with surveys showing that detached houses account for approximately 53.6% of all Japanese residential units, of which 92.5% are wooden [8]. In one aspect, many dense wooden residential areas exist in Japan due to the contradiction between the pattern of one-family dwelling and the limited land area. High building density affects wind speed [9], transfer of solar radiation [10], etc., and creates negative impacts on the built thermal environment, most typically the enhanced UHI [11]. In the other aspect, the use of indoor air-conditioning is essential in humid subtropical climatic zones such as Tokyo and Yokohama during the summer and winter seasons. As the UHI intensifies in densely built wooden residential areas, the utilization of air-conditioning increases in order to maintain indoor thermal comfort, thus the building energy consumption rises. More building energy consumption leads to more electricity demand [12] and more anthropogenic heat emissions from buildings to the outdoors [13], which in turn enhances the UHI [13]. The presence of high-density wooden residential areas enhances the regional UHI, which increases building energy consumption and in turn exacerbates the UHI again, creating a vicious cycle.
The thermal environment is closely related to human health, especially for vulnerable groups such as the elderly. D Onozuka et al. [14] quantitatively proved that extreme heat and cold temperatures are significantly and non-linearly correlated with increased mortality risk by analyzing data on daily total mortality and mean air temperatures in Fukuoka, Japan, from 1973 to 2012. Elderly people are more vulnerable to heat stress. Japan is a country with a serious aging population. As traditional residential buildings, a large number of elderly people are living in densely built wooden residential areas. SN Gosling et al. [15] reviewed the relationship between temperature and mortality and found that elderly people and those with existing illnesses such as ischemic heart disease, and respiratory disease are most vulnerable to extreme temperatures. C Heaviside et al. [16] investigated the relationship between UHI countermeasures and human health, suggesting that UHI mitigation measures can reduce the health effects of high temperatures. O Buchin et al. [17] also explored the impact of UHI countermeasures on reducing health risks. They found that the number of heat-related deaths in people over 65 years old is expected to double for every 1 K increase in ambient temperature, while a 50% reduction in deaths can be achieved if the average ambient temperature is lowered by 0.8 K.
Research on UHI countermeasures has been well-developed. Many researchers have explored mitigating summer heat effects by applying heat countermeasures. Vegetations, such as trees, are commonly applied outdoors and have been proven beneficial to the thermal environment and energy savings [18,19,20]. Many researchers have also focused on building countermeasures [21,22,23,24]. Among these countermeasures, green roofs, green curtains, mist systems, and applying high-reflectance materials have been frequently explored. The effects of applying these countermeasures on energy conservation and indoor environmental improvement were proven through numerous experiments and simulations [21,22,23,24,25,26]. Increasing urban albedo is a commonly used UHI countermeasure. Synnefa et al. [25] considered the effect of increasing solar reflectance on cooling loads and thermal comfort in residential buildings and showed that an increase of 0.65 in solar reflectance resulted in reductions of 8–48 kWh/m2 in building cooling loads and 1.2–3.7 °C in the maximum indoor temperatures according to different climate conditions. The increase in green areas in cities is also a popular UHI strategy. L Cirrincione et al. [26] explored the impact of green roofs on the energy consumption and indoor thermal environment of buildings, demonstrating that green roofs can reduce the energy consumption of Esch-sur-Alzette by 20–50% during the cooling season with a significant reduction in PMVs.
Several studies have been conducted on the effect of density on the thermal environment [27,28,29,30,31]. Kitakaze et al. [30] indicated that the decrease in street wind speed caused by density is related to outdoor thermal comfort. For indoor thermal environment studies, an experimental study conducted in an actual densely built area showed that solar radiation entering the alley space primarily influences the summer thermal environment. Without air-conditioning, residences may experience higher temperatures in summer, leading to indoor thermal discomfort [31]. Another study revealed that increased density leads to lower indoor temperatures due to fewer open street canyons and reduced heat entering through glass facades [28]. Nonetheless, with three years of field measurements, D Xu et al. [32] demonstrated that building density can explain about 66% of the variation in urban air temperature, becoming the most influential urban spatial indicator.
In Japan, densely built wooden house areas have wooden residences with poor thermal insulation, narrow land and roads, few public facilities, such as greenery and parks, and many elderly residents vulnerable to high temperatures. Current research in these areas has focused on earthquake- and fire-resistant renovation [33,34]. However, these characteristics can also cause problems, such as worsening daylighting and ventilation and retaining heat from outdoor air conditioner units, resulting in high thermal environmental risks and energy consumption in summer. Consequently, densely built wooden house areas have a higher heat risk in the summer. Considering the increasing UHI and GW effects, it is necessary to take effective countermeasures to alleviate the problem of high energy consumption and low thermal comfort in these areas. However, most studies have focused only on the benefits during the summer season. The fact of reduced energy consumption in the winter season caused by the low sky view factor in densely built wooden areas is also important to be considered. In addition, there are few papers that comprehensively consider the relationship between UHI countermeasures, building density, annual building energy consumption, and the thermal environment, which is highly necessary for practical engineering. There is a gap in our understanding of how changes in density affect natural ventilation, daylighting, and indoor temperatures in densely built wooden house areas throughout the year. Utilizing the SCIENCE-vent model [35,36,37,38] enables us to assess the impact of density changes on energy consumption and the thermal environment and to evaluate the effectiveness of UHI countermeasures applied to densely built wooden house areas.
Therefore, the objectives of this study are to investigate the effects of density and UHI countermeasures on energy consumption and indoor thermal comfort to learn the thermal characteristics and improve the living environment in densely built wooden house areas. An annual hourly simulation was conducted based on the real conditions of a typical densely built area in Yokohama, Japan. The indoor climate control behavior, energy consumption, and indoor thermal comfort were evaluated based on three densities to clarify the effects of density. The reduction in energy consumption and improvement in the indoor thermal environment were evaluated by applying six conventional countermeasures to clarify the effects of UHI countermeasures. The introduction of the simulation model and simulation condition are given in Section 2. Section 3 presents the simulation results. The discussion and conclusion are presented in Section 4 and Section 5, respectively.

2. Methods

2.1. Simulation Model

This study used the SCIENCE-Vent model [35,36,37,38] for the evaluation. This model can predict the energy consumption of the air-conditioning system, lighting use, and indoor thermal comfort in each room every 15 min for one year by considering outdoor and indoor environments. This model included the following submodels: (1) radiant, (2) wind, and (3) indoor thermal environments. Figure 1 shows the calculation flow. The radiant submodel calculated the radiation field outside and inside the buildings by considering the influence of the surrounding buildings. The sky view factor of the outer surface of each building, the shape factor of the ground and surrounding buildings, and the reception ratio of direct sunlight were calculated for the outside building field. The sky view factor of the wall surface, shape factor, Gebhart’s absorption coefficient [39] for solar radiation, and long-wavelength component were calculated for the inside building field. The obtained radiation data were prepared for the surface temperature and radiative heat flux of the wall surfaces during the indoor thermal environment submodel calculation.
The wind environment submodel calculated the indoor airflow wind speed and wind pressure coefficient based on computational fluid dynamics (CFD). In this model, the outdoor wind environment analysis was performed based on the hypothesis that opening and closing the openings does not affect the outdoor airflow properties. In addition, the airflow characteristics were assumed linear with the wind speed in a well-developed turbulent field. Therefore, this analysis used only one condition as the inlet wind speed. Sixteen external wind directions were analyzed. The vertical profiles of the wind velocity component, pressure, turbulence energy, turbulence energy dissipation rate at the outflow boundary, and wind pressure coefficient at the building wall were obtained from the results. These results were used as the inflow boundary conditions during the indoor thermal environment submodel calculation.
The indoor thermal environment submodel calculated the air-conditioning/lighting energy consumption and indoor thermal comfort every 15 min. The submodel calculated the heat load, ventilation network, air conditioner, lighting, and indoor climate control behavior. For indoor climate control behavior calculation, the number of occupants, heat load condition, and acceptable indoor and outdoor temperature were considered to determine the use of air conditioning and natural ventilation. Figure 2 shows the climate control behavior calculation flow in the cooling season, midseason, and heating season.
These results were used to predict the indoor thermal environment and energy consumption based on the results of the radiant and wind environment submodels. The heat generated by weather conditions, the human body, and equipment was considered. In the air-conditioning calculations, the coefficient of performance (COP) and heat load calculations determined the energy consumption [40]. The lighting calculation calculated room illuminance by multiplying the irradiance by solar radiation. In addition, the luminous efficacy of direct and indirect daylight rates was considered. The Standard New Effective Temperature (SET*) [41] at 1.2 m above the floor was used as the indoor thermal comfort index in the indoor thermal environment regulation calculation. This index can consider indoor air temperature, radiant heat, relative humidity, air velocity, metabolic rate, and clothing rate, and is widely used in indoor thermal comfort assessment [42,43,44].

2.2. Simulation Conditions

The study area is District A, located in the Nishi Ward of Yokohama City, Japan, which has been identified as a typical densely built wooden area by the Japanese Ministry of Land, Infrastructure, Transport, and Tourism [45]. Figure 3 shows the building ages and wooden construction distribution of District A based on Foundational Urban Planning Survey Data from Yokohama City [46]. According to Japan’s Energy Efficiency Standards [47], the building ages were divided into before 1980, from 1980 to 1992, from 1992 to 1999, and after 1999, which represent unregulated (Equivalent to Insulation Performance Rating1), old (Equivalent to Insulation Performance Rating2), new (Equivalent to Insulation Performance Rating3) and next-generation (Equivalent to Insulation Performance Rating4) Energy Standards, respectively. The results indicated that in District A, wooden constructions constitute 77% of the total building stock, with the majority (47%) being those constructed before 1980, which exhibited poor insulation performance.
Figure 4 illustrates the changes in the senior citizen rate in District A, Nishi Ward, Yokohama City, and Japan. District A exhibited a higher senior citizen ratio in comparison to Yokohama City. Furthermore, between 1998 and 2018, the senior citizen ratio in District A consistently surpassed 21%, meeting the criteria for a super-aged society according to the definitions provided by the World Health Organization (WHO) and the United Nations.
Figure 5 shows the house plan utilized in this study. The house plan was determined using the hearing of residents in District A. After a comprehensive evaluation of five existing houses, the representative house for the local community was selected for modeling in the simulation. Furthermore, as the wall of the house was found to have no thermal insulation based on the investigation, the wall conditions in this study were set according to the unregulated Japanese Energy Standards for residential buildings without thermal insulation [47,48]. Table 1 and Table 2 list the details of computational conditions and wall composition, respectively. Considering the compositional characteristics of the ageing population in District A, the household comprised a family of two elderly people. An air-cooled heat pump system was set up for the living room, main bedroom, and second bedroom. The schedule of occupancy and heat generation were determined using the automatic setup program, “SCHEDULE” [49]. Mechanical ventilation was set to 0.5/h, and artificial lighting was used when the room illumination was less than 75 lx. Blackout curtains were used at bedtime and lace curtains were used at other times.
Figure 6 shows the outdoor calculation area. In the SCIENCE-vent model, eight identical houses were placed around the target house, and changes in exterior density were achieved by adjusting the road width parameters. To determine the density classifications of District A, Foundational Urban Planning Survey Data from Yokohama City were used for the calculation [46]. The average gross building coverage ratio was calculated by the total building area and total region area data in the study area, expressed by the following general equation:
R = A a A g ,
Here, R is the gross building coverage ratio, Aa is the total building area, and Ag is the total region area of the study area.
Following the calculation, the average gross building coverage ratio in this study stands at 47%. To determine the relatively high and low gross building coverage ratios, the road widths were referenced as shown in Figure 7. The average road width was calculated at 2.8 m based on District A’s average gross building coverage ratio. Subsequently, since the road widths of the average gross building coverage ratio was 2–3 m, the road widths of 1–2 m and 3–4 m roads were selected to represent the high and low gross building ratios, respectively. After calculation, these three gross building coverage ratios were adopted as the external density conditions: average gross building coverage ratio of 47%, high gross building coverage ratio of 59%, and low gross building coverage ratio of 37%.
The Expanded Automated Meteorological Data Acquisition System weather data [50] for Yokohama in 2019 was utilized for calculation. The cooling and heating seasons were from 18 April to 3 November and 4 November to 17 April, respectively.

2.3. Countermeasures

This study examined six UHI countermeasures, categorized into rooftop and wall countermeasures. Rooftop countermeasures included high-reflectance roofs, green roofs, and mist. Wall countermeasures comprised high-reflectance walls, green curtains, and bamboo blinds. Table 3 provides details of each countermeasure.
High-reflectance roof entails the application of highly reflective paint to rooftop surfaces. By increasing the solar reflectance of building rooftops, shortwave radiation from the sun to the rooftop surface can be suppressed, and the sensible heat load of the air on the roof surface can be reduced. In summer, by reducing the amount of heat transferred from the roof to the room, the indoor thermal environment of each room can also be improved. In this study, the reflectivity of the roof surface was set at 0.6.
Green roof involves placing the installation of vegetation on the rooftop, offering benefits on reducing sensible heat release from the rooftop and lowering cooling energy consumption. The vegetation also contributes to lowering the rooftop surface temperature through evaporation and transpiration processes. Furthermore, green units can also provide insulation. In this study, the layers of vegetation and soil with a thermal conductivity of 1.85 W/m·K were added to the rooftop surface. The evaporation efficiency of the rooftop surface was enhanced, varying from 0.0 to 0.3, and the rooftop surface albedo was increased from 0.20 to 0.25 [51,52]. It was assumed that the rooftop vegetation would recede during the winter, with an evaporation efficiency set at 0.05, taking into account only the soil layer.
Mist on the roof cools the building by deploying roof water showers. These showers can mitigate sensible heat release from the roof and reduce cooling energy consumption. Additionally, the sprinkled water contributes to surface temperature reduction via evaporation. In this study, the mist was assumed to represent rooftop water showers, active only during daytime until 5 p.m. when its surface temperature exceeds 40 °C in the cooling season. The rooftop surface’s evaporation efficiency was set at 0.7 during showering, gradually decreasing after the misting stops [53].
High-reflectance wall entails the application of highly reflective paint to all building surfaces. The high-reflectance wall helps diminish the heat ingress from sunlight and neighboring structures into walls, thereby reducing the energy required for air-conditioning in the summer. It may also mitigate the risk of room overheating by minimizing heat transfer from exterior walls to the interior spaces. In this study, the wall surface’s reflectivity was set at 0.6.
Green curtains are installed on the south-facing walls and windows of the building. They are effective in preventing indoor temperature rise due to direct summer sunlight by providing solar radiation shielding and reducing solar heat gain. By adjusting the thermostat settings, air-conditioning energy consumption may be reduced. Based on Hoyano et al.’s experiment study [54], the solar reflectance of south-facing window surfaces and walls was set to 0.1, and flow attenuation was set to 0.42.
Bamboo blinds are installed on all windows of the building. These blinds may have the potential to decrease the solar heat that enters the room through the building windows. The moderate gaps in the bamboo blinds also allow for good ventilation, which prevents heat from accumulating in the room. In this study, solar reflectance of all window surfaces was set to 0.2 and flow attenuation was set to 0.5 [55].

2.4. Validation of Simulation Model

To verify the accuracy of the SCIENCE-Vent model, the simulation results were compared with measurement data of District A’s building. The indoor temperatures of the bedroom and living room were considered in the validation. The simulation and measurement data were from 6:00 a.m. on 18 August 2018 to 6:00 a.m. on 19 August 2018 when air-conditioning was not in use.
Figure 8 presents the results of the indoor temperature comparisons on simulation and measurement. During the comparison period, the temperature differences in the bedroom and the living room were on average 0.08 °C and 0.59 °C, respectively. In the living room, the calculated values throughout the day were slightly higher than the measured values. In the bedroom, the measured values from midnight to morning were marginally higher than the calculated values. In contrast, the measured values were lower from noon to night. Despite some minor discrepancies in accuracy, the model can be considered to provide a reasonably good fit to the measurement data. The potential reasons for errors may include discrepancies between the external environment modeled based on the average gross building coverage ratio and the actual external conditions of measurements. Additionally, uncertainties arise from internal heat generation due to equipment and human activities.

3. Results

3.1. Effect of Density

3.1.1. Indoor Climate Control Behavior and Energy Consumption

Figure 9a,b show the results of the indoor climate control behavior by density during the cooling and heating seasons, respectively. During the cooling season, the air-conditioning time decreased slightly with increased density. The air-conditioning time increased during the heating season.
Figure 10a,b show the results of the air-conditioning and lighting energy consumption by density during the cooling and heating seasons, respectively. During the cooling season, the air-conditioning energy consumption decreased with increased density. However, no significant change in the air-conditioning energy consumption was observed during the heating season. The lighting energy consumption increased with density during the cooling and heating seasons. Overall, energy consumption increased with density during the cooling and heating seasons.

3.1.2. Indoor Thermal Comfort

This study analyzed the effect of density on indoor thermal comfort by calculating the SET* range and time for non-air-conditioned and air-conditioned conditions to confirm indoor thermal comfort. The time people stayed in each air-conditioned room was extracted for analysis in July, August, and September to clarify the actual indoor thermal comfort in summer. The SET* between 22.2 and 25.6 °C [56] was considered a comfortable zone. High-temperature zone and low-temperature zone were set as SET* range of 25.6–30.0 °C and below 22.2 °C, respectively.
Figure 11a shows the results during the non-air-conditioning time. Among the total of three rooms, the comfortable SET* zone hours showed no significant change in density. However, in high-temperature zone hours, the results showed an increased tendency with density. Compared with the 47% density results, the high-temperature zone hours decreased by 6.0% and increased by 7.4% in the cases with 37% and 59% densities, respectively. Regarding the SET* distribution among different rooms, the second room on the second floor exhibited shorter low-temperature zone hours with higher density. Moreover, a significant trend of high-temperature conditions was observed in the second room in a high-density case of 59%.
Figure 11b shows the results during the air-conditioning time. Among the total of three rooms, the comfortable SET* hours increased with density. Compared with 47% density results, the comfortable SET* zone hours decreased by 4.1% and increased by 3.6% in the cases with 37% and 59% densities, respectively. Moreover, a significant high-temperature SET* hours drop (9.8%) was observed with 59% density. However, SET* distribution among different rooms was insignificant with density.

3.2. Effect of UHI Countermeasures on Energy Consumption

3.2.1. Cooling Season

Figure 12a shows the air-conditioning and lighting energy consumption and relative reduction percentage when UHI countermeasures were applied during the cooling season.
The reduction effect of each countermeasure was confirmed for the air-conditioning energy consumption. The green roof exhibited the most significant energy reduction effect among the six countermeasures. The green roof reduced the cooling energy consumption by 46.6 kWh across the average results of three densities, accounting for 18.8% of air-conditioning energy consumption over the entire cooling season. Moreover, the high-reflectance roof and mist also reduced the air-conditioning energy consumption by an average of 40.2 kWh (16.2%) and 28.3 kWh (11.4%), respectively, during the whole cooling season, ranking second and third among all countermeasures.
Regarding lighting energy consumption, the high-reflectance wall demonstrated the most significant energy reduction effect among the six countermeasures. In the 37% density case, the high-reflectance wall reduced the lighting energy consumption by 12.6 kWh. Similarly, in the 47% density case, the reduction amounted to 14.6 kWh, and in the 59% density case, it reached 18.4 kWh. These reductions accounted for 32.9%, 34.4%, and 36.6% of the entire cooling season’s lighting energy consumption, respectively. However, the green curtain and the bamboo blinds showed a negative effect on lighting energy consumption reduction. The green curtain in 37% density increased the lighting energy consumption by 71.2%, which was the highest among all scenarios.
Overall, the roof countermeasures exhibited greater efficacy in reducing cooling energy consumption, whereas the wall countermeasures demonstrated a greater impact on lighting energy consumption. The effect of density on both cooling and lighting energy consumption was not significant with roof countermeasures. However, it was highly significant with wall countermeasures.

3.2.2. Heating Season

Only the green and high-reflectance roofs/walls were used during the heating season. Figure 12b shows the air-conditioning and lighting energy consumption and relative reduction percentage when these countermeasures were applied.
In the air-conditioning energy consumption results, only the green roof showed a slight reduction effect on air-conditioning energy consumption. Throughout the entire heating season, the green roof reduced the air-conditioning energy consumption by 4.6 kWh, 3.9 kWh, and 2.9 kWh in 37% density case, 47% density case, and 59% case, respectively. However, the effect of the green roof was less than 1.0% during the entire heating season. Moreover, the high-reflectance roof/wall increased heating energy consumption. The energy consumption was increased by 4.8% and 2.9%, respectively.
During the heating season, lighting energy consumption showed a trend similar to that observed during the cooling season. The effect of density on lighting energy consumption was negligible with roof countermeasures but significant with wall countermeasures (the high-reflectance wall). Applying the high-reflectance wall led to a decrease in lighting energy consumption amounting to 26.3%, 30.9%, and 33.2% of the total lighting energy use for the 37% density case, 47% density case, and 59% case, respectively.
Overall, except for green roofs, each countermeasure showed a negative effect on energy consumption reduction. The high-reflectance wall showed a significant reduction in lighting energy use.

3.2.3. Annual Results

Figure 13 shows the results of annual energy consumption reduction in air-conditioning energy consumption and overall energy consumption. Among the six countermeasures, the green roof stood out as the most effective option for reducing air-conditioning energy consumption. The green roof proved to be beneficial for both the cooling and heating seasons. Throughout the year, the green roof reduced the energy consumption by 50.4 kWh across the average results of three densities, representing an average energy reduction of 5.7% compared to the base case. The mist and the green curtain led to average reductions of 3.2% and 2.3%, respectively, demonstrating their potential to reduce air-conditioning energy consumption. Conversely, the high-reflectance roof, the high-reflectance wall, and the bamboo blinds yielded average reductions of only 1.1%, 0.04%, and 0.7%, respectively.
Furthermore, considering the overall energy consumption (including air-conditioning and lighting), the performance of wall countermeasures in lighting energy consumption had a significant impact on annual energy consumption reduction, which is different from the cases not considering the lighting. A substantial portion of the energy consumption reduction by the high-reflectance wall was attributed to the reduction in lighting energy consumption, with reductions of 2.6%, 3.0%, and 3.6% for 37%, 47%, and 59% density cases, respectively. In contrast, when lighting was not considered, the overall energy consumption was only marginal, at 0.04% on average. Conversely, the green curtain and the bamboo blinds increased the lighting energy consumption, resulting in an overall rise in energy consumption.

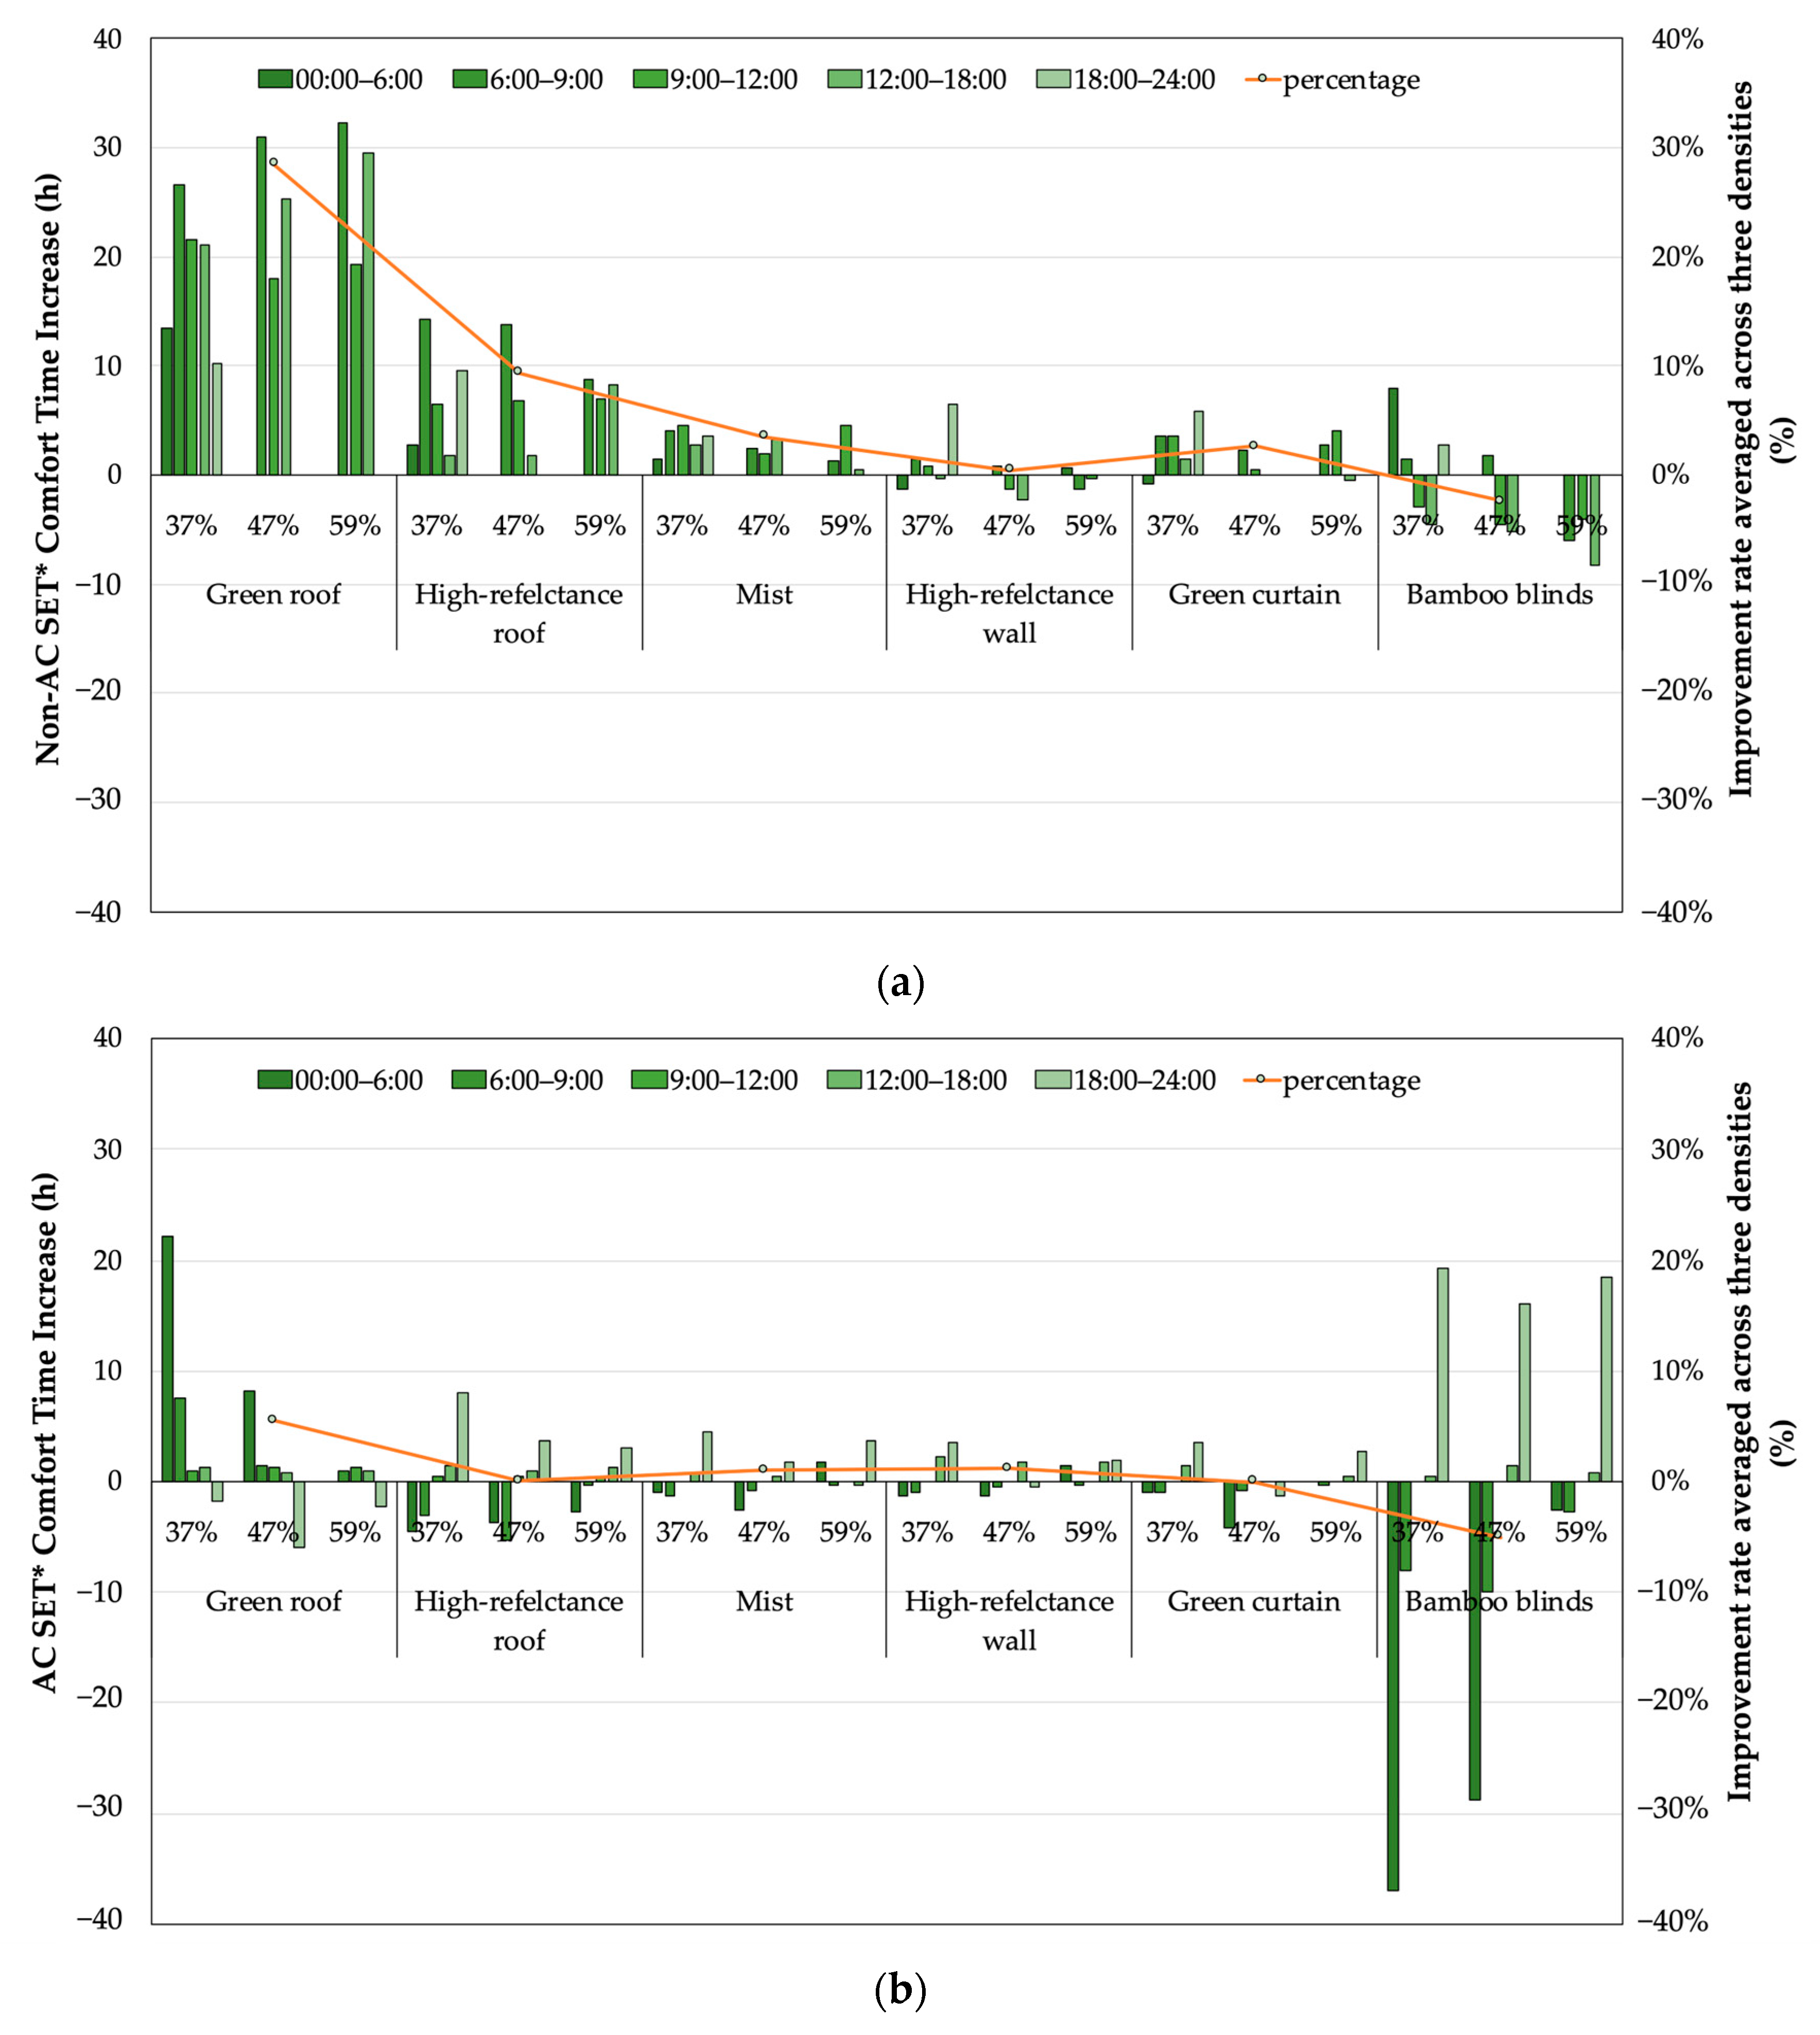
3.3. Effect of UHI Countermeasures on Indoor Thermal Comfort

This section analyzes the effect of UHI countermeasures on the indoor thermal environment by evaluating the hours within the SET* comfort zone with and without air-conditioning during July, August, and September. The second room on the second floor was used for evaluation. The time people stayed in each air-conditioned room was extracted for analysis. The time of day was classified as follows: 0:00 am to 6:00 am; 6:00 am to 9:00 am; 9:00 am to 12:00 am; 12:00 pm to 6:00 pm; and 6:00 pm to 24:00 pm.
Figure 14a shows the increase in non-air-conditioned comfort time among the three density levels and the improvement rate across the average results of these densities. The roof countermeasures significantly enhanced indoor thermal comfort. Among these countermeasures, the green roof exhibited the most significant effect, increasing overall thermal comfort time by 28.5%. The effect of the green roof was particularly pronounced in the morning, with an increase of 29.9 h in comfort time across the average results of three densities. The high-reflectance roof and the mist increased comfort time by an average of 9.3% and 3.5%, respectively. The wall countermeasures showed minimal influence on thermal comfort. The high-reflectance wall and the green curtain increased comfort time by an average of 0.5% and 2.6%, respectively, whereas the bamboo blinds reduced comfort time by 2.4%.
Figure 14b shows the increase in air-conditioning comfort time among the three density levels and the improvement rate across the average results of these densities. The application of countermeasures had a relatively modest effect on indoor thermal comfort during air-conditioning hours. The green roof increased the comfort time by 5.5%. Conversely, the bamboo blinds reduced the comfort time by 5.0%. The high-reflectance roof, the mist, the high-reflectance wall, and the green curtain had negligible effects on indoor thermal comfort, with changes of around 0.1%. Overall, the trends contrasted with those in the non-air-conditioned cases because the application of countermeasures led to a reduction in air-conditioned hours, except for the green roof during the night.

4. Discussion

According to the results of the density effect on energy consumption in Section 3.1, although the overall energy consumption increased with density, the air-conditioning energy consumption decreased slightly in the cooling season. The results indicated that in dense neighborhoods, the amount of incoming solar radiation through windows decreased with increased building density, altering the duration of air-conditioning usage. This finding aligned with Li et al. [28] that increased density led to a reduction in heat entering through glass facades, resulting in lower indoor temperatures. In contrast, the effect of density on air-conditioning energy consumption was insignificant during the heating season. This could be considered that energy consumption did not change significantly in winter due to the large temperature difference between outdoor and indoor air-conditioning. Furthermore, the results in Section 3.2 indicate that compared with the effect of density on energy consumption, density influenced the energy consumption with the countermeasures more. Among these, the wall countermeasures were particularly affected. This was because the amount of solar radiation reflected from surrounding buildings entering through windows increased with increased density.
In terms of energy consumption, some countermeasures exhibited distinct seasonal characteristics. In the cooling season, the air-conditioning energy reduction caused by the high-reflectance roof was 16.2%, ranking only second to the green roof among the six countermeasures. However, the benefits of the high-reflectance roof in the cooling season were offset by the loss in the heating season, resulting in only a 1.1% annual reduction effect. Other studies in Europe have shown different trends. Stavrakakis et al. [57] indicated that in Greece, applying a high-reflectance roof reduced 18% of cooling energy demand under a 12% heating penalty in winter. Pisello et al. [58] also concluded that the high-reflectance roof proved to be an effective solution for optimizing the indoor thermal environment during the summer, with significantly lower winter losses compared to summer benefits. These implied that high-reflectance roofs may be unsuitable for Japan’s climatic conditions. In contrast, green roofs can effectively reduce energy consumption in the cooling and heating seasons. Solar radiation shielding and leaf transpiration occur during the cooling season. Green roofs act as an insulating layer in winter, resulting in significant energy reduction effects. Based on these results, green roofs can be considered an effective countermeasure that can provide benefits throughout the year.
Moreover, analyzing the lighting energy consumption for buildings in densely built areas is crucial when considering UHI countermeasures for annual energy conservation. The influence of lighting energy consumption was primarily observed in the wall countermeasures. In the high-reflectance wall case, the lighting energy consumption decreased significantly because reflection enhanced solar reflection from the surrounding buildings, and its influence increased with density. Although the high-reflectance wall showed little air-conditioning energy reduction, it ranked second in annual energy reduction among the countermeasures due to its influence on lighting.
The effect of the countermeasures on indoor thermal comfort was characterized by the time of the day. The results in Section 3.3 indicate that in the morning, the green roof significantly improved the thermal comfort of the second-floor indoor space. This was attributed to the thermal comfort improvement mechanism of countermeasures. The findings suggested that the characteristics of countermeasure effectiveness as well as the location and activity time of human-occupied rooms should be considered when applying heat countermeasures. However, this study only conducted a preliminary analysis; future research will consider the mechanisms of countermeasure implementation and room usage.
This study primarily focused on the quantitative assessment of the effectiveness of densities and applying countermeasures. The results indicate that among the six countermeasures for densely built wooden house areas, the green roof shows the most significant effect on both energy consumption reduction and thermal environment improvement. Furthermore, the results based on different densities can provide valuable insights for future improvements in the living environment of densely built wooden house areas. However, this study still has some limitations. In this study, the effect of density on outdoor temperatures was not considered. External temperatures vary with densities, which can influence indoor temperatures and energy consumption. In future studies, the influence of density on outdoor temperatures will be considered for energy consumption analysis. Additionally, the initial and maintenance costs incurred when implementing these measures should be considered in future studies. For a more comprehensive assessment, future research will quantitatively demonstrate the cost-effectiveness of the countermeasures by assessing both energy and non-energy benefits.

5. Conclusions

This study focused on the thermal characteristics of densely built areas by evaluating the effects of density and UHI countermeasures in a typical densely built wooden urban area in Yokohama, Japan. The following conclusions were drawn using numerical analysis based on the SCIENCE-Vent simulation model:
(1)
Air-conditioning usage decreased, whereas lighting usage increased with increased density in the cooling season. The results demonstrated that energy consumption increased throughout the year according to density.
(2)
SET* in the high-temperature zone increased with increased density during the non-air-conditioning hours. SET* shifted to a comfortable zone with increased density during the air-conditioning hours.
(3)
Among the evaluated UHI countermeasures, the green roof demonstrated the largest reduction in energy consumption throughout the year. The effect of the green roof was mainly in air-conditioning energy consumption, with a reduction of 18.8% during the cooling season and a slight reduction of 0.06% during the heating season, resulting in an annual reduction of 5.7%. Meanwhile, the benefit of the high-reflectance roof in summer was offset by the demerits in the heating season, resulting in an annual reduction of only 1.1%, which was less than those of the cooling season-only measures such as mist and green curtains. The high-reflectance walls exhibited the highest reduction in lighting energy consumption, with savings of an average of 34.6% during the cooling season and 30.1% during the heating season.
(4)
Density had minimal effects on the rooftop countermeasures. In contrast, the annual energy consumption reduction effect of the high-reflectance walls increased with density. Based on the results, the high-reflectance wall reduced the overall energy consumption by 2.6%, 3.0%, and 3.6% in 37%, 47%, and 59% densities, respectively.
(5)
The thermal regulation mechanisms of the UHI countermeasures affected their indoor thermal environment improvement effect. The green roof showed the highest improvement in indoor thermal comfort in the morning. In the average results across the three densities, the green roof can increase the total comfort time by 29.9 h in the morning compared to the no countermeasure case during the no-AC time in the summer.

Author Contributions

Conceptualization, methodology, S.L. and D.N.; software, validation, formal analysis, investigation, resources, data curation, writing—original draft preparation, S.L.; writing—review and editing, R.L.; supervision, funding acquisition, R.L. and D.N. All authors have read and agreed to the published version of the manuscript.

Funding

This study was funded by JSPS KAKENHI, grant number JP18KK0123 and 22H01649. It was also supported by the Assistant Secretary for Energy Efficiency and Renewable Energy, Building Technologies Office of the U.S. Department of Energy under Contract No. DE-AC02-05CH11231.

Institutional Review Board Statement

Not applicable.

Informed Consent Statement

Not applicable.

Data Availability Statement

Data sharing is not applicable due to restrictions privacy. The data presented in this study are available on request.

Acknowledgments

The authors acknowledge Jiayang Feng’s assistance on the calculation model revision and Jun Xu for the experiment used for validation.

Conflicts of Interest

The authors declare no conflict of interest.

References

  1. Japan Meteorological Agency. Available online: https://www.data.jma.go.jp/cpdinfo/himr_faq/04/qa.html (accessed on 6 August 2022).
  2. IPCC. In Climate Change 2014 Synthesis Report; IPCC: Geneva, Switzerland, 2014; pp. 58–59.
  3. Li, M.; Shi, J.; Guo, J.; Cao, J.; Niu, J.; Xiong, M. Climate impacts on extreme energy consumption of different types of buildings. PLoS ONE 2015, 10, e0124413. [Google Scholar] [CrossRef] [PubMed]
  4. Wang, S.S.Y.; Kim, H.; Coumou, D.; Yoon, J.H.; Zhao, L.; Gillies, R.R. Consecutive extreme flooding and heat wave in Japan: Are they becoming a norm? Atmos. Sci. Lett. 2019, 20, e933. [Google Scholar] [CrossRef]
  5. Kayaga, S.M.; Amankwaa, E.F.; Gough, K.V.; Wilby, R.L.; Abarike, M.A.; Codjoe, S.N.; Kasei, R.; Nabiles, C.K.; Yankson, W.K.; Mensah, P.; et al. Cities and extreme weather events: Impacts of flooding and extreme heat on water and electricity services in Ghana. Environ. Urban. 2021, 33, 131–150. [Google Scholar] [CrossRef]
  6. Parker, L.E.; McElrone, A.J.; Ostoja, S.M.; Forrestel, E.J. Extreme heat effects on perennial crops and strategies for sustaining future production. Plant Sci. 2020, 295, 110397. [Google Scholar] [CrossRef]
  7. Lobell, D.B.; Sible, A.; Ivan Ortiz-Monasterio, J. Extreme heat effects on wheat senescence in India. Nat. Clim. Chang. 2012, 2, 186–189. [Google Scholar] [CrossRef]
  8. Iwata, T.; Harada, E.; Maly, E. Towards improving provision of wooden temporary housing: Analysis of repairs of temporary housing built by local contractors after the great east Japan earthquake. Int. J. Disaster Risk Reduct. 2023, 86, 103537. [Google Scholar] [CrossRef]
  9. Kubota, T.; Miura, M.; Tominaga, Y.; Mochida, A. Wind tunnel tests on the relationship between building density and pedestrian-Level wind velocity: Development of guidelines for realizing acceptable wind environment in residential neighborhoods. Build. Environ. 2008, 43, 1699–1708. [Google Scholar] [CrossRef]
  10. Yang, Y.; Zhang, X.; Lu, X.; Hu, J.; Pan, X.; Zhu, Q.; Su, W. Effects of building design elements on residential thermal environment. Sustain.-Basel 2018, 10, 57. [Google Scholar] [CrossRef]
  11. Li, Y.; Schubert, S.; Kropp, J.P.; Rybski, D. On the influence of density and morphology on the urban heat island intensity. Nat. Commun. 2020, 11, 2647. [Google Scholar] [CrossRef]
  12. González-Torres, M.; Pérez-Lombard, L.; Coronel, J.F.; Maestre, I.R.; Yan, D. A review on buildings energy information: Trends, end-Uses, fuels and drivers. Energy Rep. 2022, 8, 626–637. [Google Scholar] [CrossRef]
  13. Chen, W.; Zhou, Y.; Xie, Y.; Chen, G.; Ding, K.J.; Li, D. Estimating spatial and temporal patterns of urban building anthropogenic heat using a bottom-up city building heat emission model. Resour. Conserv. Recycl. 2022, 177, 105996. [Google Scholar] [CrossRef]
  14. Onozuka, D.; Hagihara, A. Variation in vulnerability to extreme-temperature-related mortality in Japan: A 40-year time-series analysis. Environ. Res. 2015, 140, 177–184. [Google Scholar] [CrossRef] [PubMed]
  15. Gosling, S.N.; Lowe, J.A.; McGregor, G.R.; Pelling, M.; Malamud, B.D. Associations between elevated atmospheric temperature and human mortality: A critical review of the literature. Clim. Chang. 2009, 92, 299–341. [Google Scholar] [CrossRef]
  16. Heaviside, C.; Macintyre, H.; Vardoulakis, S. The urban heat island: Implications for health in a changing environment. Curr. Environ. Health Rep. 2017, 4, 296–305. [Google Scholar] [CrossRef] [PubMed]
  17. Buchin, O.; Hoelscher, M.T.; Meier, F.; Nehls, T.; Ziegler, F. Evaluation of the health-risk reduction potential of countermeasures to urban heat islands. Energy Build. 2016, 114, 27–37. [Google Scholar] [CrossRef]
  18. Akbari, H.; Pomerantz, M.; Taha, H. Cool surfaces and shade trees to reduce energy use and improve air quality in urban areas. Sol. Energy 2001, 70, 295–310. [Google Scholar] [CrossRef]
  19. Hsieh, C.M.; Li, J.J.; Zhang, L.; Schwegler, B. Effects of tree shading and transpiration on building cooling energy use. Energy Build. 2018, 159, 382–397. [Google Scholar] [CrossRef]
  20. Aboelata, A.; Sodoudi, S. Evaluating urban vegetation scenarios to mitigate urban heat island and reduce buildings’ energy in dense built-up areas in Cairo. Build. Environ. 2019, 166, 106407. [Google Scholar] [CrossRef]
  21. Kim, J.; Hong, T.; Jeong, J.; Koo, C.; Jeong, K. An optimization model for selecting the optimal green systems by considering the thermal comfort and energy consumption. Appl. Energy 2016, 169, 682–695. [Google Scholar] [CrossRef]
  22. Perez, G.; Rincon, L.; Vila, A.; Gonzalez, J.M.; Cabeza, L.F. Green vertical systems for buildings as passive systems for energy savings. Appl. Energy 2011, 88, 4854–4859. [Google Scholar] [CrossRef]
  23. Narumi, D.; Shigematsu, K.; Shimoda, Y. Effect of evaporative cooling techniques by spraying mist waster on energy saving in apartment house. In Proceedings of the 26th International Conference on Passive and Low Energy Architecture: Architecture Energy and the Occupant’s Perspective, Osaka, Japan, 22–24 July 2009. [Google Scholar]
  24. Akbari, H.; Konopacki, S.; Pomerantz, M. Cooling energy savings potential of reflective roofs for residential and commercial buildings in the United States. Energy 1999, 24, 391–407. [Google Scholar] [CrossRef]
  25. Synnefa, A.; Santamouris, M.; Akbari, H. Estimating the effect of using cool coatings on energy loads and thermal comfort in residential buildings in various climatic conditions. Energy Build. 2007, 39, 1167–1174. [Google Scholar] [CrossRef]
  26. Cirrincione, L.; Marvuglia, A.; Scaccianoce, G. Assessing the effectiveness of green roofs in enhancing the energy and indoor comfort resilience of urban buildings to climate change: Methodology proposal and application. Build. Environ. 2021, 205, 108198. [Google Scholar] [CrossRef]
  27. Chan, I.Y.S.; Liu, A.M.M. Effects of neighborhood building density, height, greenspace, and cleanliness on indoor environment and health of building occupants. Build. Environ. 2018, 145, 213–222. [Google Scholar] [CrossRef] [PubMed]
  28. Li, J.; Zheng, B.; Bedra, K.B.; Li, Z.; Chen, X. Effects of residential building height, density, and floor area ratios on indoor thermal environment in Singapore. J. Environ. Manag. 2022, 313, 114976. [Google Scholar] [CrossRef]
  29. Evola, G.; Gagliano, A.; Fichera, A.; Marletta, L.; Martinico, F.; Nocera, F.; Pagano, A. UHI effects and strategies to improve outdoor thermal comfort in dense and old neighbourhoods. Energy Procedia 2017, 134, 692–701. [Google Scholar] [CrossRef]
  30. Kitakaze, H.; Yuan, J.; Yamanaka, T.; Kobayashi, T. Study on influence of solar reflective characteristics of building envelops on thermal environment of urban canyon influence of solar reflectance of building envelops and wind speed, on ambient thermal environment. In Proceedings of the 40th AIVC—8th Tight Vent & 6th Venticool Conference, Ghent, Belgium, 15–16 October 2019. [Google Scholar]
  31. Tsuji, M.; Hokoi, S. A study on thermal environment of an alley and houses in a densely populated area during summer. J. Archit. Plan. 2002, 67, 23–30. [Google Scholar] [CrossRef]
  32. Xu, D.; Zhou, D.; Wang, Y.; Xu, W.; Yang, Y. Field measurement study on the impacts of urban spatial indicators on urban climate in a Chinese basin and static-wind city. Build. Environ. 2019, 147, 482–494. [Google Scholar] [CrossRef]
  33. Murakami, M.; Ikagura, S.; Taga, N. Development of a gis-based city planning support system for congested areas of wooden houses. J. Arch. Plan. 2001, 66, 185–192. [Google Scholar] [CrossRef]
  34. Andou, M.; Kouda, M.; Kojima, T.; Sone, S. The study about the actual condition of wooden clustered houses areas before the earthquake, and the mechanism of damages in these areas. J. Arch. Plan. 1999, 64, 287–295. [Google Scholar] [CrossRef]
  35. Habara, H.; Narumi, D.; Kobayashi, S.; Shimoda, Y.; Mizuno, M. Development of a method to estimate indoor thermal condition and air conditioning energy consumption in residential house using natural ventilation. J. Environ. Eng. Trans. AIJ. 2004, 69, 107–114. [Google Scholar] [CrossRef] [PubMed]
  36. Habara, H.; Narumi, D.; Shimoda, Y.; Mizuno, M. A thermal environment control behavior model in energy consumption in residential houses. J. Hum. Liv. Environ. 2004, 11, 83–88. [Google Scholar]
  37. Narumi, D.; Taketa, A.; Shimoda, Y. Development of a method to estimate indoor climate and air conditioning energy consumption in residential house considering the influence of cross ventilation. In Proceedings of the 29th Air Infiltration and Ventilation Centre Conference, Kyoto, Japan, 14–16 October 2008. [Google Scholar]
  38. Habara, H.; Narumi, D.; Shimoda, Y.; Mizuno, M. A study on determinants of air conditioning on/off control in dwellings based on survey. J. Environ. Eng. Trans. AIJ 2005, 70, 83–90. [Google Scholar] [CrossRef] [PubMed]
  39. Gebhart, B. A new method for calculating radiant exchanges. ASHRAE Trans. 1959, 65, 321–332. [Google Scholar]
  40. Shimoda, Y.; Fujii, T.; Morikawa, T.; Mizuno, M. Residential end-use energy simulation at city scale. Build. Environ. 2004, 39, 956–967. [Google Scholar] [CrossRef]
  41. Gagge, A.P.; Stolwijk, J.A.J.; Nishi, Y. An effective temperature scale based on a simple model of human physiological regulatiry response. Mem. Fac. Eng. Kyushu Univ. 1972, 13, 21–36. [Google Scholar]
  42. Zhang, Y.; Chen, H.; Meng, Q. Thermal comfort in buildings with split air-conditioners in hot-humid area of China. Build. Environ. 2013, 64, 213–224. [Google Scholar] [CrossRef]
  43. López-Pérez, L.A.; Flores-Prieto, J.J.; Ríos-Rojas, C. Adaptive thermal comfort model for educational buildings in a hot-humid climate. Build. Environ. 2019, 150, 181–194. [Google Scholar] [CrossRef]
  44. Sadeghi, M.; Wood, G.; Samali, B.; de Dear, R. Effects of urban context on the indoor thermal comfort performance of windcatchers in a residential setting. Energy. Build. 2020, 219, 110010. [Google Scholar] [CrossRef]
  45. Ministry of Land, Infrastructure, Transport and Tourism of Japan. Densely Populated Urban Areas Highly Vulnerable during Earthquake, etc. Available online: https://www.mlit.go.jp/jutakukentiku/house/jutakukentiku_house_tk5_000086.html (accessed on 8 December 2020).
  46. G Space Information Center. Yokohama City Urban Planning Survey Data. Available online: https://www.geospatial.jp/ckan/dataset/yokohama-kiso (accessed on 13 April 2021).
  47. Ministry of Land, Infrastructure, Transport and Tourism of Japan. Available online: https://www.mlit.go.jp/common/000024459.pdf (accessed on 17 August 2023).
  48. Japan Sustainable Building Consortium. Available online: https://www.jsbc.or.jp/document/files/guide.pdf (accessed on 3 April 2023).
  49. Ishida, K. Program for scheduling of indoor heat generation rate due to livelihood. In Proceedings of the SHASE Symposium, Tokyo, Japan, 23 October 1996. [Google Scholar]
  50. Architectural Institute of Japan Expanded AMeDAS Weather Data. Extended AMeDAS Weather Data. Available online: https://www.metds.co.jp/product/ea/ (accessed on 17 July 2020).
  51. Yamaguchi, T.; Yokoyama, H.; Ishii, K. Mitigating the urban heat island effect by light and thin rooftop greening. J. Jpn. Inst. Landsc. Archit. 2005, 68, 509–512. [Google Scholar] [CrossRef]
  52. Matsushita, I.; Hatano, S.; Narumi, D. Evaluation on the ability of roofing unit covered with greens in mitigating outdoor thermal environment and reducing energy consumption for air-conditioning system. Pap. Environ. Inf. Sci. 2005, 19, 117–122. [Google Scholar]
  53. Narumi, D.; Shigematsu, K.; Shimoda, Y. Effect of the evaporative cooling techniques by spraying mist water on reducing urban heat flux and saving energy in an apartment house. J. Heat. Isl. Inst. Int. 2012, 7, 175–181. [Google Scholar]
  54. Hoyano, A.; Chatani, M.; Yagi, K. Experimental study on solar control by an ivy covered wall. J. Arch. Plan. Environ. Eng. 1985, 351, 11–19. [Google Scholar]
  55. Habara, H. Development of a Method for Predicting Air Conditioning Energy Consumption in Residential Buildings Considering Outdoor Conditions and Natural Ventilation Utilization. Ph.D. Thesis, Osaka University, Suita, Japan, 2006. [Google Scholar]
  56. Fukai, K.; Ito, H.; Gotoh, S.; Akui, S.; Saito, J. Experimental study on correlation between standard new effective temperature (SET) and Japanese thermal sensation. ASHRAE Trans. 1993, 51, 139–147. [Google Scholar]
  57. Stavrakakis, G.M.; Androutsopoulos, A.V.; Vyörykkä, J. Experimental and numerical assessment of cool-roof impact on thermal and energy performance of a school building in Greece. Energy Build. 2016, 130, 64–84. [Google Scholar] [CrossRef]
  58. Pisello, A.L.; Rossi, F.; Cotana, F. Summer and winter effect of innovative cool roof tiles on the dynamic thermal behavior of buildings. Energies 2014, 7, 2343–2361. [Google Scholar] [CrossRef]
Figure 1. Outline of the SCIENCE-Vent model [36].
Atmosphere 14 01566 g001
Figure 2. Flow chart of indoor climate control behavior model in (a) cooling and midseason and (b) heating season [36].
Atmosphere 14 01566 g002aAtmosphere 14 01566 g002b
Figure 3. Building ages and wooden constructions’ distribution in District A.
Atmosphere 14 01566 g003
Figure 4. Senior citizen rate changes in District A, Nishi Ward, Yokohama City, and Japan.
Atmosphere 14 01566 g004
Figure 5. Plan view of the target house.
Atmosphere 14 01566 g005
Figure 6. Outdoor calculation area.
Atmosphere 14 01566 g006
Figure 7. Road width and directions.
Atmosphere 14 01566 g007
Figure 8. Time series of the difference in indoor temperature of simulation and measurement.
Atmosphere 14 01566 g008
Figure 9. Rate of indoor climate control during (a) cooling season and (b) heating season.
Atmosphere 14 01566 g009
Figure 10. Air conditioning and lighting energy consumption during (a) cooling season and (b) heating season.
Atmosphere 14 01566 g010
Figure 11. Distribution of SET* occurrences in (a) non-AC time zone and (b) AC time zone.
Atmosphere 14 01566 g011
Figure 12. Energy consumption changes during (a) cooling season and (b) heating season.
Atmosphere 14 01566 g012
Figure 13. Annual energy consumption reduction.
Atmosphere 14 01566 g013
Figure 14. Hours on SET* comfortable zone during (a) non-air conditioning time and (b) air conditioning time.
Atmosphere 14 01566 g014
Table 1. Outline of the computational condition.
PropertyValue
outdoorclimate condition2019 AMeDAS weather data (Yokohama City, Japan) [50]
ground albedo0.16
buildinghouse modeltypical old, detached house in dense urban A
structurewooden
total floor space73.72 m2
insulationno insulation
envelope albedo0.2 (base condition)
space conditioning unitair-cooled type heat pumps; cooling capacity in living roomeach 3.6 kW; cooling capacity in main bedroom: 2.2 kW
occupanthouseholdmother (over 80 years old) and daughter (60 years old housewife)
preset temperature and relative humidity27 °C and uncontrolled humidity in the heating season
opening patterninterior doors and windows: all closed in base conditions, open in ventilated conditions
schedule of occupancy and heat generationset by applying the automatic setup scheduling program SCHEDULE [49]
Table 2. Wall composition of the target building.
PartLayerThermal Conductivity
(W/m·K)
Volumetric Heat Capacity
(W/m·K)
Thickness
rooftopgypsum board0.213904.20.012
air layer-1.20.064
plywood0.129715.80.012
slate0.9601520.00.012
outer wallgalvanized iron sheet45.0002900.00.012
air player-1.20.044
mud wall0.6901144.00.060
plaster1.0872013.00.014
inner wallplaster1.0872013.00.014
mud wall0.6901144.00.052
plaster1.0872013.00.014
second-floor groundplywood0.160715.80.012
air layer-1.20.276
galvanized iron sheet0.220904.20.012
first-floor groundplywood0.160715.80.050
Table 3. Outline of the countermeasure.
LocationCountermeasureComputational Condition
rooftophigh-reflectancerising the rooftop albedo from 0.2 to 0.6
green roofimproving the evaporation efficiency of the rooftop to 0.3 in summer and 0.05 in winter [51,52]
mistsetting the evaporation efficiency of the rooftop from 0.0 to 0.7 [53]
wall surface
(window included)
high-reflectancerising all wall surface albedo from 0.2 to 0.6
green curtainsetting solar reflectance of south-facing window surfaces and walls to 0.1 [54] and flow attenuation to 0.42 from 23 May to 4 October
bamboo blindsetting solar reflectance of all window surfaces to 0.2 and flow attenuation to 0.5 from 23 May to 4 October [55]
Disclaimer/Publisher’s Note: The statements, opinions and data contained in all publications are solely those of the individual author(s) and contributor(s) and not of MDPI and/or the editor(s). MDPI and/or the editor(s) disclaim responsibility for any injury to people or property resulting from any ideas, methods, instructions or products referred to in the content.

