Article

Characteristic Variation of Particulate Matter-Bound Polycyclic Aromatic Hydrocarbons (PAHs) during Asian Dust Events, Based on Observations at a Japanese Background Site, Wajima, from 2010 to 2021

1
Graduate School of Medical Sciences, Kanazawa University, Kakuma-Machi, Kanazawa 920-1192, Japan
2
School of Civil Engineering, Architecture and Environment, Hubei University of Technology, Wuhan 430068, China
3
Institute of Nature and Environmental Technology, Kanazawa University, Kakuma-Machi, Kanazawa 920-1192, Japan
4
Collaborative Innovation Center on Forecast and Evaluation of Meteorological Disasters, Nanjing University of Information Science and Technology, Nanjing 210044, China
5
Key Laboratory of Cloud-Precipitation Physics and Severe Storms, Institute of Atmospheric Physics, Chinese Academy of Sciences, Beijing 100029, China
6
Institute of Carbon Neutrality, Qilu Zhongke, Jinan 250100, China
7
Institute of Medical, Pharmaceutical and Health Sciences, Kanazawa University, Kakuma-Machi, Kanazawa 920-1192, Japan
8
College of Energy and Power, Shenyang Institute of Engineering, Shenyang 110136, China
*
Authors to whom correspondence should be addressed.
Atmosphere 2023, 14(10), 1519; https://doi.org/10.3390/atmos14101519
Submission received: 21 August 2023 / Revised: 24 September 2023 / Accepted: 27 September 2023 / Published: 30 September 2023

Abstract

:
Asian dust (AD) events and total suspended particles (TSPs) were observed at the Kanazawa University Wajima Air Monitoring Station (KUWAMS), a Japanese background site, during the East Asian winter monsoon periods (from November to May of the following year) from 2010 to 2021. Nine kinds of polycyclic aromatic hydrocarbons (PAHs) were determined in each TSP sample. In this study, a total of 54 AD events were observed. According to the different pathways of long-range transportation, AD events were divided into AD-high events (transported at higher altitudes, approximately 4000 m) and AD-low events (transported at lower altitudes, approximately 2500 m). The TSP concentrations increased sharply in the AD events and were higher in the AD-high events (39.8 ± 19.5 μg/m3) than in the AD-low events (23.5 ± 10.5 μg/m3). AD did not have a significant effect on the ΣPAHs characteristic variation, as ΣPAHs (ΣPAHs = fluoranthene, pyrene, benz[a]anthracene, chrysene, benzo[b]fluoranthene, benzo[k]fluoranthene, benzo[a]pyrene, benzo[ghi]perylene, and indeno [1,2,3-cd]pyrene) concentrations in non-AD periods, AD-high events, and AD-low events were 543 ± 374, 404 ± 221, and 436 ± 265 pg/m3, respectively. The PAH compositions were also consistent. As a result, the TSP concentration was affected by the input air mass transported at higher altitudes from the desert region while the PAH concentration was impacted by the air mass at lower altitudes, which carried the PAHs emitted from fossil fuels and biomass combustion in northeastern China. Moreover, the health risks of PAHs were calculated with the inhalation lifetime cancer risk, which ranged from 10−6 to 10−5 ng/m3, indicating a potential carcinogenic risk at the KUWAMS during the East Asian winter monsoon periods.

1. Introduction

Asian dust (AD) is primarily composed of mineral aerosols derived from desert areas, such as the Taklimakan Desert, the Gobi Desert in Mongolia, and the Northern China Desert [1]. Although AD is generally known as a natural phenomenon, it can negatively affect air quality and atmospheric visibility [2]. In addition, a previous study has proved that AD is considered a potentially toxic particle and poses potential adverse health effects, such as cardiovascular disease and respiratory diseases [3]. AD occurs most frequently and has the widest impact area during East Asian winter monsoon periods (from November to May of the following year). During these time periods, AD can be transported to northern China, Korea, and Japan, where it causes significant atmospheric pollution and health impacts [4,5,6,7].
During an AD outbreak, both natural aerosols and anthropogenic pollutants can be transported downwind, as reported in prior studies [8,9,10,11]. It is noteworthy that among several anthropogenic pollutants, polycyclic aromatic hydrocarbons (PAHs) have drawn great attention due to their substantial carcinogenicity and mutagenicity [12,13]. For example, after PAHs are inhaled and transported to the whole human body, they will pose potential harm to vital organs such as the lungs, kidneys, and skin [14]. Additionally, the International Agency for Research on Cancer (IARC) has classified some PAHs as carcinogenic to human beings (Groups 1, 2A, and 2B) [15]. PAHs principally originate from incomplete combustion processes, such as traffic emissions, industrial activities, and biomass burning [16]. East Asia, especially northern China, always has severe PAH emissions due to the increasing utilization of fossil fuels and biomass fuels. Through investigations at a remote background site in Japan (Kanazawa University Wajima Air Monitoring Station: KUWAMS), our previous studies indicated that PAHs from the East Asian continent can be involved in the long-range transport of air masses, which leads to enhanced pollutant concentrations and health risks at the affected site [13,17].
In addition, some reports suggest that AD not only acts as a carrier of pollutants but is also believed to expedite atmospheric chemical reactions due to the existence of transition metal ions and oxides [18,19]. However, our previous laboratory simulations showed that natural AD particles had a weak adsorption capacity for PAHs and did not promote the photodegradation of PAHs [20]. Furthermore, a pilot comparative investigation of the background site in Japan indicates that the arrival of AD does not necessarily lead to an increase in long-range PAH concentrations [17]. Therefore, there has been no systematic study, until now, of the association between AD and atmospheric pollutants, especially for carcinogenic PAHs with strong reactivity in the atmosphere during AD events. A systematic observation of the combined pollution from AD and air pollutants over long distances will play a critical role in understanding the effects of long-range transportation on the downstream environment.
In this study, long-term observations of AD events and total suspended particulates (TSPs) were carried out at the KUWAMS, a background site in Japan, during the East Asian winter monsoon periods from 2010 to 2021. The purposes were to evaluate the long-term variation in the AD frequency and to compare the characteristics and sources of particulate pollutants (TSPs and PAHs) during AD events.

2. Materials and Methods
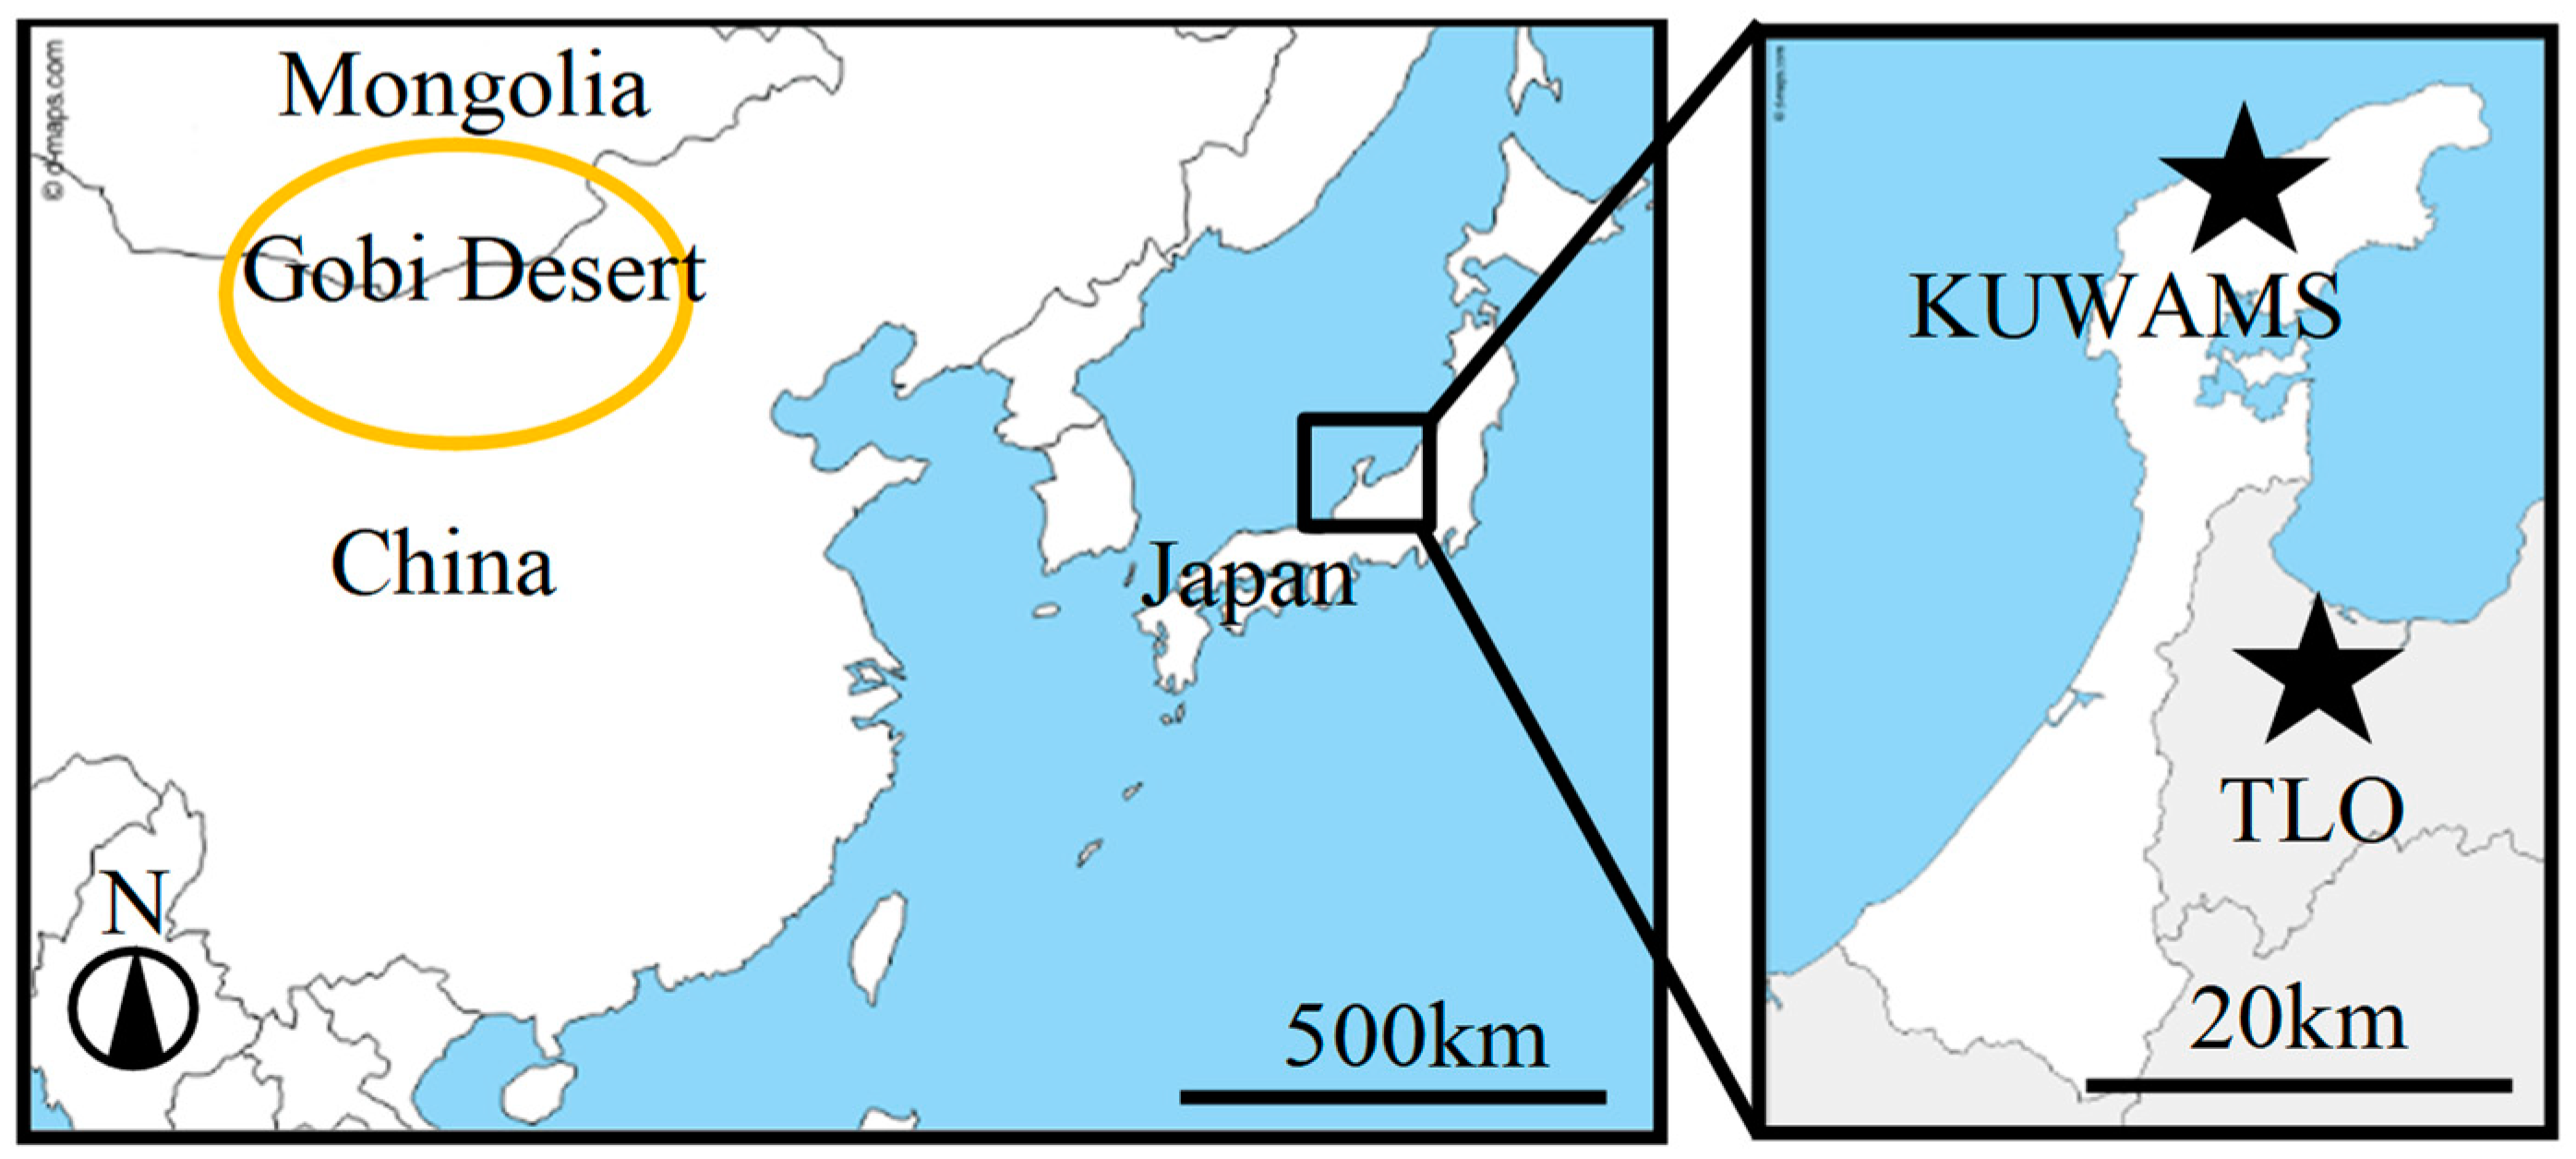
2.1. TSP Sampling

TSP sampling was conducted at KUWAMS (Figure 1, Nishifutamatamachi, Wajima City, Ishikawa Prefecture, Japan, 37.4 °N, 136.9 °E; 60 m above sea level), which is located on the Noto Peninsula between western Japan and mainland China, 2.1 km from the coastline. It is a background site without any dominant anthropogenic emission source of air pollutants [21,22,23,24].
The TSP sampling work started at 9:00 am using a high-volume air sampler (AH-600, Sibata Sci. Tech. Ltd., Saitama, Japan) with a quartz fiber filter (8 inch × 10 inch, 2500QAT- UP, Pallflex Products, Putnam, CT, USA) and a flow rate of 700 L/min. The filters were changed weekly from 1 January 2010 to 25 December 2021. After sampling, the filters were dried in a desiccator, kept in the dark, weighed, and kept in the refrigerator (−20 °C) until analysis.

2.2. Asian Dust Periods

The periods of the AD events were estimated using lidar images, based on the Toyama Light Detection and Ranging Observatory database (TLO, 36.70 °N, 137.10 °E) (Figure 1) [25]. The straight-line distance between the TLO and KUWAMS is 80.13 km (southeast). Lidar (light detection and ranging) is a device that emits laser beams into the sky, measures and analyzes scattered light such as particles, and observes the vertical distribution of particles floating in the sky.
All the lidar devices occupy flashlamp-pumped light with second harmonics (532 nm) as the light source. The laser power, repetition rate, and diameter of the telescope were 20 mJ, 10 Hz, and 20 cm, respectively. The depolarization ratio (δ) was identified as the ratio of the backscattering signal intensity of perpendicular and parallel components, which are separated by a cubic polarizer. By referring to the vertical structures of the range-corrected intensity and depolarization ratio, the scatterings in the atmosphere can be inferred [26]. The cloud profile was detected first by using the steep vertical gradient of the range-corrected intensity. If the signal intensity increased by more than 7.2%/m within 60 vertical layers, this condition is statistically significant at three successive points. This height will be judged as a cloud base. The scatterings below the cloud base are further divided into two categories. If the depolarization ratio is less than 10%, this part will be identified as spherical aerosol (blue color in lidar images). On the other hand, if the depolarization ratio exceeds 10%, this will be identified as mineral dust (green color in lidar images) [27]. In addition, the threshold values of 10% for the clouds are arbitrary and empirically determined [28]. In this study, we observed 54 AD events from 2010 to 2021 during the East Asian winter monsoon periods.

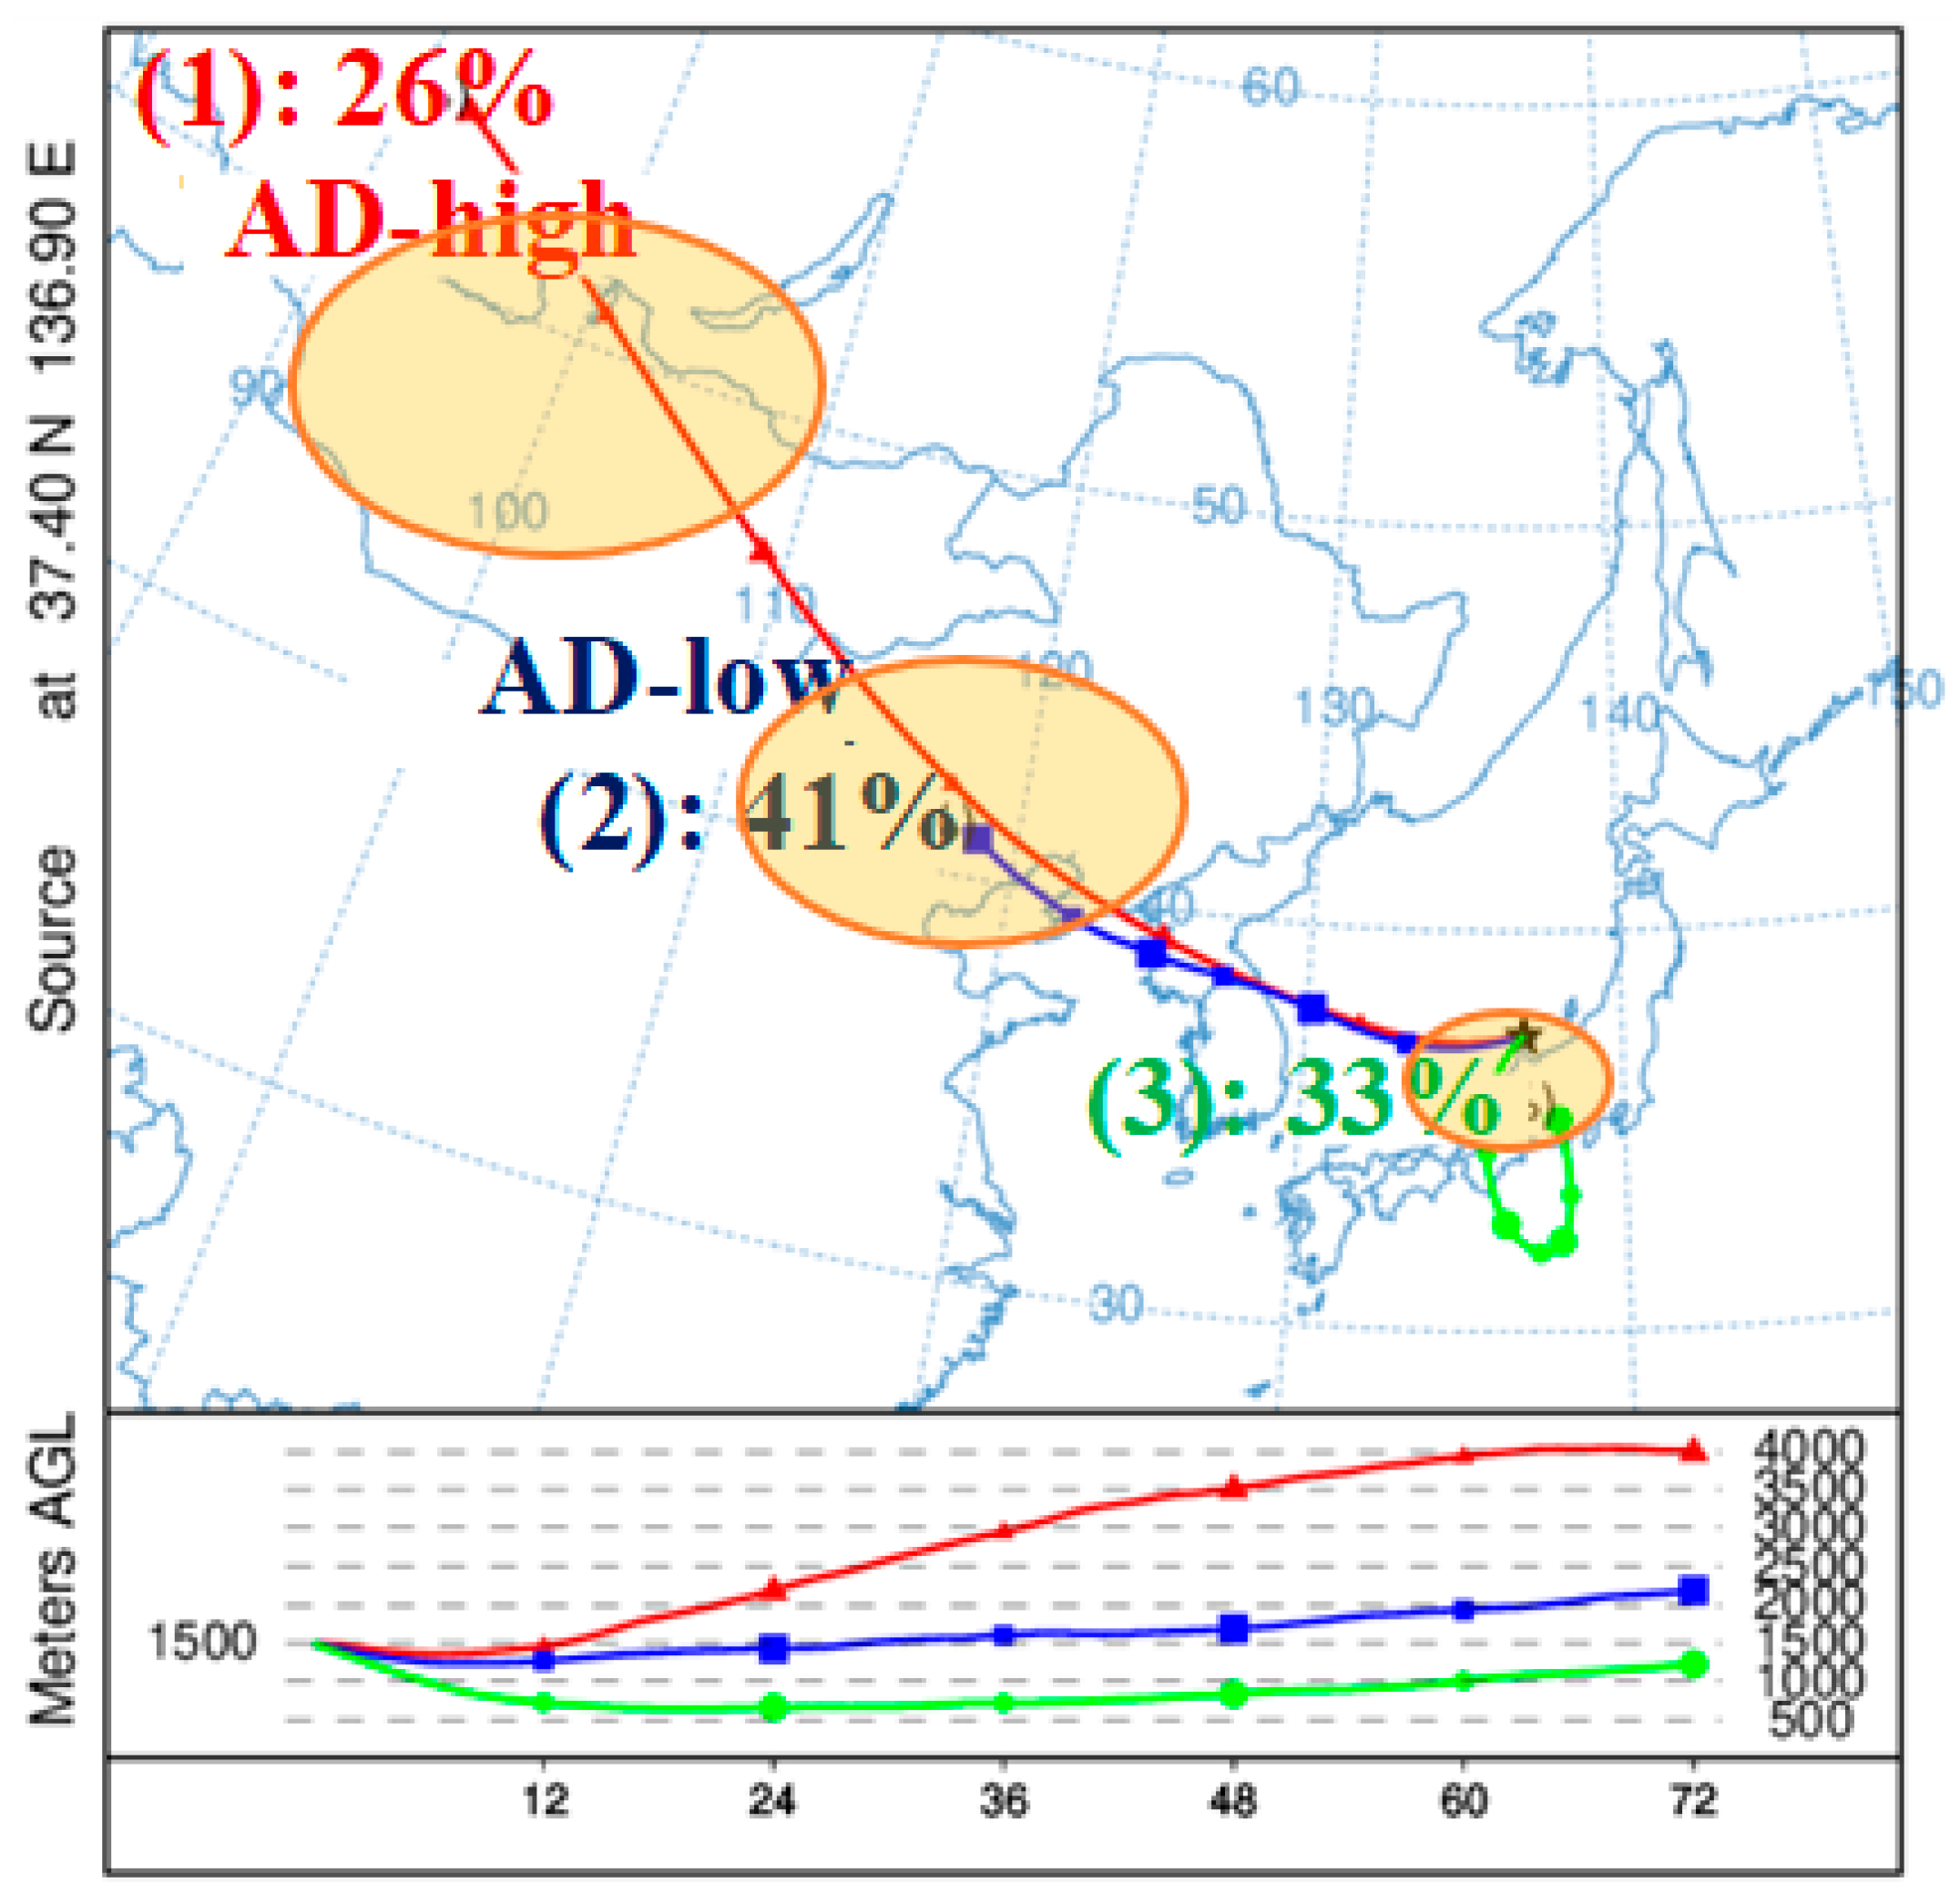
2.3. Backward Trajectory Cluster Analysis

The Hybrid Single-Particle Lagrangian Integrated Trajectory model (HYSPLIT-4, Windows-based version, NOAA Air Resources Laboratory, College Park, MD, USA) was used to analyze the transport route of the air mass during the AD periods. The global data assimilation system (GDAS 1°) of days from 2010 to 2021, provided by the National Centres for Environmental Prediction (NCEP) was used. Seventy-two-hour backward trajectories of arrival at KUWAMS (37.4 °N, 136.9 °E) and at arrival heights of 1500 m during each AD event were applied. According to the HYSPLIT User’s Guide, a total of 634 observed trajectories were clustered into 3 categories [29].

2.4. PAH Analysis

Nine kinds of target PAHs (fluoranthene (FR), pyrene (Pyr), benz[a]anthracene (BaA), chrysene (Chr), benzo[b]fluoranthene (BbF), benzo[k]fluoranthene (BkF), benzo[a]pyrene (BaP), benzo[ghi]perylene (BgPe), and indeno [1,2,3-cd]pyrene (IDP)) were determined in each TSP sample [8,9].
The methods of pretreatment, analysis, and quality control were consistent with our previous study [17]. Each filter was cut into small pieces. Then, the samples were placed in a flask, and internal standards (pyrene-d10 (Pyr-d10), benzo[a]pyrene-d12 (BaP-d12)) were added. Targe PAHs were extracted via ultrasonic extraction with benzene/ethanol (3:1, v/v), which was performed twice. Then, the extract was washed with sodium hydroxide and sulfuric acid solutions, and washed twice with ultrapure water. After washing, 100 µL of dimethyl sulfoxide (DMSO) was added to the solution. After being concentrated with a rotation evaporator, the extract was dissolved in 1.0 mL of acetonitrile. The organic solution was filtered through a 0.45 µm HLC-DISK membrane (Kanto Chemical Co., Tokyo, Japan). Twenty microliters of solution were injected into a high-performance liquid chromatography (HPLC) system (LC-20A series, Shimadzu Inc., Kyoto, Japan) for quantitative determination.

2.5. Quality Assurance and Quality Control

Particulate-bound PAHs were collected using quartz fiber filters. Before and after sampling, the filters were placed and weighed under stable conditions (temperature (21.5 ± 1.5 °C) and relative humidity (50 ± 5%)). Blank filters were used to measure the effects of background pollution, and no target compounds were found during the transport of blank samples. The analytical methods were confirmed by injecting PAH standard solutions into the analysis system. The calibration curves of all PAHs had good linearity (r > 0.995). The relative standard deviations (n = 3) of all PAHs were less than 5%. The internal standard recoveries of all samples ranged from 87% to 131%. The limit of determination is shown in Table S1.

2.6. Assessment of Health Risk

The assessment of health risks was calculated using the toxic equivalent factor (TEF) model [30,31]. Because BaP is considered to be the most toxic PAH and already has a good toxicological profile, BaP is used as the reference compound in the calculation of PAH toxicity in the TEF model [32,33]. The concentration of each PAH was converted to the toxic equivalent concentration of BaP through the TEF model:
B a P e q = C i × T E F i
In this equation, Ci represents each PAH concentration, and TEFi represents the TEF of each PAH relative to BaP (Table S2) [34].
The incremental lifetime cancer risk (ILCR) of PAHs through inhalation exposure was calculated via the following equation [35]:
I L C R = Σ B a P e q × U R B a P
In this equation, URBaP is the unit of cancer risk via inhalation exposure to one unit of BaP (1 ng/m3) over a lifetime of 70 years. The value of URBaP refers to epidemiological data focused on coke oven workers (URBaP: 8.7 × 10⁻⁵ ng/m3) from the World Health Organization [36].

2.7. Source Identification of PAHs

The emission of PAHs depends on the process of producing the PAHs [37]. Low-molecular-weight PAHs are formed in low-temperature processes, such as biomass burning, and high-molecular-weight PAHs are formed via high-temperature processes, such as fuel combustion. Diagnostic ratios of PAH isomers were applied to identify the major sources of PAHs [38]. Table 1 lists typical diagnostic ratios of PAHs.

3. Results and Discussions

3.1. Source of Ads during Sample Periods

Figure 2 shows the frequency variation of AD events observed at the KUWAMS in the East Asian winter monsoon periods from 2010 to 2021. Each AD event was identified using lidar images from the TLO station, and the AD event was regarded as one event if the dust phenomenon continuously lasted for consecutive days. The frequency of AD events from 2010 to 2021 was 4.9 times per year. The AD events mostly occurred in the springtime (from March to May), with a total of 48 events, while six AD events were observed in the wintertime (from November to February the following year). According to a related study, one of the reasons for this was the strong cyclone activity around the dust source regions in the springtime, which generates strong air convection and provides dynamic conditions for the development of dust storms [42].
As mentioned above in Section 2.3, a backward trajectory cluster analysis was carried out to determine the sources of the AD events, and the transport pathway of each cluster will be explained in detail in this section. As shown in Figure 3, the air masses that reached an altitude of 1500 m above the KUWAMS were divided into three categories. Category 1, which accounted for 26% of the total, was the air mass over Mongolia with a higher average transport height (approximately 4000 m) and faster transport speed (the speed calculated by the linear distance of the trajectory was approximately 54.8 km/h), which was identified as being AD-high for further discussion. Category 2 which accounted for 41% of the total, passed over northeast China at a lower average height (approximately 2500 m) with a slower transport speed (the speed calculated by the linear distance of the trajectory was approximately 21.5 km/h) and was identified as AD-low. Category 3, accounting for 33% of the total, showed local effects during the AD events, as the air mass came from Japan at heights lower than 1000 m, around the planet boundary layer, as shown in Figure S2. The duration of each AD event ranged from one to four days, which was less than the sampling period (7 days) in this study (Figure S1). Therefore, Category 3 reflected that the transport pathway of the air mass during the non-AD period was included in the sampling period. By referring to lidar observation images at the TLO and Sainshand during the sampling period (Figure S1) prior to the AD events observed in the TLO, strong AD events were already observed in Sainshand at an altitude of around 5000 m from the ground, with the depolarization ratios (δ532) ranging from 0.2 to 0.3. Related lidar observations also showed that the dust layer over northeastern China ranged from 2 to 4 km [43]. Therefore, by combining the results of backward trajectory cluster analysis and lidar observations, the sources of AD events in this study were considered to be the Gobi Desert region in Mongolia (AD-high) and northeastern China (AD-low).

3.2. TSP Concentration

Figure 4 compares the TSP concentration at the KUWAMS between the different AD types (AD-high and AD-low), and the periods where AD events were not observed (non-AD: NAD). As shown in Figure 4, the TSP concentration was highest in the AD-high events (39.8 ± 19.5 μg/m3), followed by the AD-low events (23.5 ± 10.5 μg/m3) and the NAD events (16.9 ± 9.8 μg/m3). As the result of one-way ANOVA, TSP concentrations showed an extremely significant difference between AD events (including those that are AD-high and AD-low) and NAD events (p < 0.001), while there was also a significant difference between the AD-high and AD-low events as the p value was 0.003, which was consistent with a previous study [44]. This indicated that the higher transported altitude and wind speed, such as those in an AD-high event, had a more notable effect on the TSP concentration enhancement, while in an AD-low event, the lower altitude and slower wind speed caused AD particles to be deposited before the air mass reached Japan.

3.3. PAH Concentration, Composition, and Source

Figure 5a shows ΣPAHs (ΣPAHs = Flu + Pyr + BaA + Chr + BbF + BkF + BaP + BgPe + IDP) concentration variations in NAD events, AD-low events, and AD-high events at the KUWAMS during the East Asian winter monsoon periods from 2010 to 2021. The average PAH concentration was the highest in NAD events (543 ± 374 pg/m3), followed by AD-low events (436 ± 266 pg/m3) and AD-high events (411 ± 215 pg/m3). In contrast to the TSP concentration variations, the PAH concentration was not significantly different between NAD events and AD events (including those that are AD-high and AD-low), with a p value of 0.500, or between AD-high and AD-low events (p = 0.687). The PAH concentration is also weakly correlated with the TSP (r = 0.104).
Figure 5b shows the composition of individual PAHs in the total PAHs. Among each PAH, FR, Pyr, and BbF were predominant, with average compositions of 26.7 ± 4.29%, 17.6 ± 2.25%, and 13.9 ± 2.02%, respectively. Among them, four-ring PAHs (FR, Pyr, BaA, and Chr) had the predominant contribution in the whole period, with an average concentration of 0.313 ± 0.234 ng/m3, followed by five-ring PAHs (the total of BbF, BkF, and BaP: 0.133 ± 0.093 ng/m3), and six-ring PAHs (the total of IDP and BgPe: 0.084 ± 0.052 ng/m3). For different aerosol types, the contribution of four-ring PAHs showed a decreasing trend in NAD events (57.7 ± 6.1%), AD-low events (55.9 ± 2.7%), and AD-high events (55.0 ± 4.5%). In contrast, the contribution of the five-ring PAHs and six-ring PAHs showed an increasing trend (five-ring PAHs: 25.4 ± 3.5%, 26.4 ± 1.6%, and 26.6 ± 2.9% in NAD events, AD-low events, and AD-high events, respectively; six-ring PAHs: 16.9 ± 3.8%, 17.7 ± 2.7%, and 18.4 ± 3.2% in NAD events, AD-low events, and AD-high events, respectively). However, this variation did not show a significant difference between NAD and AD events (including AD-low and AD-high events; four-ring PAHs: p = 0.279; five-ring PAHs: p = 0.853; six-ring PAHs: p = 0.089), or between AD-high and AD-low events (four-ring PAHs: p = 0.468; five-ring PAHs: p = 0.754; six-ring PAHs: p = 0.508).
These results illustrate that the occurrence and different types of AD had nonsignificant effects on PAH concentration and composition variation. This difference was probably due to the low accumulation of PAHs on AD particles. Previous laboratory studies have pointed out that the active groups on AD particle surfaces tend to accumulate polar components, such as inorganic gases or water-soluble inorganic ions, while weakly adsorbing nonpolar PAHs, and the adsorption of water vapor to AD particles further inhibits the accumulation of PAHs [45,46,47,48]. The kinetic model study also proved this because of the extremely slow absorption rate of PAHs [49].
The diagnostic ratios in the NAD, AD-low, and AD-high groups are shown in Figure 6. The distribution range of the diagnostic ratio data of the NAD, AD-low, and AD-high groups was similar ([FR]/([FR] + [Pyr]) (NAD: 0.45–0.69; AD-low: 0.52–0.67; AD-high: 0.56–0.67), [BaA]/([BaA] + [Chr]) (NAD: 0.18–0.39; AD-low: 0.22–0.30; AD-high: 0.22–0.30), [IDP]/([IDP] + [BgPe]) (NAD: 0.20–0.72; AD-low: 0.45–0.63; AD-high: 0.44–0.67), and [BbF]/([BbF] + [BkF]) (NAD: 0.70–0.77; AD-low: 0.48–0.73; AD-high: 0.72–0.75), and there was no significant difference in either ratio (p > 0.05). This result suggests that whether AD occurred or not and the types of AD will not affect the variation in PAH emission sources. By comparing the ratio ranges among emissions, traffic emissions and coal and biomass combustion were the main sources of PAHs [38,39,40,41]. As shown in Figure 6, coal combustion showed a more notable contribution among PAH emission sources, suggesting the overwhelming superiority of coal combustion on the PAH concentrations in the East Asian winter monsoon periods, which was consistent with a previous study in the KUWAMS and China, but differed from the results in Korea where contributions were mainly from vehicle emissions [10,47]. Combined with the results of backward trajectory analysis, we speculate that PAHs at the KUWAMS were predominantly contributed by emissions in northern China, regardless of whether an AD event occurred.

3.4. Health Risks of PAHs

PAHs are well known for their serious carcinogenicity and mutagenicity [37,38,39]. To evaluate the possible health risk of PAHs under the effects of AD, the toxic equivalent concentrations relative to BaP (TEQs) of each PAH and the inhalation lifetime cancer risk (ILCR) were calculated. As shown in Figure 7a, the average TEQs of the total PAHs in the NAD, AD-low, and AD-high samples were 0.05 ± 0.03 ng/m3, 0.04 ± 0.03 ng/m3, and 0.04 ± 0.03 ng/m3, respectively. The TEQs of total PAHs had nonsignificant variation in the NAD, AD-low, and AD-high events (p = 0.471), and all of them were less than the European Union standard (1 ng/m3) (Figure 7) [50,51]. For individual PAHs, due to the similar PAH composition in the NAD, AD-low, and AD-high groups, the TEQ of each PAH was similar in each period. Except for BaP, the TEQs of IDP, BbF, BkF, and BaA accounted for more than 30% of the total PAHs, which suggests that the PAHs from traffic emissions posed a higher carcinogenic risk to human health (Figure S3). In addition, as a result of PAH concentration reduction, the TEQs of total PAHs showed a similar decreasing trend in the AD events from 2010 to 2021, illustrating a reduction in PAH health effects (Figure S4).
As a result, the ILCRs in the NAD, AD-low, and AD-high groups were 3.01 × 10⁻⁶, 2.28 × 10⁻⁶, and 2.23 × 10⁻⁶ ng/m3, respectively. The similar levels of the ILCR in each period suggests that AD had no significant effect on health risks caused by PAHs. Being similar to the variation in TEQs, the ILCR also showed a downward trend in AD events from 2010 to 2021 (Figure S3). However, the ILCRs all exceeded the acceptable level (10−6) reported by the US EPA, indicating that the negative health effects of PAHs were noteworthy [52].

4. Conclusions

In this study, TSPs were collected at the KUWAMS, a background site in Japan, during the East Asian winter monsoon periods from 1 January 2010 to 25 December 2021. Nine kinds of PAHs were analyzed in each TSP sample. The AD frequency was monitored through the lidar images from Toyama lidar observations. As a result, from 2010 to 2021, the frequency of AD in Japan was at a stable level. Under the effect of the enhanced East Asian monsoon, the AD particles could be transported over long distances from the desert region under different transport pathways resulting in a great increase in the particulate matter concentration at the KUWAMS during the AD periods. In contrast, the concentration and composition variations for PAHs differed from those for TSPs, indicating that AD does not necessarily lead to an effect on the change in PAH characteristics. Based on the backward trajectory analysis, the different concentration trends for PAHs and particulates were related to the heights of long-range air mass transport during the AD events: PAHs were affected by the air mass transported at lower altitudes and were generated from coal and traffic emissions in northeastern China; and particulate matter was under the effect of air masses at higher altitudes from the Gobi Desert. In addition, the ILCR values during the non-AD and AD periods remained similar and exceeded the acceptable limit, indicating that the air quality in Japan still requires attention.

Supplementary Materials

The following supporting information can be downloaded at: https://www.mdpi.com/article/10.3390/atmos14101519/s1. Figure. S1: Lidar observation of Volume Depolarization Ratio (532 nm) during AD events from 2010 to 2021 at Sainshand (44.5° N, 110.8° E) and Toyama (36.70° N, 137.10° E). The green color in lidar observation images shows the dust aerosol, the blue color represents the spherical aerosol, and the red color represents the ice cloud. Each AD event is marked in black block. The absence here of the lidar observation images at Sainshand during 2013 (03, 04), 2014 (05), 2015 (02, 03, 04), and 2021 (03, 04, 05) is due to the lack of data on the official website. Red box represents the AD-high events, blue box represents the AD-low events, and black box represents the AD events observed in Sainshand. Figure S2: The height of planetary boundary layer during AD occurrence periods from 2010 to 2021 over the Toyama area (longitude: 36 < x < 38, latitude: 136 < y < 137). Figure S3: The proportion of each PAH BaPeq in different types of AD during long-term observations from 2010 to 2021. Figure S4: ΣBaPeq and ILCR in AD events and AD frequency in the East Asian winter monsoon periods from 2010 to 2021. Table S1: LOD and LOQ of target PAHs. Table S2: TEF of target PAHs.

Author Contributions

N.T. designed the sampling work and the PAH analysis for particulate matters; N.T., P.B., L.Z., H.Z., X.Z. and Y.W. collected samples and conducted monitoring work; Y.W. analyzed the PAHs; P.B. performed statistical analysis; B.C., S.N. and A.M. performed the resources; N.T. gave recommendations for the paper. All authors have read and agreed to the published version of the manuscript.

Funding

This work was supported by the Sasakawa Scientific Research Grant (2023–3026) from The Japan Science Society; and the CHOZEN Project of Kanazawa University, Japan.

Institutional Review Board Statement

Not applicable.

Informed Consent Statement

Not applicable.

Data Availability Statement

Data is contained within the article or Supplementary Material. The data presented in this study are available in Supplementary Material.

Acknowledgments

The cooperative research programs of Institute of Nature and Environmental Technology, Kanazawa University, Japan. We thank the National Oceanic and Atmospheric Administration Air Resources Laboratory for providing the HYSPLIT 4 model (window-based). The authors acknowledge the Institute of Nature and Environmental Technology, Kanazawa University for the provision of the scientific data used in this publication (https://ki-net.db.kanazawa-u.ac.jp/ (accessed on 7 March 2023)).

Conflicts of Interest

The authors declare no conflict of interest.

References

  1. Sullivan, R.C.; Guazzotti, S.A.; Sodeman, D.A.; Prather, K.A. Direct Observations of the Atmospheric Processing of Asian Mineral Dust. Atmos. Chem. Phys. 2007, 7, 1213–1236. [Google Scholar] [CrossRef]
  2. Kashima, S.; Yorifuji, T.; Bae, S.; Honda, Y.; Lim, Y.-H.; Hong, Y.-C. Asian Dust Effect on Cause-Specific Mortality in Five Cities across South Korea and Japan. Atmos. Environ. 2016, 128, 20–27. [Google Scholar] [CrossRef]
  3. Kashima, S.; Yorifuji, T.; Suzuki, E. Asian Dust and Daily Emergency Ambulance Calls among Elderly People in Japan. J. Occup. Environ. Med. 2014, 56, 1277–1283. [Google Scholar] [CrossRef]
  4. Sun, Y.; Zhuang, G.; Huang, K.; Li, J.; Wang, Q.; Wang, Y.; Lin, Y.; Fu, J.S.; Zhang, W.; Tang, A.; et al. Asian Dust over Northern China and Its Impact on the Downstream Aerosol Chemistry in 2004. J. Geophys. Res. Atmos. 2010, 115, D00K09. [Google Scholar] [CrossRef]
  5. Jung, M.-I.; Son, S.-W.; Kim, H.C.; Kim, S.-W.; Park, R.J.; Chen, D. Contrasting Synoptic Weather Patterns between Non-Dust High Particulate Matter Events and Asian Dust Events in Seoul, South Korea. Atmos. Environ. 2019, 214, 116864. [Google Scholar] [CrossRef]
  6. Takahashi, H.; Naoe, H.; Igarashi, Y.; Inomata, Y.; Sugimoto, N. Aerosol Concentrations Observed at Mt. Haruna, Japan, in Relation to Long-Range Transport of Asian Mineral Dust Aerosols. Atmos. Environ. 2010, 44, 4638–4644. [Google Scholar] [CrossRef]
  7. Otani, S.; Onishi, K.; Mu, H.; Kurozawa, Y. The Effect of Asian Dust Events on the Daily Symptoms in Yonago, Japan: A Pilot Study on Healthy Subjects. Arch. Environ. Occup. Health 2011, 66, 43–46. [Google Scholar] [CrossRef]
  8. Tang, N.; Hakamata, M.; Sato, K.; Okada, Y.; Yang, X.; Tatematsu, M.; Toriba, A.; Kameda, T.; Hayakawa, K. Atmospheric Behaviors of Polycyclic Aromatic Hydrocarbons at a Japanese Remote Background Site, Noto Peninsula, from 2004 to 2014. Atmos. Environ. 2015, 120, 144–151. [Google Scholar] [CrossRef]
  9. Zhang, L.L.; Yang, L.; Zhou, Q.Y.; Zhang, X.; Xing, W.L.; Zhang, H.; Toriba, A.; Hayakawa, K.; Tang, N. Impact of the COVID-19 Outbreak on the Long-Range Transport of Particulate Pahs in East Asia. Aerosol Air Qual. Res. 2020, 20, 2035–2046. [Google Scholar] [CrossRef]
  10. Zhang, X.; Zhang, L.L.; Yang, L.; Zhou, Q.Y.; Xing, W.L.; Toriba, A.; Hayakawa, K.; Wei, Y.; Tang, N. Characteristics of Polycyclic Aromatic Hydrocarbons (PAHs) and Common Air Pollutants at Wajima, a Remote Background Site in Japan. Int. J. Environ. Res. Public Health 2020, 17, 957. [Google Scholar] [CrossRef]
  11. Uematsu, M.; Yoshikawa, A.; Muraki, H.; Arao, K.; Uno, I. Transport of Mineral and Anthropogenic Aerosols during a Kosa Event over East Asia. J. Geophys. Res. Atmos. 2002, 107, AAC 3-1–AAC 3-7. [Google Scholar] [CrossRef]
  12. Yang, L.; Zhang, L.L.; Chen, L.; Han, C.; Akutagawa, T.; Endo, O.; Yamauchi, M.; Neroda, A.; Toriba, A.; Tang, N. Polycyclic Aromatic Hydrocarbons and Nitro-Polycyclic Aromatic Hydrocarbons in Five East Asian Cities: Seasonal Characteristics, Health Risks, and Yearly Variations. Environ. Pollut. 2021, 287, 117360. [Google Scholar] [CrossRef] [PubMed]
  13. Zhang, H.; Zhang, L.L.; Yang, L.; Zhou, Q.Y.; Zhang, X.; Xing, W.L.; Hayakawa, K.; Toriba, A.; Tang, N. Impact of COVID-19 Outbreak on the Long-Range Transport of Common Air Pollutants in KUWAMS. Chem. Pharm. Bull. 2021, 69, 237–245. [Google Scholar] [CrossRef] [PubMed]
  14. Zhang, X.; Zhang, H.; Wang, Y.; Bai, P.; Zhang, L.; Wei, Y.; Tang, N. Personal PM2.5-Bound PAH Exposure and Lung Function in Healthy Office Workers: A Pilot Study in Beijing and Baoding, China. J. Environ. Sci. 2023, 133, 48–59. [Google Scholar] [CrossRef] [PubMed]
  15. Hayakawa, K.; Tang, N.; Kameda, T.; Toriba, A. Atmospheric Behaviors of Polycyclic Aromatic Hydrocarbons in East Asia. Genes Environ. 2014, 36, 152–159. [Google Scholar] [CrossRef]
  16. Kumar, A.; Ambade, B.; Sankar, T.K.; Sethi, S.S.; Kurwadkar, S. Source Identification and Health Risk Assessment of Atmospheric PM2.5-Bound Polycyclic Aromatic Hydrocarbons in Jamshedpur, India. Sustain. Cities Soc. 2020, 52, 101801. [Google Scholar] [CrossRef]
  17. Yang, L.; Zhang, L.L.; Zhang, H.; Zhou, Q.Y.; Zhang, X.; Xing, W.L.; Takami, A.; Sato, K.; Shimizu, A.; Yoshino, A.; et al. Comparative Analysis of PM2.5-Bound Polycyclic Aromatic Hydrocarbons (PAHS), Nitro-Pahs (NPAHS), and Water-Soluble Inorganic Ions (WSIIS) at Two Background Sites in Japan. Int. J. Environ. Res. Public Health 2020, 17, 8224. [Google Scholar] [CrossRef]
  18. Liu, C.; Ma, Q.; Liu, Y.; Ma, J.; He, H. Synergistic Reaction between SO2 and NO2 on Mineral Oxides: A Potential Formation Pathway of Sulfate Aerosol. Phys. Chem. Chem. Phys. 2012, 14, 1668–1676. [Google Scholar] [CrossRef]
  19. Yang, X.-Y.; Okada, Y.; Tang, N.; Matsunaga, S.; Tamura, K.; Lin, J.-M.; Kameda, T.; Toriba, A.; Hayakawa, K. Long-Range Transport of Polycyclic Aromatic Hydrocarbons from China to Japan. Atmos. Environ. 2007, 41, 2710–2718. [Google Scholar] [CrossRef]
  20. Zhang, L.L.; Zhang, X.; Xing, W.L.; Zhou, Q.Y.; Yang, L.; Nakatsubo, R.; Wei, Y.; Bi, J.; Shima, M.; Toriba, A.; et al. Natural Aeolian Dust Particles Have No Substantial Effect on Atmospheric Polycyclic Aromatic Hydrocarbons (PAHs): A Laboratory Study Based on Naphthalene. Environ. Pollut. 2020, 263, 114454. [Google Scholar] [CrossRef]
  21. Tang, N.; Hattori, T.; Taga, R.; Igarashi, K.; Yang, X.; Tamura, K.; Kakimoto, H.; Mishukov, V.F.; Toriba, A.; Kizu, R.; et al. Polycyclic Aromatic Hydrocarbons and Nitropolycyclic Aromatic Hydrocarbons in Urban Air Particulates and Their Relationship to Emission Sources in the Pan-Japan Sea Countries. Atmos. Environ. 2005, 39, 5817–5826. [Google Scholar] [CrossRef]
  22. Tang, N.; Sato, K.; Tokuda, T.; Tatematsu, M.; Hama, H.; Suematsu, C.; Kameda, T.; Toriba, A.; Hayakawa, K. Factors Affecting Atmospheric 1-, 2-Nitropyrenes and 2-Nitrofluoranthene in Winter at Noto Peninsula, a Remote Background Site, Japan. Chemosphere 2014, 107, 324–330. [Google Scholar] [CrossRef] [PubMed]
  23. Zhou, Q.Y.; Zhang, L.L.; Yang, L.; Zhang, X.; Xing, W.L.; Hu, M.; Chen, B.; Han, C.; Toriba, A.; Hayakawa, K.; et al. Long-Term Variabi lity of Inorganic Ions in TSP at a Remote Background Site in Japan (Wajima) from 2005 to 2015. Chemosphere 2021, 264, 128427. [Google Scholar] [CrossRef]
  24. Bai, P.C.; Zhang, H.; Zhang, X.; Wang, Y.; Zhang, L.L.; Nagao, S.; Chen, B.; Tang, N. Chemical Characteristics of Water-Soluble Inorganic Ions in Different Types of Asian Dust in Wajima, a Background Site in Japan. Atmosphere 2022, 13, 1210. [Google Scholar] [CrossRef]
  25. National Institute for Environment Studies. Available online: https://www-lidar.nies.go.jp/Toyama/archives/ (accessed on 21 March 2023).
  26. Murayama, T.; Sugimoto, N.; Uno, I.; Kinoshita, K.; Aoki, K.; Hagiwara, N.; Liu, Z.; Matsui, I.; Sakai, T.; Shibata, T.; et al. Ground-Based Network Observation of Asian Dust Events of April 1998 in East Asia. J. Geophys. Res. Atmos. 2001, 106, 18345–18359. [Google Scholar] [CrossRef]
  27. Shimizu, A.; Sugimoto, N.; Matsui, I.; Arao, K.; Chen, Y. Continuous Lidar Observations of Asian Dust in Beijing, Nagasaki and Tsukuba. In Proceedings of the Third International Asia-Pacific Environmental Remote Sensing Remote Sensing of the Atmosphere, Ocean, Environment, and Space, Hangzhou, China, 23–27 October 2002; SPIE—The International Society for Optical Engineering: Bellingham, WA, USA, 2003; Volume 4893, pp. 448–455. [Google Scholar] [CrossRef]
  28. Shimizu, A.; Sugimoto, N.; Matsui, I.; Arao, K.; Uno, I.; Murayama, T.; Kagawa, N.; Aoki, K.; Uchiyama, A.; Yamazaki, A.A. Continuous Observations of Asian Dust and Other Aerosols by Polarization Lidars in China and Japan during ACE-Asia. J. Geophys. Res. D Atmos. 2004, 109, 1–14. [Google Scholar] [CrossRef]
  29. HYSPLIT Air Resources Laboratory. Available online: https://www.arl.noaa.gov/documents/reports/hysplit_user_guide.pdf (accessed on 23 March 2023).
  30. Zhang, X.; Zhang, H.; Wang, Y.; Bai, P.; Zhang, L.; Toriba, A.; Nagao, S.; Suzuki, N.; Honda, M.; Wu, Z.; et al. Estimation of Gaseous Polycyclic Aromatic Hydrocarbons (PAHs) and Characteristics of Atmospheric PAHs at a Traffic Site in Kanazawa, Japan. J. Environ. Sci. 2023, in press. [Google Scholar] [CrossRef]
  31. Minnesota Department of Health. Guidance for Evaluating the Cancer Potency of Polycyclic Aromatic Hydrocarbon (PAH) Mixtures in Environmental Samples; Environmental Health Division, Environmental Surveillance and Assessment Section, Minnesota Department of Health: St. Paul, MN, USA, 2016. [Google Scholar]
  32. Zhang, L.; Morisaki, H.; Wei, Y.; Li, Z.; Yang, L.; Zhou, Q.; Zhang, X.; Xing, W.; Hu, M.; Shima, M.; et al. Characteristics of Air Pollutants inside and Outside a Primary School Classroom in Beijing and Respiratory Health Impact on Children. Environ. Pollut. 2019, 255, 113147. [Google Scholar] [CrossRef]
  33. Brune, H.; Deutsch-Wenzel, R.P.; Habs, M.; Ivankovic, S.; Schmähl, D. Investigation of the tumorigenic response to benzo(a)pyrene in aqueous caffeine solution applied orally to Sprague-Dawley rats. J. Cancer Res. Clin. Oncol. 1981, 102, 153–157. [Google Scholar] [CrossRef]
  34. Nisbet, I.C.; LaGoy, P.K. Toxic equivalency factors (TEFs) for polycyclic aromatic hydrocarbons (PAHs). Regul. Toxicol. Pharmacol. 1992, 16, 290–300. [Google Scholar] [CrossRef]
  35. Hayakawa, K.; Tang, N.; Nagato, E.; Toriba, A.; Lin, J.-M.; Zhao, L.; Zhou, Z.; Qing, W.; Yang, X.; Mishukov, V.; et al. Long-Term Trends in Urban Atmospheric Polycyclic Aromatic Hydrocarbons and Nitropolycyclic Aromatic Hydrocarbons: China, Russia, and Korea from 1999 to 2014. Int. J. Environ. Res. Public Health 2020, 17, 431. [Google Scholar] [CrossRef]
  36. US EPA. Development of a Relative Potency Factor (RPF) Approach for Polycyclic Aromatic Hydrocarbon (PAH) Mixtures. External Review Draft; Environmental Protection Agency; Integrated Risk Information System: Washington, DC, USA, 2010. [Google Scholar]
  37. Manoli, E.; Kouras, A.; Samara, C. Profile Analysis of Ambient and Source Emitted Particle-Bound Polycyclic Aromatic Hydrocarbons from Three Sites in Northern Greece. Chemosphere 2004, 56, 867–878. [Google Scholar] [CrossRef] [PubMed]
  38. Tobiszewski, M.; Namieśnik, J. PAH Diagnostic Ratios for the Identification of Pollution Emission Sources. Environ. Pollut. 2012, 162, 110–119. [Google Scholar] [CrossRef] [PubMed]
  39. De La Torre-Roche, R.J.; Lee, W.-Y.; Campos-Díaz, S.I. Soil-Borne Polycyclic Aromatic Hydrocarbons in El Paso, Texas: Analysis of a Potential Problem in the United States/Mexico Border Region. J. Hazard. Mater. 2009, 163, 946–958. [Google Scholar] [CrossRef] [PubMed]
  40. Yunker, M.B.; Macdonald, R.W.; Vingarzan, R.; Mitchell, R.H.; Goyette, D.; Sylvestre, S. PAHs in the Fraser River Basin: A Critical Appraisal of PAH Ratios as Indicators of PAH Source and Composition. Org. Geochem. 2002, 33, 489–515. [Google Scholar] [CrossRef]
  41. Tang, N.; Suzuki, G.; Morisaki, H.; Tokuda, T.; Yang, X.; Zhao, L.; Lin, J.; Kameda, T.; Toriba, A.; Hayakawa, K. Atmospheric Behaviors of Particulate-Bound Polycyclic Aromatic Hydrocarbons and Nitropolycyclic Aromatic Hydrocarbons in Beijing, China from 2004 to 2010. Atmos. Environ. 2017, 152, 354–361. [Google Scholar] [CrossRef]
  42. Lee, Y.G.; Ho, C.-H.; Kim, J.-H.; Kim, J. Quiescence of Asian Dust Events in South Korea and Japan during 2012 Spring: Dust Outbreaks and Transports. Atmos. Environ. 2015, 114, 92–101. [Google Scholar] [CrossRef]
  43. Han, Y.; Wang, T.; Tang, J.; Wang, C.; Jian, B.; Huang, Z.; Huang, J. New Insights into the Asian Dust Cycle Derived from CALIPSO Lidar Measurements. Remote Sens. Environ. 2022, 272, 112906. [Google Scholar] [CrossRef]
  44. Han, Z.; Ueda, H.; Matsuda, K.; Zhang, R.; Arao, K.; Kanai, Y.; Hasome, H. Model Study on Particle Size Segregation and Deposition during Asian Dust Events in March 2002. J. Geophys. Res. D Atmos. 2004, 109, 1–22. [Google Scholar] [CrossRef]
  45. Ji, Y.; Chen, X.; Li, Y.; Zhang, W.; Shi, Q.; Chen, J.; Gao, Y.; Li, G.; Wang, J.; Tian, P.; et al. The Mixing State of Mineral Dusts with Typical Anthropogenic Pollutants: A Mechanism Study. Atmos. Environ. 2019, 209, 192–200. [Google Scholar] [CrossRef]
  46. Cochran, R.E.; Kubátová, A.; Kozliak, E.I. An Approach to the Estimation of Adsorption Enthalpies of Polycyclic Aromatic Hydrocarbons on Particle Surfaces. J. Phys. Chem. A 2016, 120, 6029–6038. [Google Scholar] [CrossRef] [PubMed]
  47. Joshi, N.; Romanias, M.N.; Riffault, V.; Thevenet, F. Investigating Water Adsorption onto Natural Mineral Dust Particles: Linking DRIFTS Experiments and BET Theory. Aeolian Res. 2017, 27, 35–45. [Google Scholar] [CrossRef]
  48. Zeineddine, M.N.; Romanias, M.N.; Riffault, V.; Thévenet, F. Heterogeneous Interaction of Various Natural Dust Samples with Isopropyl Alcohol as a Probe VOC. J. Phys. Chem. A 2018, 122, 4911–4919. [Google Scholar] [CrossRef] [PubMed]
  49. Tamamura, S.; Sato, T.; Ota, Y.; Wang, X.; Tang, N.; Hayakawa, K. Long-Range Transport of Polycyclic Aromatic Hydrocarbons (PAHs) from the Eastern Asian Continent to Kanazawa, Japan with Asian Dust. Atmos. Environ. 2007, 41, 2580–2593. [Google Scholar] [CrossRef]
  50. Air Quality Standards. European Commission. Available online: https://ec.europa.eu/environment/air/quality/standards.htm (accessed on 30 March 2023).
  51. World Health Organization. The World Health Report 2000: Health Systems: Improving Performance; World Health Organization: Geneva, Switzerland, 2000; ISBN 92-4-156198-X. [Google Scholar]
  52. US EPA (United States of Environmental Protection Agency). Risk Assessment Guidance for Superfund. In Human Health Evaluation Manual (Part B, Development of Risk-Based Preliminary Remediation Goals); EPA/540/R-92/003; USA Office of Emerage and Remedial Response: Washington, DC, USA, 1991; Volume 1. [Google Scholar]
Figure 1. Location of Kanazawa University Wajima Air Monitoring Station (KUWAMS; 37.4 °N, 136.9 °E) and Toyama Light Detection and Ranging Observatory (TLO; 36.70 °N, 137.10 °E) (Used by permission. Google map: https://www.google.com/maps (accessed on 21 March 2023)). The yellow circle represents for the Gobi Desert region.
Atmosphere 14 01519 g001
Figure 2. The frequency of AD in KUWAMS during the East Asian winter monsoon periods from 2010 to 2021.
Atmosphere 14 01519 g002
Figure 3. Cluster-mean backward trajectory analysis at KUWAMS over 1500 m during AD events from 2010 to 2020. The different colors represent different transport pathways. The red line, blue line, and green line represented the AD-high events (Category 1), AD-low events (Category 2), and local effects, respectively (Category 3). The yellow part represents the source region of each air mass category.
Atmosphere 14 01519 g003
Figure 4. Concentration variations of TSPs in different types of AD events during long-term observations from 2010 to 2021. The blue dots represent outliers, which are values greater than the 75th percentile plus interquartile range, and the cross represents the average value.
Atmosphere 14 01519 g004
Figure 5. Variation of PAHs (a) concentration and (b) composition in different types of AD events during long-term observations from 2010 to 2021. (The blue dots represent outliers, which are values greater than the 75th percentile plus interquartile range, and the cross represents the average value).
Atmosphere 14 01519 g005
Figure 6. Diagnostic ratios of PAHs in different types of AD events during long-term observations from 2010 to 2021.
Atmosphere 14 01519 g006
Figure 7. BaPeq concentration (a) and inhalation lifetime cancer risk values (b) in different types of AD events during long-term observations from 2010 to 2021. (The blue dots represent outliers, which are values greater than the 75th percentile plus interquartile range, and the cross represents the average value).
Atmosphere 14 01519 g007
Table 1. Diagnostic ratios of PAHs.
Diagnostic RatioValue RangeSource
[Flu]/([Flu] + [Pyr])0.4–0.5Gasoline combustion [39]
>0.5Wood and coal combustion [40]
[BaA]/([BaA] + [Chr])0.2–0.35Coal combustion [38,40]
>0.35Traffic emission [38,40]
[IDP]/([IDP] + [BgPe])0.2–0.5Traffic emission [38,40]
>0.5Coal combustion [38,40]
[BbF]/([BbF] + [BkF])0.7–0.76Coal combustion [41]
Disclaimer/Publisher’s Note: The statements, opinions and data contained in all publications are solely those of the individual author(s) and contributor(s) and not of MDPI and/or the editor(s). MDPI and/or the editor(s) disclaim responsibility for any injury to people or property resulting from any ideas, methods, instructions or products referred to in the content.

