Article

Forecast and Analysis of a Rainstorm Case in East China Based on the Blown-Up Theory

1
Key Laboratory of Meteorological Disaster, Ministry of Education (KLME)/Joint International Research Laboratory of Climate and Environment Change (ILCEC)/Collaborative Innovation Center on Forecast and Evaluation of Meteorological Disasters (CIC-FEMD), Nanjing University of Information Science & Technology, Nanjing 210044, China
2
State Key Laboratory of Numerical Modeling for Atmospheric Sciences and Geophysical Fluid Dynamics (LASG), Institute of Atmospheric Physics (IAP), Chinese Academy of Sciences (CAS), Beijing 100029, China
3
China Meteorological Administration Radar Meteorology Key Laboratory, Nanjing 210000, China
*
Author to whom correspondence should be addressed.
Atmosphere 2023, 14(10), 1508; https://doi.org/10.3390/atmos14101508
Submission received: 21 August 2023 / Revised: 25 September 2023 / Accepted: 26 September 2023 / Published: 29 September 2023
(This article belongs to the Section Meteorology)

Abstract

:
Practical application has shown that the blown-up theory has great predictive ability for predicting transitional weather systems, especially catastrophic weather systems. This study applies the blown-up theory to analyze and predict a rainstorm case in Jiangsu Province of East China to explore the applicability of the blown-up theory. At the same time, a numerical simulation experiment is conducted using the Weather Research and Forecasting Model (WRF) v4.2. The numerical results are compared with the European Center for Medium Weather Forecasting (ECMWF) Reanalysis v5 (ERA5) data and the China Meteorological Administration (CMA) Land Data Assimilation System (CLDAS) products. It is found that there is a deviation in the simulation for the precipitation center, and further analysis indicates that it is likely related to the position of the simulated low-level shear line. On the other hand, the blown-up analyses are consistent with the actual situation and provide additional information besides the numerical simulation results. These results indicate that the blown-up charts and V-3θ diagrams are able to predict the weather system transformation, the rainfall area, and the evolution of the rainstorm, which confirms the applicability of the blown-up theory to rainstorm forecasts. This provides an auxiliary analysis method in addition to numerical simulations for rainstorm forecasts.

1. Introduction

Rainstorm is a kind of disastrous weather that occurs frequently in summer in Jiangsu Province of East China. The rainstorm process, together with thunderstorms, hail, and other catastrophic weather events, poses a threat to the safety of people and leads to great economic losses. For this reason, researchers have applied different methods to carry out research and have obtained lots of achievements. In recent studies, Zhuang et al. [1] applied a spatial-based method for the predictions of heavy rainfall events in East China based on WRF-EnKF convective-scale ensemble forecasts (CSEFs). A sudden rainstorm in Southern China was analyzed by Zhang et al. [2], which was associated with double low-level jets. In other countries, Ito et al. [3] generated a high-resolution simulation to predict a back-building convective system that broke the precipitation record in Kyushu Island, Japan. The Weather Research and Forecasting (WRF) Model was used by Huva et al. [4] to predict heavy rainfall over Singapore. In addition, different performances were also explored with the horizontal resolutions of 1 km and 12 km.
Ouyang Shoucheng [5,6,7,8], after years of research, proposed the blown-up theory for predicting climatic transitions. Based on this theoretical concept, the forecasting tools of blown-up charts and V-3θ diagrams have been summarized in previous studies, with promising results achieved. Currently, meteorologists have analyzed rainstorms based on the blown-up theory in numerous places in China. Peng et al. [9] analyzed two rainstorm processes in Hubei Province in 1997, and concluded that the blown-up theory can be used for the prediction of larger-scale rainstorms. Based on a rainstorm in Shandong Province, Zhang et al. [10] found that the blown-up chart has obvious indicative information on not only the occurrence time of the rainstorm, but also the maintenance time. In China’s other provinces, such as Guangdong [11], Xinjiang [12], Sichuan [13], Yunnan [14], Gansu [15], Beijing, and Tianjin [16], scholars and meteorological station staffs have studied the application of the blown-up theory for rainstorm forecasting. In addition to the prediction of rainstorms, it has been proven that the blown-up theory also has certain prediction ability for other catastrophic weather systems. It has been shown by Chen et al. [17,18] that the blown-up theory is able to predict local thunderstorms within half an hour, predict the distribution and magnitude of regional fog, and clearly distinguish the type of fog. Wang et al. [19] found that in arid and semi-arid regions, the forecasting tools based on the blown-up theory have certain accuracy in predicting hailstorms. In Hao et al. [20], the blown-up theory was also used for the prediction of high-temperature weather cases. Similarly, V-3θ diagrams were applied by Peng et al. [21] to predict the transitive changes of windy and dusty weather. In addition, Du et al. [22] applied the blown-up theory and summarized the structural prediction method for the moving trend of the western Pacific subtropical high.
In terms of numerical prediction of rainfall systems in East China, Cao et al. [23] investigated the impact of diverse schemes on the simulation of a bow-shaped squall line case in East China. Zhuge et al. [24] conducted a simulation study of a heavy rainfall case in the Lixiahe area of Jiangsu Province, and analyzed the effects of different microphysical process schemes on the quantitative characteristics, as well as the spatial and temporal distributions, of the simulated precipitation. Ma et al. [25] simulated a summer rainstorm case in Nanjing City of Jiangsu Province and analyzed the effect of changes in the concentration of cloud condensation nuclei on the accumulated precipitation.
In view of the above progress, weather applications based on the blown-up theory have been analyzed by meteorologists, but less research has been conducted with the collaboration of numerical model simulations. In this study, a rainstorm process on 15 August 2022 in Jiangsu Province of East China was simulated using WRF v4.2. The blown-up theory was further applied to forecast and analyze the rainstorm process. This will provide further insights into the study of the blown-up theory as an auxiliary tool for heavy rain forecasting.
The rest of this paper is organized as follows: In Section 2, a description of the observation data and a brief introduction of the blown-up theory are provided. An overview of the rainstorm case and WRF model configurations are described in Section 3. Section 4 presents the simulation results and analyses based on the blown-up theory. The conclusions and discussion are given in Section 5.

2. Materials and Methods

2.1. ERA5 Data and CLDAS Precipitation Product

The European Center for Medium Weather Forecasting (ECMWF) Reanalysis v5 (ERA5) [26] (https://www.ecmwf.int/en/forecasts/dataset/ecmwf-reanalysis-v5, accessed on 14 August 2023) is the fifth-generation ECMWF reanalysis of global climate and weather in the past 8 decades. It provides hourly estimates for a large number of atmospheric, ocean-wave, and land-surface quantities. ERA5 hourly reanalysis data with a spatial precision of 0.25° × 0.25° were selected for this study.
The China Meteorological Administration (CMA) Land Data Assimilation System (CLDAS) v2.0 product (http://data.cma.cn/data/cdcdetail/dataCode/NAFP_CLDAS2.0_RT.html, accessed on 14 August 2023) is a grid fusion analysis product using multiple sources of ground and satellite observations. The techniques include multiple grid variational assimilation called Space and Time Mesoscale Analysis System (STMAS), cumulative distribution function (CDF) matching, optimal interpolation (OI), physical inversion, and terrain correction. Compared to other similar products in the international and domestic markets, it is of higher quality in the Chinese region. In this study, CLDAS hourly precipitation product was used as the observation of accumulated precipitation with a resolution of 0.0625° × 0.0625°.

2.2. The Blown-Up Theory

Traditional meteorological forecasts are based on the driving force of barometric gradient forces, with pressure, temperature, humidity, and wind as the information sequence. Among them, pressure is usually identified as the core. However, in practical applications, the values of the obtained air pressure field (or the height field) are statically corrected, and atmospheric density cannot be observed, making the available pressure information lagging. The actual important weather often occurs before the air pressure system, which is not conducive to predicting the evolution of transitional weather systems. For this reason, the blown-up theory changes the traditional information sequence and forms a reverse-order structure centered on wind and humidity, which includes the information sequence of wind direction, wind speed, humidity, temperature, and pressure [6].
Two other important concepts in the blown-up theory are ultra-low temperature and tumble flow. Ultra-low temperature is a phenomenon in which there is a steep decrease in temperature in the upper troposphere from 300 to 100 hPa. One explanation given by Ouyang Shoucheng [5] is that water molecules dissociate under the action of ultraviolet radiation and form a plasma state. The corresponding chemical reaction formula is as follows:
4 H 2 O u l t r a v i o l e t   r a d i a t i o n 4 O H + 4 H
The reaction described in Formula (1) is a heat-absorbing reaction, which generally reduces the temperature by 15 to 25 degrees centigrade. The steep drop in temperature in the upper troposphere results in increased condensation of rising water vapor, which causes severe weather such as strong convection and heavy rainfall systems. Irregular information, such as ultra-low temperature, constitutes the non-uniformity of the vertical structure of the atmosphere, which triggers atmospheric transformation and stimulates and guides the occurrence of weather phenomena and convective cloud movement. However, the frequency of ultra-low-temperature phenomena is high, which is not the most important factor in the occurrence of heavy rain and other weather events. Therefore, it is necessary to combine other thermal and dynamical conditions to predict rainfall. In addition, the ultra-low-temperature concept can be correlated with storm overshooting tops since more water molecules are used to explain the ultra-low temperature in Equation (1).
Tumble flow is a traditional concept that is widely applied in hydrology. This concept of tumble flow is consistent with the vertical vortex, which represents the horizontal vorticity in meteorology. It has been proven that the tumble flow in the atmosphere plays an important role in the weather evolution of turning changes. For the Northern Hemisphere, clockwise tumbling represents a turning change from clear-sky weather to severe weather systems, with clouds, precipitation, and gusty winds. In contrast, with anticlockwise tumbling, severe weather will be converted to clear-sky weather. Based on the concept of the blown-up theory, the forecasting tools that are currently widely applied are the blown-up chart and the V-3θ diagram.

2.2.1. Blown-Up Charts

According to the tumbling effect, the blown-up chart is coupled with the process of synoptic analysis, which is mainly used to predict the turning changes of a weather system. For this purpose, Ouyang Shoucheng [6] designed two parameters as follows:
C i * = V ¯ u p p e r V ¯ l o w e r
C p * = Δ q Δ θ = q ¯ u p p e r q ¯ l o w e r θ ¯ u p p e r θ ¯ l o w e r
The overbar “-” on the top of eachvariable represents the averaged meteorological variables in the vertical direction. The subscripts “upper” and “lower” represent meteorological variables on the upper and lower levels according to the discontinuity of wind in the vertical direction. It should be noted that V is the wind speed considering only the meridional direction, and q is the specific humidity, while θ represents the potential temperature.
The zone with negative C i * values in a blown-up chart is the clockwise tumbling area, and on the contrary, the zone with positive values stands for the anticlockwise tumbling area. Additionally, the vicinity of the C i * zero value contour is the area prone to precipitation, strong wind, and other severe weather [2]. For a C p * value, it represents the degree of uniformity of humidity, temperature, and pressure structure from the surface to the upper air layers. Because q ¯ u p p e r q ¯ l o w e r < 0 and θ ¯ u p p e r θ ¯ l o w e r > 0 in general, C p * values are all negative. The atmospheric elements are uniform in both the upper and lower layers for areas where the absolute value of C p * is small. Conversely, non-uniformity is strong in areas where the absolute value of C p * is large. In most cases, low-value systems are positively matched with negative values of C i * and small absolute values of C p * , while high-value systems present the opposite. If there is a negative match, the system will undergo a change (weakening or shifting) in the next 24–36 h, while a positive match means the weather system is still developing.

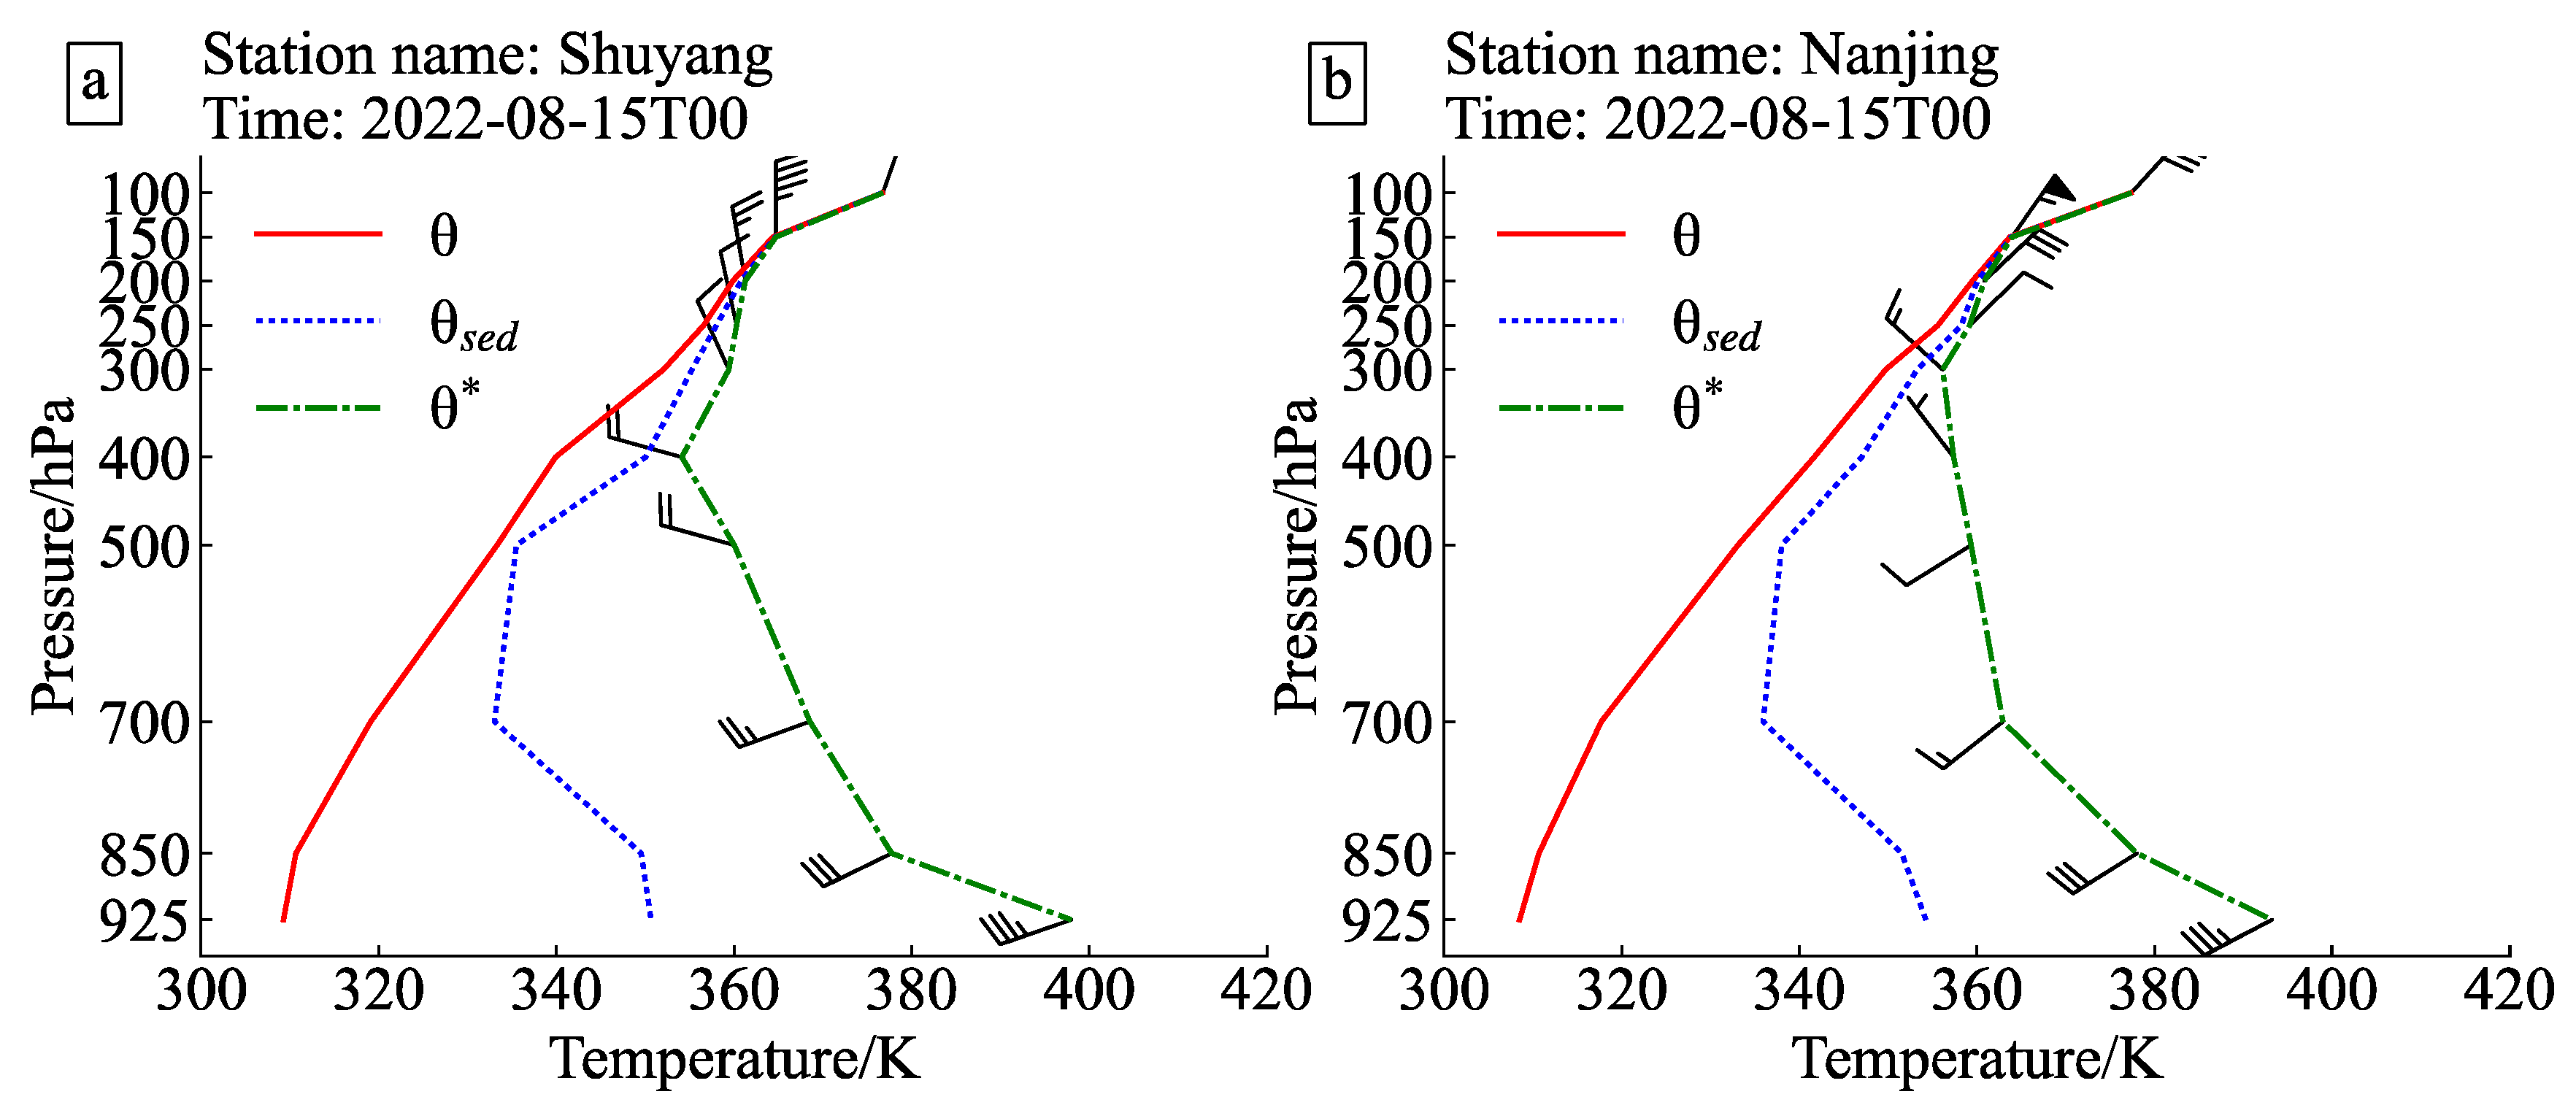
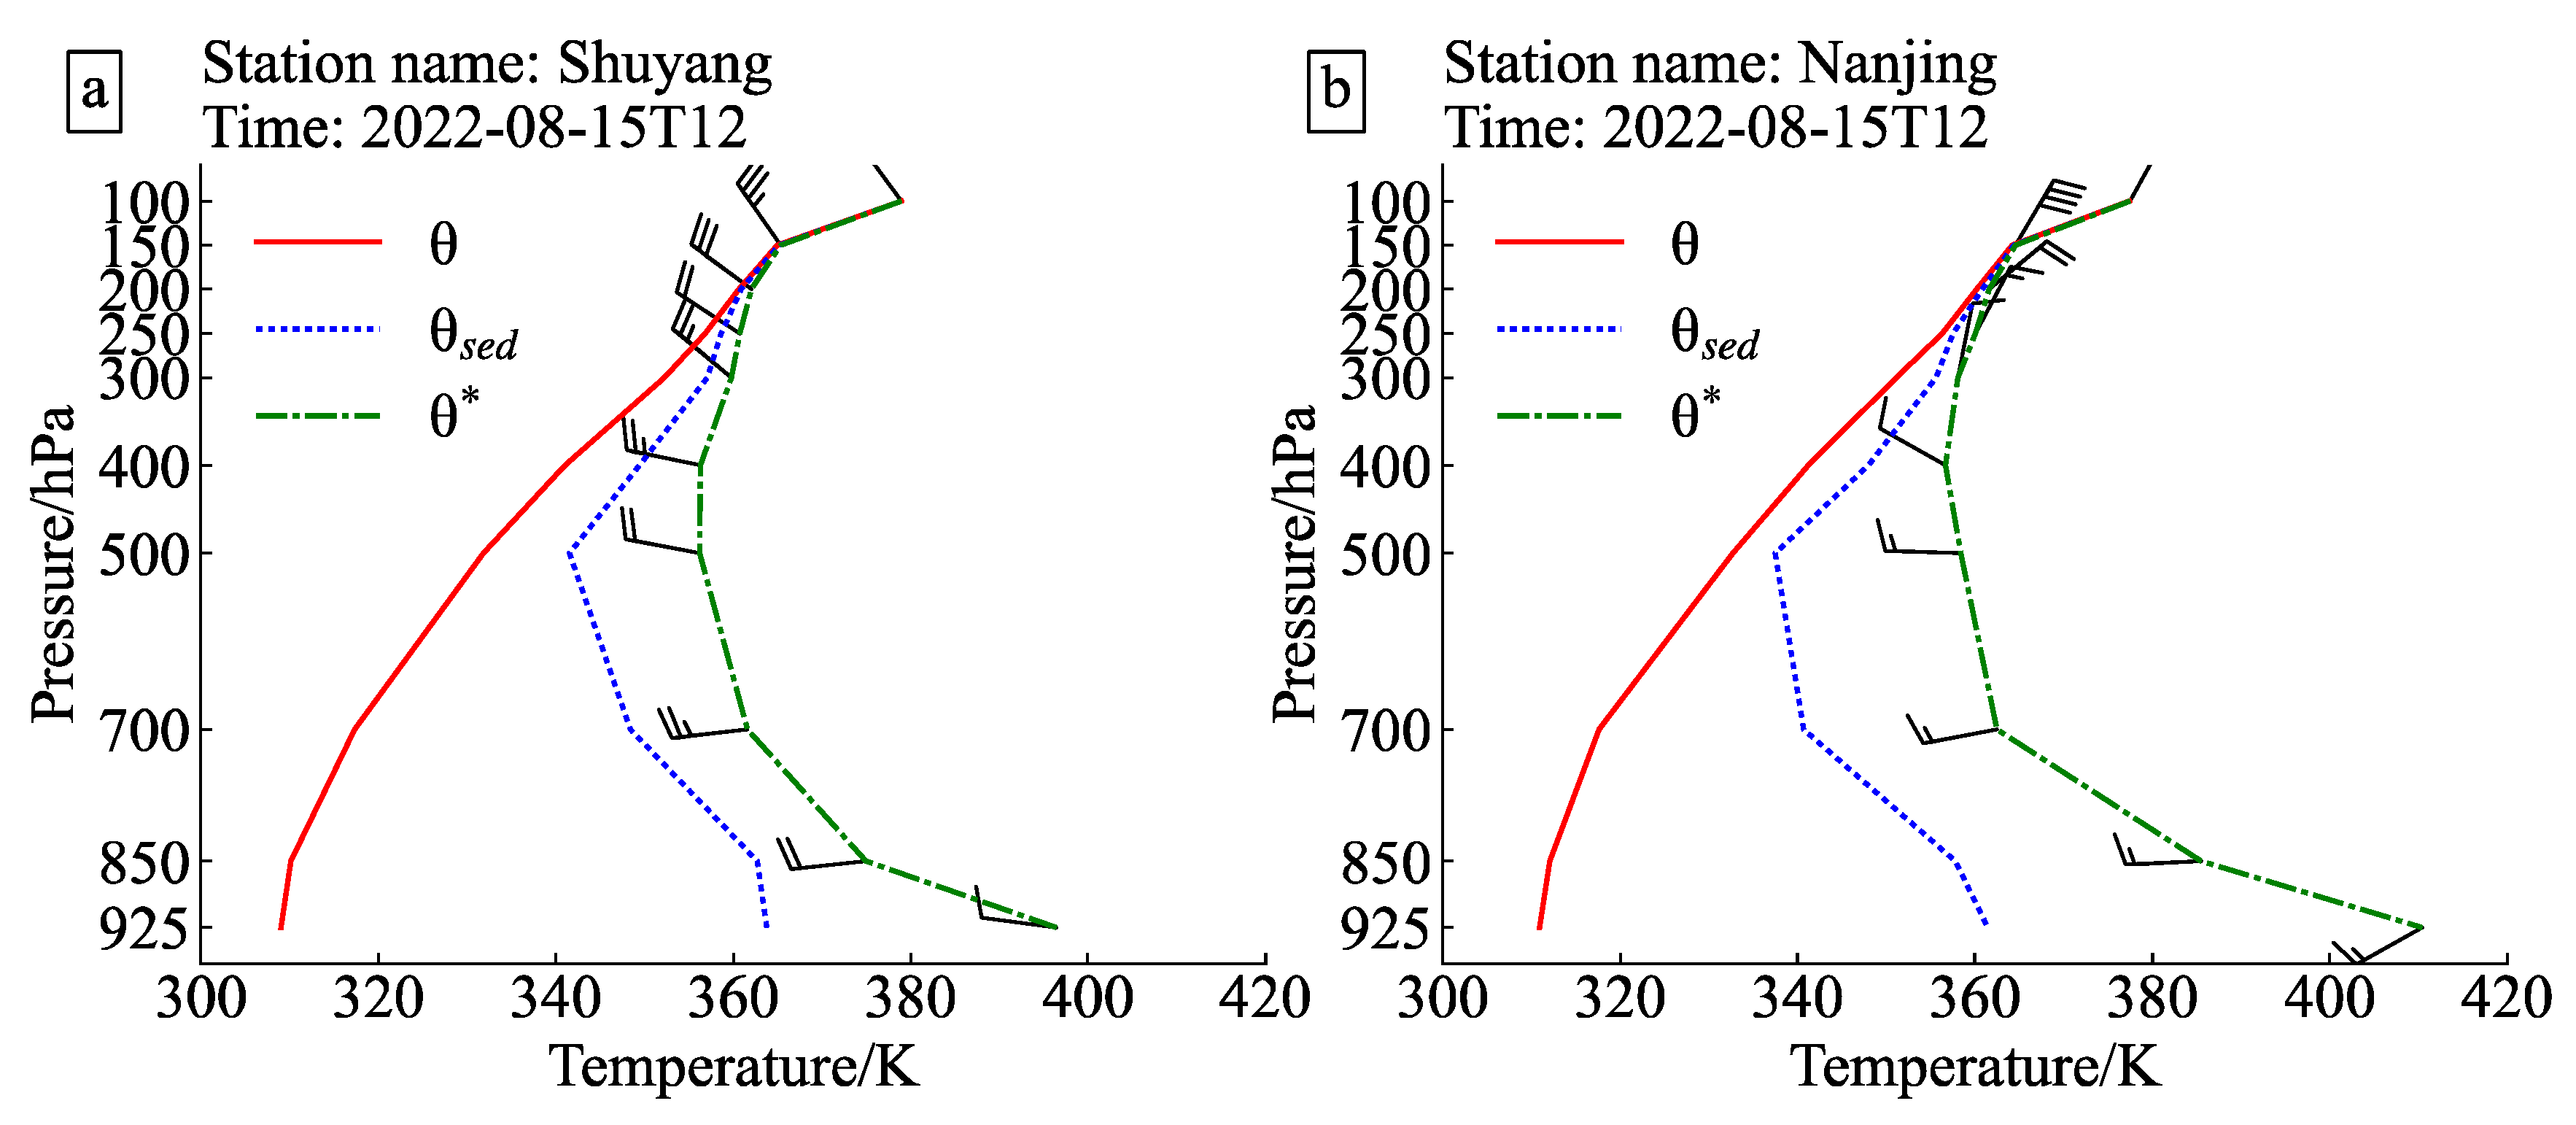
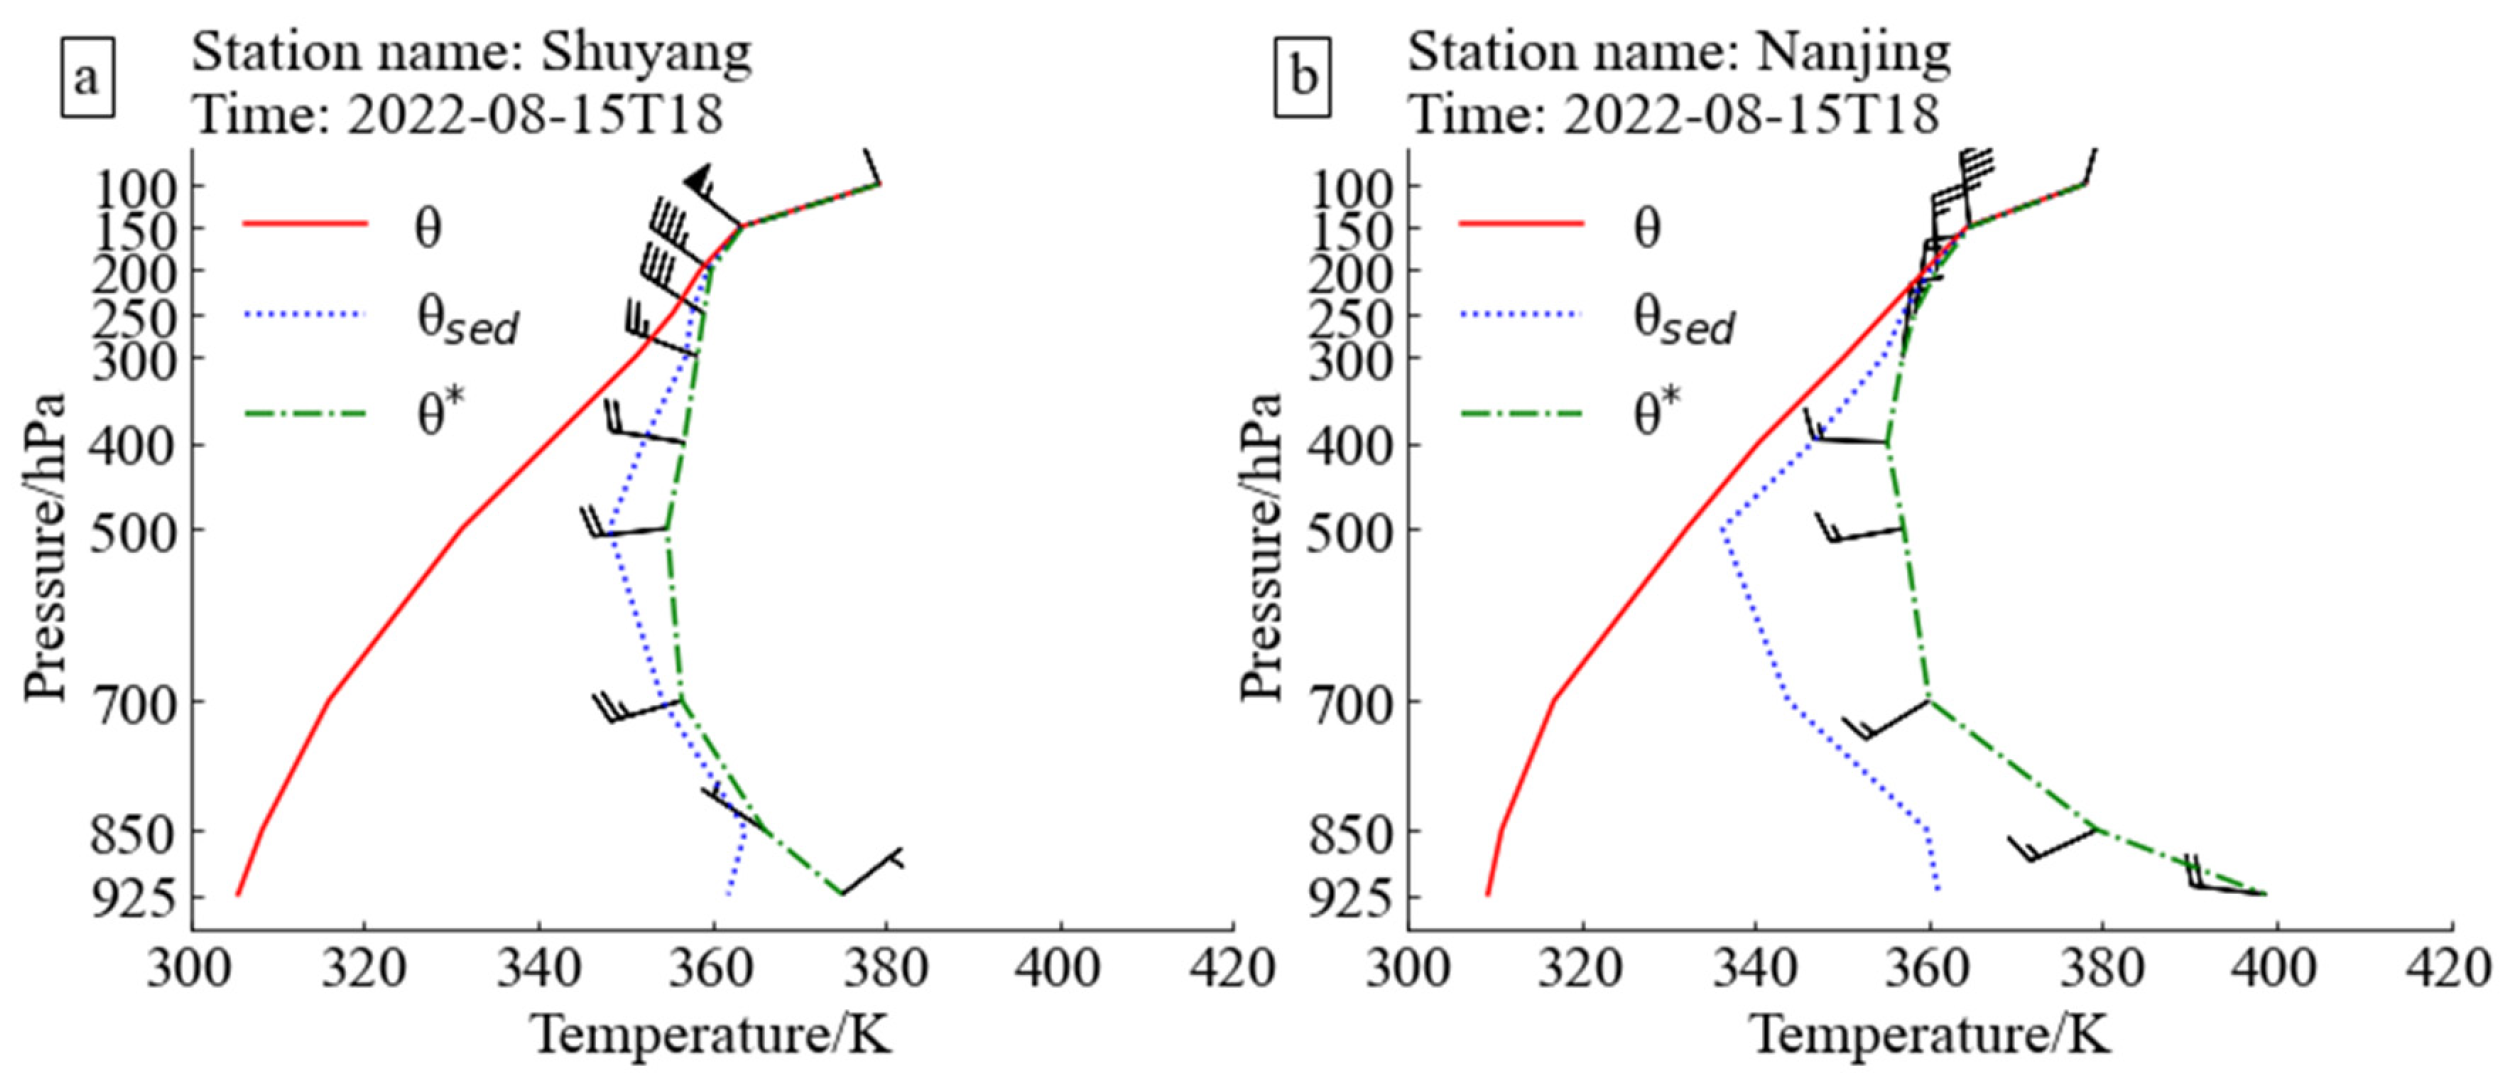
2.2.2. V-3θ Diagrams

Compared to blown-up charts, V-3θ diagrams have a wider range of applications. The function of displaying V-3θ diagrams has been added in the Meteorological Information Combine Analysis and Process System (MICAPS) since version 3.1 [13]. Unlike a T-lnP plot, a V-3θ diagram applies P-T coordinates. V is the wind direction and speed information for each layer without any processing, which is labeled on the θ * line. In addition, 3θ consists of three kinds of variables, including the potential temperature θ, the pseudo-equivalent potential temperature θ s e d calculated based on the dew-point temperature instead of the condensation-level temperature, and the pseudo-equivalent potential temperature θ * in the hypothetical saturated state. The westerly and southerly winds represent clockwise tumbling, and the easterly and northerly winds represent anticlockwise tumbling. The weakening of winds with height implies a shift in the tumble flow. For example, easterly and northerly winds weakening with height indicates a clockwise tumble flow.

3. Overview of the Rainstorm Case and Model Configurations

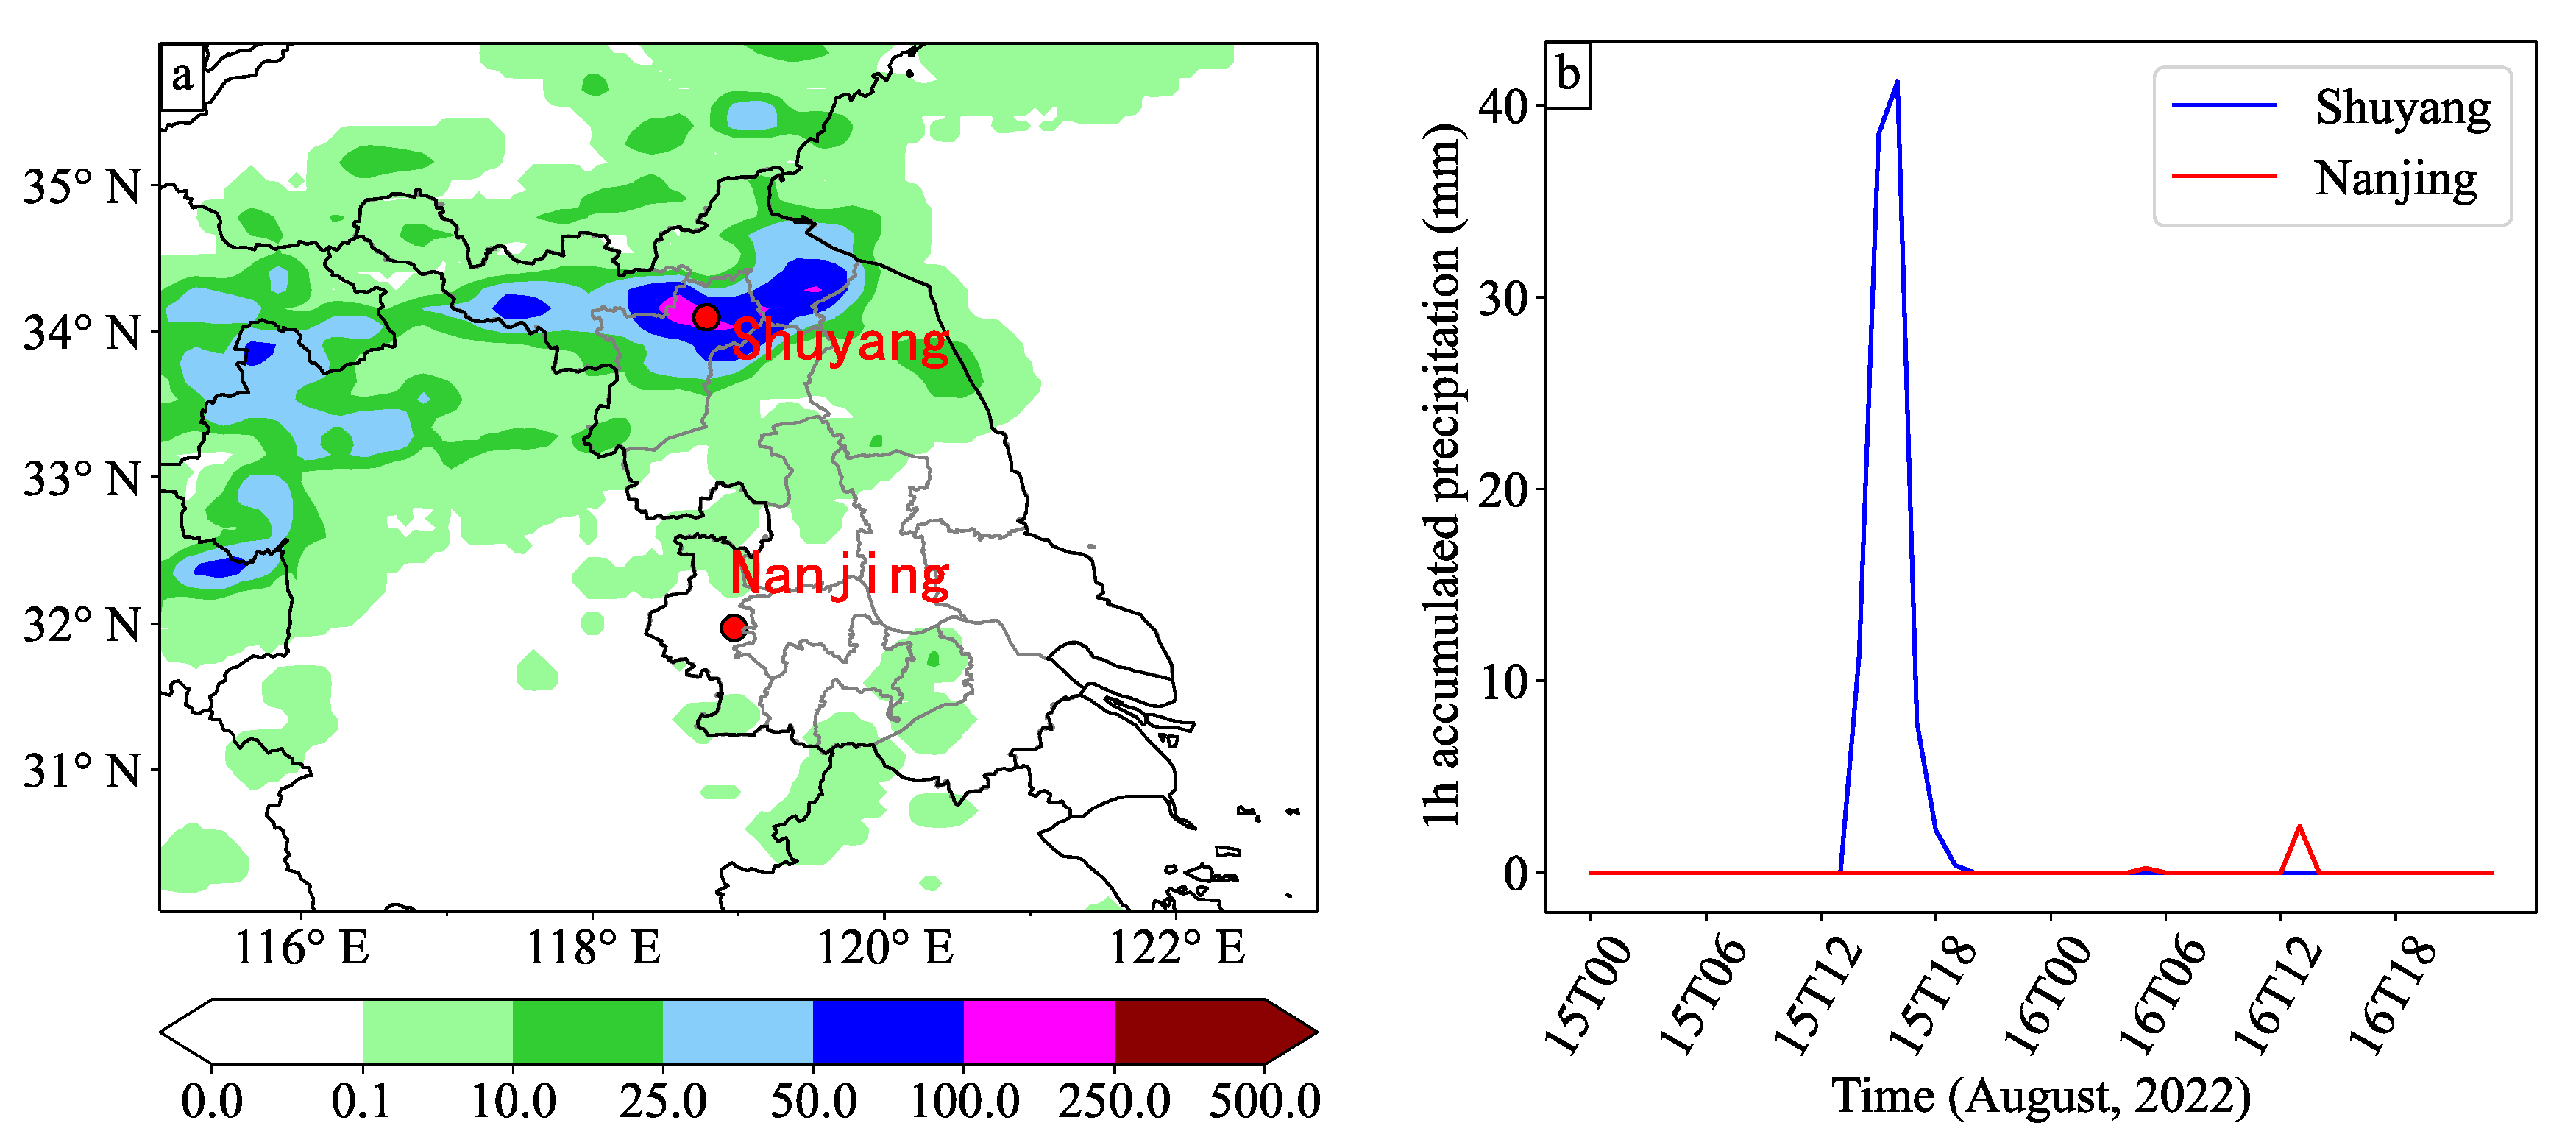
3.1. Overview of the Rainstorm Case

From the night of 15 August 2022 to the day of 16 August 2022, a strong precipitation process from north to south occurred in Jiangsu Province. The generally high temperature decreased by more than 5–10 °C across Jiangsu Province. Figure 1 shows the 24 h accumulated precipitation based on the CLDAS precipitation product from 0000 UTC on 15 August to 0000 UTC on 16 August 2022. In four cities, Suqian, Xuzhou, Lianyungang, and Huaian, the 24 h accumulated precipitation in 82 townships reached 50 mm or more, of which 26 townships received 100 mm or more. The precipitation center was in Shuyang, Suqian, with the 24 h accumulated precipitation amounting to 168.3 mm, which meets the standard for heavy rainfall in China (rainfall between 100.0 and 249.9 mm in 24 h).
As is shown in Figure 2, the weather systems affecting Jiangsu Province were the Northeast China cyclone and the oceanic anticyclone. The upper air was influenced by the upper trough and westerly rapids, while the lower air was influenced by the low-level rapids and shear lines. The oceanic anticyclone caused low-level warm and humid air to converge in Jiangsu, along with the upper trough leading to cold air from north to south, creating ideal dynamic and thermal conditions for the rainstorm.

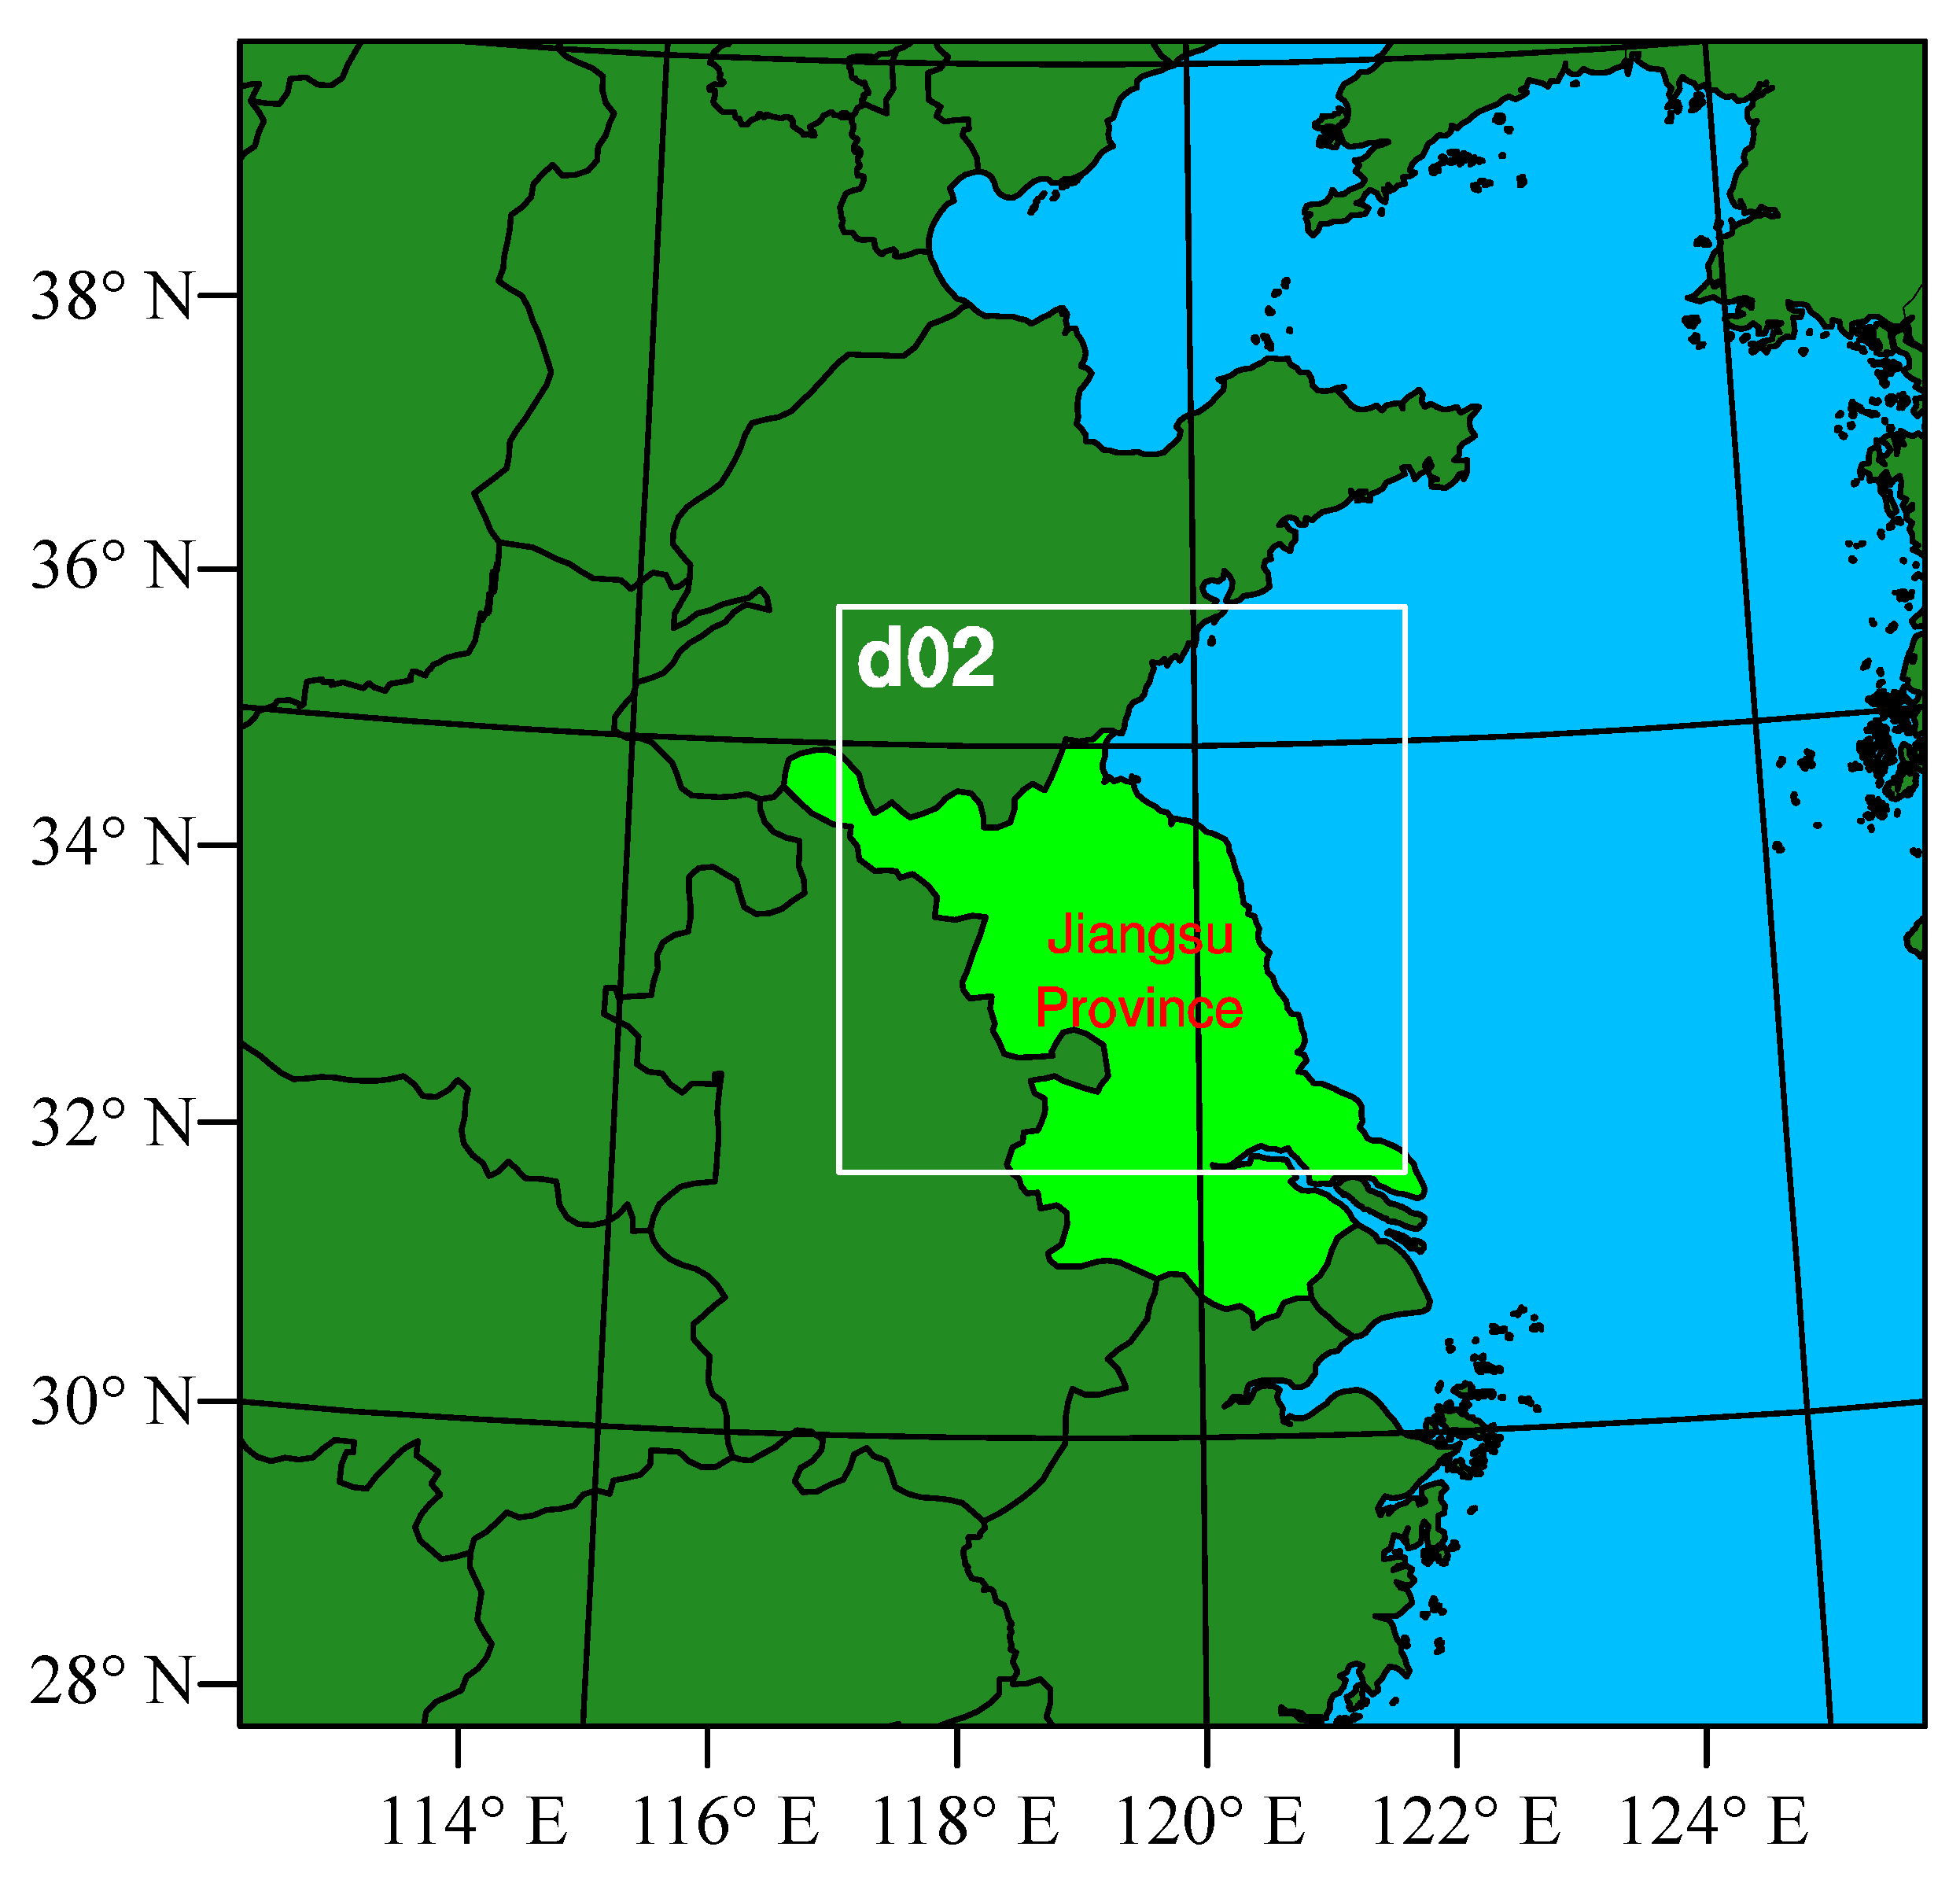
3.2. Model Configurations

Numerical simulations were performed using the WRF v4.2 model for this rainstorm case. The information was obtained from the National Centers for Environmental Prediction (NCEP) Final (FNL) Operational Global Analysis data (https://rda.ucar.edu/datasets/ds083-2/, accessed on 14 August 2023), with a 1° × 1° spatial resolution and a 6-hour interval. The time set was a 24 h integration from 0000 UTC on 15 August to 0000 UTC on 16 August 2022, with a time step of 15 s. The model was double bi-directionally nested, and (34° N, 119° E) was selected as the center of the model area. The vertical stratification was 42 layers, and the layer top height was set to 50 hPa. The grid spacing of the outer coarse grid (d01) was 9 km and the number of grid points was 150 × 150, while the inner fine grid (d02) had a grid spacing of 3 km with 151 × 151 grid points. The model domain is shown in Figure 3.
Taking into consideration several related studies and simulation experiments, the following schemes were selected: WRF Single-Moment 6-class (WSM6) scheme [27] for microphysical processes; Rapid Radiative Transfer Model (RRTM) scheme [28] and Dudhia scheme [29] for longwave and shortwave radiation, respectively; Revised Mesoscale Model version5 (MM5) scheme [30] for the surface layer; unified Noah land-surface model scheme [31] for land surface processes; and Yonsei University (YSU) scheme [32] for the planetary boundary layer. Kain-Fritsch (new Eta) scheme [33] was selected as the cumulus parameterization scheme, which was not used in the second domain since the grid spacing of the inner grid was less than 4 km.

4. Results

4.1. Analysis of Simulation Results

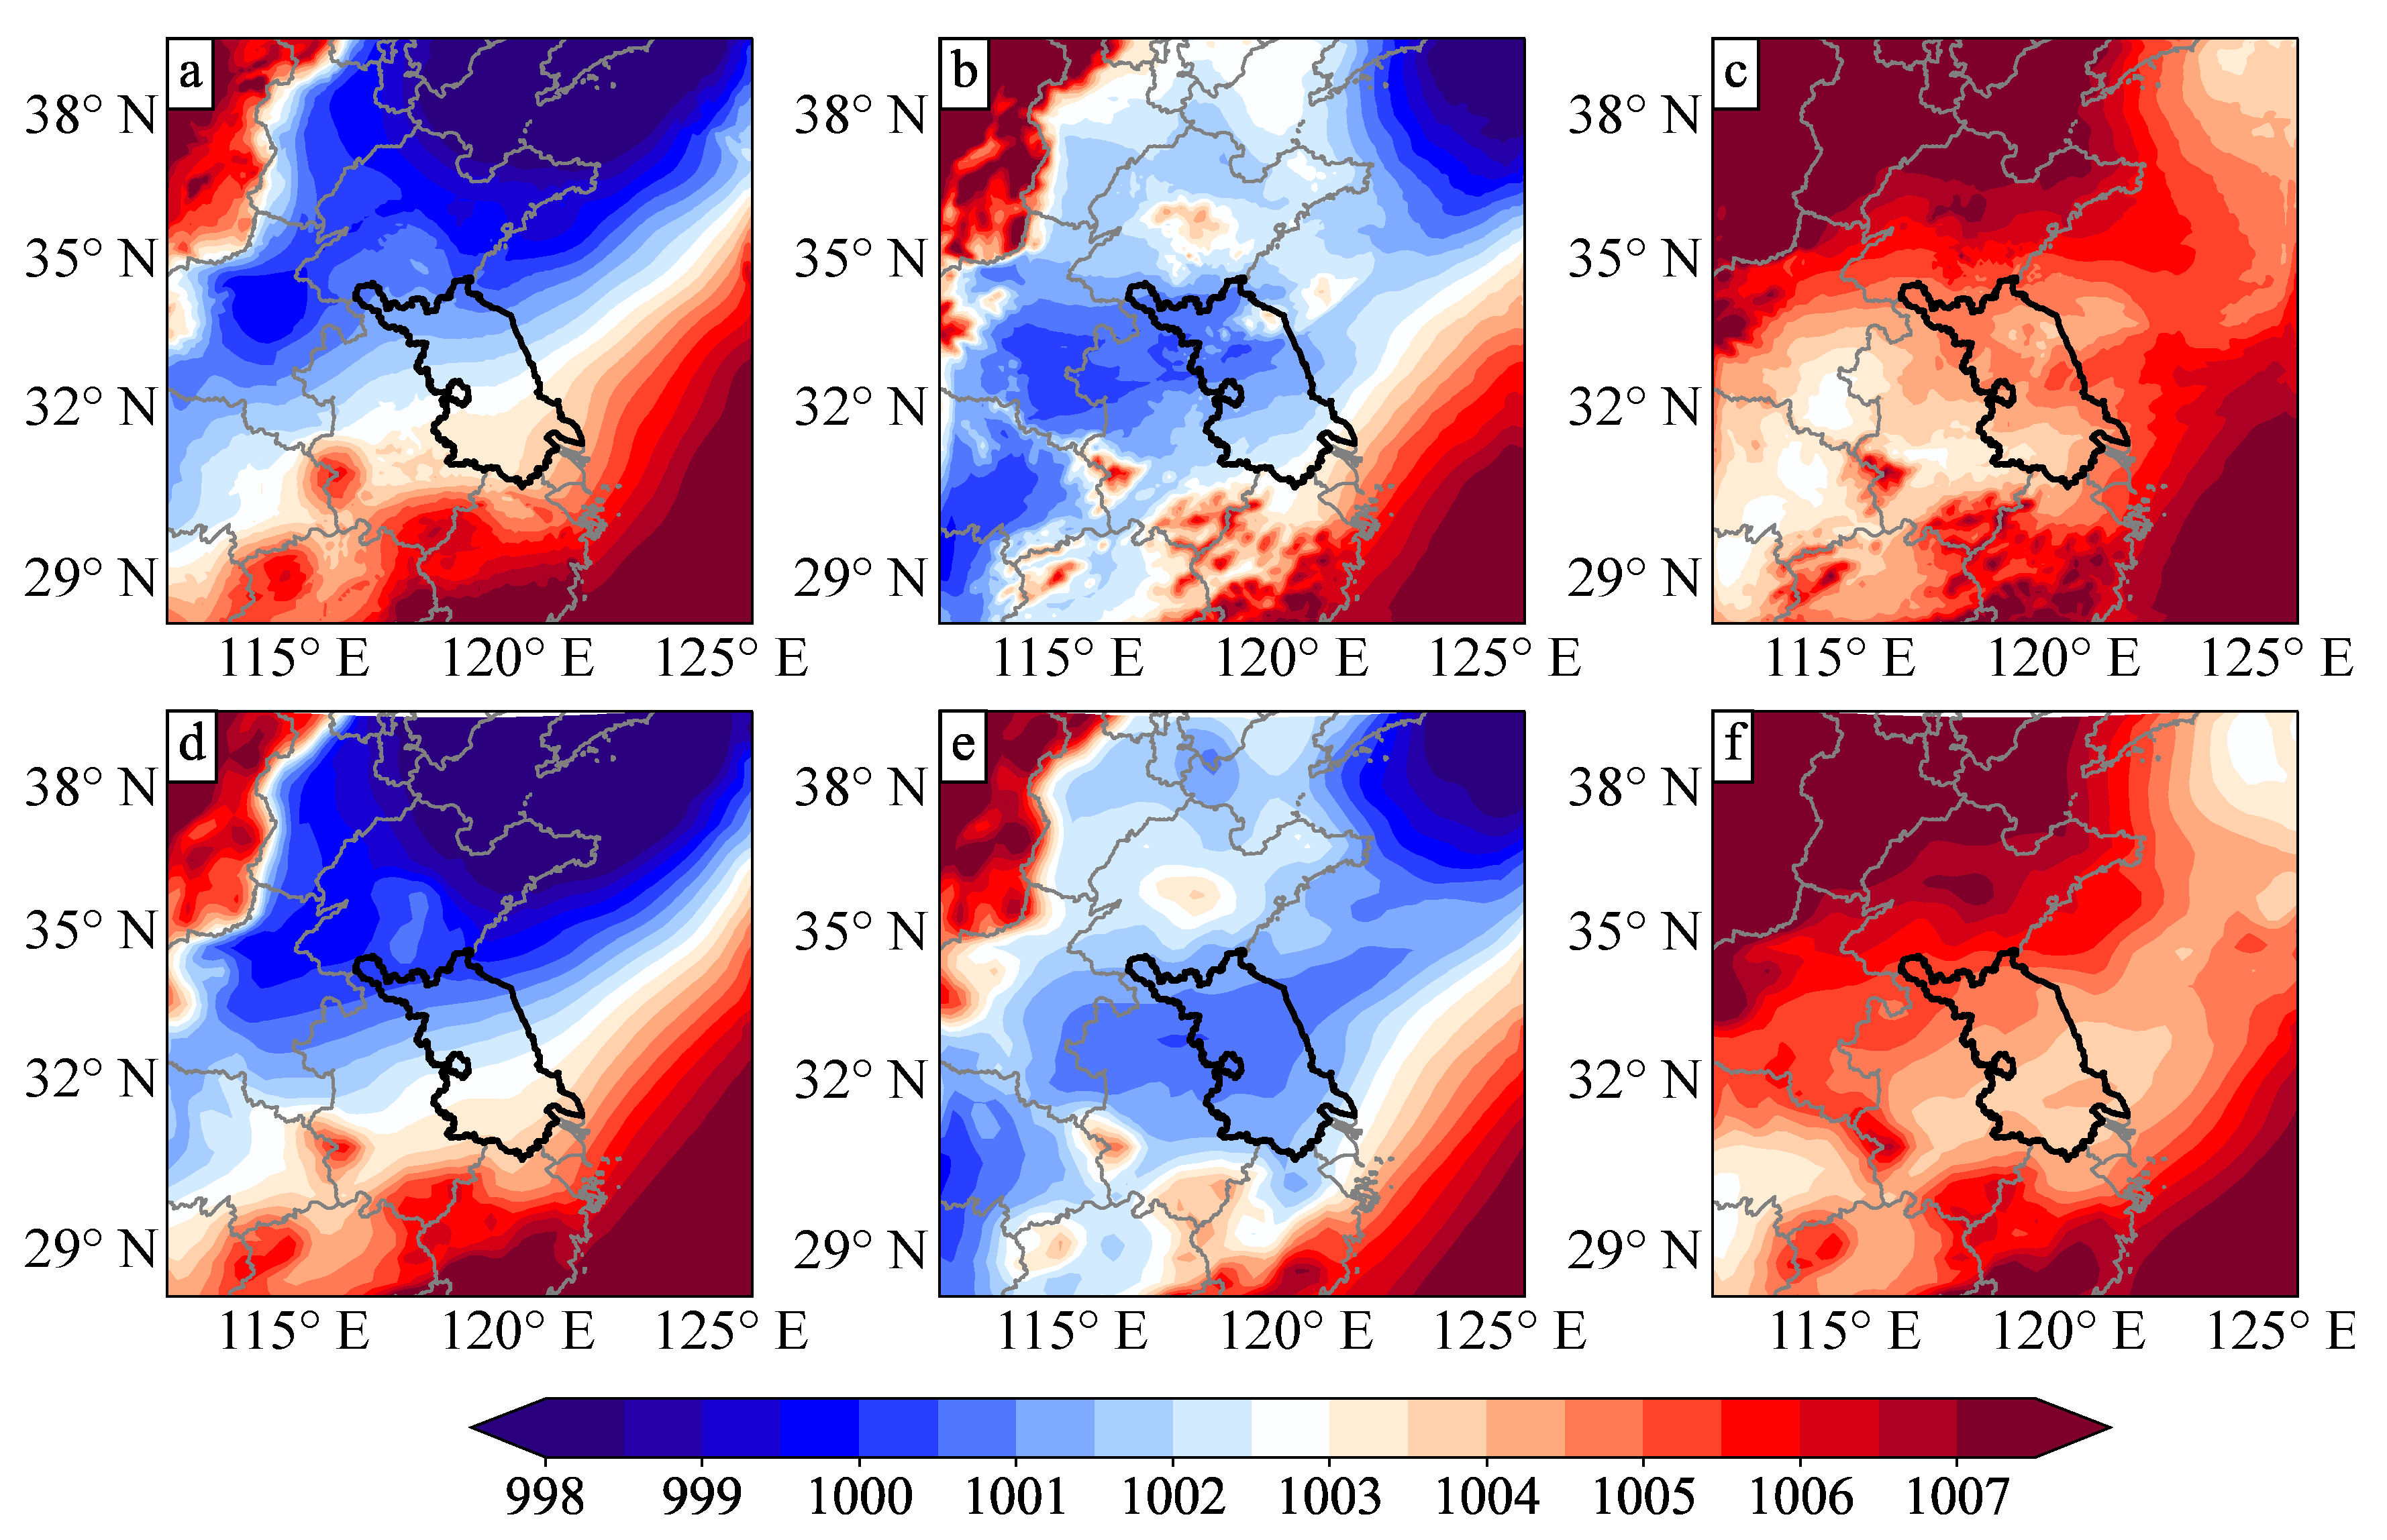
4.1.1. Sea-Level Pressure

To understand the process of this rainstorm from a large-scale perspective, the sea-level pressure is shown in Figure 4. It can be found that the sea-level pressure of the WRF simulation (Figure 4a–c) and the ERA5 reanalysis data (Figure 4d–f) are basically consistent at different times, except for differences in some local areas. It indicates that the WRF simulation for the sea-level pressure is accurate and can be used in rainfall forecast. At 0000 UTC on 15 August 2022 (Figure 4a,d), northern Jiangsu was generally controlled by the low pressure in Northeastern China, which is prone to convective weather systems. The southeast of Jiangsu was controlled by oceanic high pressure, and the range of the Mongolian high pressure extended to the territory of Shanxi Province. At 1200 UTC on 15 August (Figure 4b,e), the low pressure moved eastward, and the Jiangsu area was still under its control. The Mongolian high pressure moved slightly eastward. At 0000 UTC on 16 August (Figure 4c,f), Jiangsu was under the joint control of the eastward-moving Mongolian high pressure and the oceanic high pressure, and the rainstorm process would decay in the future.

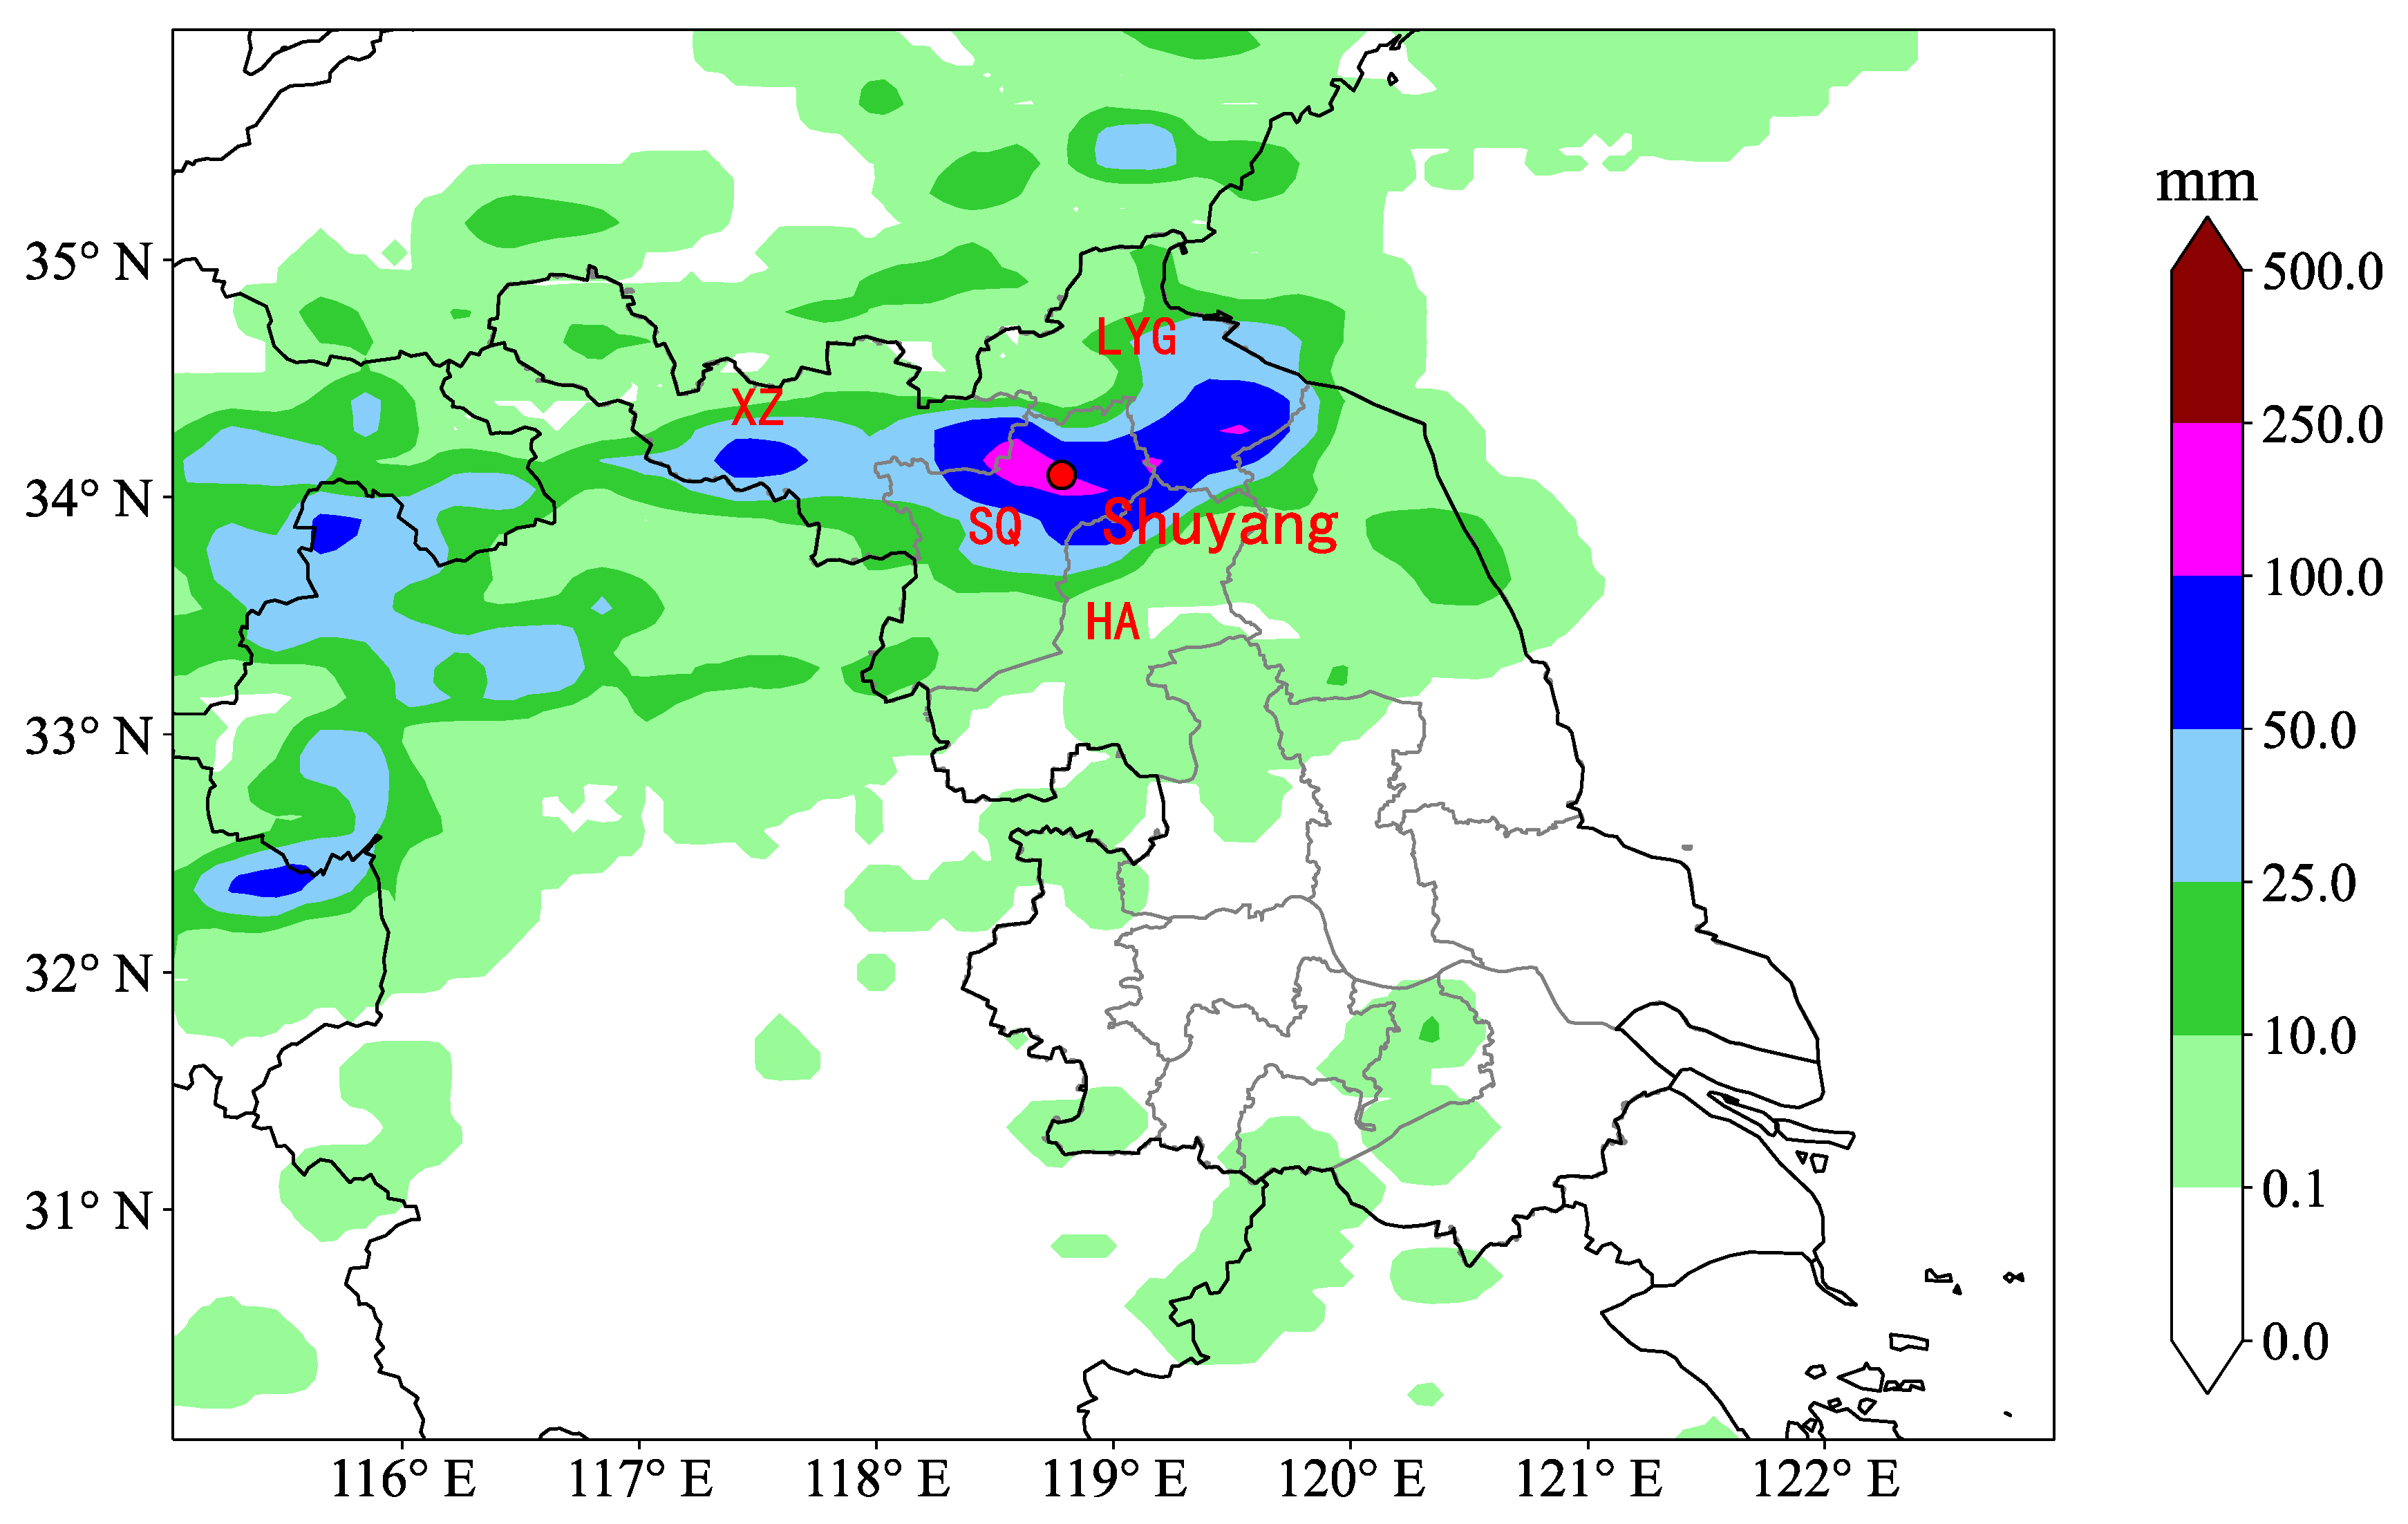
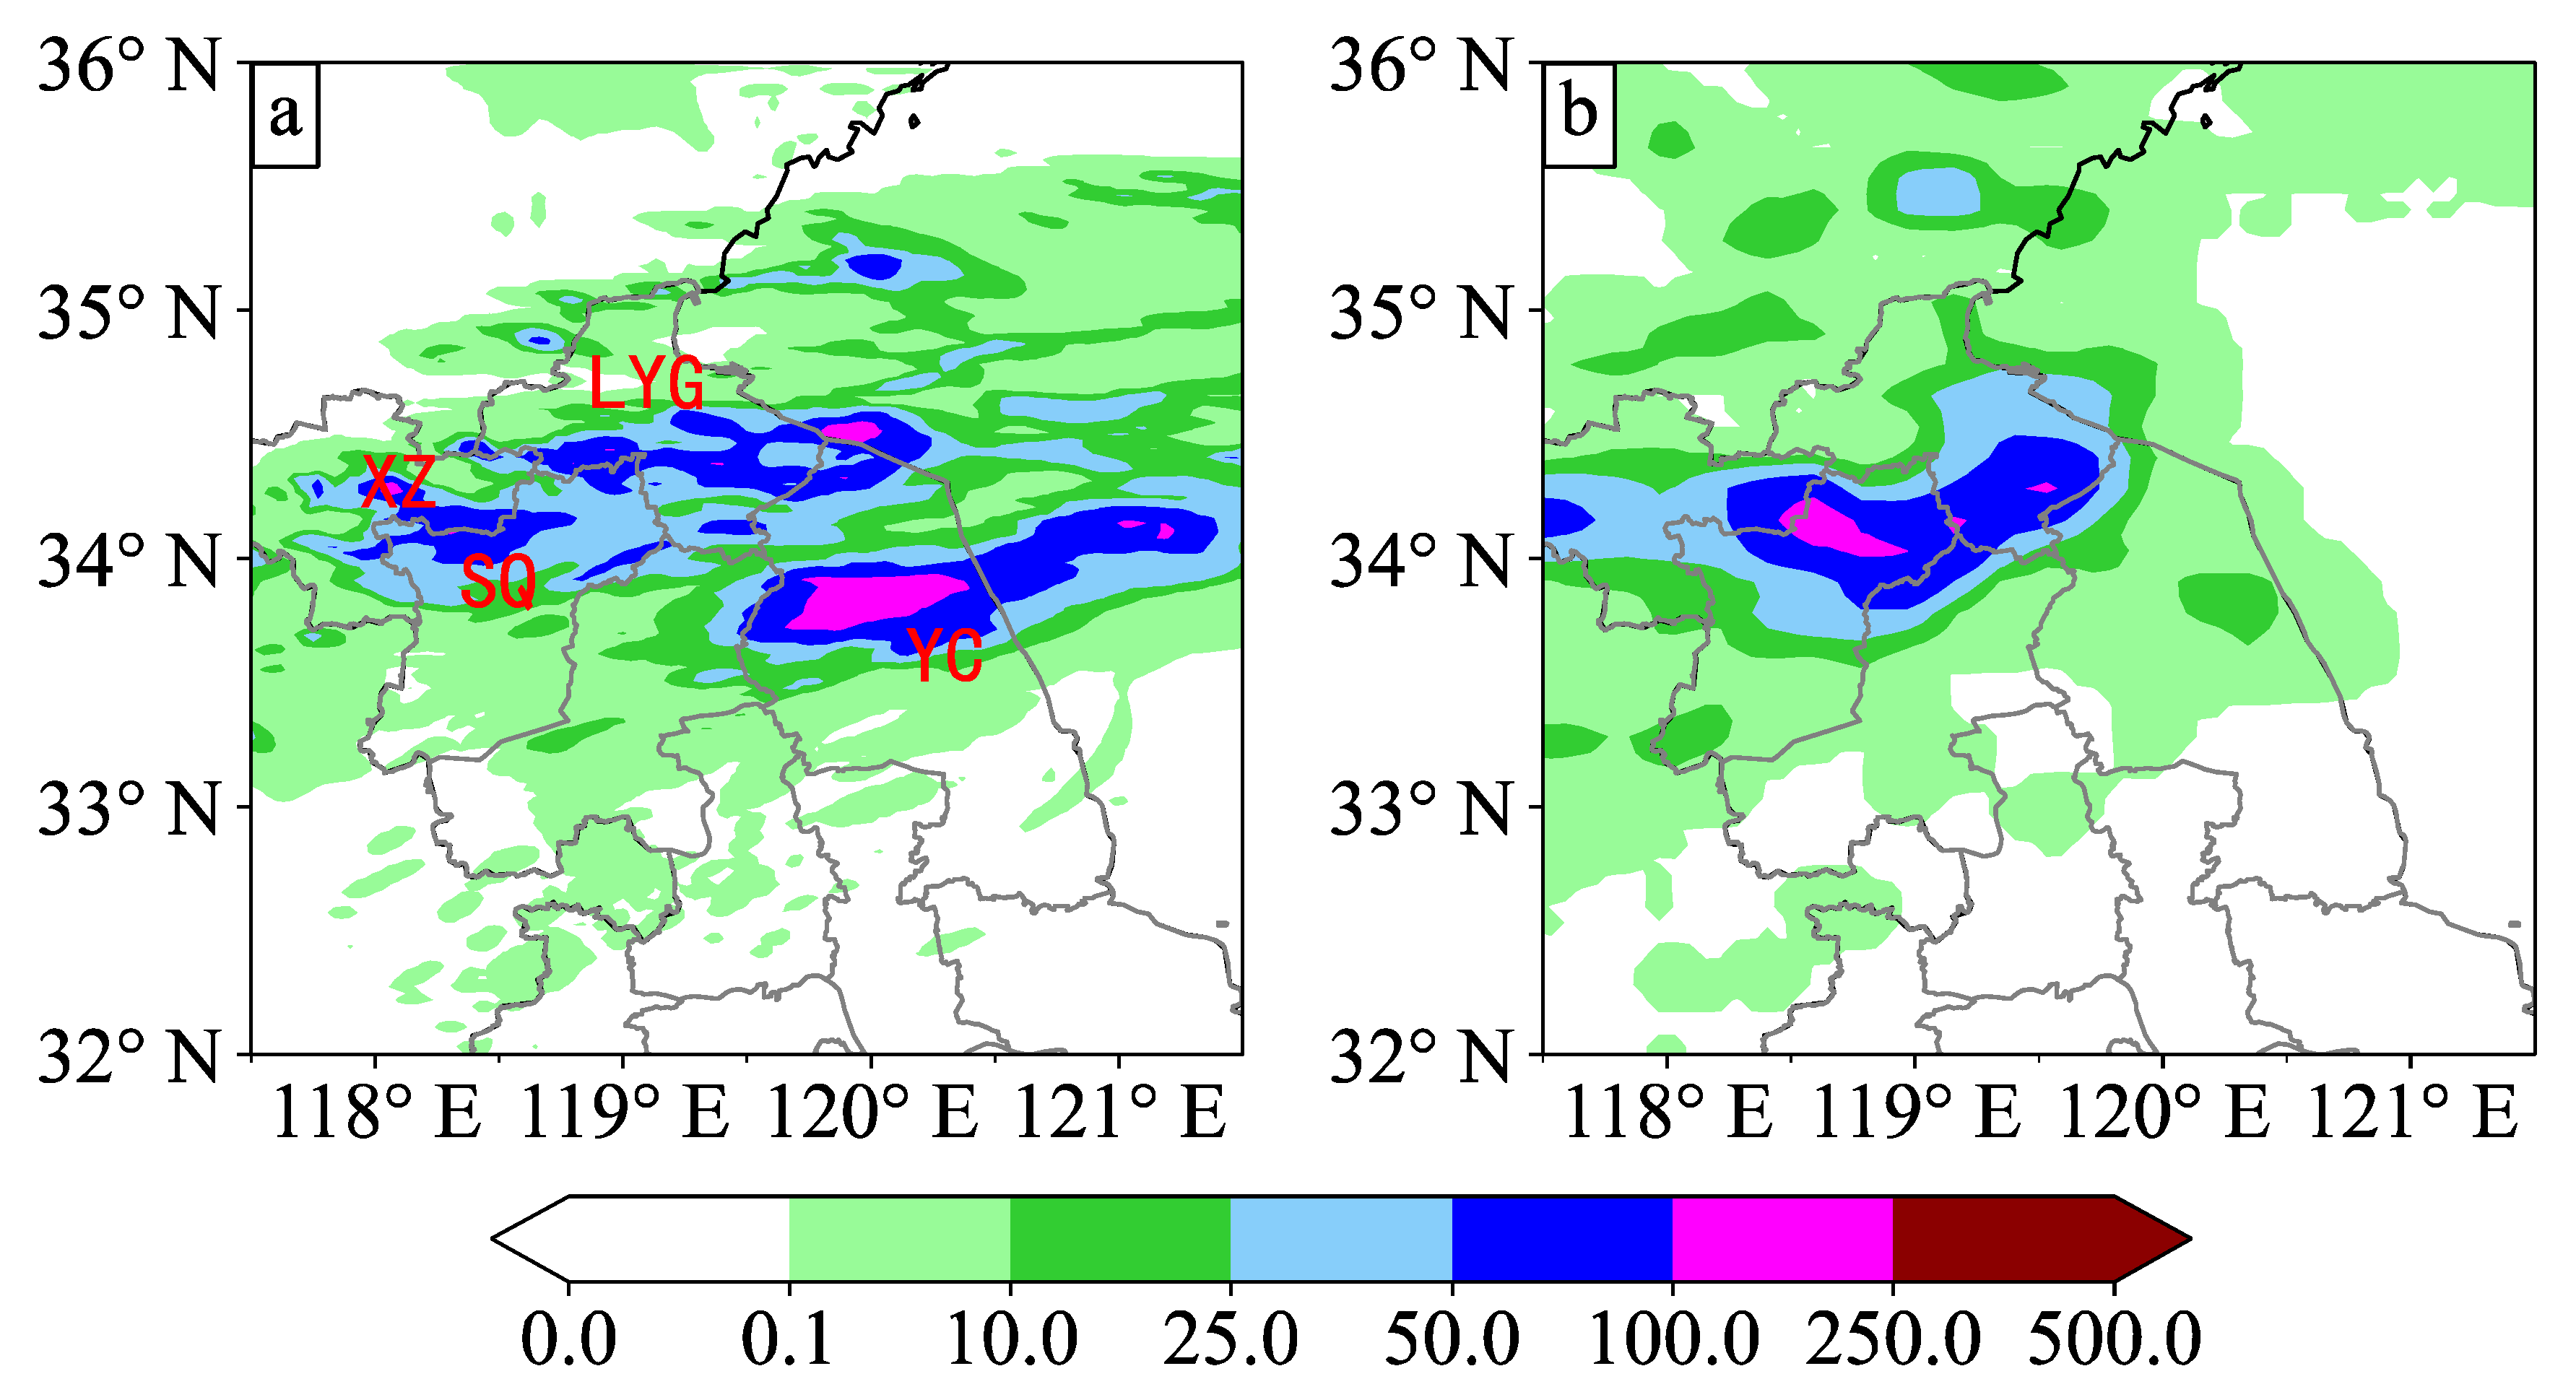
4.1.2. Results of 24 h Accumulated Precipitation

Figure 5 illustrates the 24 h accumulated precipitation results obtained from the WRF simulation and CLDAS precipitation product from 0000 UTC on 15 August to 0000 UTC on 16 August 2022. In Figure 5a, the simulated precipitation area is mainly located in cities, namely Xuzhou, Suqian, Lianyungang, and Yancheng. The maximum value of the precipitation center is 163.9 mm, which is relatively consistent with the observed value of 168.3 mm. However, the location of the rainfall center in Yancheng is not accurately simulated due to its southeast shift by approximately 100 km compared to the observation. And in Figure 5b, the precipitation center is located in Suqian, which matches well with the observation.

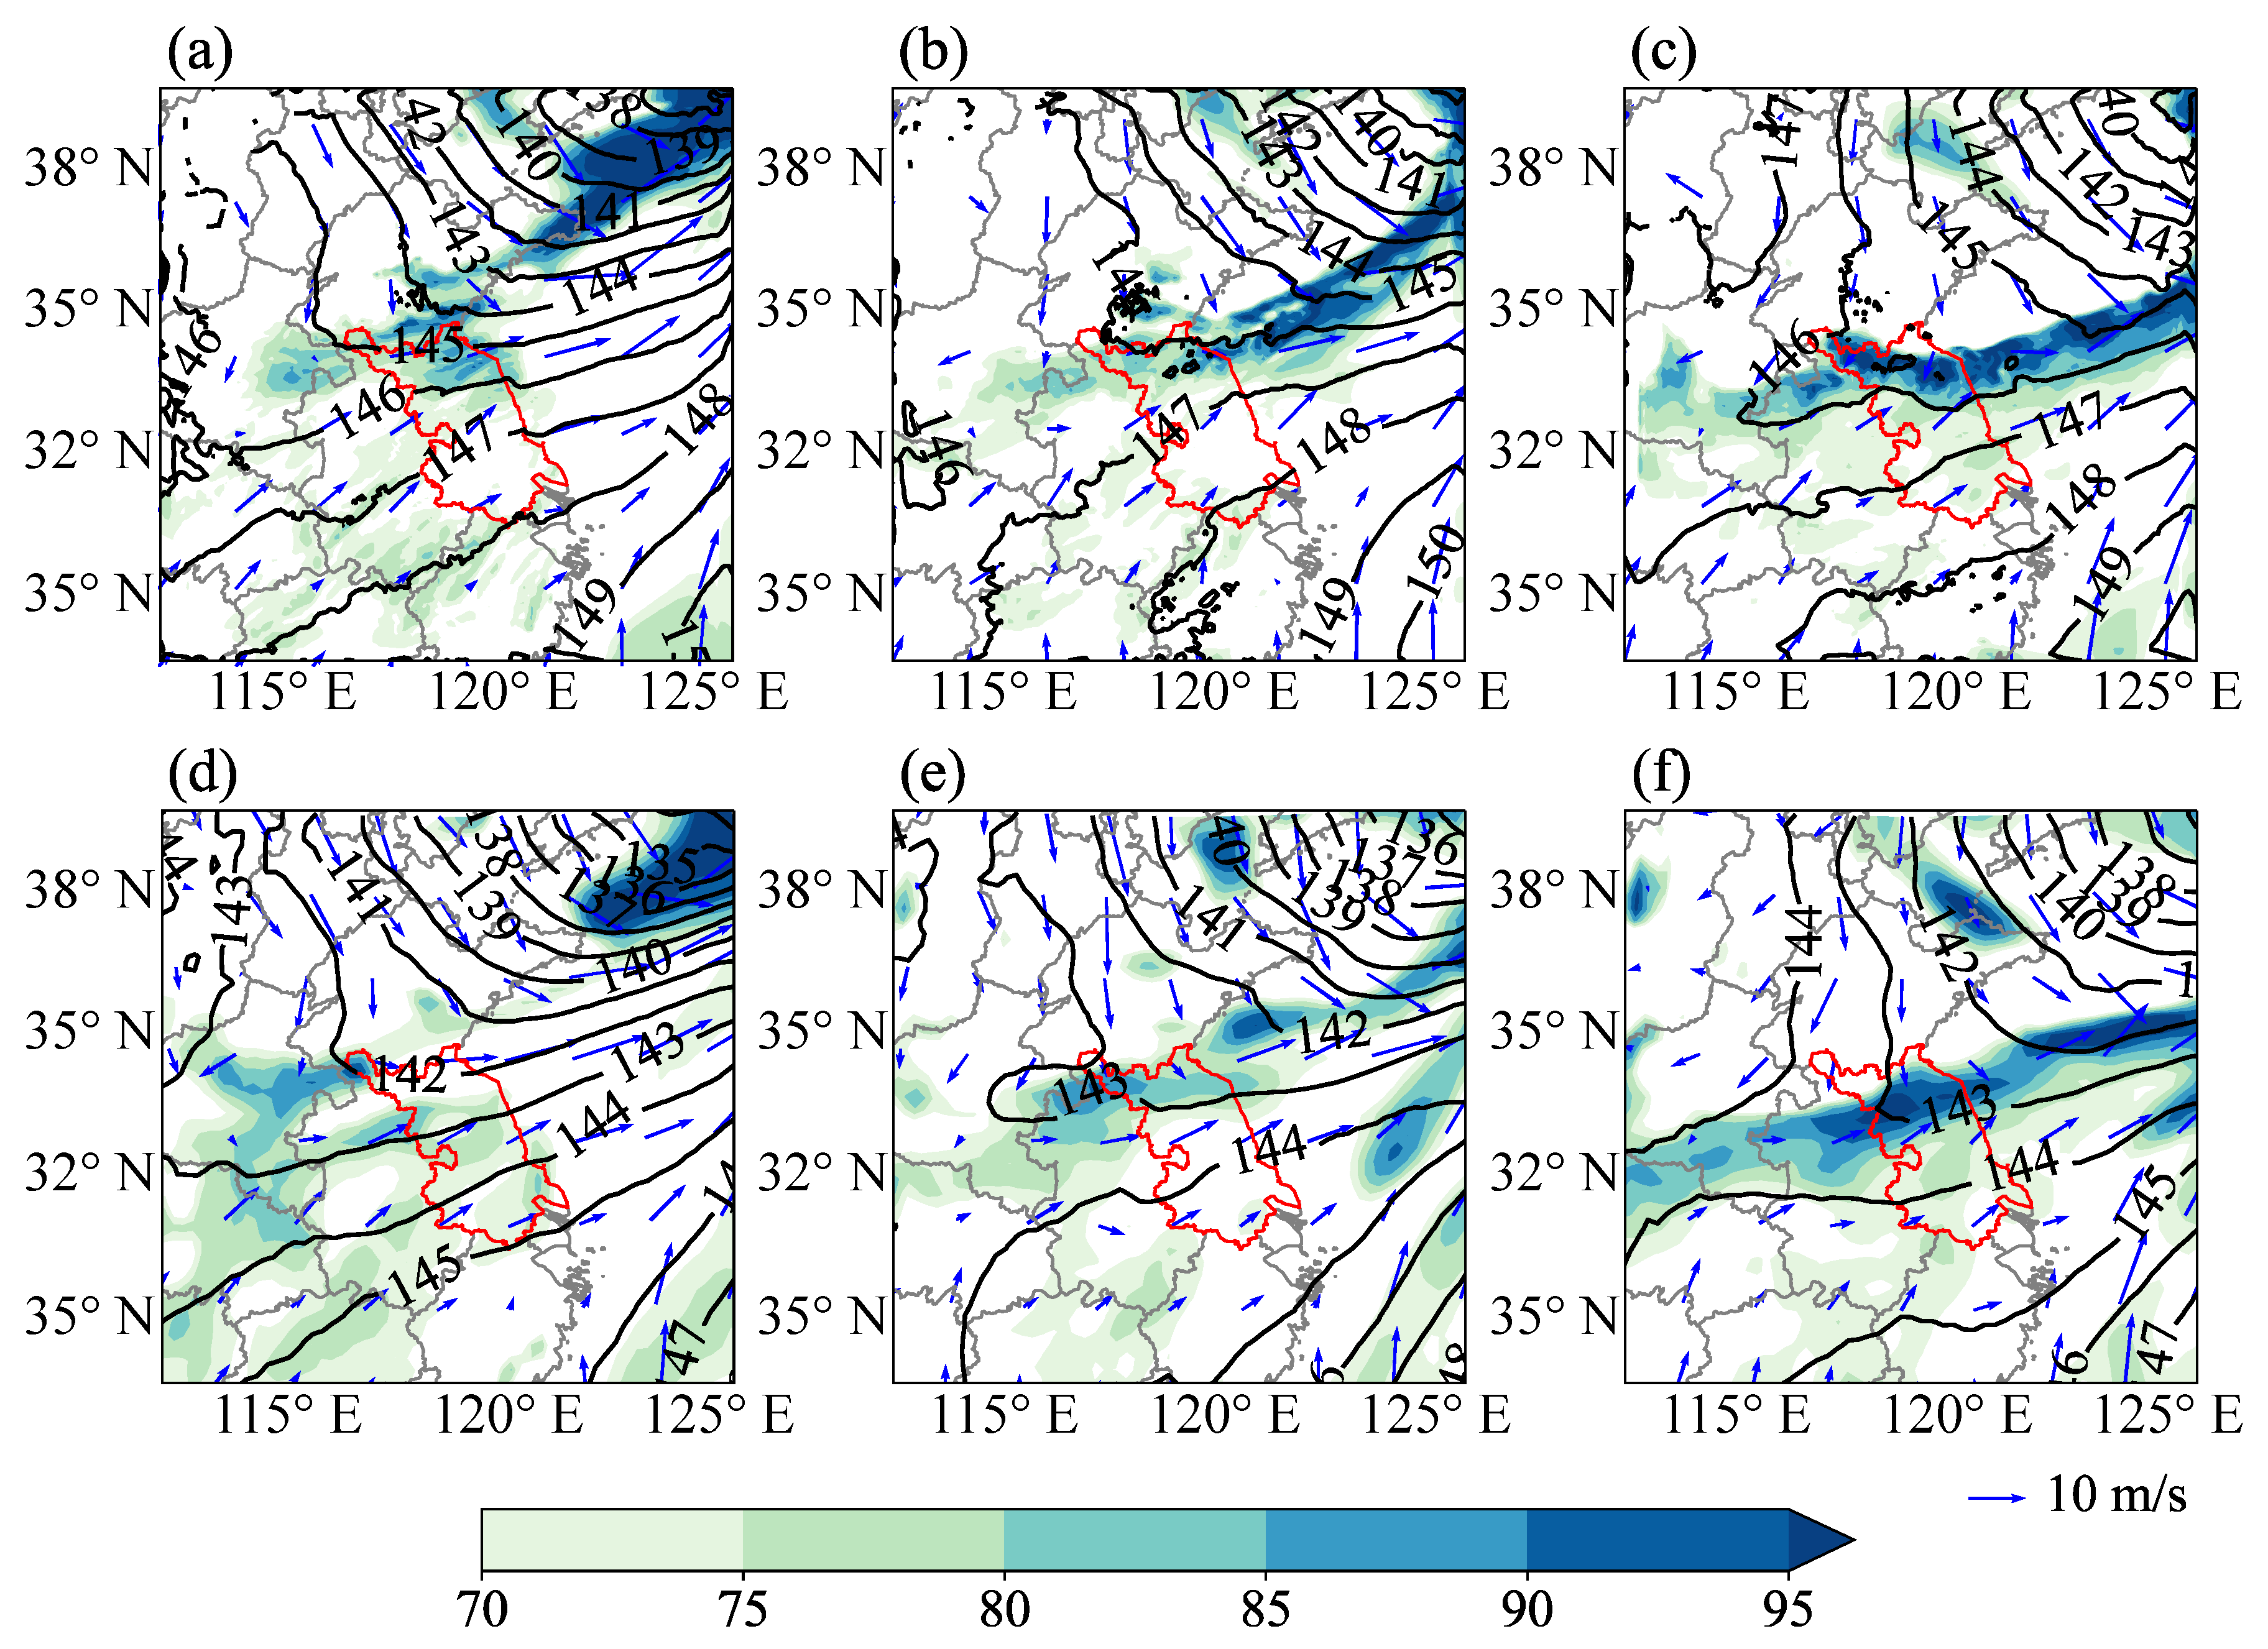
4.1.3. Geopotential Height, Wind, and Relative Humidity at 850 hPa

To clarify the reason for the eastward shift of the precipitation center shown in the WRF simulation (Figure 5), additional variables were analyzed, including geopotential height, wind, and relative humidity at 850 hPa, and the results are shown in Figure 6. Consistent with the analysis of sea-level pressure (Figure 4), the center with a low value of geopotential height moves eastward with time. According to the results regarding wind in Figure 6, the location of the shear line at 850 hPa in the WRF simulation is slightly more northerly than that in the observation. It can be seen from the relative humidity that water vapor converges at the shear line, and there is a strong upward movement at the shear line, which is conducive to the generation of the rainstorm. Especially at 1800 UTC on 15 August 2022, shown in Figure 6c, the relative humidity exceeds 90% in the northeast of Jiangsu, while the relative humidity in Figure 6f is centered in the northwest of Jiangsu. This may explain the reason why the location of the precipitation center in the WRF simulation deviates from the observation.

4.2. Analysis Based on the Blown-Up Theory

To verify the applicability of the blown-up theory in predicting the rainstorm case in Jiangsu and to complement the simulation results, blown-up charts were drawn and are shown in Figure 7 and Figure 8. In addition, V-3θ diagrams are provided in Figure 9, Figure 10 and Figure 11 based on the ERA5 data.

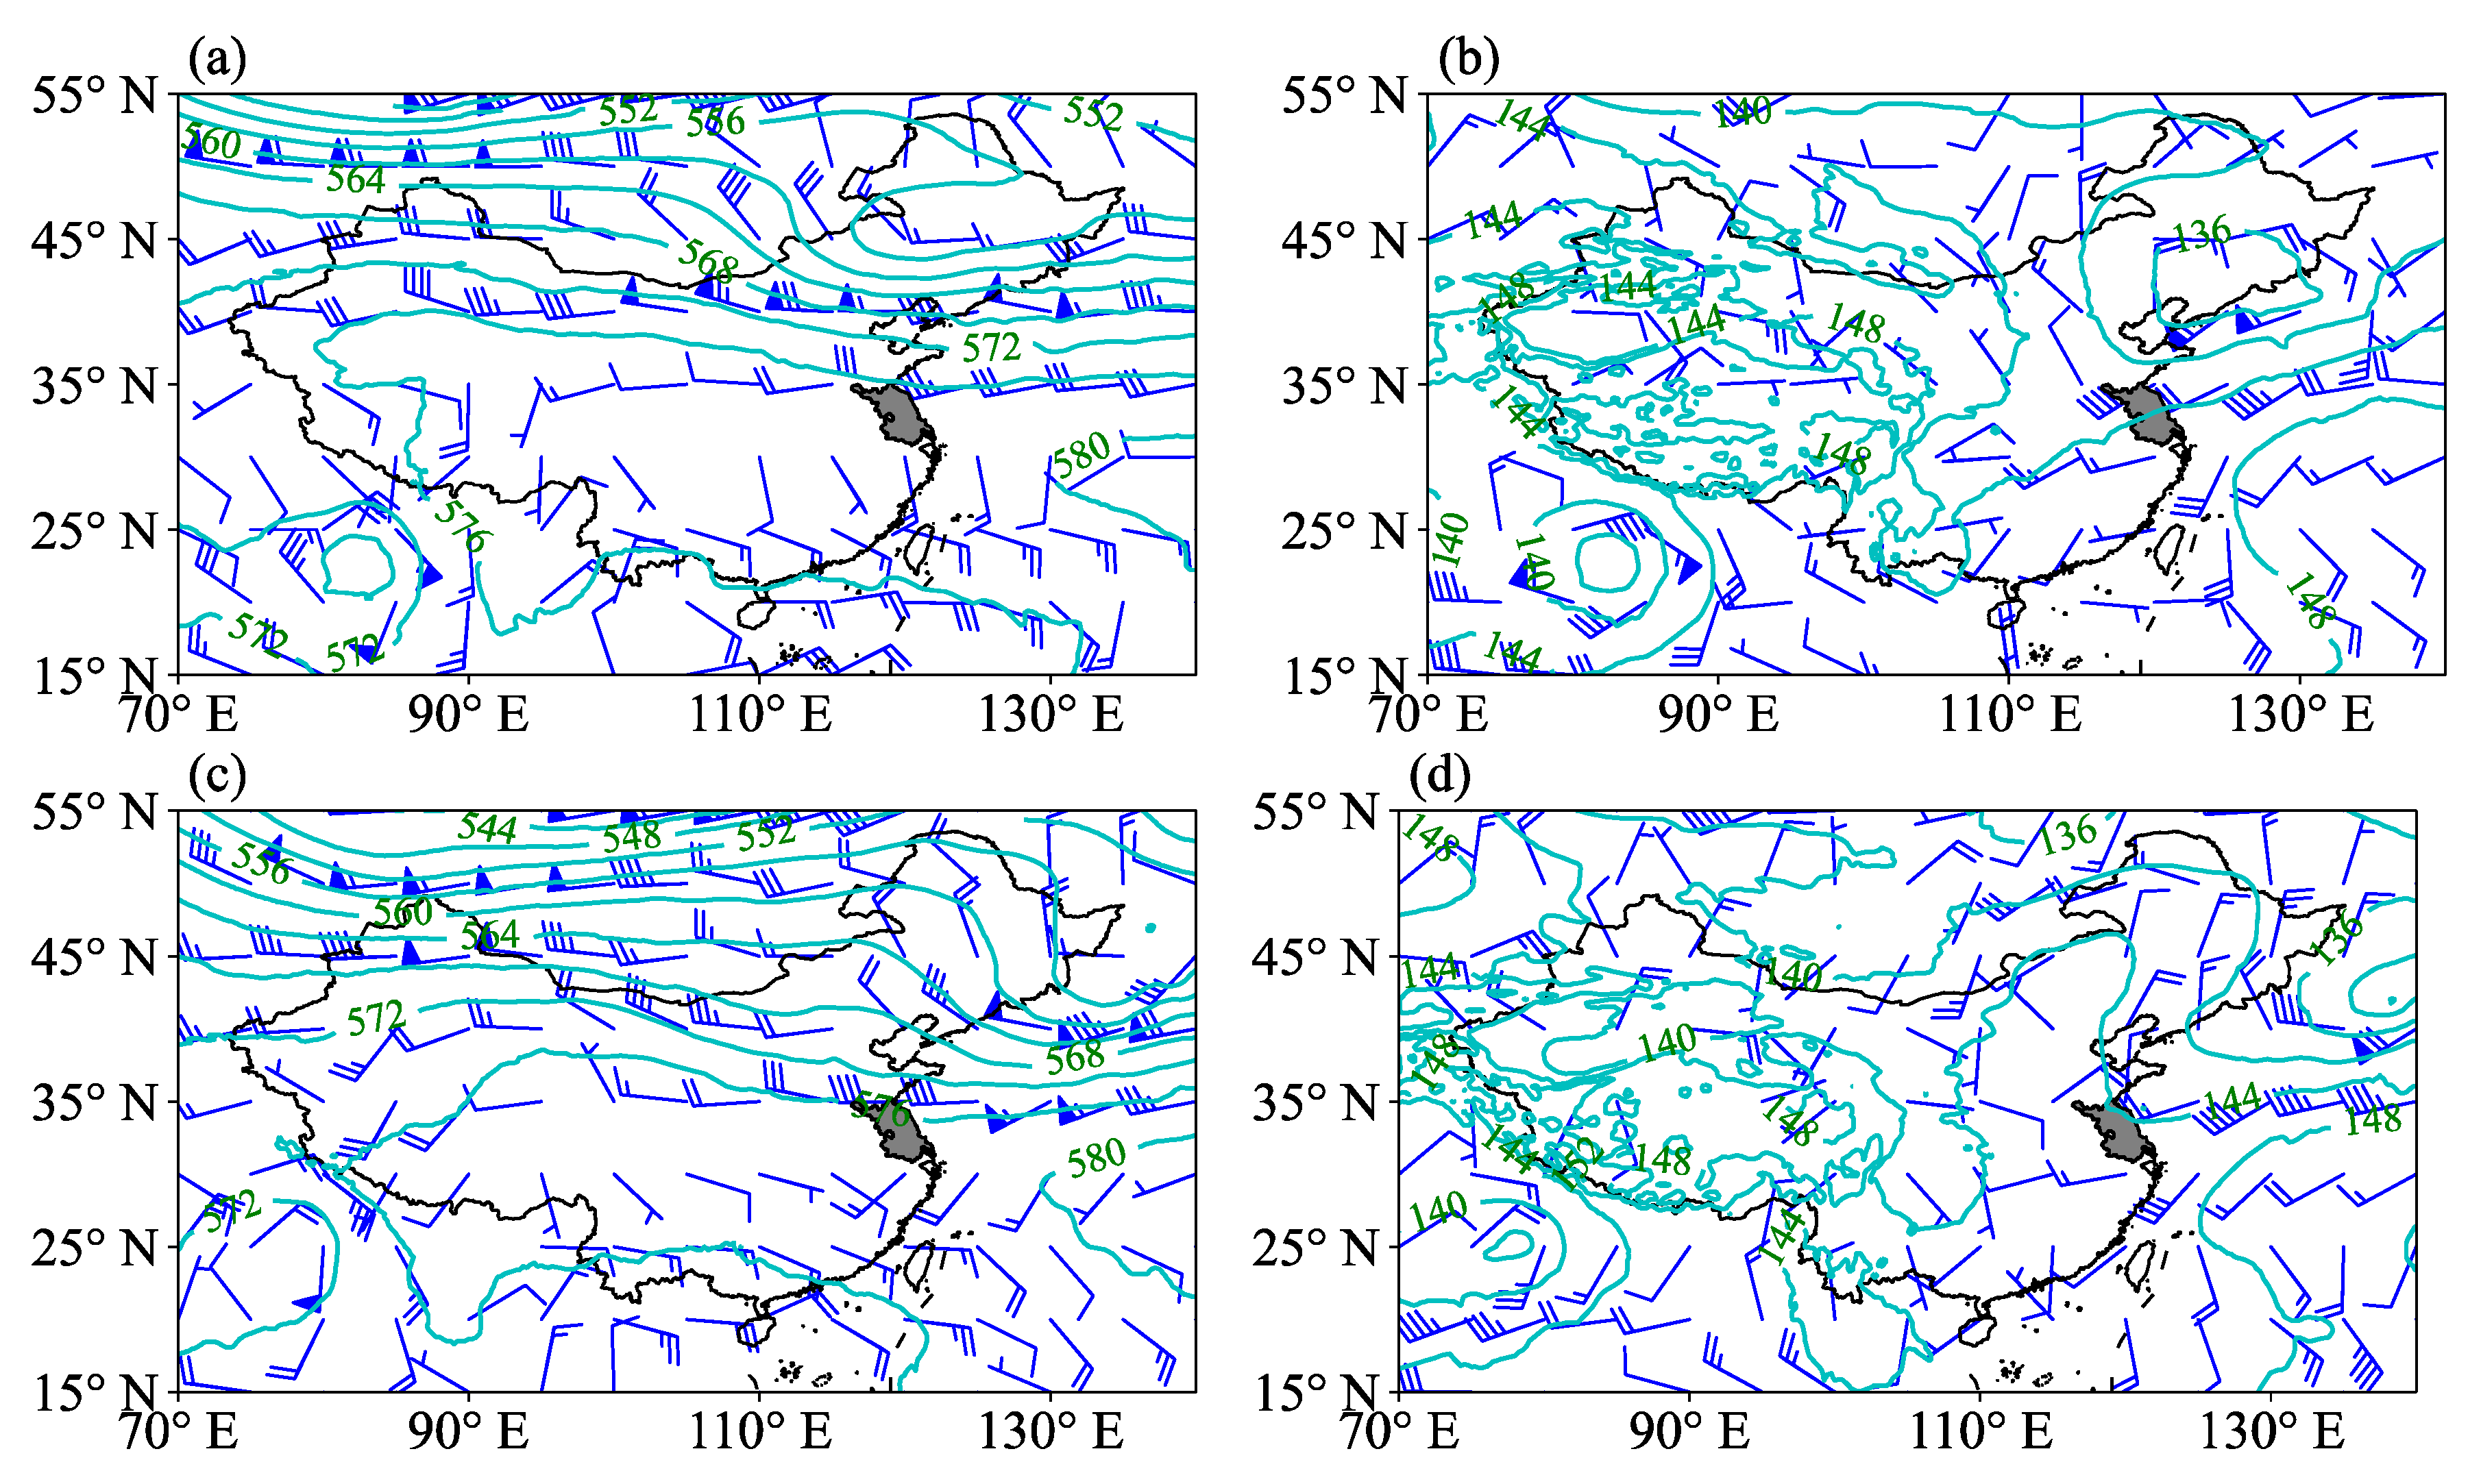
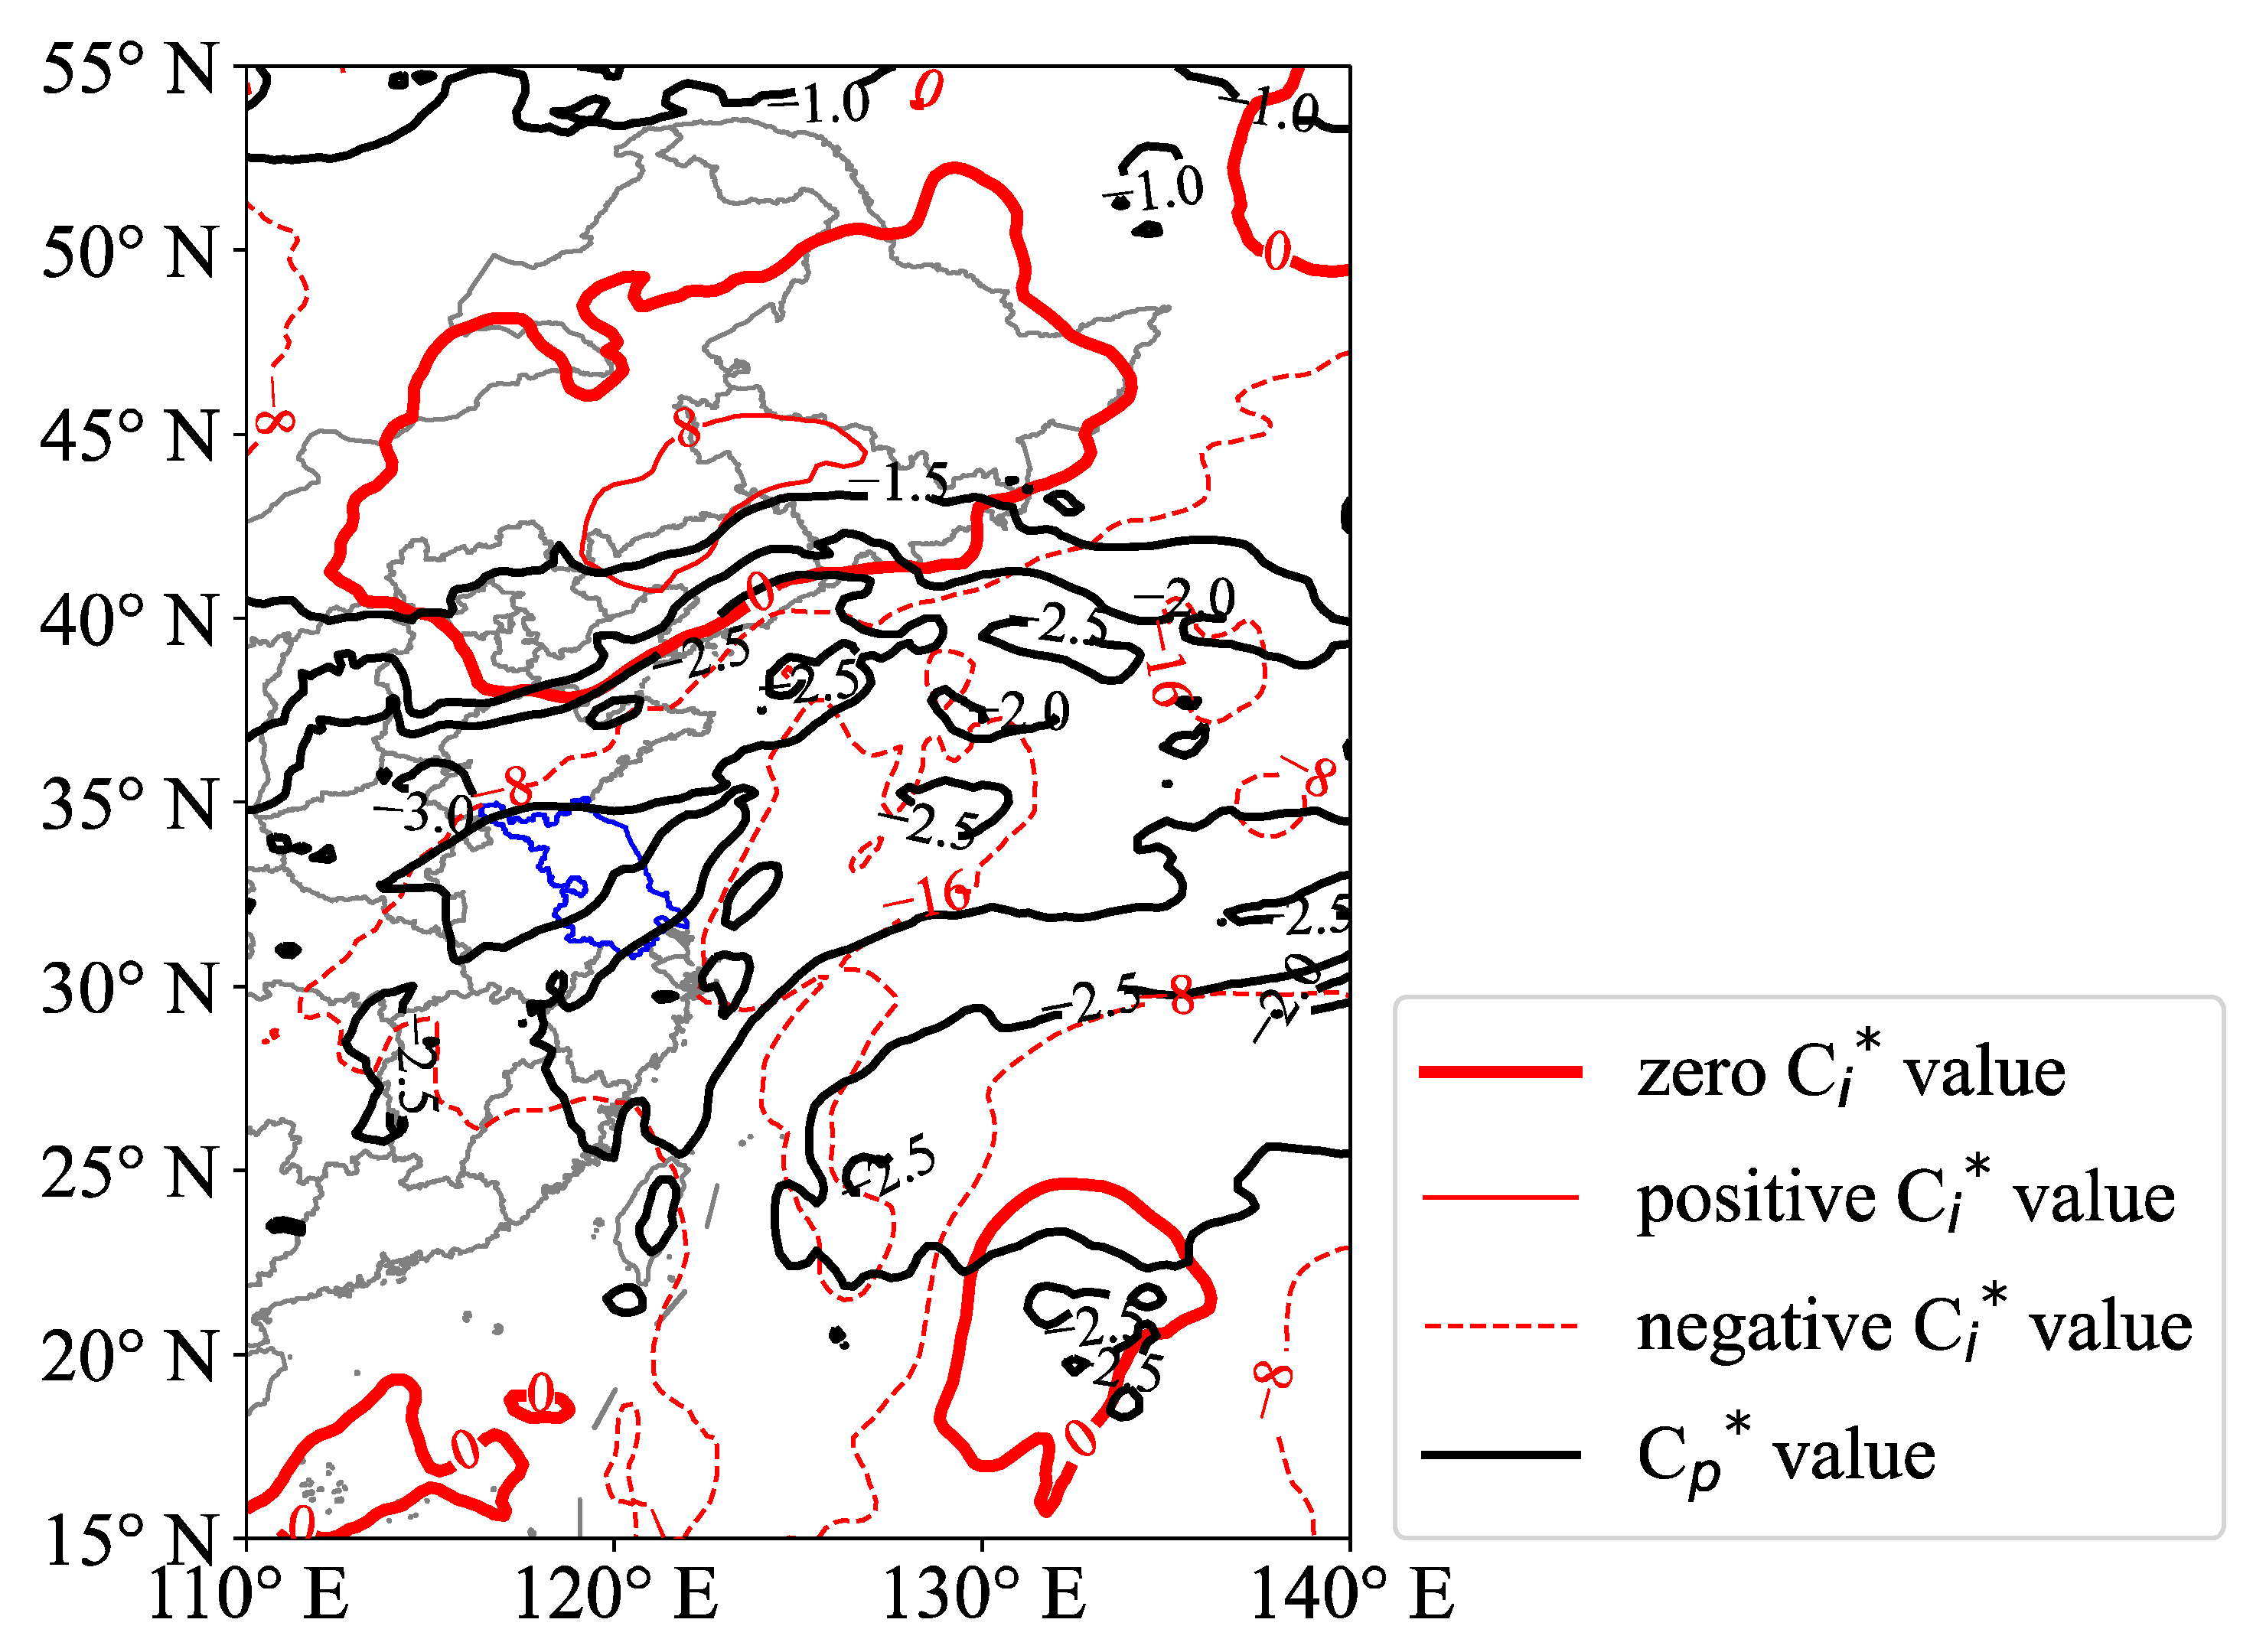
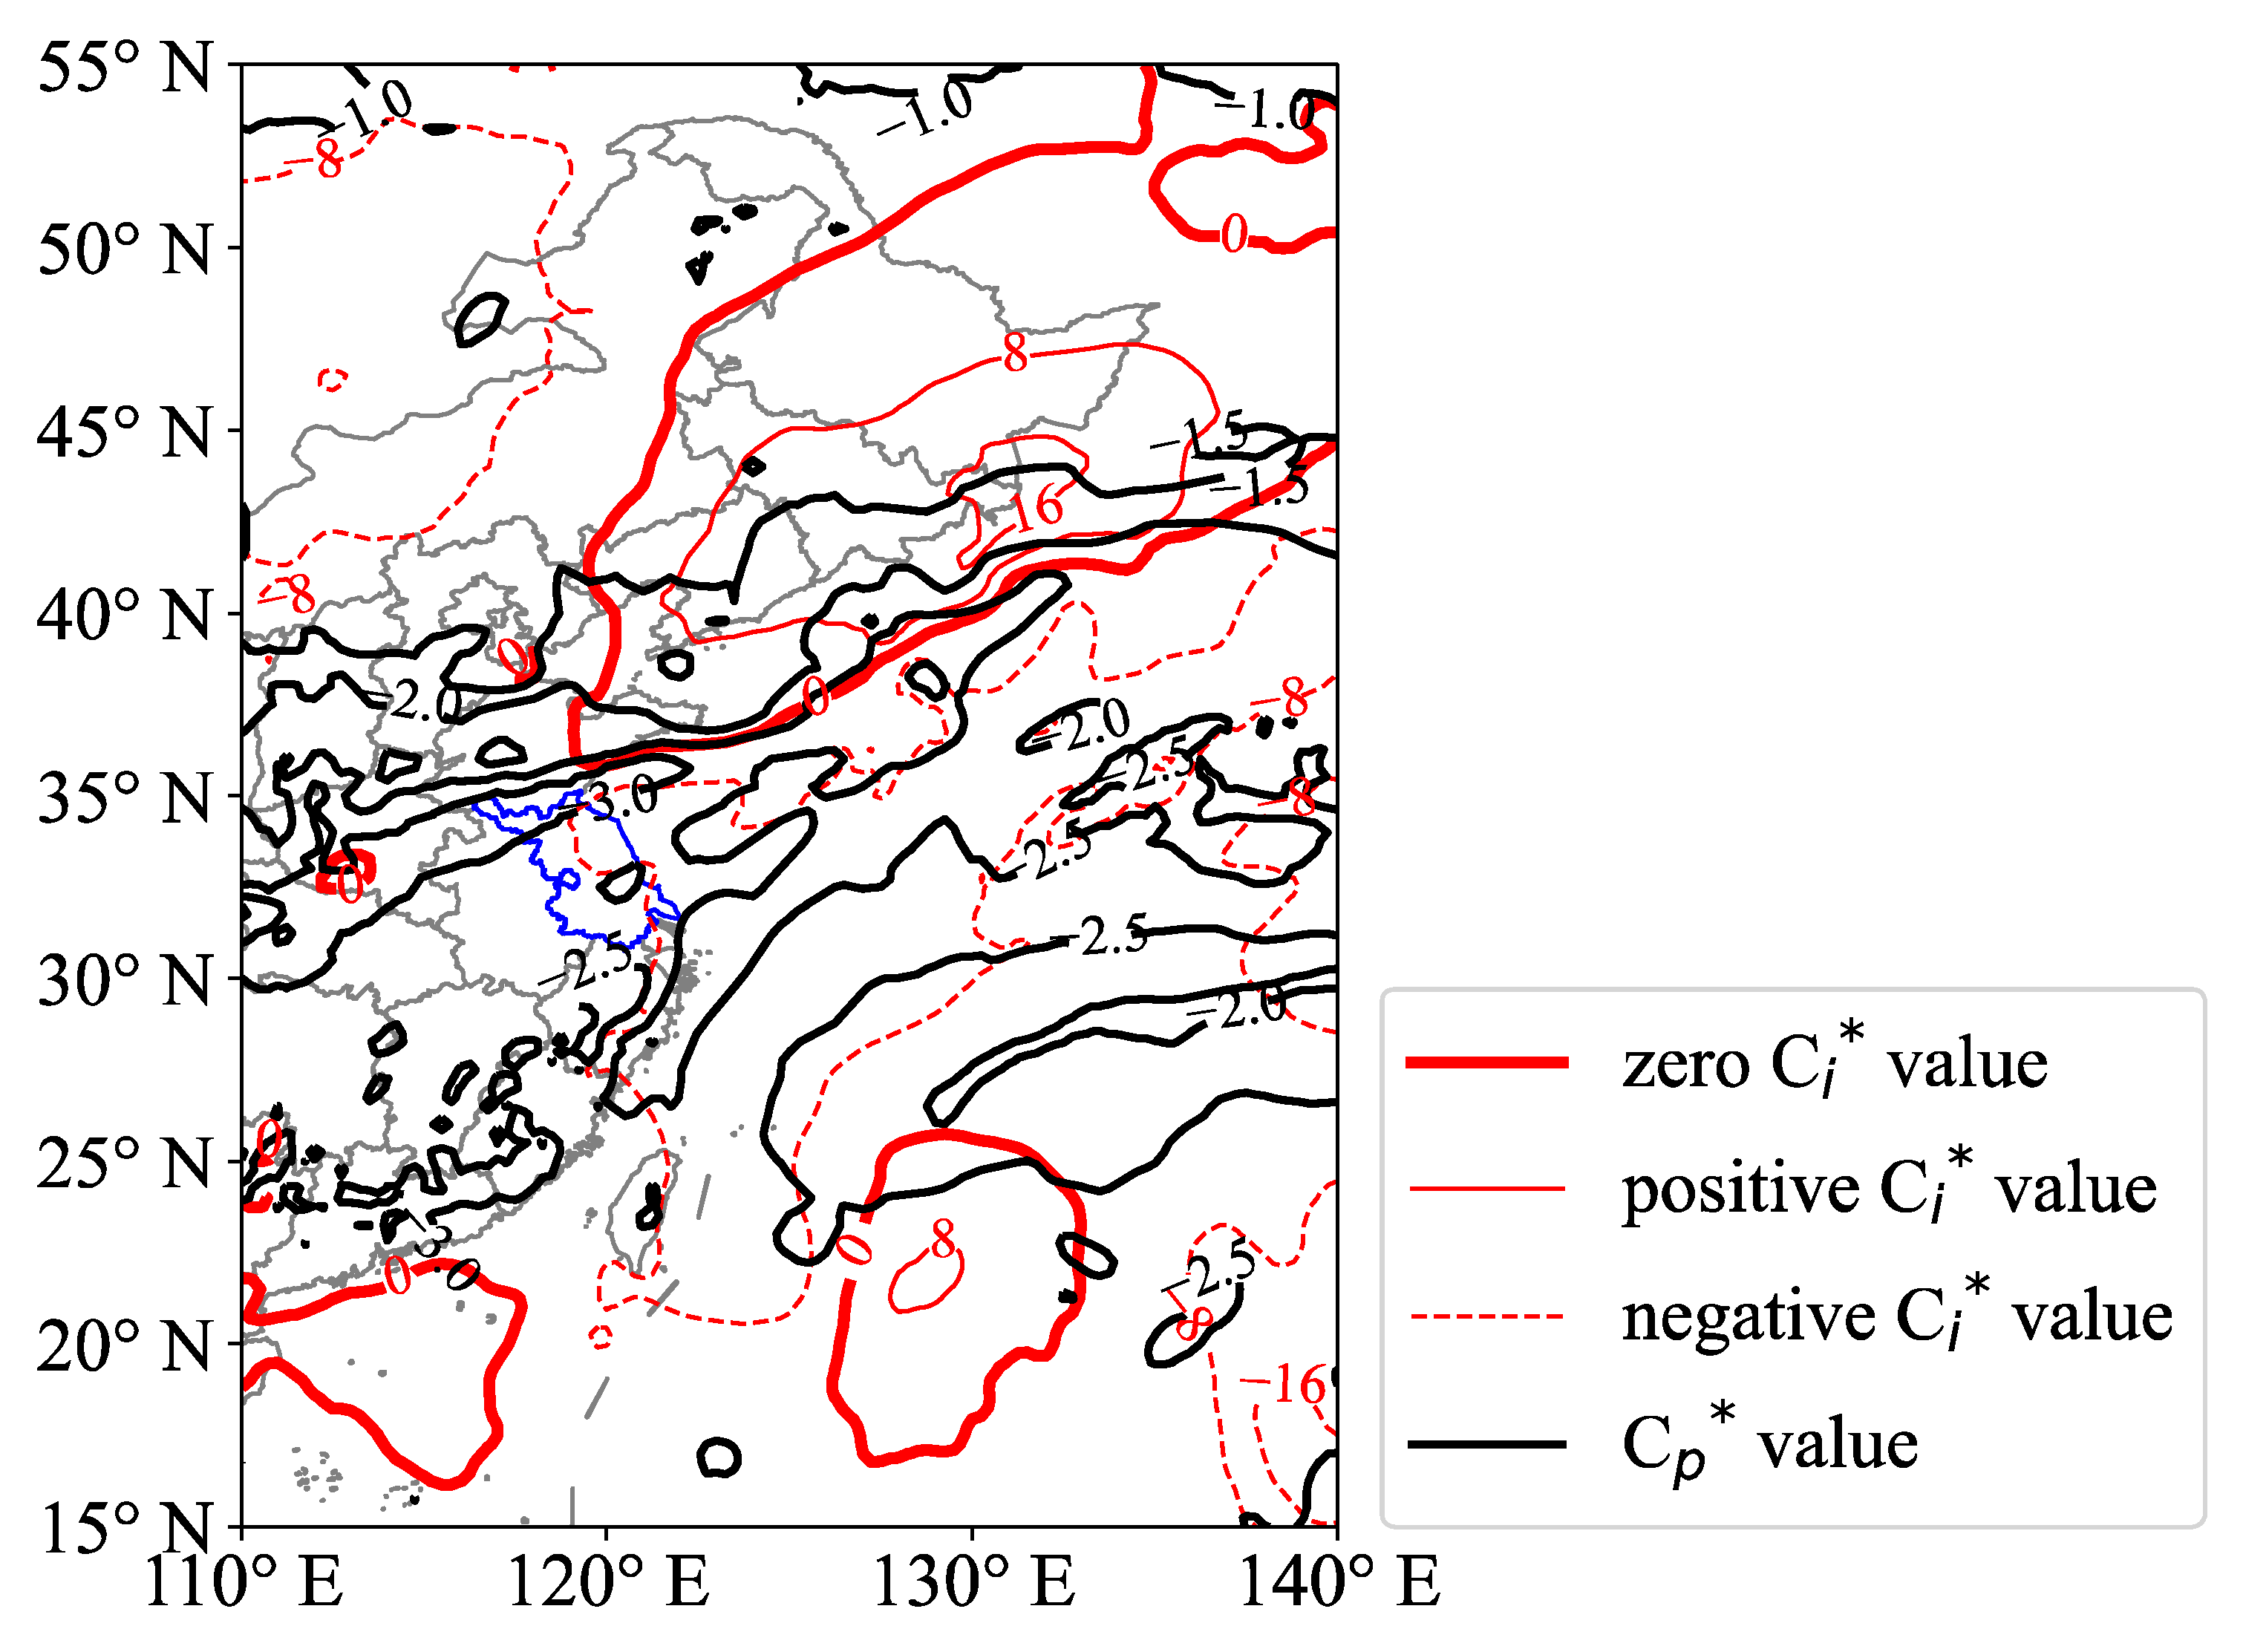
4.2.1. Blown-Up Charts

Figure 7 provides the blown-up charts with solid red lines for positive C i * values, while dashed red lines indicate negative C i * values. In addition, C p * values are presented with solid black lines. At 0000 UTC on 15 August 2022, Figure 7 shows that the positive value of C i * and the small absolute value of C p * coincide in the Northeast China region. This corresponds to the low-value system depicted in Figure 2, indicating a negative match. It means that the low-value system on the corresponding weather diagram undergoes a turning change. From the previous analysis of sea-level pressure based on the WRF simulation (Figure 4), it can be observed that the rainstorm process passed through Jiangsu from north to south with the eastward movement of the cyclone in the northeast of China. In the next 24 h, it gradually changed from low pressure to high pressure, which is consistent with the analysis of the blown-up charts.
Blown-up charts can also be used to forecast precipitation areas. As shown in Figure 8, at 1000 UTC on 15 August 2022, Northern Jiangsu is in the vicinity of the zero C i * value line, which is the possible precipitation area mentioned in Section 2. Meanwhile, it is also in an area with a negative C i * value and a large absolute value of C p * , which means clockwise tumble flow and non-uniform meteorological elements of the upper and lower layers. Taking the above considerations into account, it can be concluded that the main rainfall area of the rainstorm would be located in the northern part of Jiangsu Province, which is consistent with the actual weather conditions.

4.2.2. V-3θ Diagrams

To further understand the development of the rainstorm process, V-3θ diagrams are shown in Figure 10, Figure 11 and Figure 12. According to Figure 9, the Shuyang station (34.09° N, 118.78° E) was selected as the analytical object since it was in the precipitation center of this rainstorm process. In addition, the Nanjing station (31.97° N, 118.97° E) was used as a comparison as it was located in an area where there was no rain until the next day.
In the V-3θ diagram of Shuyang at 0000 UTC on 15 August 2022 (Figure 10a), the low-level θ * is widely separated from the θ s e d line. This indicates that the low-level vapor conditions are currently poor, but the deep southwesterly winds in the low level are conducive to the transport of southwesterly directed warm and moist air into Jiangsu. At 925 to 850 hPa, all three theta curves bend, indicating the presence of an inversion layer containing unstable energy. For levels below 700 hPa, the θ * and the θ s e d lines are tilted to the left with height, and convective instability is present. In the upper levels above 300 hPa, the three theta curves, especially θ * , are nearly parallel to the P-axis. It is seen that weak ultra-low temperature is already present. When southwest winds dominate in the lower levels and northwest winds dominate in the upper levels, it represents a general clockwise tumbling and signals potential severe weather. At this point, the situation in Nanjing (Figure 10b) is generally consistent with that in Shuyang.
In Figure 11a at 1200 UTC on 15 August 2022, it is found that θ * and θ s e d are quasi-parallel to the T-axis at an obtuse angle below 500 hPa. In addition, there is an ultra-low temperature aloft, which is an important structural feature for predicting heavy precipitation-type convective weather. The low-level θ * and θ s e d lines are separated by a shrinking distance. At 850 hPa, θ * θ s e d ≤ 8~10 K is found, indicating that the low-level water vapor is increasing and the water vapor conditions are gradually improving, which is favorable for the generation of heavy precipitation. The θ * and θ s e d lines are further tilted to the left with height, and the convective instability is further enhanced. The middle and upper layers are dominated by the westerly and northerly components. The tumble flow remains clockwise, but the intensity is reduced and the rainstorm cannot last long. While in Figure 11b, there is no evident change in the V-3θ diagram of Nanjing.
When the rainstorm was strong at 1800 UTC on 15 August 2022, the θ * and θ s e d lines in the V-3θ diagram of Shuyang (Figure 12a) almost overlap throughout the layer, and both are basically perpendicular to the T-axis at 700 to 200 hPa. These findings suggest a high level of moisture and a violent upward motion. The winds are northerly at the lower level, westerly at the middle level, and northwesterly at the upper level, with an overall shift to anticlockwise tumbling, indicating the end of the rainstorm. In Figure 12b, the θ * and θ s e d lines in the 850 to 700 hPa layers have shrunk compared to those in previous hours, indicating an improvement in the water vapor conditions from the lower layers of Nanjing for the precipitation.

5. Summary and Future Perspectives

This study intends to investigate the applicability of the blown-up theory in Jiangsu Province. After analyzing the WRF simulation results, the blown-up theory is further applied to analyze the rainstorm process in Jiangsu. The following are the main conclusions:
1. The weather systems are affected by Northeast China cyclone and oceanic anticyclone. The upper air is influenced by the upper trough and westerly rapids, while the lower air is influenced by the shear lines. The oceanic anticyclone makes the low-level warm and humid air converge in Jiangsu, together with the upper trough, to guide the cold air from north to south, with ideal dynamic and thermal conditions for the rainstorm. Compared to the CLDAS precipitation product and ERA5 reanalysis, the precipitation results of the WRF simulation are basically consistent with the actual situation. However, there is still some deviation in the simulation for the location of the precipitation center. Further analysis reveals that this is related to the simulated deviation of the low-altitude shear line position.
2. The blown-up analyses of this rainstorm case show that the blown-up theory seems to have the certain applicability to improve the accuracy of rainfall forecasting in Jiangsu Province of East China, and can be used as an auxiliary forecasting tool with other analytical methods for more accurate forecasting. The blown-up charts successfully predict the turning change of the weather system and the rainfall area. By comparing the V-3θ diagrams of Shuyang and Nanjing, it is found that the V-3θ diagrams can be used to analyze the vertical structure information over a single station to predict the development of the rainstorm.
In this study, only one rainstorm case in East China is analyzed. Thus, it is necessary to analyze more rainstorm cases to determine whether the blown-up theory is robust to most rainstorm cases in East China. Future study can combine the results of a blown-up analysis with the WRF simulation.

Author Contributions

Conceptualization, D.X.; writing—original draft preparation, T.S. and D.X.; writing—review and editing, D.X. and F.S.; formal analysis, T.S. and A.S.; data curation, F.S. and L.S.; All authors have read and agreed to the published version of the manuscript.

Funding

This research was funded by the Natural Science Foundation of China (U2242212), the Open Fund of China Meteorological Administration Radar Meteorology Key Laboratory (2023LRM-B03), the Open Fund of State Key Laboratory of Remote Sensing Science (OFSLRSS202321), the Program of Shanghai Academic/Technology Research Leader (21XD1404500), the Shanghai Typhoon Research Foundation (TFJJ202107), the Chinese National Natural Science Foundation of China (G41805016), and the research project of Heavy Rain and Drought-Flood Disasters in Plateau and Basin Key Laboratory of Sichuan Province in China (SZKT201904), NUIST Students’ Platform for Innovation and Entrepreneurship Training Program (202310300107Y).

Institutional Review Board Statement

Not applicable.

Informed Consent Statement

Not applicable.

Data Availability Statement

ERA5 hourly data for pressure levels from 1940 to present are available at https://doi.org/10.24381/cds.bd0915c6 (accessed on 14 August 2023), ERA5 hourly data on single levels from 1940 to present are available at https://doi.org/10.24381/cds.adbb2d47 (accessed on 14 August 2023), the CLDAS precipitation data are obtained from http://data.cma.cn/data/cdcdetail/dataCode/NAFP_CLDAS2.0_RT.html (accessed on 14 August 2023), and the FNL global tropospheric analyses for numerical simulations are obtained from https://rda.ucar.edu/datasets/ds083-2/ (accessed on 14 August 2023).

Acknowledgments

We acknowledge the support of the High-Performance Computing Center of Nanjing University of Information Science & Technology.

Conflicts of Interest

The authors declare no conflict of interest.

References

  1. Zhuang, X.; Zhu, H.; Min, J.; Zhang, L.; Wu, N.; Wu, Z.; Wang, S. Spatial Predictability of Heavy Rainfall Events in East China and the Application of Spatial-Based Methods of Probabilistic Forecasting. Atmosphere 2019, 10, 490. [Google Scholar] [CrossRef]
  2. Zhang, F.; Li, G.; Yue, J. The Moisture Sources and Transport Processes for a Sudden Rainstorm Associated with Double Low-Level Jets in the Northeast Sichuan Basin of China. Atmosphere 2019, 10, 160. [Google Scholar] [CrossRef]
  3. Ito, J.; Tsuguchi, H.; Hayashi, S.; Niino, H. Idealized High-Resolution Simulations of a Back-Building Convective System that Causes Torrential Rain. J. Atmos. Sci. 2021, 78, 117–132. [Google Scholar] [CrossRef]
  4. Huva, R.; Song, G. WRF Model Sensitivity to Spatial Resolution in Singapore: Analysis for a Heavy Rain Event and General Suitability. Atmosphere 2022, 13, 606. [Google Scholar] [CrossRef]
  5. Ouyang, S. Weather Evolution and Structural Prediction; Meteorological Press: Beijing, China, 1998; pp. 89–119. [Google Scholar]
  6. Ouyang, S.; McNair, D.H.; Lin, Y. Go into Irregularity; Meteorological Press: Beijing, China, 2002; pp. 211–263. [Google Scholar]
  7. Ouyang, S.; Yuan, D.; Zhong, Q. Introduction to the operational operating system of blown-up chart. J. Chengdu Univ. Inf. Technol. 1996, 3, 111–117. [Google Scholar]
  8. Ouyang, S.; Zhong, W. 11. Prediction and analysis of 1994 torrential rains in Southern China. Kybernetes 1998, 27, 733–741. [Google Scholar] [CrossRef]
  9. Peng, C.; Li, W. 13. Applications of the theory of blown-ups to weather forecasting. Kybernetes 1998, 27, 764–772. [Google Scholar] [CrossRef]
  10. Zhang, H.; Zhang, J.; Hou, S.; Hao, J.; Zhang, L. Heavy rainfall forecasting by blown-up theory. J. Shaanxi Meteorol. 2000, 4, 14–18. [Google Scholar]
  11. Tang, Q.; Zeng, Z.; Du, Y. Application of blown-up theory to the prediction of rainstorms in Shantou. Guangdong Meteorol. 2005, 4, 1–3+36. [Google Scholar]
  12. Wang, J.; Chen, C.; Zhang, G. A preliminary study on the application of blown-up theory in weather forecasting of 7.17 rainstorm. In Proceedings of the 26th Annual Meeting of the Chinese Meteorological Society on Early Warning, Forecasting and Disaster Prevention and Mitigation of Disaster Weather Events, Zhejiang, China, 14 October 2009; pp. 2284–2289. [Google Scholar]
  13. Xu, D.; Yang, G.; Wu, Z.; Shen, F.; Li, H.; Zhai, D. Evaluate Radar Data Assimilation in Two Momentum Control Variables and the Effect on the Forecast of Southwest China Vortex Precipitation. Remote Sens. 2022, 14, 3460. [Google Scholar] [CrossRef]
  14. Liu, J.; Zhou, X.; Ye, W.; Li, Y. Analysis of the application of blown-up theory in heavy rainfall weather forecasting in Honghe Prefecture, Yunnan Province. In Proceedings of the 2016 Yunnan Provincial Meteorological Academic Annual Conference Abstracts Collection, Yunnan, China, 21 November 2016; p. 6. [Google Scholar]
  15. Wang, H.; Tian, Q.; Liu, X. Study of an extreme rainstorm in the western part of the Hexi Corridor based on blown-up theory. Meteorol. Hydrol. Mar. Instrum. 2021, 38, 63–65. [Google Scholar]
  16. Zhang, P.; Zhang, Y. Analysis of the blown-up theory of the “7–25” heavy precipitation process in Beijing-Tianjin area. Mod. Agric. Sci. Technol. 2013, 11, 269–270. [Google Scholar]
  17. Chen, H.; Xie, N.; Wang, Q. Application of the blown-ups principle to thunderstorm forecast. Application of the blown-ups principle to thunderstorm forecast. Appl. Geophy. 2005, 2, 188–193. [Google Scholar] [CrossRef]
  18. Chen, H. Structural analysis of irregular information and regional prediction of fog. J. Nat. Disasters 2005, 5, 47–52. [Google Scholar]
  19. Wang, R.; Dong, A.; Fan, X.; Wang, L. Application of blown-up theory to hail forecasting in Northwest China. J. Arid Meteorol. 2006, 2, 19–24. [Google Scholar]
  20. Hao, L.; Zhou, L.; Wu, J. Application of blown-up principle-structural analysis method in hot weather. In Proceedings of the Scientific Symposium on Urban Weather Services, Beijing, China, 1 May 2001; pp. 188–189. [Google Scholar]
  21. Peng, X.; Huang, H.; Yang, A. A study on the prediction of dusty and windy weather based on blown-up theory. Meteorol. Disaster Reduct. Res. 2014, 37, 19–22. [Google Scholar]
  22. Du, Y.; He, L.; Wang, Z. Prediction of the blown-up of the western Pacific subduction. J. Chengdu Univ. Inf. Technol. 2005, 05, 99–104. [Google Scholar]
  23. Cao, Q.; Zhang, S.; Lei, G.; Zhang, Y. Impact of Different Double-Moment Microphysical Schemes on Simulations of a Bow-Shaped Squall Line in East China. Atmosphere 2022, 13, 667. [Google Scholar] [CrossRef]
  24. Zhuge, F.; Zheng, Y.; Wu, R.; Xu, J. Simulation study of a heavy rainfall process in Lixiahe area of Jiangsu Province. J. Nat. Disasters 2014, 23, 164–176. [Google Scholar]
  25. Ma, H.; Han, L.; Gu, C. Numerical simulation of the effect of cloud condensation nuclei on summer rainstorms in Nanjing and surrounding areas. Trans. Atmos. Sci. 2020, 43, 897–907. [Google Scholar]
  26. Hersbach, H.; Bell, B.; Berrisford, P.; Hirahara, S.; Horányi, A.; Muñoz-Sabater, J.; Nicolas, J.; Peubey, C.; Radu, R.; Schepers, D.; et al. The ERA5 global reanalysis. Q. J. R. Meteorol. Soc. 2020, 146, 1999–2049. [Google Scholar] [CrossRef]
  27. Hong, S.; Lim, J.J. The WRF single–moment 6–class microphysics scheme (WSM6). J. Korean Meteor. Soc. 2006, 42, 129–151. [Google Scholar]
  28. Iacono, M.J.; Mlawer, E.J.; Clough, S.A.; Morcrette, J.-J. Impact of an improved longwave radiation model, RRTM, on the energy budget and thermodynamic properties of the NCAR community climate model, CCM3. J. Geophys. Res. 2000, 105, 14873–14890. [Google Scholar] [CrossRef]
  29. Ruiz-Arias, J.A.; Dudhia, J.; Santos-Alamillos, F.J.; Pozo-Vázquez, D. Surface clear-sky shortwave radiative closure intercomparisons in the Weather Research and Forecasting model. J. Geophys. Res. Atmos. 2013, 118, 9901–9913. [Google Scholar] [CrossRef]
  30. Paulson, C.A. The mathematical representation of wind speed and temperature profiles in the unstable atmospheric surface layer. J. Appl. Meteorol. 1970, 9, 857–861. [Google Scholar] [CrossRef]
  31. Chen, F.; Dudhia, J. Coupling an Advanced Land Surface–Hydrology Model with the Penn State–NCAR MM5 Modeling System. Part I: Model Implementation and Sensitivity. Mon. Wea. Rev. 2001, 129, 569–585. [Google Scholar] [CrossRef]
  32. Shen, F.; Min, J.; Xu, D. Assimilation of radar radial velocity data with the WRF Hybrid ETKF--3DVAR system for the prediction of Hurricane Ike (2008). Atmos. Res. 2016, 169, 127–138. [Google Scholar] [CrossRef]
  33. Kain, J.S. The Kain–Fritsch Convective Parameterization: An Update. J. Appl. Meteor. Climatol. 2004, 43, 170–181. [Google Scholar] [CrossRef]
Figure 1. The 24 h accumulated precipitation (units in mm) based on the CLDAS precipitation product from 0000 UTC on 15 August to 0000 UTC on 16 August 2022. The locations of the four cities, Suqian (SQ), Xuzhou (XZ), Lianyungang (LYG), and Huaian (HA), are indicated, and Shuyang, Suqian, is marked by a dot.
Atmosphere 14 01508 g001
Figure 2. Geopotential height (green contours and numbers; units in dagpm) and wind (blue barbs; half: 2 m/s, full: 4 m/s, flag: 20 m/s) of the ERA5 reanalysis at (a,c) 500 hPa and (b,d) 850 hPa, with the time being 0000 UTC on 15 August 2022 shown in the upper row and 0000 UTC on 16 August 2022 shown in the lower row. Jiangsu Province is shaded by grey color.
Atmosphere 14 01508 g002
Figure 3. The WRF model domain with the white box showing the nesting domain. The light green is marked as the Jiangsu Province where the rainfall case occurred.
Atmosphere 14 01508 g003
Figure 4. Sea-level pressure (units in hPa) based on (ac) WRF simulation and (df) ERA5 reanalysis at 0000 UTC on 15 August 2022 shown in the left column, at 1200 UTC on 15 August 2022 shown in the middle column, and at 0000 UTC on 16 August 2022 shown in the right column.
Atmosphere 14 01508 g004
Figure 5. The 24 h accumulated precipitation (units mm) based on (a) WRF simulation and (b) CLDAS precipitation product from 0000 UTC on 15 August to 0000 UTC on 16 August 2022. The locations of the four cities, Xuzhou (XZ), Suqian (SQ), Lianyungang (LYG), and Yancheng (YC), are indicated in (a).
Atmosphere 14 01508 g005
Figure 6. Geopotential height (contours; units in dagpm), wind (vectors; units in m/s), and relative humidity (>70% shaded; units in %) at 850 hPa based on (ac) WRF simulation and (df) ERA5 reanalysis at 0600 UTC in the left column, at 1200 UTC in the middle column, and at 1800 UTC in the right column in 15 August 2022. Jiangsu Province is highlighted with red line.
Atmosphere 14 01508 g006
Figure 7. The blown-up chart at 0000 UTC on 15 August 2022. The red lines indicate the C i * values, while the black lines depict the C p * values. C i * and C p * are explained in Equations (2) and (3).
Atmosphere 14 01508 g007
Figure 8. Similar to Figure 7 but at 1000 UTC on 15 August 2022.
Atmosphere 14 01508 g008
Figure 9. (a) The 24 h accumulated precipitation (units in mm) based on CLDAS precipitation product from 0000 UTC on 15 August to 0000 UTC on 16 August 2022. The locations of Shuyang and Nanjing station are marked by red dots. (b) The 1 h accumulated precipitation (units in mm) in Shuyang and Nanjing from 0000 UTC on 15 August to 0000 UTC on 17 August 2022.
Atmosphere 14 01508 g009
Figure 10. V-3θ diagrams of (a) Shuyang and (b) Nanjing stations with the wind barb (half: 2 m/s, full: 4 m/s, flag: 20 m/s) at 0000 UTC on 15 August 2022, drawn based on ERA5 data. θ * means the hypothetical saturated state.
Atmosphere 14 01508 g010
Figure 11. V-3θ diagrams of (a) Shuyang and (b) Nanjing stations. Similar to Figure 10 but at 1200 UTC on 15 August 2022.
Atmosphere 14 01508 g011
Figure 12. V-3θ diagrams of (a) Shuyang and (b) Nanjing stations. Similar to Figure 10 but at 1800 UTC on 15 August 2022.
Atmosphere 14 01508 g012
Disclaimer/Publisher’s Note: The statements, opinions and data contained in all publications are solely those of the individual author(s) and contributor(s) and not of MDPI and/or the editor(s). MDPI and/or the editor(s) disclaim responsibility for any injury to people or property resulting from any ideas, methods, instructions or products referred to in the content.

