Article

Spatial Downscaling of GPM Satellite Precipitation Data Using Extreme Random Trees

School of Geographic and Biologic Information, Nanjing University of Posts and Telecommunication, Nanjing 210023, China
*
Author to whom correspondence should be addressed.
Atmosphere 2023, 14(10), 1489; https://doi.org/10.3390/atmos14101489
Submission received: 18 August 2023 / Revised: 20 September 2023 / Accepted: 25 September 2023 / Published: 26 September 2023
(This article belongs to the Special Issue Atmospheric Ice Nucleating Particles, Cloud and Precipitation)

Abstract

:
Obtaining precise and detailed precipitation data is crucial for analyzing watershed hydrology, ensuring sustainable water resource management, and monitoring events such as floods and droughts. Due to the complex relationship between precipitation and geographic factors, this study divides the entire country of China into eight vegetation zones based on different vegetation types. Within each vegetation zone, we employ a seasonally adjusted Extreme Random Trees approach to spatially downscale GPM (Global Precipitation Measurement) satellite monthly precipitation data. To validate the effectiveness of this method, we compare it with kriging interpolation and traditional global downscaling methods. By increasing the spatial resolution of the GPM monthly precipitation dataset from 0.1° to 0.01°, we evaluate the downscaled results and validate them against ground-level rain gauge data and GPM satellite precipitation data. The results indicate that the partitioned area prediction method outperforms other approaches, resulting in a precipitation dataset that not only achieves high accuracy but also offers finer spatial resolution compared to the original GPM precipitation dataset. Overall, this approach enhances the model’s capability to capture complex spatial features and demonstrates excellent generalization. The resulting higher-resolution precipitation dataset enables the creation of more accurate precipitation distribution maps, providing data support for regions lacking hydrological information. These data can be used to analyze seasonal precipitation patterns and reveal differences in precipitation across different seasons and geographic regions.

1. Introduction

1.1. Background Introduction

Precipitation is one of the fundamental meteorological elements on Earth, with far-reaching effects on both natural ecosystems and human societies. The accuracy and precision of precipitation data are critically important in diverse fields, from agriculture and urban planning to water resource management and disaster preparedness. Moreover, the temporal and spatial distribution of precipitation not only regulates the functioning of the Earth’s surface water cycle [1,2,3], but also serves as foundational data for research in areas such as climate science, hydrology, and ecology. The rapid and accurate collection of high-precision precipitation data holds great significance. While the acquisition of precipitation data relies on ground-based meteorological stations, the extensive area and complex terrain of China, combined with limitations posed by topography and scarcity of meteorological instruments, lead to a sparse and uneven distribution of monitoring stations [4]. In some areas, complete and continuous multi-year precipitation data are lacking, making it challenging to obtain actual observed precipitation information [5]. Satellite remote sensing, with its extensive coverage, continuous observations, and high spatiotemporal resolution, offers a valuable means of obtaining precipitation data [6,7,8,9]. Presently, satellite remote sensing precipitation products have become an essential resource for acquiring spatial precipitation data. Nonetheless, due to sensor limitations and observational resolution constraints, remote sensing precipitation data often suffer from low spatial precision. The original remote sensing precipitation data fall short of meeting the high-precision, high-resolution data requirements in hydrology. While efforts have been made to enhance precipitation monitoring accuracy, mainly through multiple regression models, physical models [10,11,12,13,14,15,16], and some high-resolution numerical models, their precision remains limited and inadequate for practical applications. To address this issue and enhance the precision and accuracy of remote sensing precipitation data, there is a need to engage in downscaling studies.

1.2. Traditional Downscaling Methods

Traditional methods for spatial precipitation estimation typically involve using statistical downscaling models and interpolation techniques such as Thiessen polygons, inverse distance weighting, and ordinary kriging to estimate ground-based rain gauge data [17,18,19]. These methods primarily consider precipitation information from nearby stations. However, due to the spatial heterogeneity of precipitation, researchers have started integrating additional data to improve spatial precipitation estimation [20,21,22]. For instance, when employing kriging with drift for spatial precipitation estimation, incorporating elevation information can enhance precision [23]. Some researchers have used partial least squares regression analysis to establish regression models based on latitude, longitude, elevation, terrain impact, and shading [24], for estimating the spatial distribution of annual and seasonal precipitation in the Tibet region [25]. Others have incorporated NDVI (normalized difference vegetation index) [26] data to enhance interpolation accuracy in sparsely populated rain gauge areas [27,28,29]. Nonetheless, due to the sparse and uneven distribution of rain gauge stations, obtaining spatial distribution information for precipitation becomes challenging when station numbers are insufficient. Xu and colleagues [30] combined the optical and physical properties of clouds with the relationship to precipitation to construct an efficient GWR downscaling model, providing high-resolution daily precipitation data for the Three Rivers Source region. Haji-Aghajany [31] used a combination of the statistical downscaling model (SDSM) and artificial neural networks (ANNs) with Global Navigation Satellite System (GNSS)-based functional tropospheric tomography to extract humidity indices and improve the resolution of precipitation data during wet months. However, the GNSS-based functional tropospheric tomography technique is operationally complex and costly, and not all regions have readily available GNSS data, which may limit the applicability of the method. Zhang [32] developed a hybrid statistical downscaling model that combines bias correction and Bayesian model averaging to improve the accuracy of downscaling methods, making it better suited for predicting extreme weather conditions. However, this method is more complex to implement and operate, requiring highly specialized skills to configure and manage such a complex model. Additionally, the hybrid model demands a substantial quantity of input data, which may make it challenging to apply in remote areas.

1.3. Machine Learning Downscaling Methods

In recent years, machine learning algorithms have gained prominence in downscaling [33,34,35]. They excel at capturing the complex relationship between precipitation and the surface, effectively avoiding overfitting, and demonstrating robust generalization capabilities [36]. Jing [37], using the random forest (RF) algorithm, employed the normalized difference vegetation index (NDVI), land surface temperature (LST), and digital elevation model (DEM) data to obtain 1 km resolution tropical rainfall measuring mission (TRMM) [38] satellite products in northeastern China. Zhang [39] simulated TRMM data for the upstream basin area of the Three Gorges using support vector machines, considering the connections between TRMM, vegetation index, and topography. Chen [40], based on GPM data, compared the performance of four models—univariate regression, multivariate regression, random forest, and support vector machine—in semi-arid to arid regions. The results indicated that machine learning-driven methods outperformed parameter regression approaches in precipitation prediction. Sharifi [41] conducted downscaling simulations on GPM data for northern Australia using neural networks. Machine learning models used in traditional global downscaling methods typically need to consider complex relationships among multiple factors and variables, which may make it challenging to adapt to changes in precipitation distribution caused by different geographic regions, resulting in limited fitting accuracy and relatively poor generalization performance in large-scale study areas.
Given the limited ability of traditional global downscaling models to generalize effectively, especially when confronted with variations in spatial precipitation distribution resulting from different geographical regions [42,43], this study introduces an approach to partition the research area into eight vegetation zones based on vegetation types. Within each of these vegetation zones, we utilize the Extreme Random Trees method for spatially downscaling GPM monthly precipitation data. To evaluate the efficacy of this approach, we conduct a comparative analysis with predictions made using the Extreme Random Trees model without the vegetation zone division, as well as with outcomes obtained through kriging interpolation. The validation process includes a comparison of the downscaled results with ground-level rain gauge data and the original GPM precipitation dataset. The purpose of this paper is to improve downscaled precipitation research by addressing the issue of weaker model generalization due to differences in spatial precipitation distribution in different geographical regions. This aims to provide precipitation data having higher spatial accuracy for related fields.

2. Materials and Methods

2.1. Data Collection

2.1.1. GPM Satellite Precipitation Data

The Global Precipitation Measurement (GPM) satellite [44], a joint endeavor between NASA (U.S. National Aeronautics and Space Administration) and JAXA (Japan Aerospace Exploration Agency), furnishes high-quality global precipitation data. Equipped with multiple advanced instruments dedicated to observing precipitation, the GPM satellite facilitates the dissemination of precipitation information characterized by high spatiotemporal resolution. For the purposes of this study, the GPM data used are sourced from the Data Center of NASA’s Goddard Space Flight Center (https://disc.gsfc.nasa.gov/datasets?keywords=GPM&page=1 (accessed on 15 March 2023)). These datasets encompass monthly precipitation records for the year 2019, with a spatial resolution finely tuned to 0.1° × 0.1°. To access this information, the data are conveniently formatted in netCDF with the file extension “.nc”.

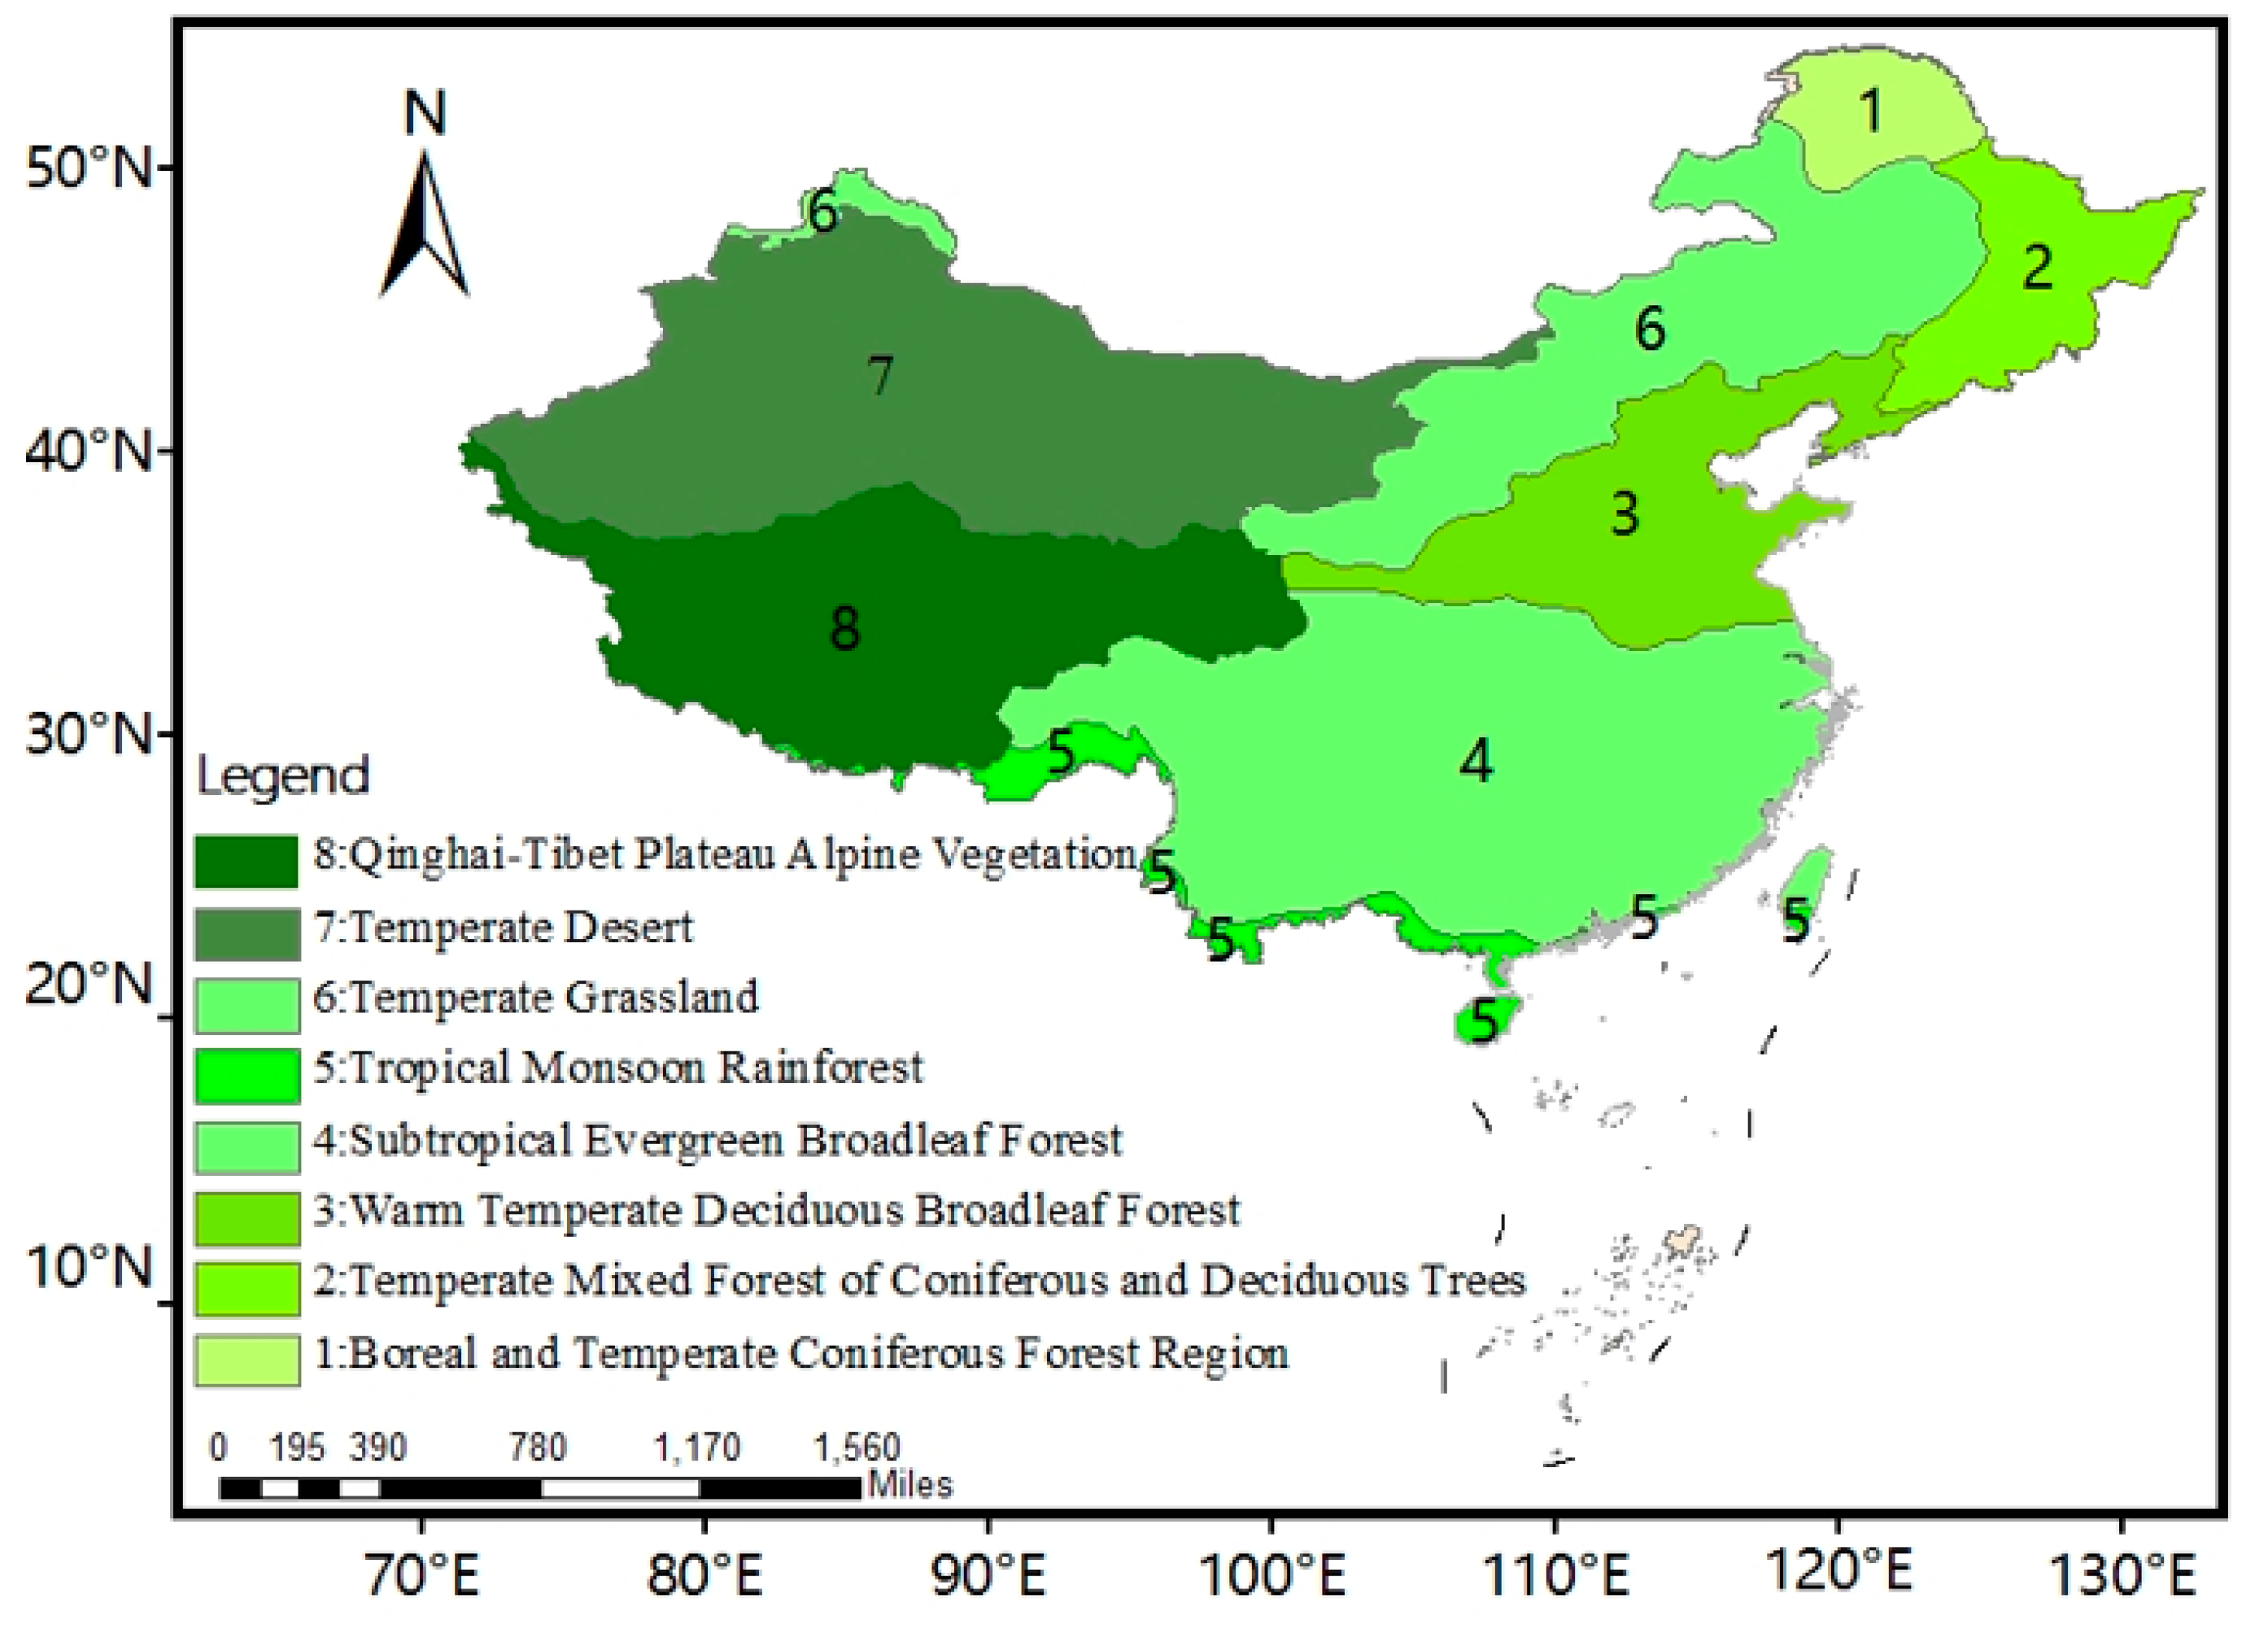
2.1.2. National Vegetation Zoning Data

The spatial variation highlighted by vegetation zoning can reveal the consistency in the distribution of vegetation and its connection with the environment [45,46,47]. Vegetation has close correlations with environmental factors such as precipitation, temperature, topography, and soil [48]; in particular, the dominant factor is precipitation, which exhibits strong correlations and relative uniformity in its spatial distribution. Essential ecological-climatic indicators, including precipitation sum, seasonal distribution, and warmest and coldest month temperatures, often roughly match or correspond to the distribution of vegetation types [49,50]. Within identical vegetation type regions, these inherent natural geographic elements are interlinked, inadvertently creating a partitioning of natural geographic components through vegetation zoning [51,52,53]. Notably, geomorphic units frequently coincide with vegetation types and divisions, particularly in vast mountain ranges and plateaus. The peripheries of these geographic attributes commonly delineate climatic zones, impacting the movement and growth of plant species, and thus often serving as boundaries for vegetation zoning. Consequently, segmentation based on vegetation types can also aid in subdividing various terrains within the study area [54]. This study is primarily focused on downscaling GPM satellite precipitation data. Dividing the study area according to vegetation regions can offer a better understanding of the interrelation between precipitation and geographic elements within the region [55,56]. As a result, the division of the study area in this research hinges on vegetation regions. As shown in Figure 1, the vegetation zoning data employed in this study are sourced from the 1:1 million vegetation map provided by the Resource and Environment Science Data Center of the Chinese Academy of Sciences (http://www.resdc.cn (accessed on 15 March 2023)). The entire country is partitioned into eight regions, delineated by specific vegetation types and geographic traits in designated areas. These regions encompass the cold temperate coniferous forest, temperate coniferous deciduous broad-leaved mixed forest, warm temperate deciduous broad-leaved forest, subtropical evergreen broad-leaved forest, tropical monsoon rainforest, rainforest, temperate grassland, temperate desert, and the cold vegetation region of the Qinghai–Tibet Plateau.

2.1.3. Basic Geographical Data

The meteorological station data, obtained from the daily-scale dataset of the China Meteorological Data Sharing Service System (http://data.cma.cn/ (accessed on 15 March 2023)), encompassed daily precipitation records spanning January to December 2019 across the nation. The dataset included a total of 2423 operational meteorological stations, and their geographical distribution is shown in Figure 2. Primarily, this study relied on this dataset to perform correlation analysis. The selection of environmental factors plays a pivotal role in shaping the quality of downscaling outcomes. Drawing from the conclusions of multiple researchers [57,58,59], it has been firmly established that the factors exerting the most significant influence on precipitation are NDVI and DEM. Given China’s expansive geography and the noteworthy variations in temperature and humidity among diverse vegetation regions [60], this experiment integrated a range of environmental data. This encompassed a DEM sourced from the National Basic Geographic Information Database (http://www.gscloud.cn (accessed on 15 March 2023)), along with temperature (TEM), humidity, and NDVI. Temperature (TEM) and humidity data were acquired from the Climate Research Unit and the WorldClim dataset, while NDVI data were synthesized on a monthly basis from the MODIS MOD13A product. All of the aforementioned data shared a spatial resolution of 1 km × 1 km. This study centers its attention on the downscaling of GPM satellite precipitation data at a spatial resolution of 10 km × 10 km. Consequently, all supplementary data underwent resampling to a 10 km resolution, facilitated by the monthly average methodology. Following this, the processed supplementary data underwent correlation analysis in conjunction with GPM satellite precipitation data for the purpose of the study.

2.2. Model Selection

The Extreme Random Trees technique, an advanced iteration of decision trees and a derivation from random forest, presents itself as an ensemble learning methodology. Compared to other machine learning models, Extreme Random Trees demonstrate excellent feature reduction capabilities. In precipitation downscaling tasks, they can effectively manage a large number of input attributes such as NDVI, DEM, temperature, and humidity without requiring extensive dimensionality reduction preprocessing. This technique excels in revealing the influences of multiple independent variables (X1, X2, …, Xn) on the dependent variable Y [61,62]. Within the context of our investigation into precipitation downscaling, we introduced environmental factors such as NDVI, DEM, temperature, and humidity, while assigning GPM satellite precipitation as the response variable to construct a downscaling model. Given the data organization, the Extreme Random Trees model aligns seamlessly with our research objectives. Taking into account the complex arrangement of precipitation data, the Extreme Random Trees model emerges as a fitting choice. Due to the complex temporal and spatial variations in precipitation data, coupled with the intricacies of prediction, traditional machine learning models may tend to overfit noise. However, the Extreme Random Trees model introduces additional randomness during the node splitting process by randomly selecting an attribute from the full attribute set. This approach aims to enhance the diversity of the model, reduce the risk of overfitting to training data, and more effectively capture nonlinear relationships within the dataset. Furthermore, the construction process of the Extreme Random Trees model can be easily parallelized, meaning it can efficiently utilize multi-core processors or distributed computing resources, speeding up the model training process, especially when dealing with large-scale data. Consequently, this elevates the model’s flexibility and resilience.
In summary, the Extreme Random Trees method augments the model’s randomness and diversity by infusing randomness into the feature selection and threshold determination processes. This amplified randomness helps reduce variability and mitigate the potential risk of overfitting. While maintaining a high degree of accuracy, this technique also boasts sturdy data mining capabilities and a proficiency in accurately capturing nonlinear relationships. This model demonstrates strong robustness against outliers and noisy data, thus ensuring a higher level of stability. It is well equipped to unveil the complex interactions among environmental factors and precipitation. Within the framework of our study on precipitation downscaling, the Extreme Random Trees method demonstrates commendable classification accuracy.

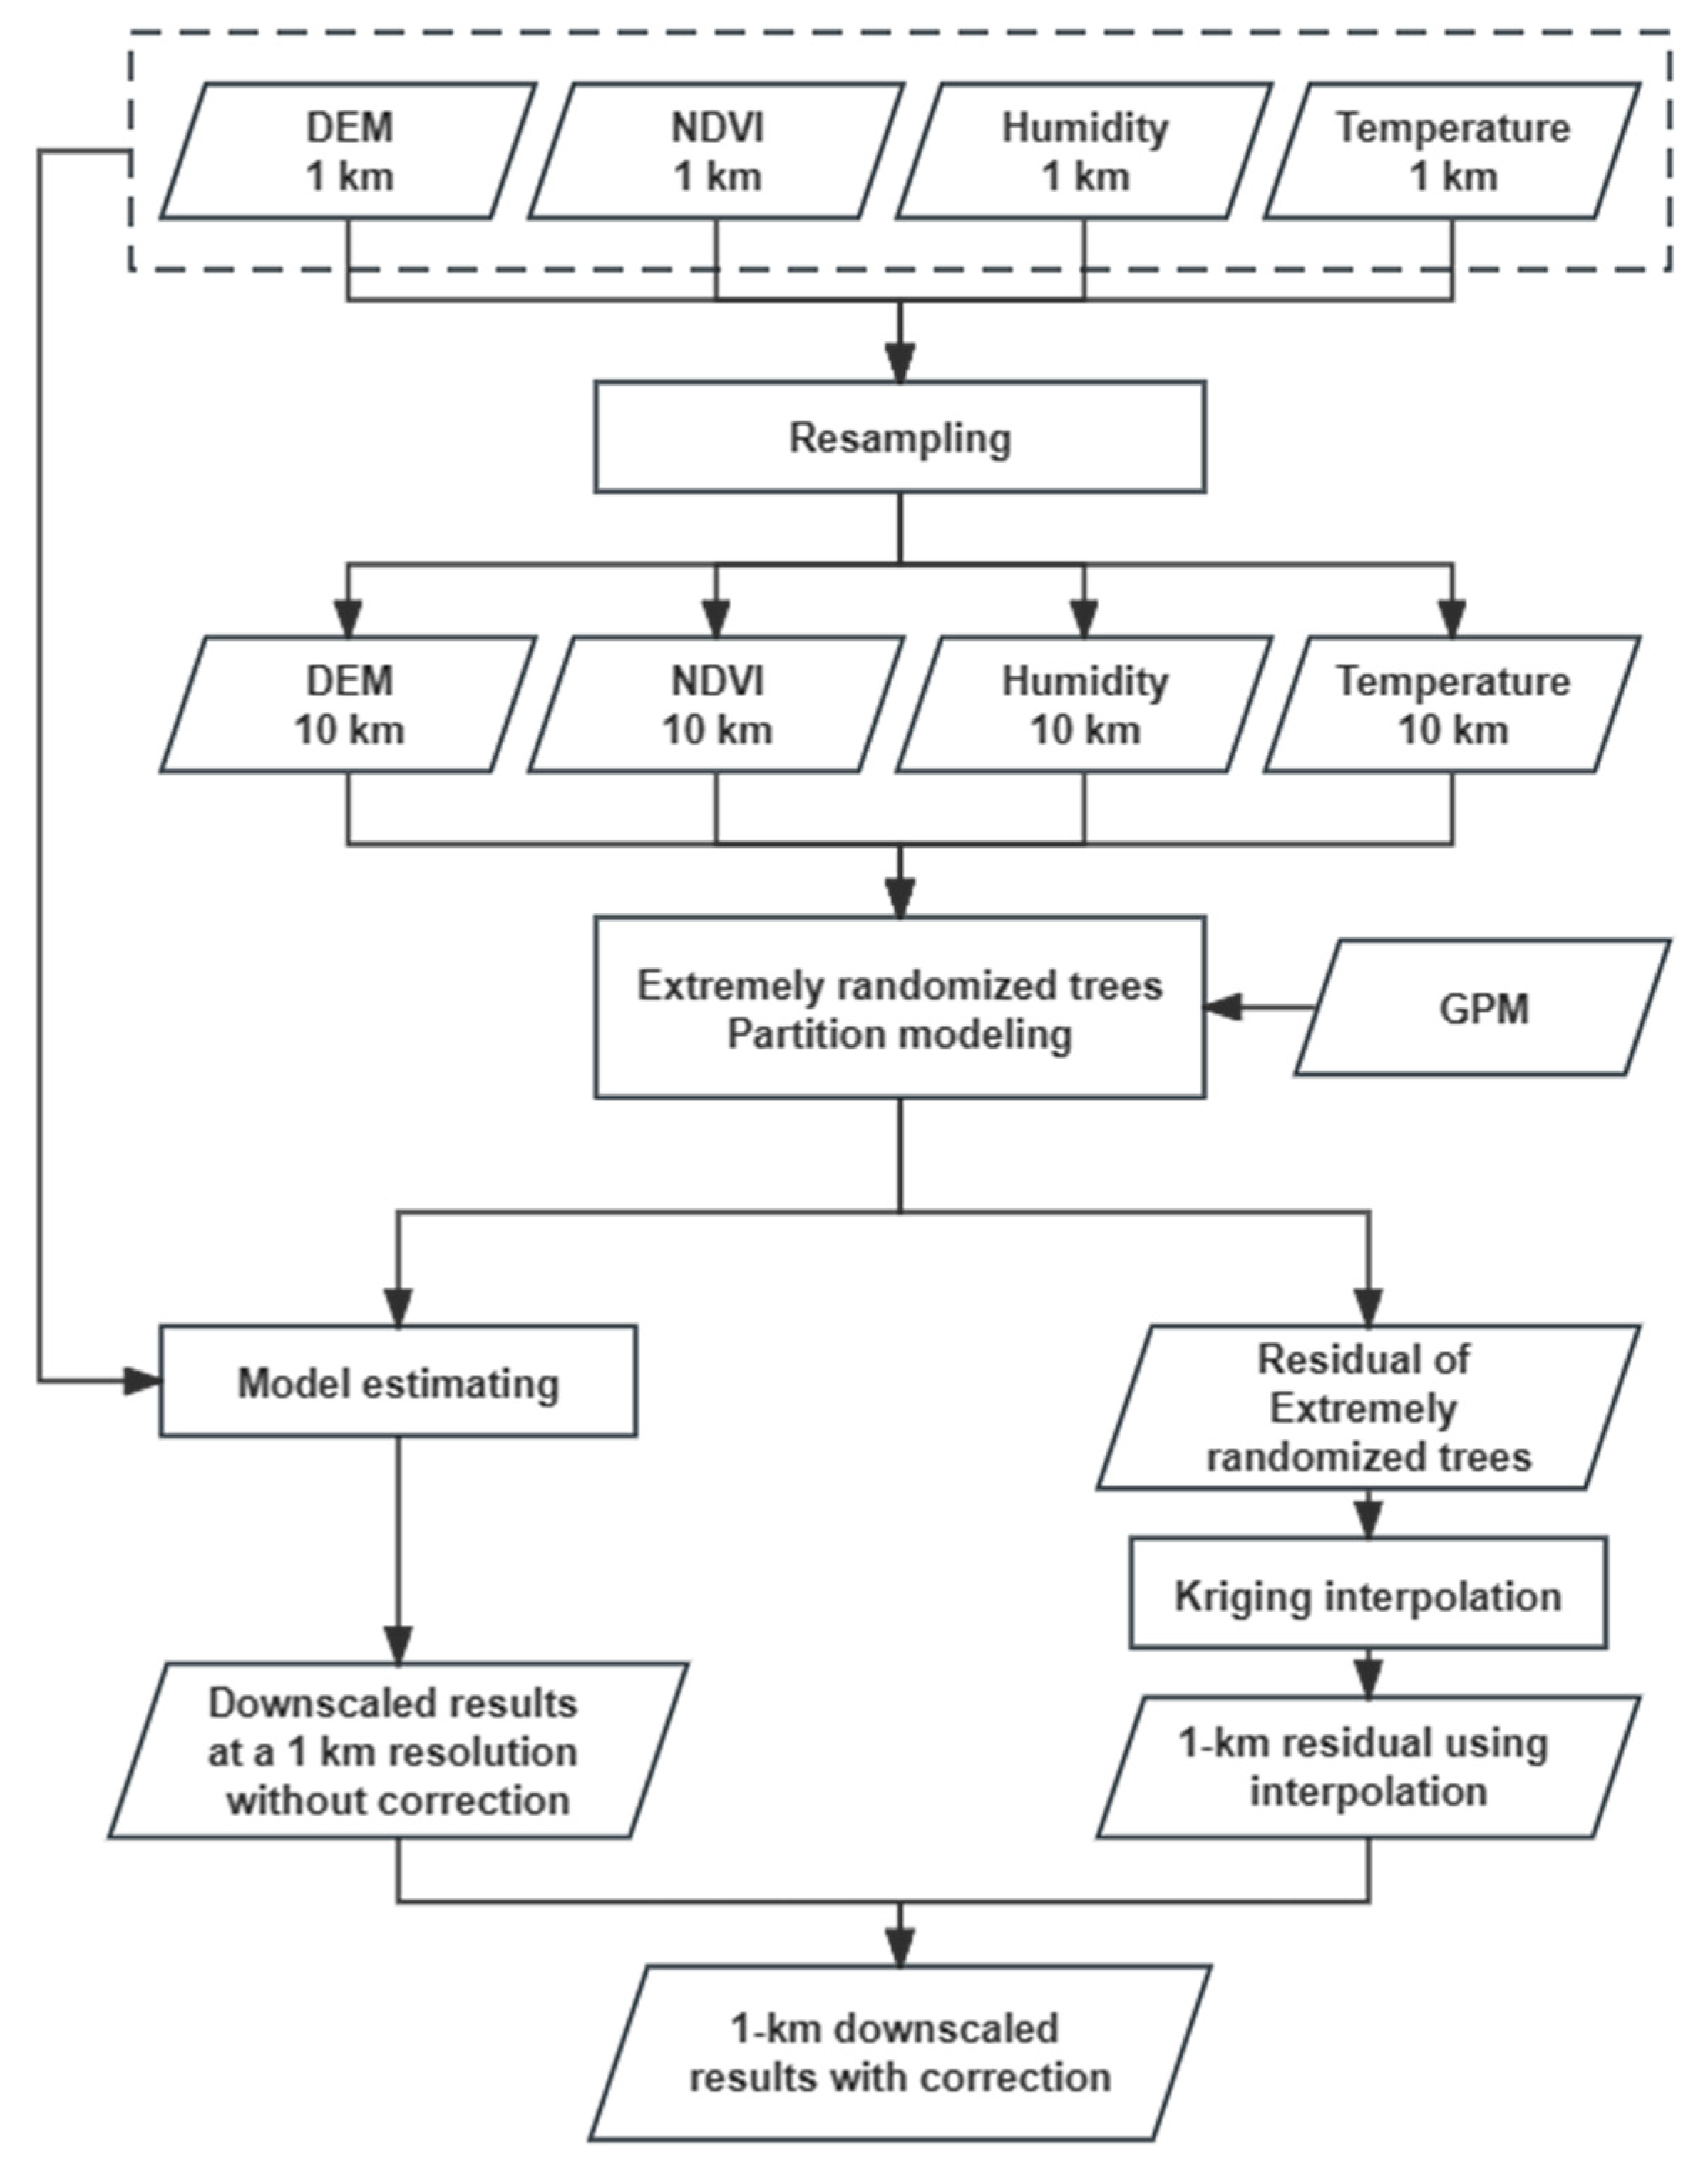
2.3. Experimental Process

The spatial downscaling method is based on the relationship between precipitation and surface features. The fundamental idea behind downscaling is to first simulate the relationship between precipitation and surface features at coarser resolutions and then use this relationship, along with higher-resolution surface feature data, to obtain higher-resolution precipitation estimates [63]. Given the vast geographical expanse of China and the distinct spatiotemporal distribution patterns of precipitation, which exhibit significant variations across regions and seasons, downscaling models often struggle when not accounting for the temporal and spatial differences of precipitation. This can lead to poor generalization ability of the models. Vegetation zoning, on the other hand, can reveal the regularities of geomorphic units and vegetation distribution, and their close relationships with environmental factors such as precipitation in both time and space. Essentially, vegetation zoning divides natural geographical elements, including precipitation- related factors and different terrains. Exploring the relationship between precipitation and environmental factors within different vegetation regions can greatly enhance the model’s fitting accuracy. In comparison to traditional downscaling methods, this study takes into account spatial heterogeneity in vegetation growth and precipitation. Building upon previous downscaling approaches, the study proposes dividing the study area into 8 vegetation regions. For each season, data mining is performed separately for these 8 vegetation regions to establish the relationship between precipitation and surface features. The specific steps of the novel downscaling method proposed in this study are as follows:
(1)
Detecting and eliminating outliers and missing values from the original 1 km resolution NDVI, DEM, temperature, and humidity datasets. Due to the sufficient amount of data, a very small number of outliers can be removed from the images.
(2)
Resampling the 1 km resolution NDVI, DEM, temperature, and humidity data and co-locating them with GPM satellite precipitation data. In this step, GPM satellite precipitation data are projected onto the WGS84 projection with a resolution of 10 km × 10 km. Therefore, by averaging all 1 km resolution surface feature data within each 10 km pixel, they are resampled to 10 km. Finally, the resampled 10 km resolution NDVI, DEM, temperature, humidity, and other surface feature data are combined with GPM satellite precipitation data values for the same location to generate data samples.
(3)
According to the downloaded vegetation zoning data of China, the generated 10 km resolution data samples are divided into 8 vegetation regions. Within each vegetation region, they are further divided by four seasons: spring, summer, autumn, and winter. This yields a total of 32 training samples: 8 regions × 4 seasons.
(4)
Using GPM satellite precipitation data as the target and the 10 km resolution NDVI, DEM, temperature, humidity, and other surface feature data as inputs, Extreme Random Tree models are established separately for each of the 4 seasons and 8 regions.
(5)
The 1 km resolution NDVI, DEM, temperature, humidity, and other surface feature data are input into the relationships obtained in step (4), resulting in high-resolution monthly precipitation predictions (Pre1km) for each vegetation region.
(6)
Residual correction is a necessary step in data-driven downscaling methods, which corrects the predicted precipitation. The monthly precipitation predictions (Pre1km) obtained in step (5) for each region are resampled to 10 km precipitation data using a mean-based method. The model’s residuals are obtained by subtracting the original GPM data from the resampled 10 km precipitation data.
(7)
Using kriging interpolation, the residuals generated in step (6) are interpolated to a spatial resolution of 1 km, and the interpolated residuals are added back to the Pre1km results generated in step (5) to obtain the final precipitation results. This step is performed using ArcGIS (Version: 10.7) software.
(8)
According to the distribution of meteorological stations in China, the locations of the stations are selected as sample points, and corresponding predicted values and observed values are extracted for accuracy evaluation.
A flowchart is provided in Figure 3 to illustrate the main steps of the new downscaling algorithm.

2.4. Evaluation Metrics

In this study, three evaluation metrics [64] were employed to assess the established models: mean absolute error (MAE), root mean square error (RMSE), and coefficient of determination (R2). Firstly, the corrected prediction results were compared with the actual observed data and analyzed to assess the accuracy of the machine learning models. Secondly, the reliability of the method was evaluated by comparing the correlation between the predicted precipitation results before and after partitioning regions with the original GPM data.
RMSE = 1 M i = 1 M P r e i O b s i 2
MAE = 1 M i = 1 M | P r e i O b s i |
R 2   = 1 i = 1 M ( O b s i P r e i ) 2 i = 1 M ( O b s i O b s ¯ ) 2
where M represents the number of meteorological stations; O b s i denotes the observed precipitation data at the i -th meteorological station location; P r e i represents the estimated GPM satellite precipitation data at the i -th meteorological station location; O b s ¯ are the mean values of the observed precipitation data and the estimated GPM satellite precipitation data, respectively.

3. Results

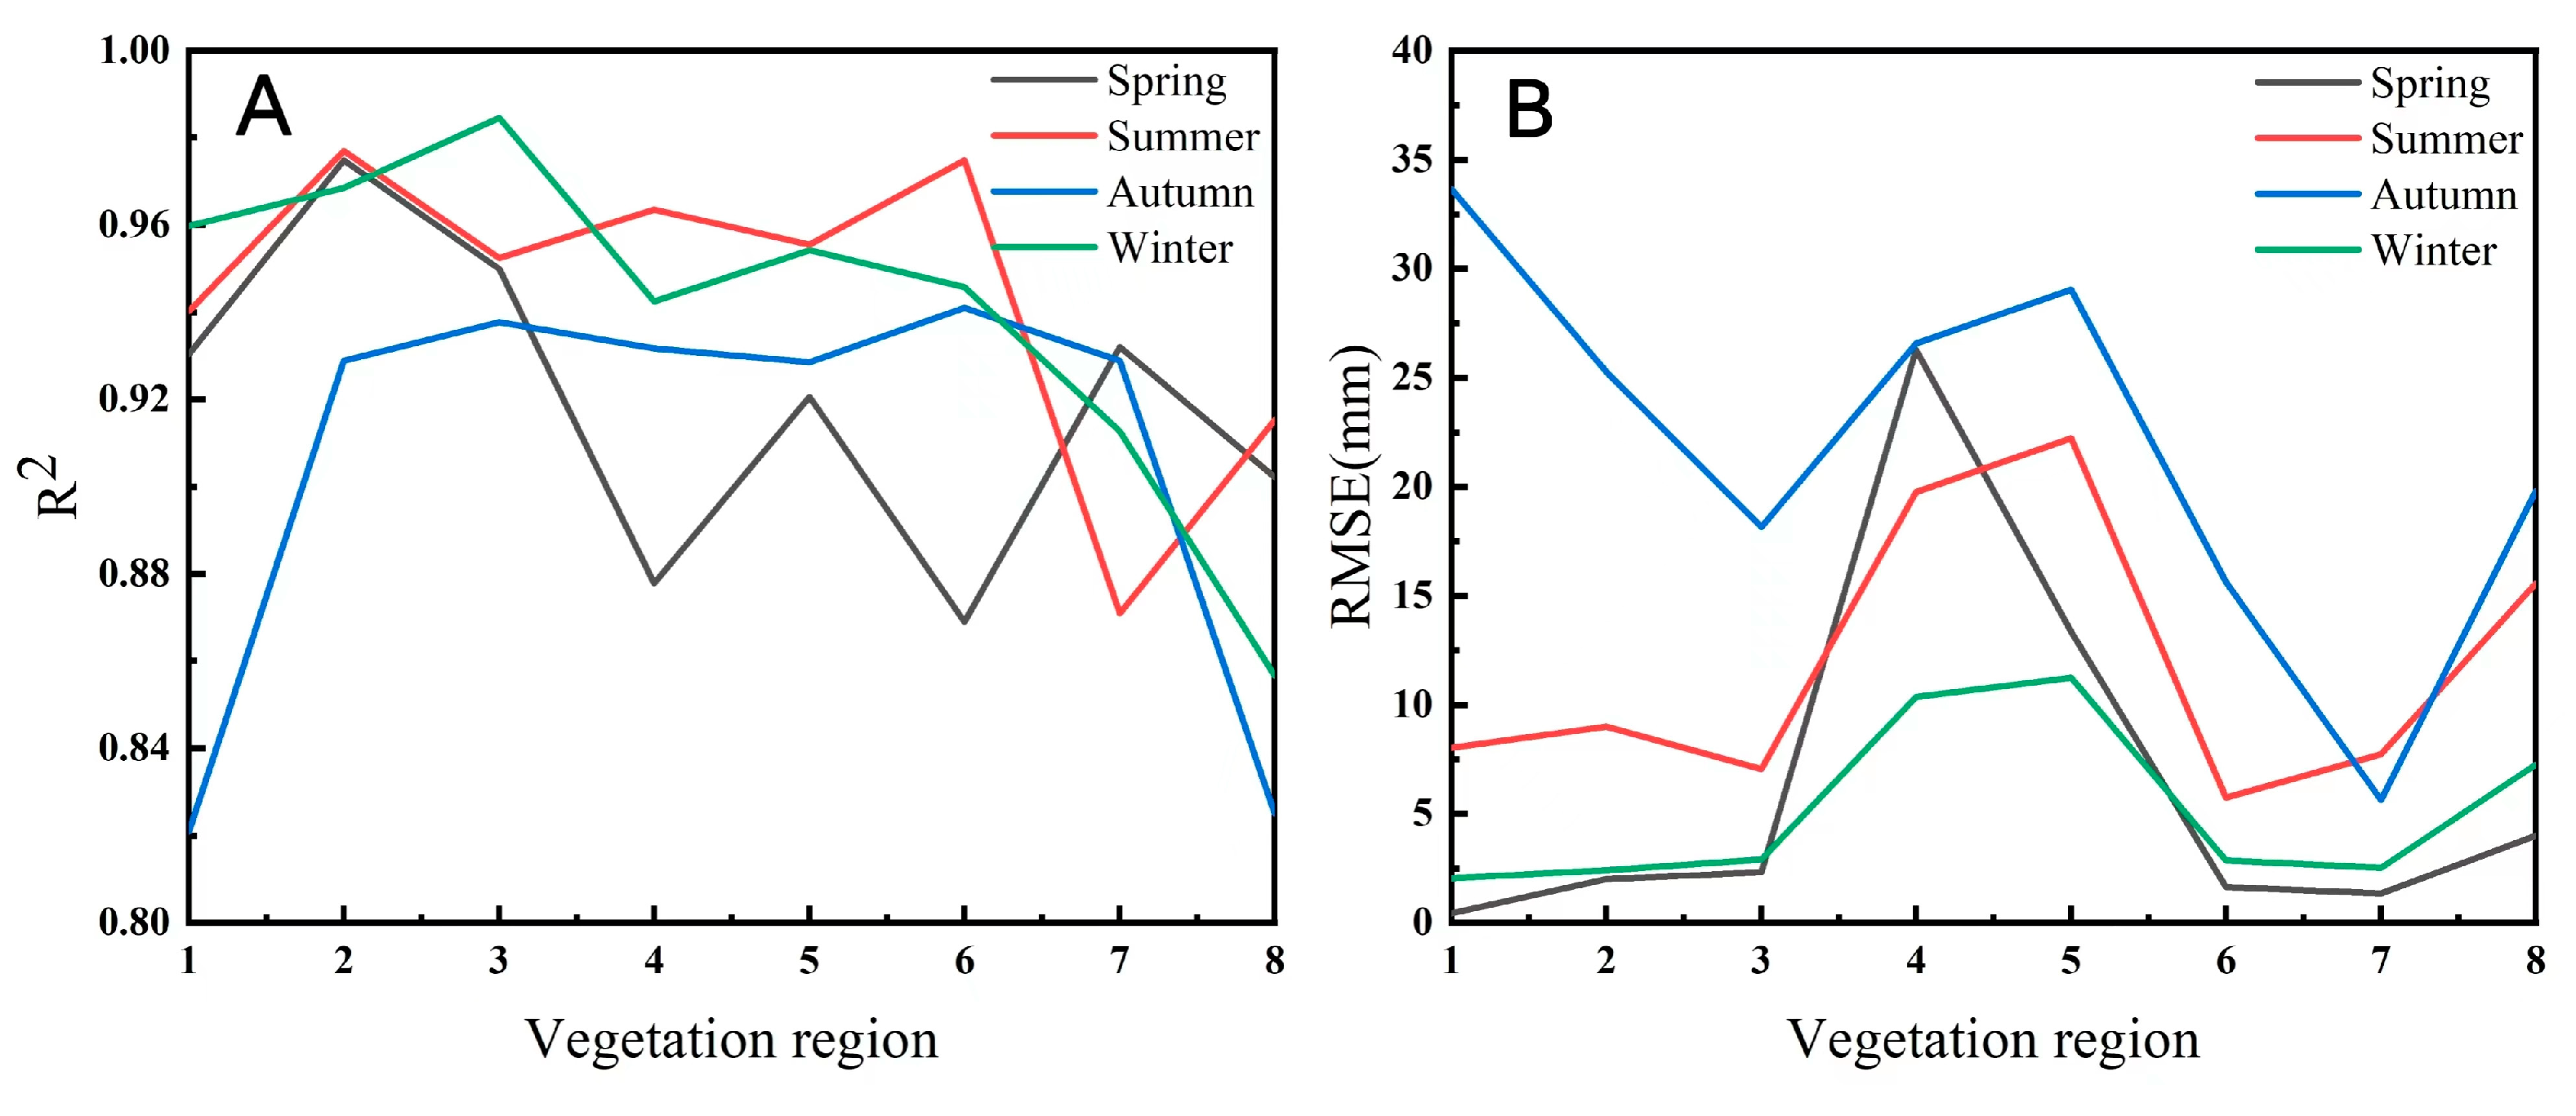
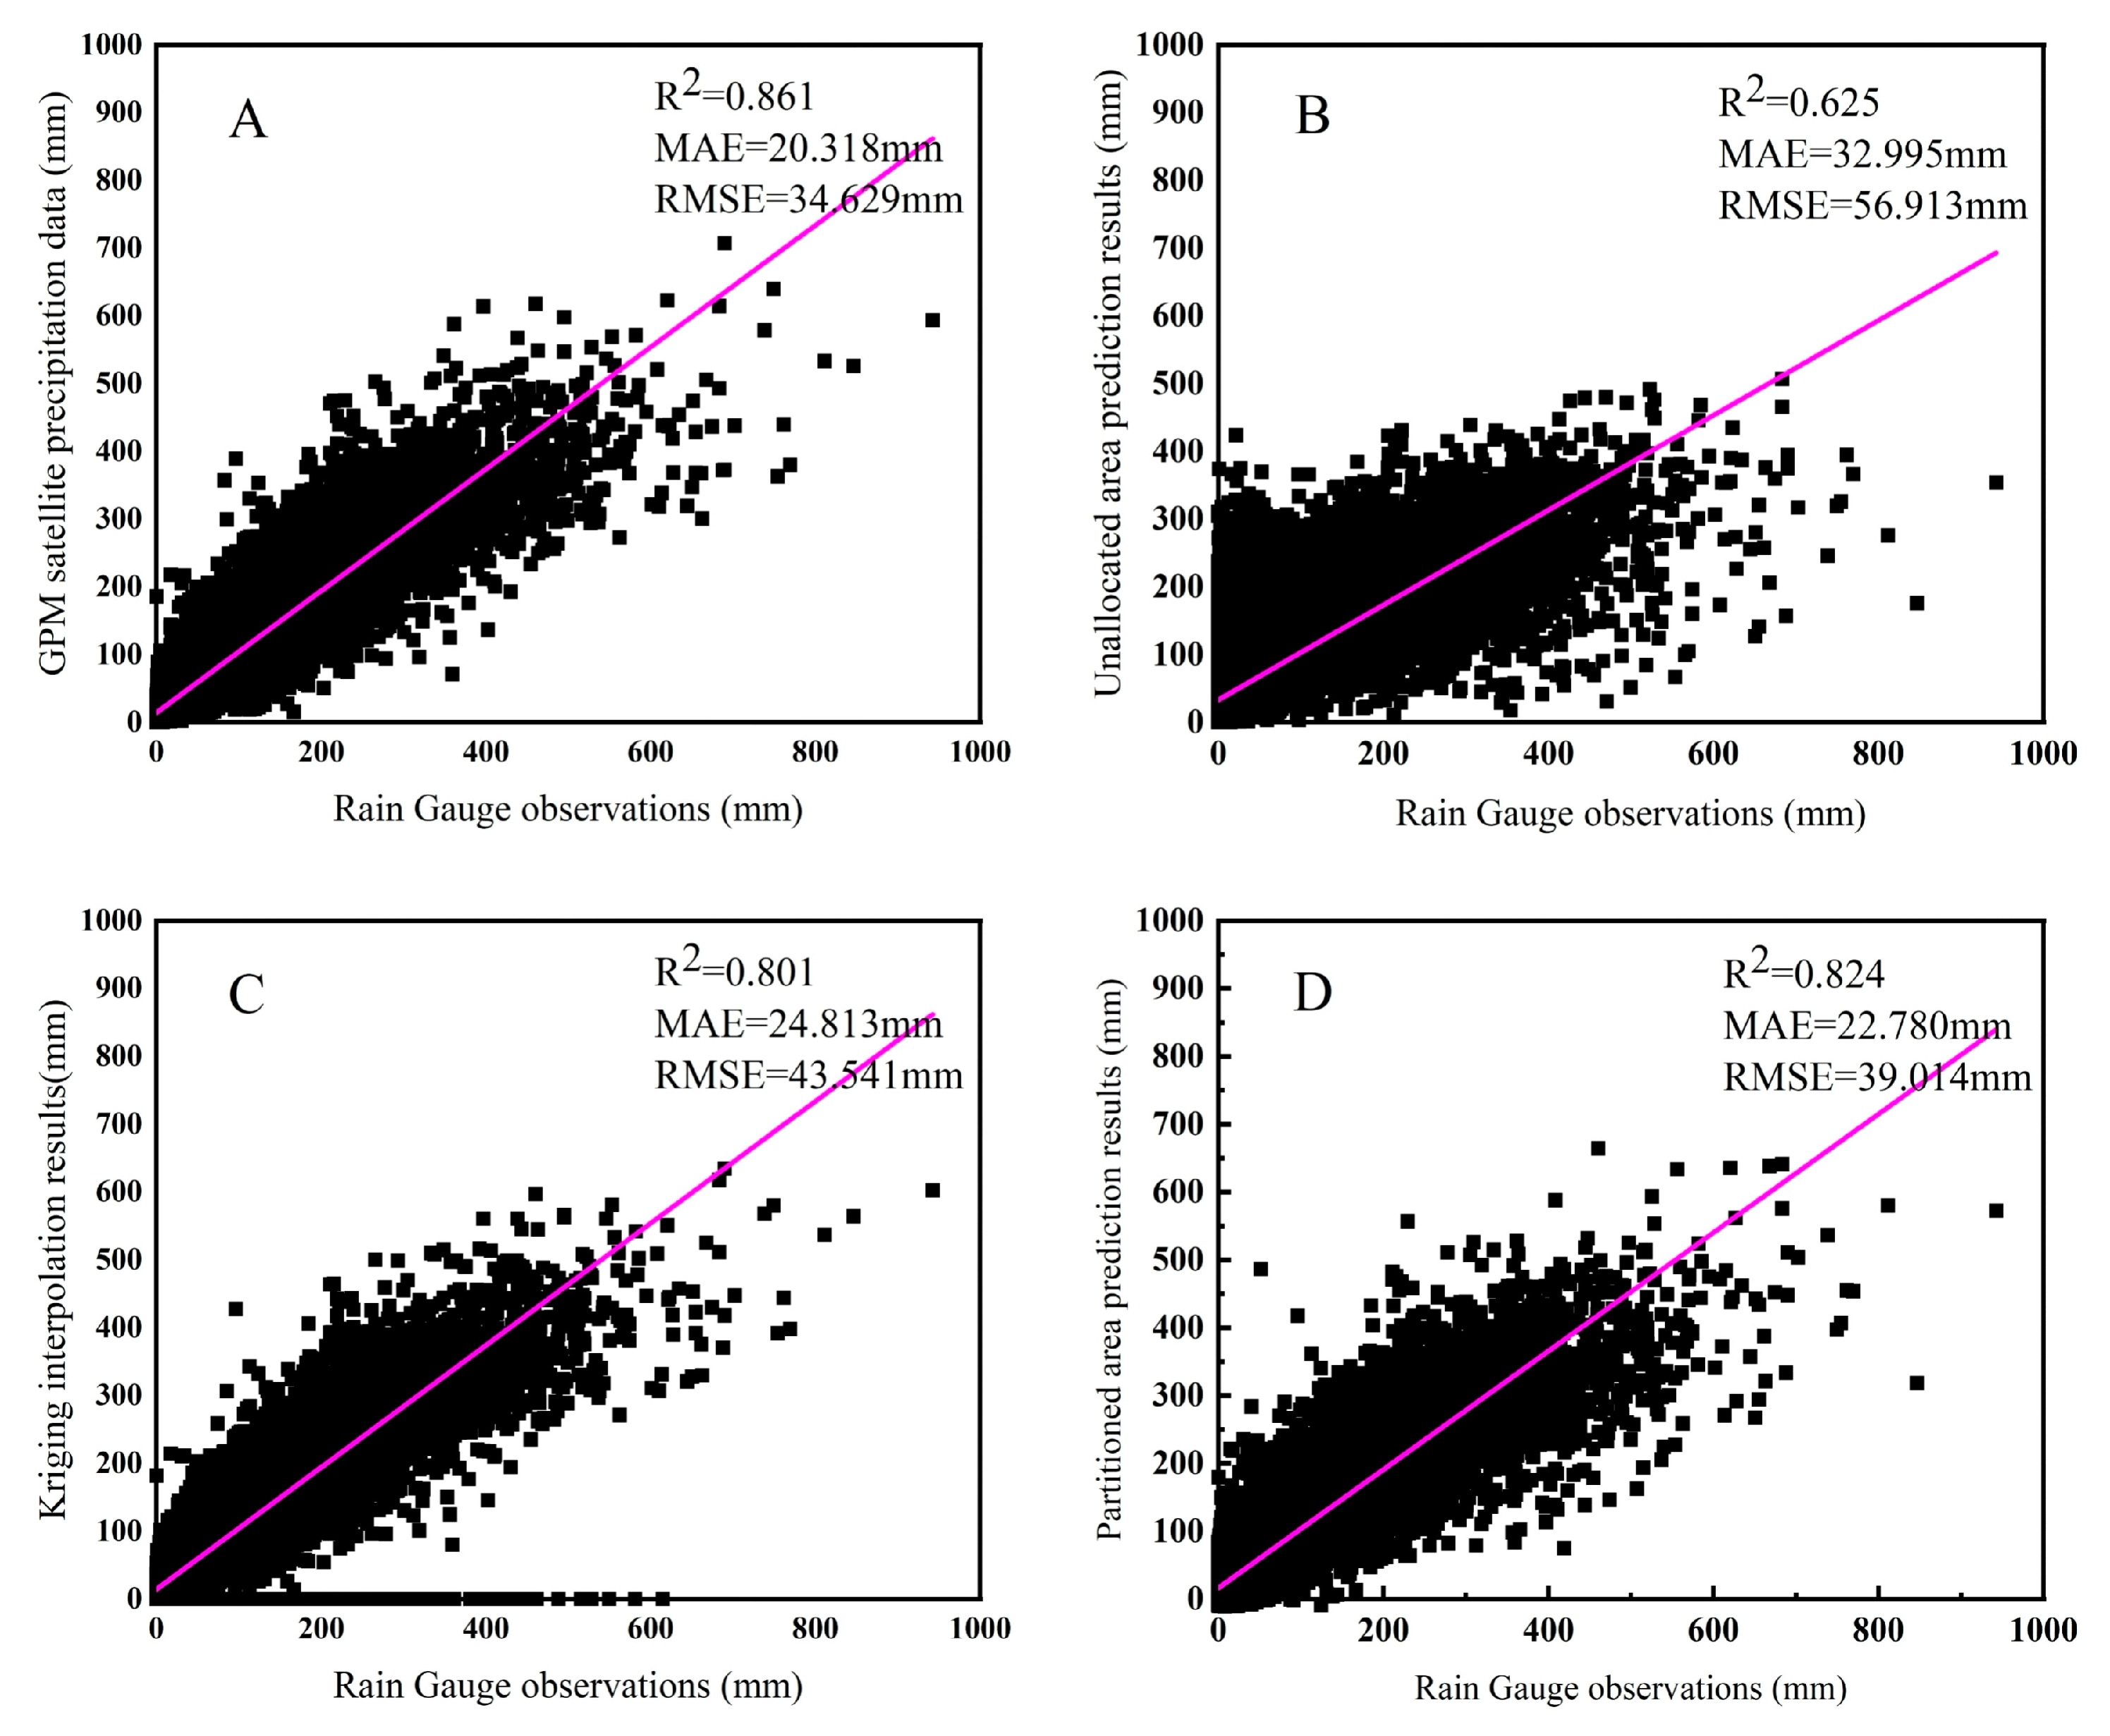
3.1. Downscaling Model Accuracy Evaluation

In this study, using the Chinese region as a case study, we extensively addressed the challenge of inadequate model generalization stemming from disparate data distributions due to diverse meteorological characteristics, geographical settings, and seasonal fluctuations within the study area. The study area was systematically partitioned based on vegetation types and seasonal variations. The precision of the models trained and validated within each vegetation region and season is exhibited in Table 1, providing a comparative analysis with the original GPM precipitation data. A prominent observation from Table 1 is that the majority of model coefficients of determination (R2) surpass 0.9, with an average R2 value of 0.927. The highest average R2 value is 0.944, while the lowest reaches 0.905. This unequivocally underscores the heightened dependability of models trained through this approach across both relatively humid and arid seasons. The R2 values for certain areas are approximately 0.85. Figure 4 illustrates the values of R2 and RMSE for each season in the eight regions. The warm–temperate deciduous broad-leaved forest region in central and eastern China achieved the most notable R2 value during the winter season. Located in the central and eastern parts of China, this region experiences dry winter conditions, characterized by low air humidity and comparably modest rainfall. The absence of overestimation in regions with lower precipitation post-segmentation substantiates the model’s robust fitting performance. On the contrary, the R2 value is lowest in the boreal and temperate coniferous forest region. This is primarily due to its location in northeastern China, where precipitation is lower, and the station distribution is sparse, resulting in limited validation data points, which in turn affects the accuracy of the results. Nevertheless, the R2 value still reaches 0.821, validating the model’s capability to predict regions with elevated precipitation. RMSE encapsulates information from MAE, making it more sensitive to errors. Regions with higher RMSE values are predominantly concentrated in the southeastern and southern parts of China. These areas encounter relatively humid conditions throughout the year, characterized by substantial precipitation, and are susceptible to the impact of coastal typhoons due to their proximity to the coastline. The substantial disparity between maximum and minimum precipitation values contributes to larger RMSE values. However, the overall precision remains relatively high.
By contrasting the anticipated precipitation outcomes with the observed information from meteorological stations, the precision and functionality of the model can be comprehensively and objectively assessed, directing model enhancement and practical applications. In this study, the initial GPM precipitation data, predictions before division, and predictions after division were separately juxtaposed with the genuine station data. As depicted in Figure 5, it can be noted that in comparison to the station data, the R2 for GPM precipitation data is 0.861, while conventional global downscaling techniques only attain an R2 of 0.625. Despite achieving spatial downscaling, this approach encounters low accuracy, implying limited model adaptability. In contrast, the technique proposed in this article attains an R2 of 0.824 in projected outcomes. Even after reducing the spatial resolution of GPM satellite precipitation data from 10 km to 1 km, it still maintains a high level of accuracy. Comparing Figure 5A,D with reference to the station data, it can be observed that the difference in R2 between our experimental results and the original GPM data is 0.037, the difference in MAE is 2.46, and the difference in RMSE is 4.386. As shown in Figure 5, it can also be seen that the method proposed in this paper for downsizing by partitioning the region performs better than kriging interpolation and global downscaling methods. On the whole, the recommended approach of downscaling based on vegetation categories, partitioned areas, and seasons displays exceedingly high precision and robust generalization capability.

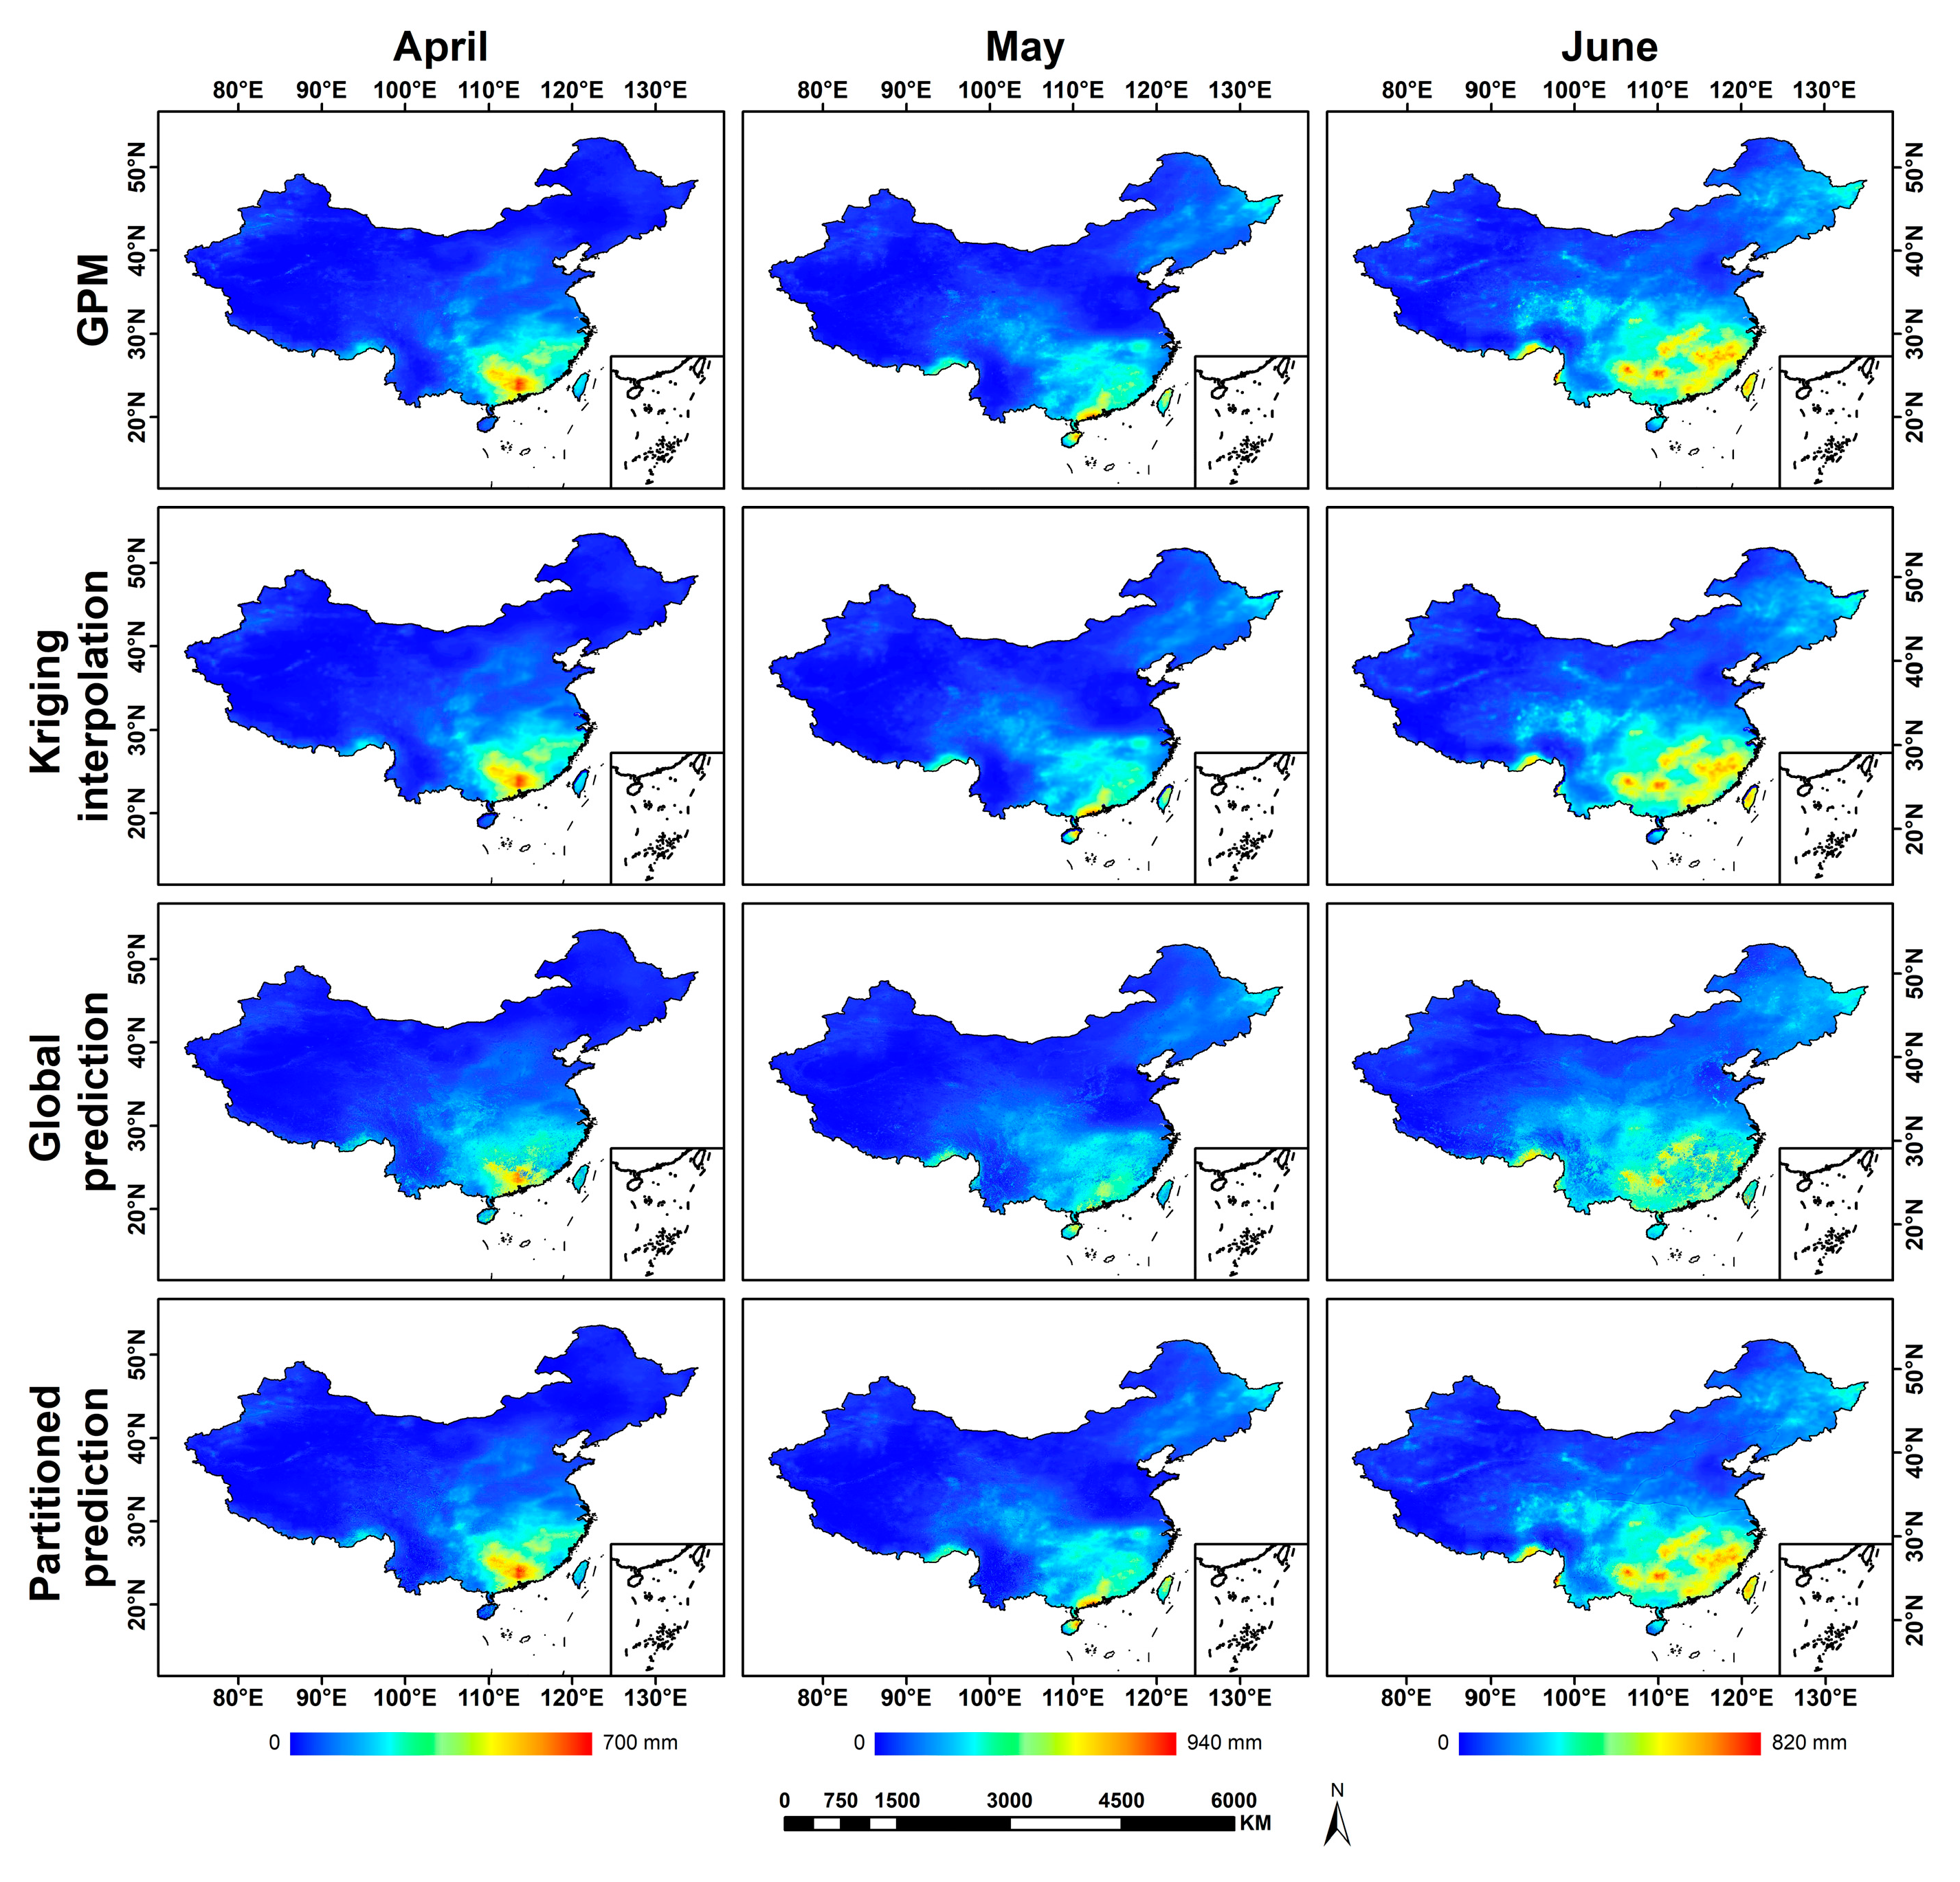
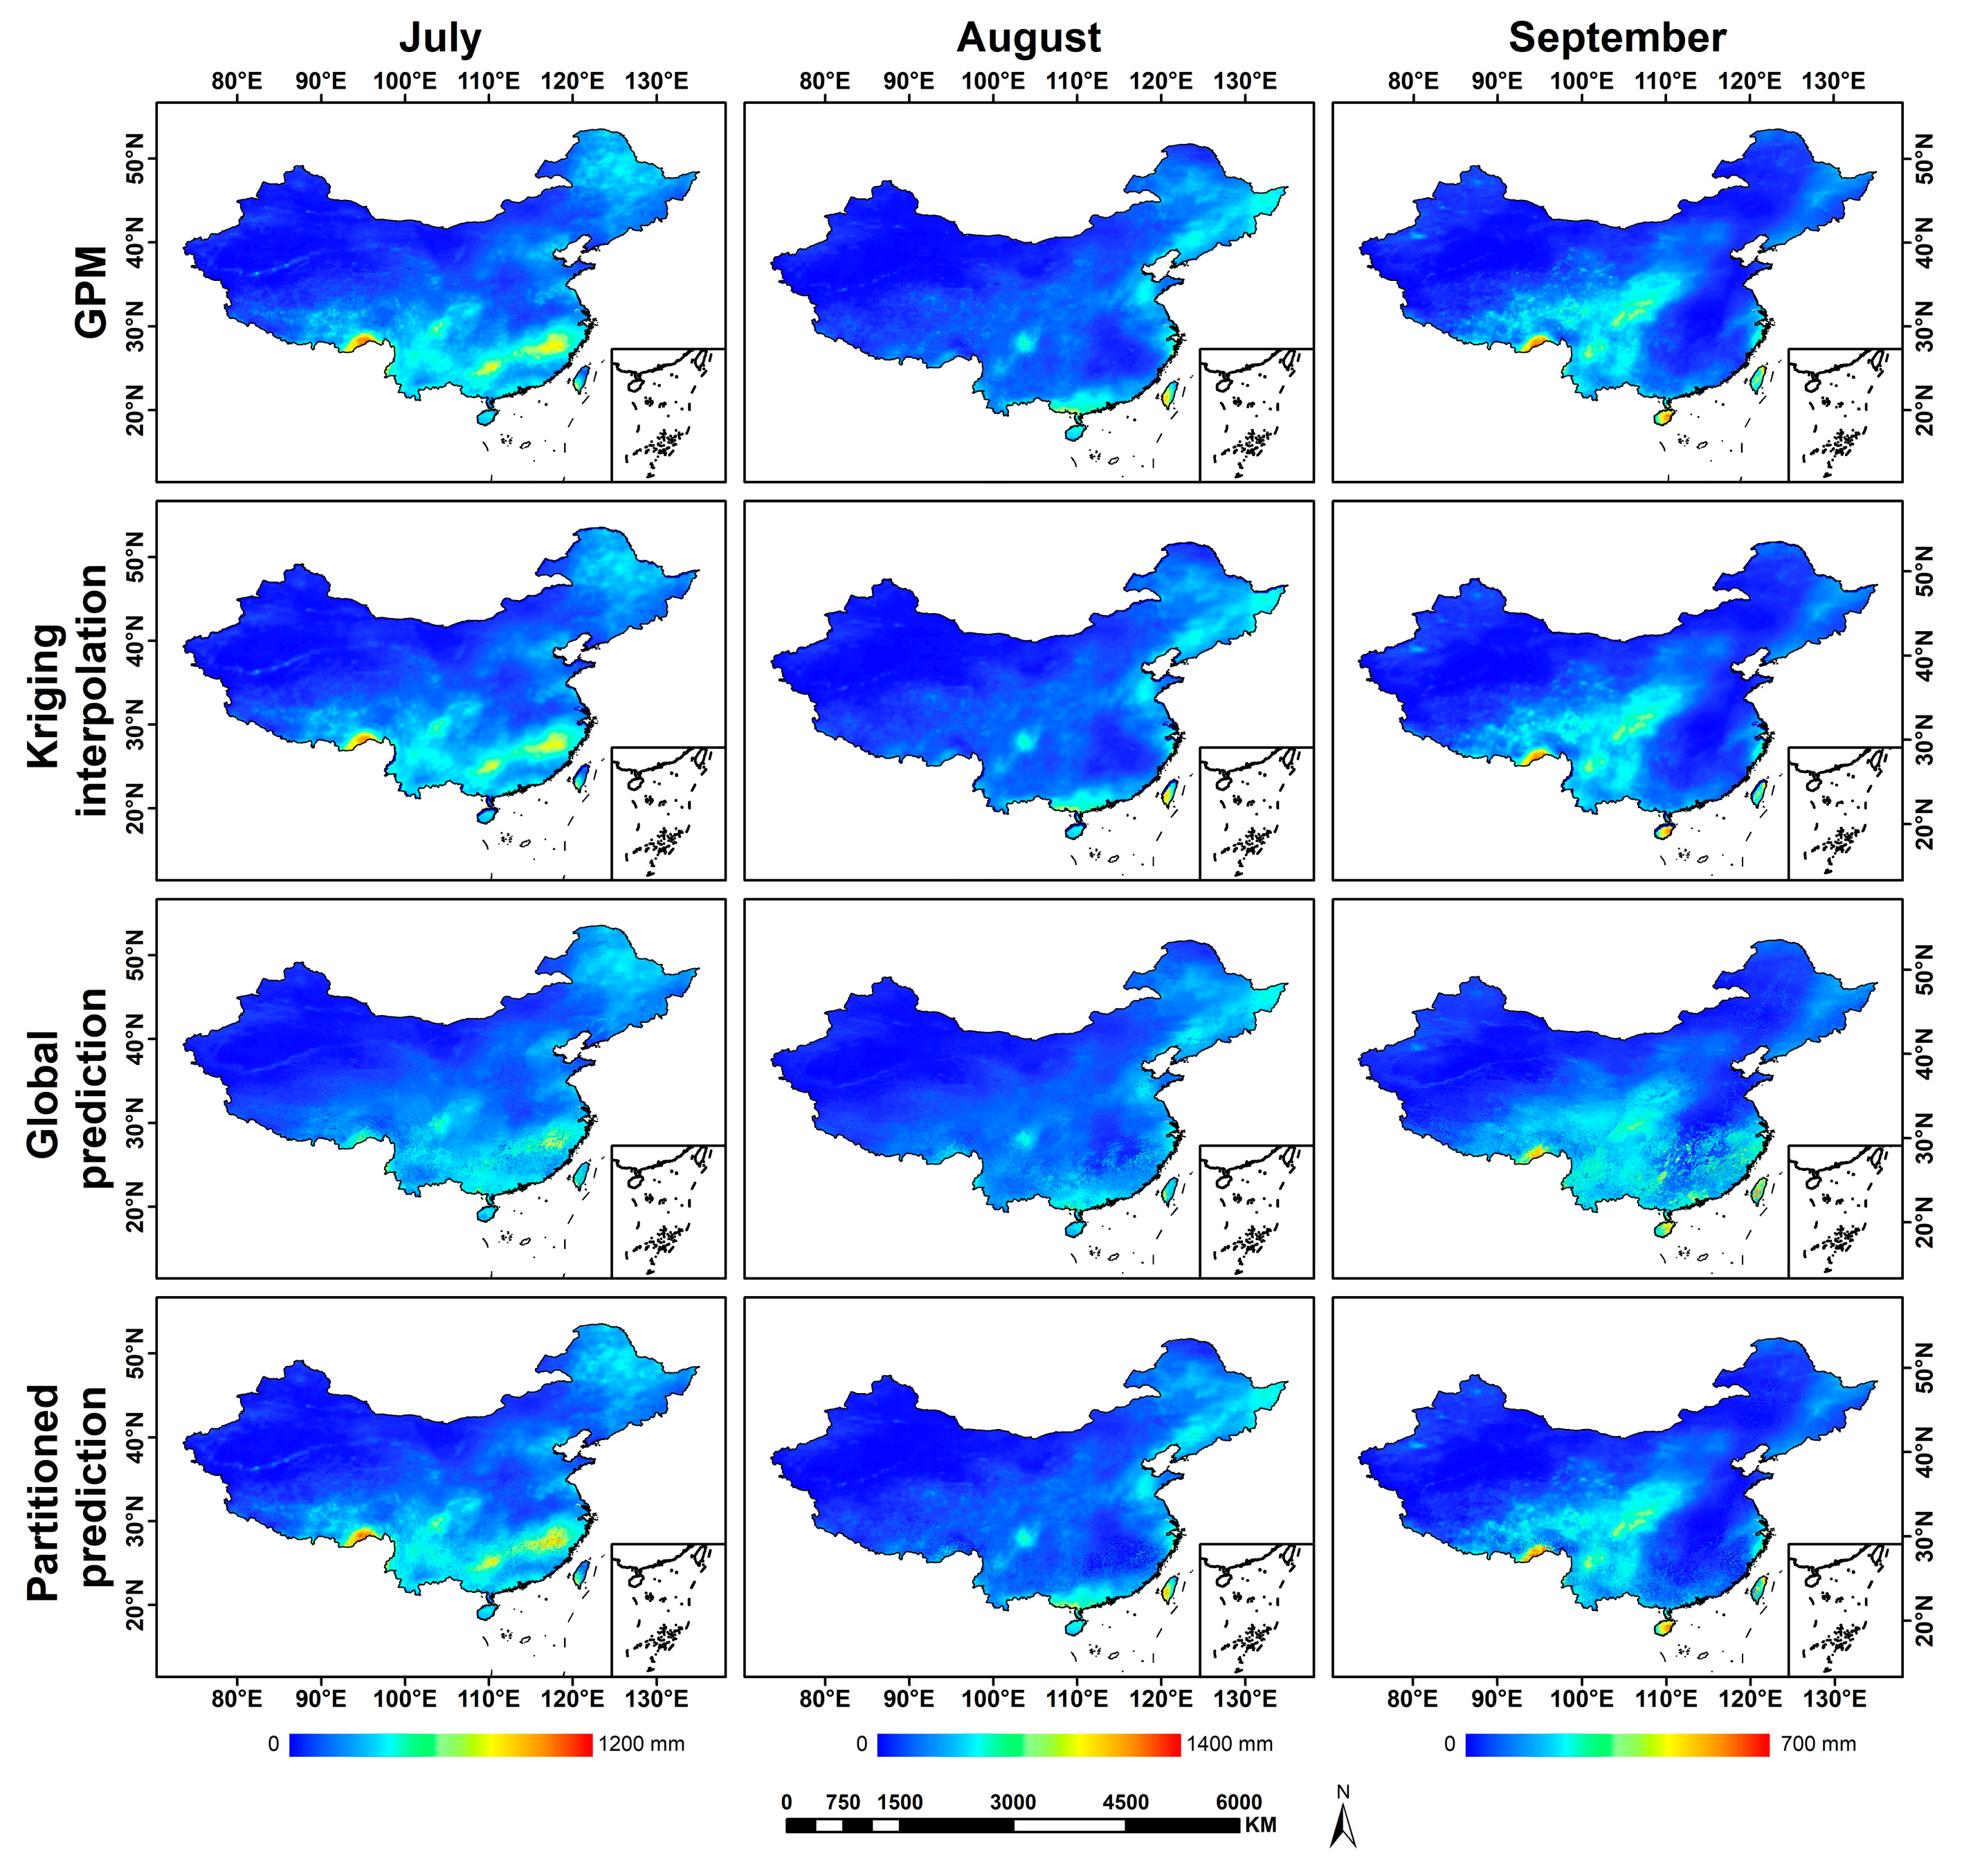
3.2. Downscaling Results and Analysis

Our objective is to achieve spatial downscaling of the GPM satellite precipitation data with a spatial resolution of 1 km, ensuring that the final prediction outcomes demonstrate a high level of accuracy in comparison to the GPM data, thereby making them suitable for widespread application. Therefore, within this context, we conduct a comparative analysis between the GPM data, predictions made without partitioning, predictions made with partitioning, and results after residual correction. As illustrated in Table 2, without partitioning, the model’s R2 stands at a mere 0.738, accompanied by a RMSE of 45.916. This substantial error arises from the expansive land area of China, leading to notable disparities in precipitation patterns due to varying conditions. For instance, the northern region experiences pronounced seasonal effects and remains relatively arid throughout the year, while the southern and coastal areas are significantly impacted by monsoons, resulting in higher humidity levels. Conventional downscaling methods trained the model without adequately accounting for regional climatic attributes, terrain characteristics, and other influential factors, consequently leading to subpar model generalization in specific areas. As highlighted in Table 2, the results of kriging interpolation for downscaling show R2, MAE, and RMSE values of 0.891, 11.480, and 29.017, respectively, compared to the original GPM data. While the downscaled results are superior to those of the global downscaling method, kriging interpolation has certain limitations when dealing with large-scale data, and its downscaled results are not as good as those achieved by the method proposed in this paper. The implementation of the approach proposed in this paper yields a marked enhancement in accuracy. The downscaled outcomes closely align with the original GPM satellite precipitation data, showcasing an R2 of up to 0.949, and MAE and RMSE of 8.887 and 20.175, respectively. With the foundation of achieving spatial downscaling, all metrics have reached elevated levels. These findings suggest the advantageous role of residual correction in the downscaling method introduced in this study. Figure 6, Figure 7, Figure 8 and Figure 9 display the spatial downscaling results for each month of 2019, comparing GPM satellite precipitation data, the kriging interpolation method, the traditional downscaling method, and the method proposed in this study. From Figure 6, Figure 7 and Figure 8, it can be observed that the traditional global downscaling method tends to underestimate precipitation. However, Figure 9 reveals that in November and December, the traditional global downscaling method tends to overestimate precipitation. Figure 6, Figure 7, Figure 8 and Figure 9 collectively demonstrate that both kriging interpolation and our proposed regional downscaling method consistently align well with the original GPM data throughout the year. However, the results obtained from our proposed method exhibit higher accuracy, as they do not show significant overestimation or underestimation of precipitation. The data quality obtained through this method is superior, enhancing the spatial resolution of GPM data.

4. Conclusions

This paper introduces an innovative approach that involves segmenting the study area based on vegetation types and seasonal variations. Subsequently, independent modeling is applied to downscale the GPM satellite monthly precipitation dataset from 10 km to 1 km. By utilizing ground observation data from within China, we evaluate and compare the performance of this downscaling technique with established traditional algorithms. Furthermore, a meticulous analysis is conducted against the original GPM data. Drawing upon the findings of this study, the following conclusions are drawn:
(1)
By partitioning the study area based on months and vegetation elements, the Extreme Random Trees algorithm outperforms the global downscaling method used in traditional downscaling algorithms, as well as kriging interpolation, in precipitation downscaling. Compared to the original method, the proposed approach in this paper exhibits superior performance. This indicates that geographic location, vegetation type, and season have significant value in calibrating satellite precipitation amounts during downscaling of satellite precipitation datasets.
(2)
In the process of downscaling using satellite precipitation data, we discovered that in southeastern and southern China, including warm–temperate deciduous broad-leaved forests, subtropical evergreen broad-leaved forests, and tropical monsoon rainforests, regions characterized by high temperatures and abundant rainfall, and susceptible to typhoon influence, the GPM satellite precipitation data tend to overestimate actual precipitation. Conversely, in western and northern China, including cold–temperate coniferous forests, temperate mixed forests of coniferous and deciduous trees, temperate deserts, temperate grasslands, and the cold alpine vegetation of the Qinghai–Tibet Plateau, regions with relatively low precipitation, lower temperatures, lower soil humidity, and faster water evaporation, the GPM satellite precipitation data tend to underestimate actual precipitation. When an appropriate regression model is applied to regress the satellite precipitation dataset, the accuracy of the original satellite precipitation dataset significantly influences the performance of the downscaling algorithm.
(3)
Residual correction is a crucial step in the execution of our proposed downscaling algorithm. As evidenced by the results, downscaled results after residual correction are superior to those without residual correction. Therefore, in future downscaling research, attention should be given to residual correction when utilizing our proposed method.
In summary, the strategy of segmenting predictions according to vegetation categories and corresponding months has improved the accuracy of fitting precipitation to complex spatial characteristics and showcases a robust ability for generalization. This provides valuable perspectives for other investigations involving downscaling. The data from 2019 are representative and generalizable in our study because they cover various climatic and precipitation patterns, and the total precipitation does not show significant variations compared to other years. In our research, we extensively analyzed the data from that year to ensure that our experimental results are highly accurate and possess a degree of generalizability. This gives us reason to believe that our experimental approach is not only applicable to 2019 but also to some extent to other years. Furthermore, our regional downscaling approach is designed to address the underlying relationships among geographic factors and has been carefully optimized, leading us to believe it possesses a certain level of generality. We plan to consider expanding our research to other years in the future to comprehensively assess the performance and stability of our method. Moreover, this study primarily emphasized environmental factors associated with precipitation, including NDVI, DEM, temperature, and humidity. Subsequent investigations might contemplate the integration of additional environmental factors, such as wind speed and soil moisture, to offer a more comprehensive elucidation of precipitation patterns. Furthermore, forthcoming studies will consider broadening the geographical scope to encompass a wider array of regions. The ongoing exploration of classification methodologies and criteria for achieving geographically coherent zones will persist to attain a finer-grained delineation of the study area.

Author Contributions

Conceptualization, S.Z. and X.W.; methodology, X.W.; software, Y.Z.; validation, S.Z., X.W. and D.J.; formal analysis, J.L.; investigation, X.W.; resources, D.J.; data curation, S.Z.; writing—original draft preparation, X.W.; writing—review and editing, D.J.; visualization, S.Z.; supervision, S.Z.; project administration, S.Z.; funding acquisition, D.J. All authors have read and agreed to the published version of the manuscript.

Funding

This research received no external funding.

Institutional Review Board Statement

Not applicable.

Informed Consent Statement

Not applicable.

Data Availability Statement

The GPM data are sourced from the Data Services Center under the NASA Goddard Space Flight Center, a branch of the United States National Aeronautics and Space Administration (NASA). The GPM datasets can be accessed at the following link: (https://disc.gsfc.nasa.gov/datasets?keywords=GPM&page=1 (accessed on 15 March 2023)). The vegetation zoning data originate from the Resource and Environmental Science Data Center of the Chinese Academy of Sciences. The data can be accessed at the following link: (http://www.resdc.cn (accessed on 15 March 2023)). The meteorological station data are obtained from the China Meteorological Data Network. The data can be accessed at the following link: (http://data.cma.cn/ (accessed on 15 March 2023)). The DEM (Digital Elevation Model) data are sourced from the National Fundamental Geographic Information Database of China. The data can be accessed at the following link: (http://www.gscloud.cn (accessed on 15 March 2023)).

Conflicts of Interest

The authors declare no conflict of interest.

References

  1. Groisman, P.Y. Changes in the probability of extreme precipitation: Important indicators of climatic change. Clim. Chang. 1999, 42, 243–283. [Google Scholar] [CrossRef]
  2. Zhai, P.; Zhang, X.; Wan, H.; Pan, X. Trends in Total Precipitation and Frequency of Daily Precipitation Extremes over China. J. Clim. 2005, 18, 1096–1108. [Google Scholar] [CrossRef]
  3. Zhang, K.; Pan, S.; Cao, L.; Wang, Y.; Zhao, Y.; Zhang, W. Spatial distribution and temporal trends in precipitation extremes over the Hengduan Mountains region, China, from 1961 to 2012. Quat. Int. 2014, 349, 346–356. [Google Scholar] [CrossRef]
  4. Li, X.H.; Zhang, Q.; Xu, C.Y. Suitability of the TRMM satellite rainfalls in driving a distributed hydrological model for water balance computations in Xinjiang catchment, Poyang lake basin. J. Hydrol. 2012, 426–427, 28–38. [Google Scholar] [CrossRef]
  5. Li, L.; Hong, Y.; Wang, J.; Adler, R.F.; Policelli, F.S.; Habib, S.; Irwn, D.; Korme, T.; Okello, L. Evaluation of the real-time TRMM-based multi-satellite precipitation analysis for an operational flood prediction system in Nzoia Basin, Lake Victoria, Africa. Nat. Hazards 2009, 50, 109–123. [Google Scholar] [CrossRef]
  6. Brunsell, N.A. Characterization of land-surface precipitation feedback regimes with remote sensing. Remote Sens. Environ. 2006, 100, 200–211. [Google Scholar] [CrossRef]
  7. Agam, N.; Kustas, W.P.; Anderson, M.C.; Li, F.; Neale, C.M.U. A vegetation index based technique for spatial sharpening of thermal imagery. Remote Sens. Environ. 2007, 107, 545–558. [Google Scholar] [CrossRef]
  8. Wang, N.; Yu, J.; Zhu, L.; Wang, Y.; He, Z. Spatial Downscaling of Remote Sensing Precipitation Data in the Beijing-Tianjin-Hebei Region. J. Comput. Commun. 2021, 9, 191–202. [Google Scholar] [CrossRef]
  9. Okamoto, K.; Miyazaki, S.; Ishida, T. Remote sensing of precipitation by a satellite-borne microwave remote sensor. Acta Astronaut. 1979, 6, 1043–1060. [Google Scholar] [CrossRef]
  10. Condom, T.; Rau, P.; Espinoza, J.C. Correction of TRMM 3B43 monthly precipitation data over the mountainous areas of Peru during the period 1998–2007. Hydrol. Process. 2011, 25, 1924–1933. [Google Scholar] [CrossRef]
  11. Foody, G.M. Geographical weighting as a further refinement to regression modelling: An example focused on the NDVI–rainfall relationship. Remote Sens. Environ. 2003, 88, 283–293. [Google Scholar] [CrossRef]
  12. Guan, H.; Wilson, J.L.; Xie, H. A cluster-optimizing regression-based approach for precipitation spatial downscaling in mountainous terrain. J. Hydrol. 2009, 375, 578–588. [Google Scholar] [CrossRef]
  13. Duan, Z.; Bastiaanssen, W.G.M. First results from Version 7 TRMM 3B43 precipitation product in combination with a new downscaling–calibration procedure. Remote Sens. Environ. 2013, 131, 1–13. [Google Scholar] [CrossRef]
  14. Schmidli, J.; Goodess, C.M.; Frei, C.; Haylock, M.R.; Hundecha, Y.; Ribalaygua, J.; Schmith, T. Statistical and dynamical downscaling of precipitation: An evaluation and comparison of scenarios for the European Alps. J. Geophys. Res. Atmos. 2007, 112, D4. [Google Scholar] [CrossRef]
  15. Marquínez, J.; Lastra, J.; García, P. Estimation models for precipitation in mountainous regions: The use of GIS and multivariate analysis. J. Hydrol. 2003, 270, 1–11. [Google Scholar] [CrossRef]
  16. Zhang, T.; Li, B.; Yuan, Y.; Gao, X.; Sun, Q.; Xu, L.; Jiang, Y. Spatial downscaling of TRMM precipitation data considering the impacts of macro-geographical factors and local elevation in the Three-River Check for updates Headwaters Region. Remote Sens. Environ. 2018, 215, 109–127. [Google Scholar] [CrossRef]
  17. Cressie, N. The origins of kriging. Math. Geol. 1990, 22, 239–252. [Google Scholar] [CrossRef]
  18. Stein, M.L. Interpolation of Spatial Data; Springer: New York, NY, USA, 2006; Volume 45, pp. 238–240. [Google Scholar]
  19. Wang, S.; Yan, D.H.; Qin, T.L.; Ru-hai, L. Spatial interpolation of precipitation using the PER-Kriging method. Adv. Water Sci. 2011, 22, 756–763. [Google Scholar]
  20. Hutchinson, M.F. Interpolating Mean Rainfall Using Thin Plate Smoothing Splines. Int. J. Geogr. Inf. Syst. 1995, 9, 385–403. [Google Scholar] [CrossRef]
  21. Park, N.W. Spatial Downscaling of TRMM Precipitation Using Geostatistics and Fine Scale Environmental Variables. Adv. Meteorol. 2013, 2013, 187–190. [Google Scholar] [CrossRef]
  22. Lu, X.; Tang, G.; Wang, X.; Liu, Y.; Wei, M.; Zhang, Y. The Development of a Two-Step Merging and Downscaling Method for Satellite Precipitation Products. Remote Sens. 2020, 12, 398. [Google Scholar] [CrossRef]
  23. Pardo-Igúzquiza, E. Comparison of geostatistical methods for estimating the areal average climatological rainfall mean using data on precipitation and topography. Int. J. Climatol. 1998, 18, 1031–1047. [Google Scholar] [CrossRef]
  24. Troutman, B.M. An analysis of input errors in precipitation-runoff models using regression with errors in the independent variables. Water Resour. Res. 1982, 18, 947–964. [Google Scholar] [CrossRef]
  25. Jia, S.F.; Zhu, W.; Lű, A.; Yan, T. A statistical spatial downscaling algorithm of TRMM precipitation based on NDVI and DEM in the Qaidam Basin of China. Remote Sens. Environ. 2011, 115, 3069–3079. [Google Scholar] [CrossRef]
  26. Pettorelli, N.; Ryan, S.; Mueller, T.; Bunnefeld, N.; Jedrzejewsk, B.; Lima, M.; Kausrud, K.L. The Normalized Difference Vegetation Index (NDVI): Unforeseen successes in animal ecology. Clim. Res. 2011, 46, 15–27. [Google Scholar] [CrossRef]
  27. Ji, T.; Liu, R.; Yang, H.; He, T.; Wu, J. Spatial Downscaling of Precipitation Using Multi-source Remote Sensing Data: A Case Study of Sichuan-Chongqing Region. J. Geo-Inf. Sci. 2015, 17, 108–117. [Google Scholar]
  28. Zhang, Q.; Shi, P.; Singh, V.P.; Fan, K.; Huang, J. Spatial downscaling of TRMM-based precipitation data using vegetative response in Xinjiang, China. Int. J. Climatol. 2017, 37, 3895–3909. [Google Scholar] [CrossRef]
  29. Nicholson, S.E.; Farrar, T.J. The influence of soil type on the relationships between NDVI, rainfall, and soil moisture in semiarid Botswana. I. NDVI response to rainfall. Remote Sens. Environ. 1994, 50, 107–120. [Google Scholar] [CrossRef]
  30. Xu, C.; Liu, C.; Zhang, W.; Li, Z.; An, B. Downscaling and Merging of Daily Scale Satellite Precipitation Data in the Three River Headwaters Region Fused with Cloud Attributes and Rain Gauge Data. Water 2023, 15, 1233. [Google Scholar] [CrossRef]
  31. Haji-Aghajany, S.; Amerian, Y.; Amiri-Simkooei, A. Function-Based Troposphere Tomography Technique for Optimal Downscaling of Precipitation. Remote Sens. 2022, 14, 2548. [Google Scholar] [CrossRef]
  32. Zhang, Q.; Li, Y.P.; Huang, G.H.; Wang, H.; Li, Y.F.; Liu, Y.R.; Shen, Z.Y. A novel statistical downscaling approach for analyzing daily precipitation and extremes under the impact of climate change: Application to an arid region. J. Hydrol. 2022, 615, 128730. [Google Scholar] [CrossRef]
  33. Kaelbling, L.P.; Littman, M.L.; Moore, A.W. Reinforcement Learning: A Survey. J. Artif. Intell. Res. 1996, 4, 237–285. [Google Scholar] [CrossRef]
  34. Dietterich, T.G. Machine-learning research. Ai Mag. 1997, 18, 97. [Google Scholar]
  35. Bonnet, S.M.; Evsukoff, A.; Rodriguez, C.A. Precipitation Nowcasting with Weather Radar Images and Deep Learning in Sao Paulo, Brasil. Atmosphere 2020, 11, 1157. [Google Scholar] [CrossRef]
  36. Yan, X.; Chen, H.; Tian, B.; Sheng, S.; Wang, J.; Kim, J.-S. A Downscaling–Merging Scheme for Improving Daily Spatial Precipitation Estimates Based on Random Forest and Cokriging. Remote Sens. 2021, 13, 2040. [Google Scholar] [CrossRef]
  37. Jing, W.L.; Zhang, P.Y.; Jiang, H.; Zhao, X. Reconstructing Satellite-Based Monthly Precipitation over Northeast China Using Machine Learning Algorithms. Remote Sens. 2017, 9, 781. [Google Scholar] [CrossRef]
  38. Chiu, L.S.; Shin, D.B.; Kwiatkowski, J. Earth Science Satellite Remote Sensing; Springer: Berlin/Heidelberg, Germany, 2006. [Google Scholar]
  39. Zhang, X.X.; Liu, G.D.; Wang, H.T.; Li, X.D. Application of a Hybrid Interpolation Method Based on Support Vector Machine in the Precipitation Spatial Interpolation of Basins. Water 2017, 9, 760. [Google Scholar] [CrossRef]
  40. Chen, F.H.; Wu, S.; Cui, P.; Cai, Y.; Zhang, Y.; Yin, Y.; Liu, G.; Ouyang, Z.; Ma, W.; Yang, L.; et al. Progress and prospects of applied research on physical geography and the living environment in China over the past 70 years (1949–2019). J. Geogr. Sci. 2021, 31, 3–45. [Google Scholar] [CrossRef]
  41. Sharifi, E.; Saghafian, B.; Steinacker, R. Downscaling Satellite Precipitation Estimates With Multiple Linear Regression, Artificial Neural Networks, and Spline Interpolation Techniques. J. Geophys. Res. Atmos. 2019, 124, 789–805. [Google Scholar] [CrossRef]
  42. Immerzeel, W.W.; Rutten, M.M.; Droogers, P. Spatial downscaling of TRMM precipitation using vegetative response on the Iberian Peninsula. Remote Sens. Environ. 2009, 113, 362–370. [Google Scholar] [CrossRef]
  43. Jing, W.L.; Yang, Y.P.; Yue, X.F.; Zhao, X.D. A Comparison of Different Regression Algorithms for Downscaling Monthly Satellite-Based Precipitation over North China. Remote Sens. 2016, 8, 835. [Google Scholar] [CrossRef]
  44. Tan, M.L.; Duan, Z. Assessment of GPM and TRMM Precipitation Products over Singapore. Remote Sens. 2017, 9, 720. [Google Scholar] [CrossRef]
  45. Zhang, J.Y.; Dong, W.J. Impact of land cover/use change on regional climate over China. J. Grad. Sch. Chin. Acad. Sci. 2007, 24, 5. [Google Scholar]
  46. Wu, F.; Zhan, J.; Su, H.; Yan, H.; Ma, E. Scenario-Based Impact Assessment of Land Use/Cover and Climate Changes on Watershed Hydrology in Heihe River Basin of Northwest China. Adv. Meteorol. 2015, 2015, 410198. [Google Scholar] [CrossRef]
  47. Chen, F.; Liu, Y.; Liu, Q.; Li, X. Spatial downscaling of TRMM 3B43 precipitation considering spatial heterogeneity. Int. J. Remote Sens. 2014, 35, 3074–3093. [Google Scholar] [CrossRef]
  48. Nzabarinda, V.; Bao, A.; Xu, W.; Uwamahoro, S.; Udahogora, M.; Umwali, E.D.; Nyirarwasa, A.; Umuhoza, J. A Spatial and Temporal Assessment of Vegetation Greening and Precipitation Changes for Monitoring Vegetation Dynamics in Climate Zones over Africa. Int. J. Geo-Inf. 2021, 10, 129. [Google Scholar] [CrossRef]
  49. Danandeh, M.A.; Nourani, V. Season Algorithm-Multigene Genetic Programming: A New Approach for Rainfall-Runoff Modelling. Water Resour. Manag. 2018, 32, 2665–2679. [Google Scholar] [CrossRef]
  50. Zeng, N.; Neelin, J.D.; Lau, K.M.; Tucker, C.J. Enhancement of Interdecadal Climate Variability in the Sahel by Vegetation Interaction. Science 1999, 286, 1537–1540. [Google Scholar] [CrossRef]
  51. Chang, H. A vegetation-climate classification system for global change studies in China. Quat. Sci. 1993, 2, 157–173. [Google Scholar]
  52. Zhou, G.; Wang, Y. Global change and climate-vegetation classification. Chin. Sci. Bull. 2000, 45, 577–585. [Google Scholar] [CrossRef]
  53. Lin, H.L.; Feng, Q.S.; Zhang, Y.J. Spatial-Temporal Dynamics of Potential Grassland Vegetation in China under the Global Climate Change Scenarios. In Proceedings of the Workshop of Sustainable Grassland Management in China & Australia, Bruce, Australia, 23 December 2021. [Google Scholar]
  54. Gebregiorgis, A.S.; Hossain, F. Understanding the Dependence of Satellite Rainfall Uncertainty on Topography and Climate for Hydrologic Model Simulation. IEEE Trans. Geosci. Remote Sens. 2012, 51, 704–718. [Google Scholar] [CrossRef]
  55. Xia, T.; Wang, Z.J.; Zheng, H. Topography and Data Mining Based Methods for Improving Satellite Precipitation in Mountainous Areas of China. Atmos. 2015, 6, 983–1005. [Google Scholar] [CrossRef]
  56. Wang, W.; Sun, L.; Cai, Y.; Yi, Y.; Yang, W.; Yang, Z. Evaluation of multi-source precipitation data in a watershed with complex topography based on distributed hydrological modeling. River Res. Appl. 2021, 37, 1115–1133. [Google Scholar] [CrossRef]
  57. Chen, T.; Liu, X.Y.; Liu, X.; Li, X.; Liu, J. Spatial downscaling of monthly precipitation based on TRMM satellite in Ya’an. IOP Conf. Ser. Mater. Sci. Eng. 2020, 794, 012007. [Google Scholar] [CrossRef]
  58. Kawabata, A.; Ichii, K.; Yamaguchi, Y. Global monitoring of interannual changes in vegetation activities using NDVI and its relationships to temperature and precipitation. Int. J. Remote Sens. 2001, 22, 1377–1382. [Google Scholar] [CrossRef]
  59. Richard, Y.; Poccard, I. A statistical study of NDVI sensitivity to seasonal and interannual rainfall variations in Southern Africa. Int. J. Remote Sens. 1998, 19, 2907–2920. [Google Scholar] [CrossRef]
  60. Sun, H.Y.; Wang, C.Y.; Niu, Z.; Bu, A.; Li, B. Analysis of the Vegetation Cover Change and the Relationship bgtween NDVI and Environmental Factors by Using NOAA Time Series Data. J. Remote Sens. 1998, 2, 210–216. [Google Scholar]
  61. Geurts, P.; Ernst, D.; Wehenkel, L. Extremely randomized trees. Mach. Learn. 2006, 63, 3–42. [Google Scholar] [CrossRef]
  62. Ho, T.K. The random subspace method for constructing decision forests. IEEE Trans. Pattern Anal. Mach. Intell. 1998, 20, 832–844. [Google Scholar]
  63. Xu, S.; Wu, C.; Wang, L.; Gonsamo, A.; Shen, Y.; Niu, Z. A new satellite-based monthly precipitation downscaling algorithm with non-stationary relationship between precipitation and land surface characteristics. Remote Sens. Environ. 2015, 162, 119–140. [Google Scholar] [CrossRef]
  64. Shen, Z.; Yong, B. Downscaling the GPM-based satellite precipitation retrievals using gradient boosting decision tree approach over Mainland China. J. Hydrol. 2021, 602, 126803. [Google Scholar] [CrossRef]
Figure 1. National vegetation zoning map.
Atmosphere 14 01489 g001
Figure 2. National distribution map of stations, with orography.
Atmosphere 14 01489 g002
Figure 3. Flowchart of the partition-based downscaling method proposed in this paper.
Atmosphere 14 01489 g003
Figure 4. The seasonal variation of (A) R2 and (B) RMSE for vegetation regions across the nation in the year 2019.
Atmosphere 14 01489 g004
Figure 5. Scatter plots of observed rainfall measurements against (A) GPM precipitation data, (B) downscaled results without partitioning, (C) kriging interpolation results, and (D) partitioned region prediction results (the pink line in the figure represents the fitting line).
Atmosphere 14 01489 g005
Figure 6. Spatial distribution of precipitation from January to March 2019.
Atmosphere 14 01489 g006
Figure 7. Spatial distribution of precipitation from April to June 2019.
Atmosphere 14 01489 g007
Figure 8. Spatial distribution of precipitation from July to September 2019.
Atmosphere 14 01489 g008
Figure 9. Spatial distribution of precipitation from October to December 2019.
Atmosphere 14 01489 g009
Table 1. The accuracy of downscaling models for various seasons within each research region.
RegionSpringSummerAutumnWinter
R2MAE
(mm)
RMSE
(mm)
R2MAE
(mm)
RMSE
(mm)
R2MAE
(mm)
RMSE
(mm)
R2MAE
(mm)
RMSE
(mm)
10.9300.2850.4410.9405.5958.0250.82118.85733.6590.9601.4692.046
20.9751.0422.0030.9775.5428.9960.92914.19925.2730.9681.5582.416
30.9501.2362.3220.9523.9867.0480.93810.47018.1470.9851.6282.895
40.87812.10626.2790.96313.12519.7580.93217.13426.5700.9425.97210.355
50.9217.07113.3520.95616.72522.2130.92824.20729.0240.9547.14011.239
60.8690.7931.6400.9753.8465.7450.9419.84515.6320.9461.5062.852
70.9320.6961.3440.8715.2917.7160.9293.9075.6190.9131.3132.530
80.9021.7773.9990.9159.92115.5520.82514.11019.7920.8574.1967.244
Mean0.923.1266.4230.9448.00411.880.90514.09121.7150.9413.0985.197
Table 2. Estimates of accuracy between GPM satellite precipitation data and downscaled results using different methods.
Unallocated Area PredictionKriging InterpolationResults after Residual Correction
R20.7380.8910.949
MAE (mm)23.24511.4808.887
RMSE (mm)45.91629.01720.175
Disclaimer/Publisher’s Note: The statements, opinions and data contained in all publications are solely those of the individual author(s) and contributor(s) and not of MDPI and/or the editor(s). MDPI and/or the editor(s) disclaim responsibility for any injury to people or property resulting from any ideas, methods, instructions or products referred to in the content.

