
A Review of Infrasound and Seismic Observations of Sample Return Capsules since the End of the Apollo Era in Anticipation of the OSIRIS-REx Arrival

Abstract
:1. Background
1.1. Meteoroids and Asteroids
1.2. Meteor Generated Shock Waves
2. Infrasound and Seismic Observations of Sample Return Capsules
2.1. Genesis (2004)
2.2. Stardust (2006)
2.3. Hayabusa 1 (2010)
2.4. Hayabusa 2 (2020)
3. Upcoming Re-Entries and the Path Forward
3.1. OSIRIS-REx (2023)
3.2. Path Forward
Author Contributions
Funding
Data Availability Statement
Acknowledgments
Conflicts of Interest
References
- Brownlee, D.E.; Tsou, P.; Anderson, J.D.; Hanner, M.S.; Newburn, R.L.; Sekanina, Z.; Clark, B.C.; Hörz, F.; Zolensky, M.E.; Kissel, J.; et al. Stardust: Comet and interstellar dust sample return mission. J. Geophys. Res. Planets 2003, 108. [Google Scholar] [CrossRef]
- Burnett, D.; Barraclough, B.; Bennett, R.; Neugebauer, M.; Oldham, L.; Sasaki, C.; Sevilla, D.; Smith, N.; Stansbery, E.; Sweetnam, D. The Genesis Discovery Mission: Return of Solar Matter to Earth. Space Sci. Rev. 2003, 105, 509–534. [Google Scholar] [CrossRef]
- Lauretta, D.; Balram-Knutson, S.; Beshore, E.; Boynton, W.; Drouet d’Aubigny, C.; DellaGiustina, D.; Enos, H.; Golish, D.; Hergenrother, C.; Howell, E. OSIRIS-REx: Sample return from asteroid (101955) Bennu. Space Sci. Rev. 2017, 212, 925–984. [Google Scholar] [CrossRef]
- Silber, E.A.; Boslough, M.; Hocking, W.K.; Gritsevich, M.; Whitaker, R.W. Physics of meteor generated shock waves in the Earth’s atmosphere—A review. Adv. Space Res. 2018, 62, 489–532. [Google Scholar] [CrossRef]
- Ceplecha, Z.; Borovička, J.; Elford, W.; ReVelle, D.; Hawkes, R.; Porubčan, V.; Šimek, M. Meteor Phenomena and Bodies. Space Sci. Rev. 1998, 84, 327–471. [Google Scholar] [CrossRef]
- ReVelle, D.O.; Edwards, W.N. Stardust-An Artificial, Low Velocity “Meteor” Fall and Recovery: 15 January 2006. Meteorit. Planet. Sci. 2006, 42, 271–299. [Google Scholar] [CrossRef]
- ReVelle, D.O.; Edwards, W.; Sandoval, T.D. Genesis—An artificial, low velocity “meteor” fall and recovery: September 8, 2004. Meteorit. Planet. Sci. 2005, 40, 895–916. [Google Scholar] [CrossRef]
- Silber, E.A.; Albert, S.A.; Berg, E.M.; Bowman, D.C.; Dannemann-Dugick, F.K. The Upcoming Re-Entry of the OSIRIS-REx Return Capsule: Plans for a Coordinated Seismo-Acoustic Observational Campaign. In Proceedings of the 54th Lunar and Planetary Science Conference, The Woodlands, TX, USA, 13–17 March 2023; p. 1229. [Google Scholar]
- Sansom, E.K.; Devillepoix, H.A.; Yamamoto, M.-y.; Abe, S.; Nozawa, S.; Towner, M.C.; Cupák, M.; Hiramatsu, Y.; Kawamura, T.; Fujita, K. The scientific observation campaign of the Hayabusa-2 capsule re-entry. Publ. Astron. Soc. Jpn. 2022, 74, 50–63. [Google Scholar] [CrossRef]
- Yamamoto, M.-y.; Ishihara, Y.; Hiramatsu, Y.; Kitamura, K.; Ueda, M.; Shiba, Y.; Furumoto, M.; Fujita, K. Detection of acoustic/infrasonic/seismic waves generated by hypersonic re-entry of the HAYABUSA capsule and fragmented parts of the spacecraft. Publ. Astron. Soc. Jpn. 2011, 63, 971–978. [Google Scholar] [CrossRef]
- Romig, M.F. Physics of meteor entry. AIAA J. 1965, 3, 385–394. [Google Scholar] [CrossRef]
- Popova, O. Meteoroid ablation models. Earth Moon Planets 2004, 95, 303–319. [Google Scholar] [CrossRef]
- Popova, O.; Nemchinov, I. Bolides in the Earth Atmosphere. In Catastrophic Events Caused by Cosmic Objects; Springer: Berlin/Heidelberg, Germany, 2008; pp. 131–162. [Google Scholar]
- Baggaley, W. Meteors and atmospheres. In Proceedings of the Symposium-International Astronomical Union, Kona, HI, USA, 23–27 June 1980; pp. 85–100. [Google Scholar]
- Baldwin, B.; Sheaffer, Y. Ablation and Breakup of Large Meteorolds during Atmospheric Entry. J. Geophys. Res. 1971, 76, 4653–4668. [Google Scholar] [CrossRef]
- Boyd, I.D. Computation of atmospheric entry flow about a Leonid meteoroid. Earth Moon Planets 2000, 82–83, 93–108. [Google Scholar]
- Bronsthen, V.A. Fragmentation and crushing of large meteoric bodies in an atmosphere. Sol. Syst. Res. 1995, 29, 392–399. [Google Scholar]
- Bronshten, V.A. Physics of Meteoric Phenomena; D. Reidel Publishing Co.: Dordrecht, The Netherlands, 1983. [Google Scholar]
- ReVelle, D.O. On meteor-generated infrasound. J. Geophys. Res. 1976, 81, 1217–1230. [Google Scholar] [CrossRef]
- ReVelle, D.O. Acoustic-Gravity Waves from Impulsive Sources in the Atmosphere. In Infrasound Monitoring for Atmospheric Studies; Springer: Berlin/Heidelberg, Germany, 2008. [Google Scholar]
- Bronshtėn, V.A. Problems of the movements of large meteoric bodies in the atmosphere; RM-4257-PR; RAND Corporation: Santa Monica, CA, USA, 1965. [Google Scholar]
- Bender, W.; Carey, M.; Bell, L.D. Planetary Asteroid Defense Study: Assessing and Responding to the Natural Space Debris Threat; Department of Defence: Washington, DC, USA, 1995. [Google Scholar]
- Brown, P.G.; Assink, J.D.; Astiz, L.; Blaauw, R.; Boslough, M.B.; Borovicka, J.; Brachet, N.; Brown, D.; Campbell-Brown, M.; Ceranna, L.; et al. A 500-kiloton airburst over Chelyabinsk and an enhanced hazard from small impactors. Nature 2013, 503, 238–241. [Google Scholar] [CrossRef]
- Chapman, C.R. Meteoroids, Meteors, and the Near-Earth Object Impact Hazard. Earth Moon Planets 2008, 102, 417–424. [Google Scholar] [CrossRef]
- Collins, G.S.; Melosh, H.J.; Marcus, R.A. Earth Impact Effects Program: A Web-based computer program for calculating the regional environmental consequences of a meteoroid impact on Earth. Meteorit. Planet. Sci. 2005, 40, 817–840. [Google Scholar] [CrossRef]
- Boslough, M.B.; Crawford, D. Low-altitude airbursts and the impact threat. Int. J. Impact Eng. 2008, 35, 1441–1448. [Google Scholar] [CrossRef]
- Turco, R.; Toon, O.; Park, C.; Whitten, R.; Pollack, J.; Noerdlinger, P. Tunguska meteor fall of 1908—Effects on stratospheric ozone. Science 1981, 214, 19–23. [Google Scholar] [CrossRef]
- Trigo-Rodríguez, J.M. Asteroid Impact Risk, Impact Hazard from Asteroids and Comets; Springer: Cham, Switzerland, 2022; p. 126. [Google Scholar]
- Malik, J. Yields of the Hiroshima and Nagasaki Nuclear Explosions; Los Alamos National Lab. (LANL): Los Alamos, NM, USA, 1985. [Google Scholar]
- Popova, O.P.; Jenniskens, P.; Emel’yanenko, V.; Kartashova, A.; Biryukov, E.; Khaibrakhmanov, S.; Shuvalov, V.; Rybnov, Y.; Dudorov, A.; Grokhovsky, V.I.; et al. Chelyabinsk Airburst, Damage Assessment, Meteorite Recovery, and Characterization. Science 2013, 342, 1069–1073. [Google Scholar] [CrossRef]
- Silber, E.A.; Le Pichon, A.; Brown, P.G. Infrasonic detection of a near-Earth object impact over Indonesia on 8 October 2009. Geophys. Res. Lett. 2011, 38, L12201. [Google Scholar] [CrossRef]
- Kenkmann, T.; Artemieva, N.A.; Wünnemann, K.; Poelchau, M.H.; Elbeshausen, D.; Prado, H.N.d. The Carancas meteorite impact crater, Peru: Geologic surveying and modeling of crater formation and atmospheric passage. Meteorit. Planet. Sci. 2009, 44, 985–1000. [Google Scholar] [CrossRef]
- Le Pichon, A.; Antier, K.; Cansi, Y.; Hernandez, B.; Minaya, E.; Burgoa, B.; Drob, D.; Evers, L.G.; Vaubaillon, J. Evidence for a meteoritic origin of the September 15, 2007, Carancas crater. Meteorit. Planet. Sci. 2008, 43, 1797–1809. [Google Scholar] [CrossRef]
- Brown, P.; ReVelle, D.O.; Silber, E.A.; Edwards, W.N.; Arrowsmith, S.; Jackson, L.E.; Tancredi, G.; Eaton, D. Analysis of a crater-forming meteorite impact in Peru. J. Geophys. Res. 2008, 113, 1–13. [Google Scholar] [CrossRef]
- Tancredi, G.; Ishitsuka, J.; Schultz, P.H.; Harris, R.S.; Brown, P.; Revelle, D.O.; Antier, K.; Pichon, A.L.; Rosales, D.; Vidal, E.; et al. A meteorite crater on Earth formed on September 15, 2007: The Carancas hypervelocity impact. Meteorit. Planet. Sci. 2009, 44, 1967–1984. [Google Scholar] [CrossRef]
- Baggaley, W. The interpretation of overdense radio meteor echo duration characteristics. Bull. Astron. Inst. Czechoslov. 1979, 30, 184–189. [Google Scholar]
- Beech, M.; Brown, P.; Jones, J. VLF detection of fireballs. Earth Moon Planets 1995, 68, 181–188. [Google Scholar] [CrossRef]
- Ceplecha, Z.; Brown, P.; Hawkes, R.L.; Wetherill, G.; Beech, M.; Mossman, K. Video observations, atmospheric path, orbit and fragmentation record of the fall of the Peekskill meteorite. Earth Moon Planets 1995, 71, 395–404. [Google Scholar] [CrossRef]
- Christou, A.A.; Oberst, J.; Elgner, S.; Flohrer, J.; Margonis, A.; McAuliffe, J.P.; Koschny, D. Orbital observations of meteors in the Martian atmosphere using the SPOSH camera. Planet. Space Sci. 2012, 60, 229–235. [Google Scholar] [CrossRef]
- Stenbaek-Nielsen, H.C.; Jenniskens, P. A “shocking” Leonid meteor at 1000 fps. Adv. Space Res. 2004, 33, 1459–1465. [Google Scholar] [CrossRef]
- Nemtchinov, I.V.; Svetsov, V.V.; Kosarev, I.B.; Golub, A.P.; Popova, O.P.; Shuvalov, V.V.; Spalding, R.E.; Jacobs, C.; Tagliaferri, E. Assessment of Kinetic Energy of Meteoroids Detected by Satellite-Based Light Sensors. Icarus 1997, 130, 259–274. [Google Scholar] [CrossRef]
- Nicholson, T.; Poole, L. The observed characteristics of radio-echoes from overdense meteor trains. Planet. Space Sci. 1974, 22, 1669–1689. [Google Scholar] [CrossRef]
- Silber, E.A.; Brown, P.G. Optical observations of meteors generating infrasound—I: Acoustic signal identification and phenomenology. J. Atmos. Sol. Terr. Phys. 2014, 119, 116–128. [Google Scholar] [CrossRef]
- Singer, W.; Bremer, J.; Weiß, J.; Hocking, W.; Höffner, J.; Donner, M.; Espy, P. Meteor radar observations at middle and Arctic latitudes Part 1: Mean temperatures. J. Atmos. Sol. Terr. Phys. 2004, 66, 607–616. [Google Scholar] [CrossRef]
- Ott, T.; Drolshagen, E.; Koschny, D.; Drolshagen, G.; Pilger, C.; Gaebler, P.; Hupe, P.; Mialle, P.; Vaubaillon, J.; Poppe, B. Infrasound signals of fireballs detected by the Geostationary Lightning Mapper. Astron. Astrophys. 2021, 654, A98. [Google Scholar] [CrossRef]
- Arrowsmith, S.J.; Drob, D.P.; Hedlin, M.A.H.; Edwards, W. A joint seismic and acoustic study of the Washington State bolide: Observations and modeling. J. Geophys. Res. 2007, 112, 1–14. [Google Scholar] [CrossRef]
- Arrowsmith, S.; ReVelle, D.; Edwards, W.; Brown, P. Global Detection of Infrasonic Signals from Three Large Bolides. Earth Moon Planets 2008, 102, 357–363. [Google Scholar] [CrossRef]
- Beech, M.; Brown, P.; Hawkes, R.L.; Ceplecha, Z.; Mossman, K.; Wetherill, G. The fall of the Peekskill meteorite: Video observations, atmospheric path, fragmentation record and orbit. Earth Moon Planets 1995, 68, 189–197. [Google Scholar] [CrossRef]
- ReVelle, D. Acoustic-Gravity Waves from Bolide Sources. Earth Moon Planets 2008, 102, 345–356. [Google Scholar] [CrossRef]
- ReVelle, D. Acoustics of Meteors. Ph.D. Thesis, University of Michigan, Ann Arbor, MI, USA, 1974. [Google Scholar]
- ReVelle, D.O. Recent advances in bolide entry modeling: A bolide potpourri*. Earth Moon Planets 2005, 95, 441–476. [Google Scholar] [CrossRef]
- Brown, P.; McCausland, P.J.A.; Fries, M.; Silber, E.; Edwards, W.N.; Wong, D.K.; Weryk, R.J.; Fries, J.; Krzeminski, Z. The fall of the Grimsby meteorite—I: Fireball dynamics and orbit from radar, video, and infrasound records. Meteorit. Planet. Sci. 2011, 46, 339–363. [Google Scholar] [CrossRef]
- Connors, M.; Brown, P.; Hube, D.P.; Martin, B.; Ling, A.; Hladiuk, D.; Mazur, M.; Spalding, R. The January 26, 2001 fireball and implications for meteor video camera networks. J. R. Astron. Soc. Can. 2003, 97, 271–276. [Google Scholar]
- Trigo-Rodriguez, J.M.; Madiedo, J.M.; Gural, P.S.; Castro-Tirado, A.J.; Llorca, J.; Fabregat, J.; Vítek, S.; Pujols, P. Determination of Meteoroid Orbits and Spatial Fluxes by Using High-Resolution All-Sky CCD Cameras. Earth Moon Planets 2008, 102, 231–240. [Google Scholar] [CrossRef]
- Garces, M.; Hetzer, C.; Lindquist, K.; Hansen, R.; Olson, J.; Wilson, C.; Drob, D.; Hedlin, M. Infrasonic Source Location of the April 23, 2001, Bolide Event. In Proceedings of the 23rd Seismic Research Review: Worldwide Monitoring of Nuclear Explosions, Jackson Hole, WY, USA, 2–5 October 2001. [Google Scholar]
- Hedlin, M.A.; Ritsema, J.; de Groot-Hedlin, C.D.; Hetland, E.A. A multidisciplinary study of the 17 January 2018 bolide terminal burst over Southeast Michigan. Seismol. Res. Lett. 2018, 89, 2183–2192. [Google Scholar] [CrossRef]
- Jenniskens, P.; Albers, J.; Tillier, C.E.; Edgington, S.F.; Longenbaugh, R.S.; Goodman, S.J.; Rudlosky, S.D.; Hildebrand, A.R.; Hanton, L.; Ciceri, F.; et al. Detection of meteoroid impacts by the Geostationary Lightning Mapper on the GOES-16 satellite. Meteorit. Planet. Sci. 2018, 53, 2445–2469. [Google Scholar] [CrossRef]
- Brown, P.; Weryk, R.J.; Kohut, S.; Edwards, W.N.; Krzemenski, Z. Development of an All-Sky Video Meteor Network in Southern Ontario, Canada: The ASGARD System. J. Int. Meteor Organ. 2010, 38, 25–30. [Google Scholar]
- Brown, P.; Spalding, R.E.; ReVelle, D.O.; Tagliaferri, E.; Worden, S.P. The flux of small near-Earth objects colliding with the Earth. Nature 2002, 420, 294–296. [Google Scholar] [CrossRef]
- Silber, E.A.; ReVelle, D.O.; Brown, P.G.; Edwards, W.N. An estimate of the terrestrial influx of large meteoroids from infrasonic measurements. J. Geophys. Res. 2009, 114, E08006. [Google Scholar] [CrossRef]
- Gritsevich, M. Identification of fireball dynamic parameters. Mosc. Univ. Mech. Bull. 2008, 63, 1–5. [Google Scholar]
- Ceplecha, Z.; Revelle, D.O. Fragmentation model of meteoroid motion, mass loss, and radiation in the atmosphere. Meteorit. Planet. Sci. 2005, 40, 35–54. [Google Scholar] [CrossRef]
- Campbell-Brown, M.; Koschny, D. Model of the ablation of faint meteors. Astron. Astrophys. 2004, 418, 751–758. [Google Scholar] [CrossRef]
- Brown, P.; Campbell, M.; Suggs, R.; Cooke, W.; Theijsmeijer, C.; Hawkes, R.L.; Jones, J.; Ellis, K.J. Video and radar observations of the 2000 Leonids: Evidence for a strong flux peak associated with 1932 ejecta? Mon. Not. R. Astron. Soc. 2002, 335, 473–479. [Google Scholar] [CrossRef]
- Silber, E.A.; Brown, P.G.; Krzeminski, Z. Optical observations of meteors generating infrasound: Weak shock theory and validation. J. Geophys. Res. Planets 2015, 120, 413–428. [Google Scholar] [CrossRef]
- Gritsevich, M. Validity of the photometric formula for estimating the mass of a fireball projectile. Dokl. Phys. 2008, 53, 97–102. [Google Scholar] [CrossRef]
- Moreno-Ibáñez, M.; Silber, E.A.; Gritsevich, M.; Trigo-Rodríguez, J.M. Verification of the flow regimes based on high-fidelity observations of bright meteors. Astrophys. J. 2018, 863, 174. [Google Scholar] [CrossRef]
- Gritsevich, M.; Koschny, D. Constraining the luminous efficiency of meteors. Icarus 2011, 212, 877–884. [Google Scholar] [CrossRef]
- Gritsevich, M.I. Determination of parameters of meteor bodies based on flight observational data. Adv. Space Res. 2009, 44, 323–334. [Google Scholar] [CrossRef]
- Ayers, W.G.; Mc Crosky, R.E.; Shao, C.-Y. Photographic Observations of 10 Artificial Meteors; Smithsonian Institution Astrophysical Observatory: Cambridge, MA, USA, 1970; p. 54. [Google Scholar]
- Ayers, W.G. Luminous Efficiency of an Artificial Meteor at 11.9 Kilometers per Second; NASA: Washington, DC, USA, 1965. [Google Scholar]
- Janches, D.; Heinselman, C.J.; Chau, J.L.; Chandran, A.; Woodman, R. Modeling the global micrometeor input function in the upper atmosphere observed by high power and large aperture radars. J. Geophys. Res. Space Phys. 2006, 111. [Google Scholar] [CrossRef]
- Baggaley, W.J. Advanced Meteor Orbit Radar observations of interstellar meteoroids. J. Geophys. Res. Space Phys. 2000, 105, 10353–10361. [Google Scholar] [CrossRef]
- Meech, K.J.; Weryk, R.; Micheli, M.; Kleyna, J.T.; Hainaut, O.R.; Jedicke, R.; Wainscoat, R.J.; Chambers, K.C.; Keane, J.V.; Petric, A.; et al. A brief visit from a red and extremely elongated interstellar asteroid. Nature 2017, 552, 378–381. [Google Scholar] [CrossRef] [PubMed]
- Silber, E.A.; Brown, P. Infrasound Monitoring as a Tool to Characterize Impacting Near-Earth Objects (NEOs). In Infrasound Monitoring for Atmospheric Studies: Challenges in Middle Atmosphere Dynamics and Societal Benefits; Le Pichon, A., Blanc, E., Hauchecorne, A., Eds.; Springer International Publishing: Cham, Switzerland, 2019; pp. 939–986. [Google Scholar]
- Trigo-Rodríguez, J.M.; Dergham, J.; Gritsevich, M.; Lyytinen, E.; Silber, E.A.; Williams, I.P. A Numerical Approach to Study Ablation of Large Bolides: Application to Chelyabinsk. Adv. Astron. 2021, 2021, 8852772. [Google Scholar] [CrossRef]
- Plooster, M.N. Shock waves from line sources. Numerical solutions and experimental measurements. Phys. Fluids 1970, 13, 2665–2675. [Google Scholar] [CrossRef]
- Sakurai, A. Blast wave theory. In Basic Developments in Fluid Mechanics; Holt, M., Ed.; Academic Press: Cambridge, MA, USA, 1965; pp. 309–375. [Google Scholar]
- Sakurai, A. Blast Wave Theory; DTIC Document, No. MRC-TSR-497; Wisconsin University-Madison Mathematics Research Center: Madison, WI, USA, 1964. [Google Scholar]
- Krehl, P.O.K. Shock wave physics and detonation physics—A stimulus for the emergence of numerous new branches in science and engineering. Eur. Phys. J. 2011, 36, 85–152. [Google Scholar]
- Tsikulin, M. Shock Waves during the Movement of Large Meteorites in the Atmosphere; DTIC Document AD 715-537; Department of Defence: Washington, DC, USA, 1970. [Google Scholar]
- Plooster, M.N. Shock Waves from Line Sources; National Center for Atmospheric Research: Boulder, CO, USA, 1968; p. 96. [Google Scholar]
- Bass, H.E.; Bauer, H.-J.; Evans, L.B. Atmospheric Absorption of Sound: Analytical Expressions. J. Acoust. Soc. Am. 1972, 52, 821–825. [Google Scholar] [CrossRef]
- Bass, H.E.; Hetzer, C.H.; Raspet, R. On the Speed of Sound in the Atmosphere as a Function of Altitude and Frequency. J. Geophys. Res. Atmos. 2006, 112, D15110. [Google Scholar] [CrossRef]
- Drob, D.P.; Picone, J.M.; Garces, M. Global morphology of infrasound propagation. J. Geophys. Res. 2003, 108, 1–12. [Google Scholar] [CrossRef]
- Garces, M.A.; Hansen, R.A.; Lindquist, K.G. Traveltimes for infrasonic waves propagating in a stratified atmosphere. Geophys. J. Int. 1998, 135, 255–263. [Google Scholar] [CrossRef]
- Green, D.N.; Vergoz, J.; Gibson, R.; Le Pichon, A.; Ceranna, L. Infrasound radiated by the Gerdec and Chelopechene explosions: Propagation along unexpected paths. Geophys. J. Int. 2011, 185, 890–910. [Google Scholar] [CrossRef]
- Brachet, N.; Brown, D.; Bras, R.; Cansi, Y.; Mialle, P.; Coyne, J. Monitoring the Earth’s Atmosphere with the Global IMS Infrasound Network. In Infrasound Monitoring for Atmospheric Studies; Le Pichon, A., Blanc, E., Hauchecorne, A., Eds.; Springer: Dordrecht, The Netherlands, 2009; pp. 77–118. [Google Scholar]
- Bowman, D.; Lees, J.; Cutts, J.; Komjathy, A.; Young, E.; Seiffert, K.; Boslough, M.; Arrowsmith, S. Geoacoustic observations on drifting balloon-borne sensors. In Infrasound Monitoring for Atmospheric Studies; Springer: Berlin/Heidelberg, Germany, 2019; pp. 125–171. [Google Scholar]
- Pilger, C.; Ceranna, L.; Ross, J.O.; Le Pichon, A.; Mialle, P.; Garcés, M.A. CTBT infrasound network performance to detect the 2013 Russian fireball event. Geophys. Res. Lett. 2015, 42, 2523–2531. [Google Scholar] [CrossRef]
- Ens, T.A.; Brown, P.G.; Edwards, W.N.; Silber, E.A. Infrasound production by bolides: A global statistical study. J. Atmos. Sol. Terr. Phys. 2012, 80, 208–229. [Google Scholar] [CrossRef]
- Donn, W.L.; Dalins, I.; McCarty, V.; Ewing, M.; Kaschak, G. Air-Coupled Seismic Waves at Long Range from Apollo Launchings. Geophys. J. R. Astron. Soc. 1971, 26, 161–171. [Google Scholar] [CrossRef]
- Henderson, H.R.; Hilton, D.A. Sonic-Boom Ground Pressure Measurements from the Launch and Reentry of Apollo 16; NASA: Washington, DC, USA, 1974. [Google Scholar]
- Orrok, G.T. The Meteoroid Environment of Project Apollo; Bellcomm Inc.: Washington, DC, USA, 1963; Volume 31, p. 70. [Google Scholar]
- Ishihara, Y.; Hiramatsu, Y.; Yamamoto, M.-y.; Furumoto, M.; Fujita, K. Infrasound/seismic observation of the Hayabusa reentry: Observations and preliminary results. Earth Planets Space 2012, 64, 655–660. [Google Scholar] [CrossRef]
- Beshore, E.; Lauretta, D.; Boynton, W.; Shinohara, C.; Sutter, B.; Everett, D.; Gal-Edd, J.; Mink, R.; Moreau, M.; Dworkin, J. The OSIRIS-REx asteroid sample return mission. In Proceedings of the 2015 IEEE Aerospace Conference, Big Sky, MT, USA, 7–14 March 2015; pp. 1–14. [Google Scholar]
- Ajluni, T.; Everett, D.; Linn, T.; Mink, R.; Willcockson, W.; Wood, J. OSIRIS-REx, returning the asteroid sample. In Proceedings of the 2015 IEEE Aerospace Conference, Big Sky, MT, USA, 7–14 March 2015; pp. 1–15. [Google Scholar]
- Jurewicz, A.J.G.; Burnett, D.S.; Wiens, R.C.; Friedmann, T.A.; Hays, C.C.; Hohlfelder, R.J.; Nishiizumi, K.; Stone, J.A.; Woolum, D.S.; Becker, R.; et al. The Genesis Solar-Wind Collector Materials. Space Sci. Rev. 2003, 105, 535–560. [Google Scholar] [CrossRef]
- Lo, M.W.; Williams, B.G.; Bollman, W.E.; Han, D.; Hahn, Y.; Bell, J.L.; Hirst, E.A.; Corwin, R.A.; Hong, P.E.; Howell, K.C. Genesis mission design. J. Astronaut. Sci. 2001, 49, 169–184. [Google Scholar] [CrossRef]
- Jones, N. Flawed drawings caused spacecraft crash. Nature 2004. [Google Scholar] [CrossRef]
- Genesis Mishap Investigation Board. Genesis Mishap Investigation Board Report; NASA: Washington, DC, USA, 2005; Volume I. [Google Scholar]
- Garces, M.A. On infrasound standards, Part 1 time, frequency, and energy scaling. InfraMatics 2013, 2, 23. [Google Scholar] [CrossRef]
- Edwards, W.N.; Eaton, D.W.; McCausland, P.J.; ReVelle, D.O.; Brown, P.G. Calibrating infrasonic to seismic coupling using the Stardust sample return capsule shockwave: Implications for seismic observations of meteors. J. Geophys. Res. Solid Earth 2007, 112, B10306. [Google Scholar] [CrossRef]
- Grinstead, J.; Jenniskens, P.; Cassell, A.; Albers, J.; Winter, M. Airborne observation of the Hayabusa sample return capsule Re-entry. In Proceedings of the 42nd AIAA Thermophysics Conference, Honolulu, HI, USA, 27–30 June 2011; p. 3329. [Google Scholar]
- Fujita, K.; Yamamoto, M.-Y.; Abe, S.; Ishihara, Y.; Iiyama, O.; Kakinami, Y.; Hiramatsu, Y.; Furumoto, M.; Takayanagi, H.; Suzuki, T.; et al. An Overview of JAXA’s Ground-Observation Activities for HAYABUSA Reentry. Publ. Astron. Soc. Jpn. 2011, 63, 961–969. [Google Scholar] [CrossRef]
- Nishikawa, Y.; Yamamoto, M.-y.; Sansom, E.K.; Devillepoix, H.A.R.; Towner, M.C.; Hiramatsu, Y.; Kawamura, T.; Fujita, K.; Yoshikawa, M.; Ishihara, Y.; et al. Modeling of 3D trajectory of Hayabusa2 re-entry based on acoustic observations. Publ. Astron. Soc. Jpn. 2022, 74, 308–317. [Google Scholar] [CrossRef]
- Sarli, B.V.; Tsuda, Y. Hayabusa 2 extension plan: Asteroid selection and trajectory design. Acta Astronaut. 2017, 138, 225–232. [Google Scholar] [CrossRef]
- Gal-Edd, J.; Cheuvront, A. The OSIRIS-REx asteroid sample return mission operations design. In Proceedings of the 2015 IEEE Aerospace Conference, Big Sky, MT, USA, 7–14 March 2015; pp. 1–9. [Google Scholar]
- Zinn, J.; O’Dean, P.J.; ReVelle, D.O. Leonid meteor ablation, energy exchange, and trail morphology. Adv. Space Res. 2004, 33, 1466–1474. [Google Scholar] [CrossRef]
- Blaske, C.H.; O’Rourke, J.G.; Desch, S.J.; Borrelli, M.E. Meteors May Masquerade as Lightning in the Atmosphere of Venus. J. Geophys. Res. Planets 2023, 128, e2023JE007914. [Google Scholar] [CrossRef]
- Petculescu, A.; Lueptow, R.M. Atmospheric acoustics of Titan, Mars, Venus, and Earth. Icarus 2007, 186, 413. [Google Scholar] [CrossRef]
- Schuler, T.K.; Bowman, D.C.; Izraelevitz, J.S.; Sofge, D.; Thangavelautham, J. Long duration flights in Venus’ atmosphere using passive solar hot air balloons. Acta Astronaut. 2022, 191, 160–168. [Google Scholar] [CrossRef]
- Fernando, B.; Wójcicka, N.; Maguire, R.; Stähler, S.C.; Stott, A.E.; Ceylan, S.; Charalambous, C.; Clinton, J.; Collins, G.S.; Dahmen, N.; et al. Seismic constraints from a Mars impact experiment using InSight and Perseverance. Nat. Astron. 2022, 6, 59–64. [Google Scholar] [CrossRef]
- Garcia, R.F.; Daubar, I.J.; Beucler, É.; Posiolova, L.V.; Collins, G.S.; Lognonné, P.; Rolland, L.; Xu, Z.; Wójcicka, N.; Spiga, A.; et al. Newly formed craters on Mars located using seismic and acoustic wave data from InSight. Nat. Geosci. 2022, 15, 774–780. [Google Scholar] [CrossRef]
- Posiolova, L.V.; Lognonné, P.; Banerdt, W.B.; Clinton, J.; Collins, G.S.; Kawamura, T.; Ceylan, S.; Daubar, I.J.; Fernando, B.; Froment, M.; et al. Largest recent impact craters on Mars: Orbital imaging and surface seismic co-investigation. Science 2022, 378, 412–417. [Google Scholar] [CrossRef]


| Genesis | Stardust | Hayabusa 1 | Hayabusa 2 | OSIRIS-REx | |
|---|---|---|---|---|---|
| Launch date | 8 August 2001 | 7 February 1999 | 9 May 2003 | 3 December 2014 | 8 September 2016 |
| Landing date | 8 September 2004 | 15 January 2006 | 13 June 2010 | 5 December 2020 | 24 September 2023 |
| Landing time [UTC] | 15:58 | 10:12 | 14:12 | 05:30 | ~15:00 |
| Landing site | DPG | UTTR | WRC | WRC | UTTR |
| Landing site coordinates [lat, lon] | 40.189° N, −113.213° E | 40.365° N, −113.521° E | 30.955° S, 136.532° E | 30.955° S, 136.532° E | 40.365° N, −113.521° E |
| Entry speed [km/s] | 11 | 12.9 | 12.2 | 12 | 12 |
| Entry angle [°] | 8 | 8.2 | 12 | 12 | ~8 |
| Mass [kg] | 225 | 45.8 | 18 | 16 | 46 |
| Diameter [m] | 1.52 | 0.811 | 0.4 | 0.4 | 0.81 |
| Number of seismometers | 0 | 2 | 20 | 7 | n/a |
| Number of infrasound arrays | 1 | 1 | 1 | 7 | n/a |
| Number of single infrasound sensors | 0 | 0 | 2 | 0 | n/a |
| Combined number of infrasound sensors (single + in arrays) | 3 | 4 | 5 | 28 | n/a |
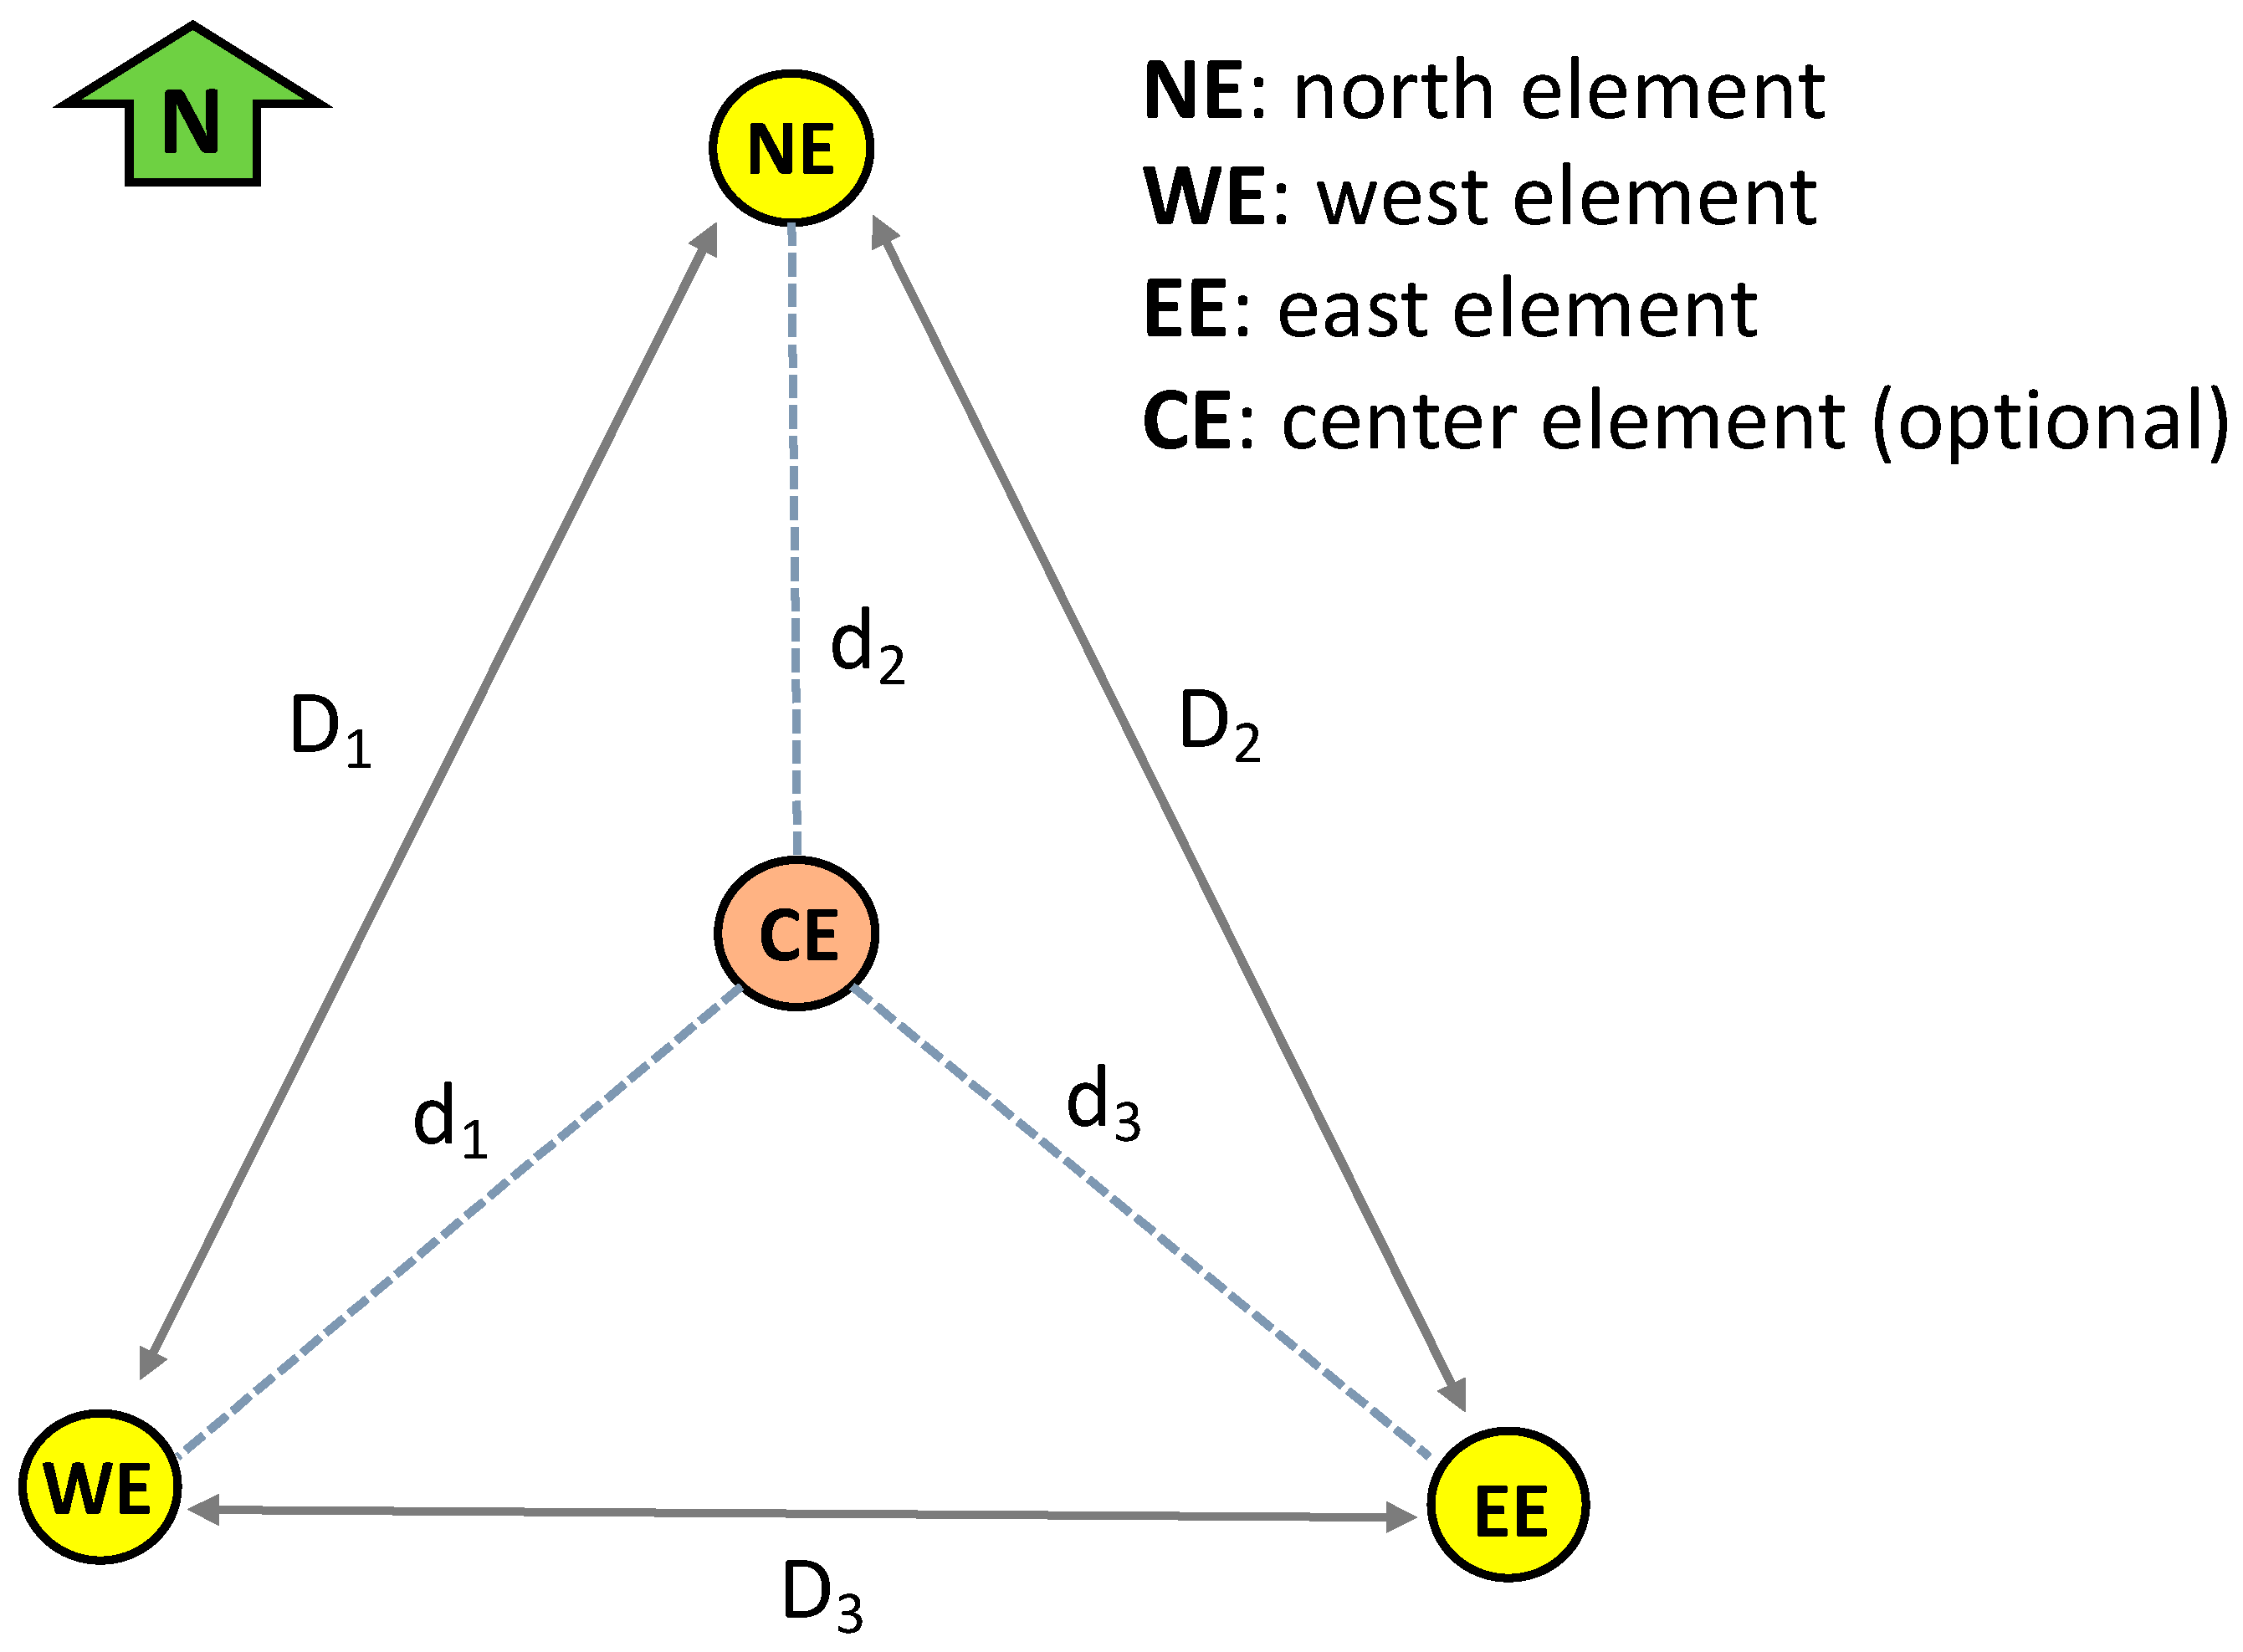
| Distances between Array Elements | Genesis | Stardust |
|---|---|---|
| D1 | 94.50 | 42.27 |
| D2 | 87.90 | 50.85 |
| D3 | 97.08 | 44.55 |
| d1 | 54.64 * | 26.69 |
| d2 | 55.15 * | 27.35 |
| d3 | 52.30 * | 28.73 |
| Genesis | Stardust | ||
|---|---|---|---|
| Main Arrival | Second Arrival | ||
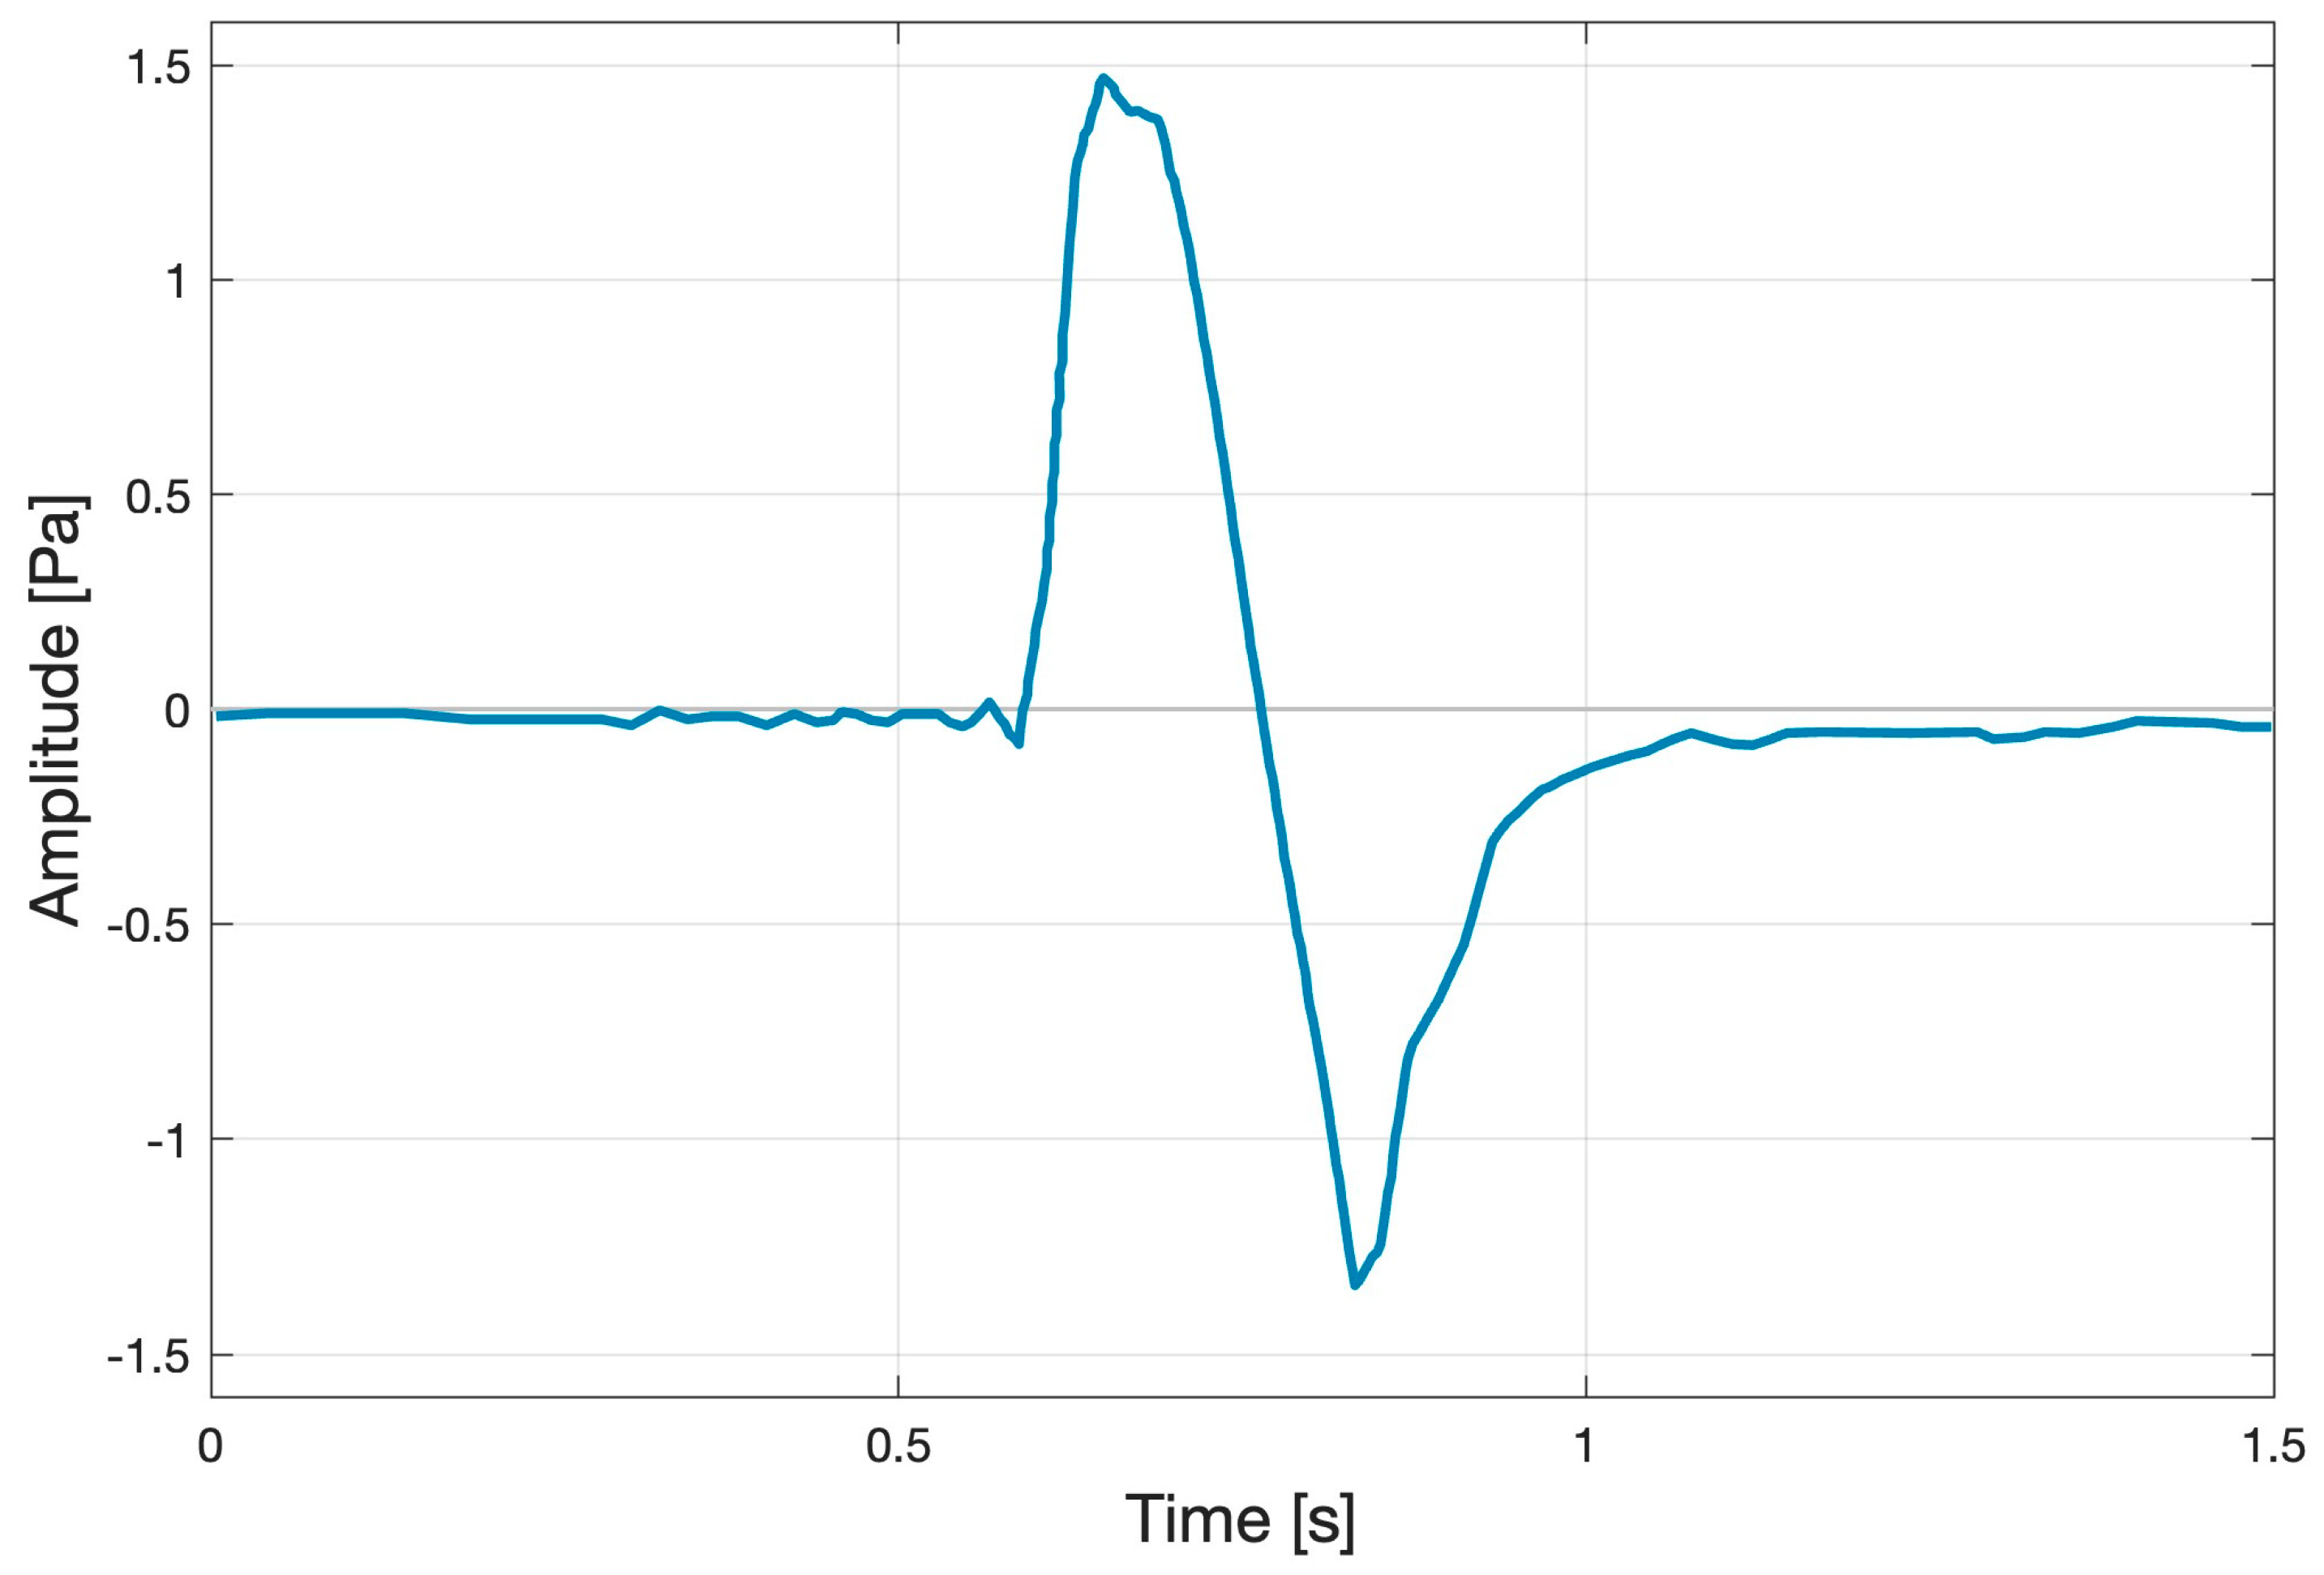
| Peak amplitude [Pa] | 3.99 ± 0.16 | 1.15 ± 0.10 | 0.21 ± 0.04 |
| Peak-to-peak amplitude [Pa] | 7.26 ± 0.32 | 1.80 ± 0.19 | n/a |
| Dominant period [s] | 0.45 ± 0.03 | 0.20 ± 0.01 | 0.16 ± 0.01 |
| Dominant frequency [Hz] | 2.25 ± 0.14 | 5.00 ± 0.25 | n/a |
Disclaimer/Publisher’s Note: The statements, opinions and data contained in all publications are solely those of the individual author(s) and contributor(s) and not of MDPI and/or the editor(s). MDPI and/or the editor(s) disclaim responsibility for any injury to people or property resulting from any ideas, methods, instructions or products referred to in the content. |
© 2023 by the authors. Licensee MDPI, Basel, Switzerland. This article is an open access article distributed under the terms and conditions of the Creative Commons Attribution (CC BY) license (https://creativecommons.org/licenses/by/4.0/).
Share and Cite
Silber, E.A.; Bowman, D.C.; Albert, S. A Review of Infrasound and Seismic Observations of Sample Return Capsules since the End of the Apollo Era in Anticipation of the OSIRIS-REx Arrival. Atmosphere 2023, 14, 1473. https://doi.org/10.3390/atmos14101473
Silber EA, Bowman DC, Albert S. A Review of Infrasound and Seismic Observations of Sample Return Capsules since the End of the Apollo Era in Anticipation of the OSIRIS-REx Arrival. Atmosphere. 2023; 14(10):1473. https://doi.org/10.3390/atmos14101473
Chicago/Turabian StyleSilber, Elizabeth A., Daniel C. Bowman, and Sarah Albert. 2023. "A Review of Infrasound and Seismic Observations of Sample Return Capsules since the End of the Apollo Era in Anticipation of the OSIRIS-REx Arrival" Atmosphere 14, no. 10: 1473. https://doi.org/10.3390/atmos14101473