Article

Evaluating Gas Emissions from Different Feed Cropping Systems in the North China Plain: A Two-Year Field Measurement

1
College of Resources and Environmental Sciences, Hebei Agricultural University, Baoding 071000, China
2
Key Laboratory for Farmland Eco-Environment of Hebei Province, Baoding 071000, China
*
Author to whom correspondence should be addressed.
Atmosphere 2022, 13(7), 1153; https://doi.org/10.3390/atmos13071153
Submission received: 20 June 2022 / Revised: 8 July 2022 / Accepted: 15 July 2022 / Published: 21 July 2022
(This article belongs to the Section Air Quality)

Abstract

:
The cultivation of silage crops is encouraged to enhance the connection between crop and livestock production in the North China Plain (NCP). A field experiment was designed to evaluate the ammonia (NH3), nitrous oxide (N2O), and methane (CH4) emissions of five silage cropping systems, including triticale-summer maize (Tr-SuM), triticale-spring maize (Tr-SpM), triticale-double forage maize (Tr-DFM), double forage maize (DFM), and winter wheat-summer maize (WW-SuM), as well as their biomass- and crude protein-scaled emission intensities, with respect to NH3 and greenhouse gas (GHG). The annual nitrogen (N) emissions through NH3, N2O, and CH4 emissions of these systems were 13.43–23.77 kg ha−1 (4.2–5.6% of N fertilizer input), 3.43–4.56 kg ha−1 (0.75–1.08% of N fertilizer input) and 2.10–2.85 kg ha−1, respectively. The total GHG emissions of these systems was dominated by the contributions of N2O. Ranking these systems according to their biomass and crude protein production gave Tr-DFM > DFM > WW-SuM > Tr-SuM and Tr-SpM, their partial factor productivity was in the order of Tr-DFM > WW-SuM > Tr-SuM and Tr-SpM > DFM, and the order of their emission intensity was DFM > Tr-SuM > Tr-DFM > WW-SuM > Tr-SpM. In conclusion, the Tr-DFM needs to be further investigated for its suitability in the NCP, owing to its superior productivity and moderate emission intensities.

1. Introduction

In China, animal production is booming to meet the increasing demand for animal products, including milk, meat, and eggs. At the same time, the unbalanced proportions of various cropping system areas need to be modified, since they partially contribute to the increasing imports of soybeans from abroad as animal feed. Therefore, adjusting the cropping systems for better animal feed production is considered necessary and imperative to realize a proper combination of crop and livestock production, which includes the requirements for new, efficient animal feed-producing cropping systems [1].
The NCP is a major grain producing region in China, both for human consumption and animal feed. According to the “National Crop Structure Adjustment Plan, 2016–2020,” the extension of silage cropping systems is being encouraged, mainly owing to their higher productivity and lower nutrient losses in the NCP. Silage crops suitable for the NCP include perennial triticale (Triticum) [2,3,4,5], forage maize (Zea mays) [6,7], sheepgrass (Leymus chinensis) [8], spring maize [9,10], and alfalfa (Lotuscorniculatus) [11,12].
However, compiling different silage crops to form new rotation systems usually requires a re-establishment of the respective management practices (e.g., fertilization, irrigation and plowing) to improve biomass yield production [13]. As a result, the implementation of these new emerging systems may cause severe changes in the seasonal/annual gaseous emissions, introduce a high uncertainty to the local inventory of gases, and interrupt the progress of local air quality protection and the mitigation of GHG emissions [14]. Previous studies dealt with the GHG [15,16,17,18,19], NH3 emissions from various summer- or spring-maize cropping systems [20,21,22], and triticale [23,24]. To our knowledge, however, few studies have been made within the NCP to characterize emissions from new cropping systems for silage and evaluate the emission intensity on the yield basis [25,26,27,28].
Additionally, seeking new practical approaches as alternative ways to improve biomass yield production and to concomitantly reduce GHG emissions is a challenging point [13]. In general, net GHG emissions from agricultural systems can be reduced by optimizing their management, such as by combining adopted varieties, making prudent water and N management decisions, and using the the soil tillage and residue management approach [20,29]. Although initial assessment of the new systems’ performance could be estimated using the approaches of life cycle assessment (LCA), or a process-based model, such as the denitrification-decomposition model (DNDC) [30], side-by-side field experiments comparing GHG emissions among different cropping systems should still be carried out. This will accurately assess the NH3 and GHG emissions of these new cropping systems in order to establish optimal feed cropping systems in the NCP [13,31,32,33].
Furthermore, devising effective agriculture management strategies for mitigating climatic impacts is necessary, but requires a complete perspective of the agricultural impacts on radiative forcing [33,34,35]. In case of difficulties when comparing emissions of different cropping systems with various management practices, yield-scaled GHG intensity (GHGI) is considered suitable to evaluate the GHG emissions among different cropping systems when the management practices differ widely [14].
Therefore, this study intends to investigate the gas emissions of several silage cropping systems in comparison with the most popular winter wheat-summer maize double-cropping system in the NCP. This is to examine our hypothesis that silage cropping system might have lower GHGI than the traditional winter wheat-summer maize rotation owing to its higher productivity and shorter growing period. Their dry matter (DM) and crude protein (CP) productivities, and their DM yield- and CP yield-scaled NH3 and GHG emission intensities are also evaluated in relation to the WW-SuM system. Since these selected crops have been well demonstrated to be suitable as silage for dairy and beef cattle, we have no further intention to evaluate their nutritional value, but only their DM and CP productivity. This will provide insightful information for establishing a good silage cropping system in the NCP.

2. Materials and Methods

2.1. Description of Experimental Site

The experimental site was located on the model farm of Hebei Agricultural University in Baoding, Hebei Province, North China. The regional climate was a warm-temperate monsoon climate (i.e., spring from April–May, summer from June–August, autumn from September–October, and winter from November–February). The mean annual air temperature was 12–13 °C, and the annual precipitation was approximately 550 mm, mainly occurring from June to August. The soil on the experimental site was a Eutric Cambisol on alluvial deposits; the physical and chemical properties of the experimental soil (a mixture of five sampling sites with random distribution) prior to the experiment are shown in Table 1.

2.2. Experimental Design

The field experiment was conducted from October 2015 to Sept. 2017, and included the following five silage cropping systems: (1) WW-SuM; (2) Tr-SuM; (3) Tr-SpM; (4) Tr-DFM; and (5) DFM. Each treatment had three replicates. The area of a plot was 3 m × 5 m, and the plots were randomly distributed. The varieties of summer maize and spring maize employed in this study were both zhengdan958, and the variety of winter wheat was hengmai444, triticale was Jisi#3, and forage maize was yuanyuan#1.
One rotation year is separated into 5 stages (i–v) based on the major management events in the field, such as seeding (S), fertilization (F), irrigation (I). and plowing (P) (Figure 1). The application rates of mineral N fertilizer for each treatment are shown in Table 2. The application rates of phosphorus and potassium as basal mineral fertilizers for each growing season of all crops were 80 kg P2O5 ha−1 and 60 kg K2O ha−1, respectively. For the basal application at the seeding stage, all fertilizers were incorporated into the soil through plowing. For topdressing the N fertilizer was surface applied, followed by an immediate flood irrigation.
The scheme of the field managements in one rotation year is illustrated in Figure 1. The determination of the harvesting time of these silage crops was based on the feed quality indicators [36].

2.3. Dry Matter Yields and Nutritive Parameters

The DM yields for WW, Tr, SpM, SmM, and FM were determined. The plants were oven-dried at 75 °C after harvesting the entire plot at the optimal time, according to the feed quality indicators. The total N content of the harvested materials (Nplant) was measured using the Kjeldahl N determination procedure, and the CP contents were estimated according to Equation (1). The partial factor productivities (PFP, kg kg−1) of the DM (kg ha−1) and CP yield (kg ha−1) against N application were calculated using Equation (2).
CP [ % ] = N plant × 6.25
PFP DM ( CP ) = DM ( CP ) N   application

2.4. Measurements of Gaseous Emissions

2.4.1. N2O and CH4 Measurements

The static chamber technique, consisting of a polyvinyl chloride (PVC) collar inserted into the soil 5 cm deep and a PVC cylinder cover (20 cm tall) set on the collar, was used to determine N2O and CH4 fluxes in the different rotation systems (Figure 2). However, the CO2 fluxes in the different rotation systems were not considered in this study, mainly due to the small changes for a short period study [37]. The collar and cover were sealed with distilled water during the measurement, and the inner air samples were collected using a syringe through a medical three-valve port on the top of the cylinder cover. The gaseous emissions were measured daily for 7 days after N fertilization, was well as daily for 4 days after each irrigation or precipitation event, and were then measured every 3–7 days during the rest of the study period. Air sampling took place during 8:00–10:00 am. The covering period was 30 min, with 20 mL air samples collected from the cylinder at 0, 15, and 30 min. The soil and air temperatures were also monitored. The N2O and CH4 concentrations of the air samples were measured with a gas chromatograph (Agilent 6820, Santa Clara, CA, USA) equipped with an electron capture detector ECD (330 °C) for N2O and a flame ionization detector FID (250 °C) for CH4, and the flow rate of carrier gas was 50 mL min−1. The flux rates of N2O and CH4 were calculated using Equation (3):
F = dC dt × H [ m ] × T 0 [ K ] ( T 0 [ K ] + T [ ] )
where F represents the flux rates of N2O and CH4 (μg m−2 h−1), dC/dt is the slope of the gas concentrations with the sampling time (mg m−3 h−1), H is the height of the cylinder cover (0.20 m), T0 is the absolute temperature (273.15 K), and T is the temperature inside the cylinder cover (K).

2.4.2. NH3 Measurements

The calibrated Draeger-Tube method (DTM) was employed to measure the NH3 emissions after N fertilization (Figure 2) [38,39,40]. The corrected NH3 concentration was calculated using Equation (4):
ppm cor = ppm × s d s a
with: ppmcor, the corrected NH3 concentration [vol.-ppm]; ppm, the Draeger-Tube measured NH3 concentration [vol.-ppm].
The corrected measurement time was calculated using Equation (5):
t cor [ s ] = t [ s ] × s d s a
with: tcor, the corrected measurement time [s]; t, the duration of the measurement [s]; sd, the default number of strokes of the hand pump; and sa, the actual number of strokes.
After these corrections, the raw NH3 fluxes were calculated using Equation (6) [38,39]:
F Ng = V × | c | × 1013 [ hPa ] P act [ hPa ] × ( 696.11 [ mg   L 1 ] × 298.15 [ K ] 273.15 [ K ] + T act [ ] ) × 10 6 × 14 17 × 10000 [ cm 2 ] 415 [ cm 2 ] × 3600 [ s ] t [ s ]
with: FNg, the raw NH3 fluxes [mg N m−2 h−1] from the area covered by the chambers (415 cm2); V, the air volume sucked through the tube; c, the corrected NH3 concentration [ppm]; Pact, the actual barometric pressure [hPa] for the pressure conversion factor; Tact, the actual air temperature [°C] for the temperature conversion factor; and t, the duration of the measurement(s).
To calculate the absolute fluxes taking the actual wind speed into account, the raw fluxes were converted into kg N ha−1 h−1. Depending on the height of the canopy of the field, the absolute fluxes were calculated using the calibration Equation (7) or Equation (8) [39], with Equation (7) used for low canopies, such as wheat, and Equation (8) used for high canopies, such as maize fields.
ln ( absolute   flux ) = 0.444 × ln ( F Ng ) + 0.590 × ln ( v wind 2 m )
ln ( absolute   flux ) = 0.456 × ln ( F Ng ) + 0.745 × ln ( v wind 2 m ) 0.280 × ln ( v wind 0.2 m )
with: FNg, the raw NH3 fluxes [kg N ha−1 h−1]; vwind2m, the wind speed at 2 m above the ground [m s−1]; and vwind0.2m, the wind speed at 0.2 m above the ground [m s−1].
The NH3 fluxes were also accumulated over the measurement period in order to calculate the total N losses in the form of NH3.

2.4.3. Calculation of Emission Intensities

The GHG emissions in term of the equivalent CO2 emissions were estimated with Equations (9) and (10) using the global warming potentials of N2O and CH4 over a 100-year horizon, as provided by the IPCC [41]:
GHG CH 4 = F CH 4 × 28
GHG N 2 O = F N 2 O × 265
The indirect N2O emissions from the redeposited NH3 were calculated by assuming that the redeposition of volatilized NH3 can form an N application, as does N fertilization. Its potential emissions factor for N2O would be of the same magnitude as the direct emissions indicated by the IPCC [42], and it can be calculated using Equation (11):
N 2 O ind = F NH 3 [ kg   N   ha 1 ] × EF N 2 O [ % ] × 44 [ g / mol ] 28 [ g / mol ]
with: N2Oind, the indirect N2O emissions derived from the redeposited NH3 (kg ha−1); FNH3, the cumulative NH3 emission (kg N ha−1); EFN2O, the default emissions factors in the IPCC (the value of 1.0% was used in this study); 44, the molecular weight of N2O (g mol−1); 28, the N in the molecular weight of N2O (g mol−1).
To assess the integrated greenhouse effects of different rotation systems, the annual GHG emissions (the cumulative emissions during one whole experimental year (i.e., October 2015–September 2016 and October 2016–September 2017), including the N2O, N2Oind (from the redeposition of NH3), and CH4 were used to estimate the emission intensities on the basis of DM production and CP production, respectively. However, the impacts of different rotations on the net CO2 exchange between atmosphere and terrestrial ecosystems and the GHG emissions from the agricultural inputs such as seeds, irrigation, plowing, and fertilizers were not included.

2.5. Data Analysis

The data were statistically analyzed using Duncan’s multiple range test for significant differences between treatments at p < 0.05. All the data analysis was conducted with the aid of the SPSS 22.0 software package.

3. Results

3.1. DM and CP Production of Different Rotation Systems

During the experimental period of 2017–2019, the DM production of the five cropping systems ranged from 20,244 to 33,320 kg ha−1 (Table 3) (see details in Table S1). In comparison with the conventional system, WW-SuM in North China, the Tr-DFM was consistently found to have a greater DM production (by 13.2%, p < 0.05), and the other cropping systems were characterized by a significantly lower production (22.1–31.2%, p < 0.05). In addition, the CP production of the five systems varied from 1715 to 2579 kg ha−1 (Table 3) (see details in Table S2). Similarly, the Tr-DFM also consistently produced 12.1% more CP than the WW-SuM, while the other rotation systems had a 6.2–25.5% lower production than the WW-SuM. In addition, the 2-year average DM production of triticale in the Tr-SuM was 8192 kg ha−1, 72% and 26% greater than those in the Tr-SpM and Tr-DFM rotations, respectively (Table S1). This was attributed to the difference in the number of cuttings (2 cuttings in the Tr-SuM vs 1 cutting in the Tr-SpM and Tr-DFM).
In addition, the partial factor productivities of DM and CP production (PFPDM and PFPCP) on the basis of per unit of N input were also examined. As shown in Table 3, the PFPDM of Tr-DFM reached 78.40 kg kg−1 and was 19.9% greater than that of the conventional WW-SuM (p < 0.05), whereas the PFPDM of Tr-SuM and Tr-SpM were significantly lower than those of the WW-SuM (p < 0.05). With respect to the PFPCP, the Tr-DFM was also characterized as having the greatest productivity and had a significantly higher value than the WW-SuM (p < 0.05) (Table 3).
In summary, of the five cropping systems, the Tr-DFM rotation appeared to have better productivity than the conventional WW-SuM and the other alternatives.

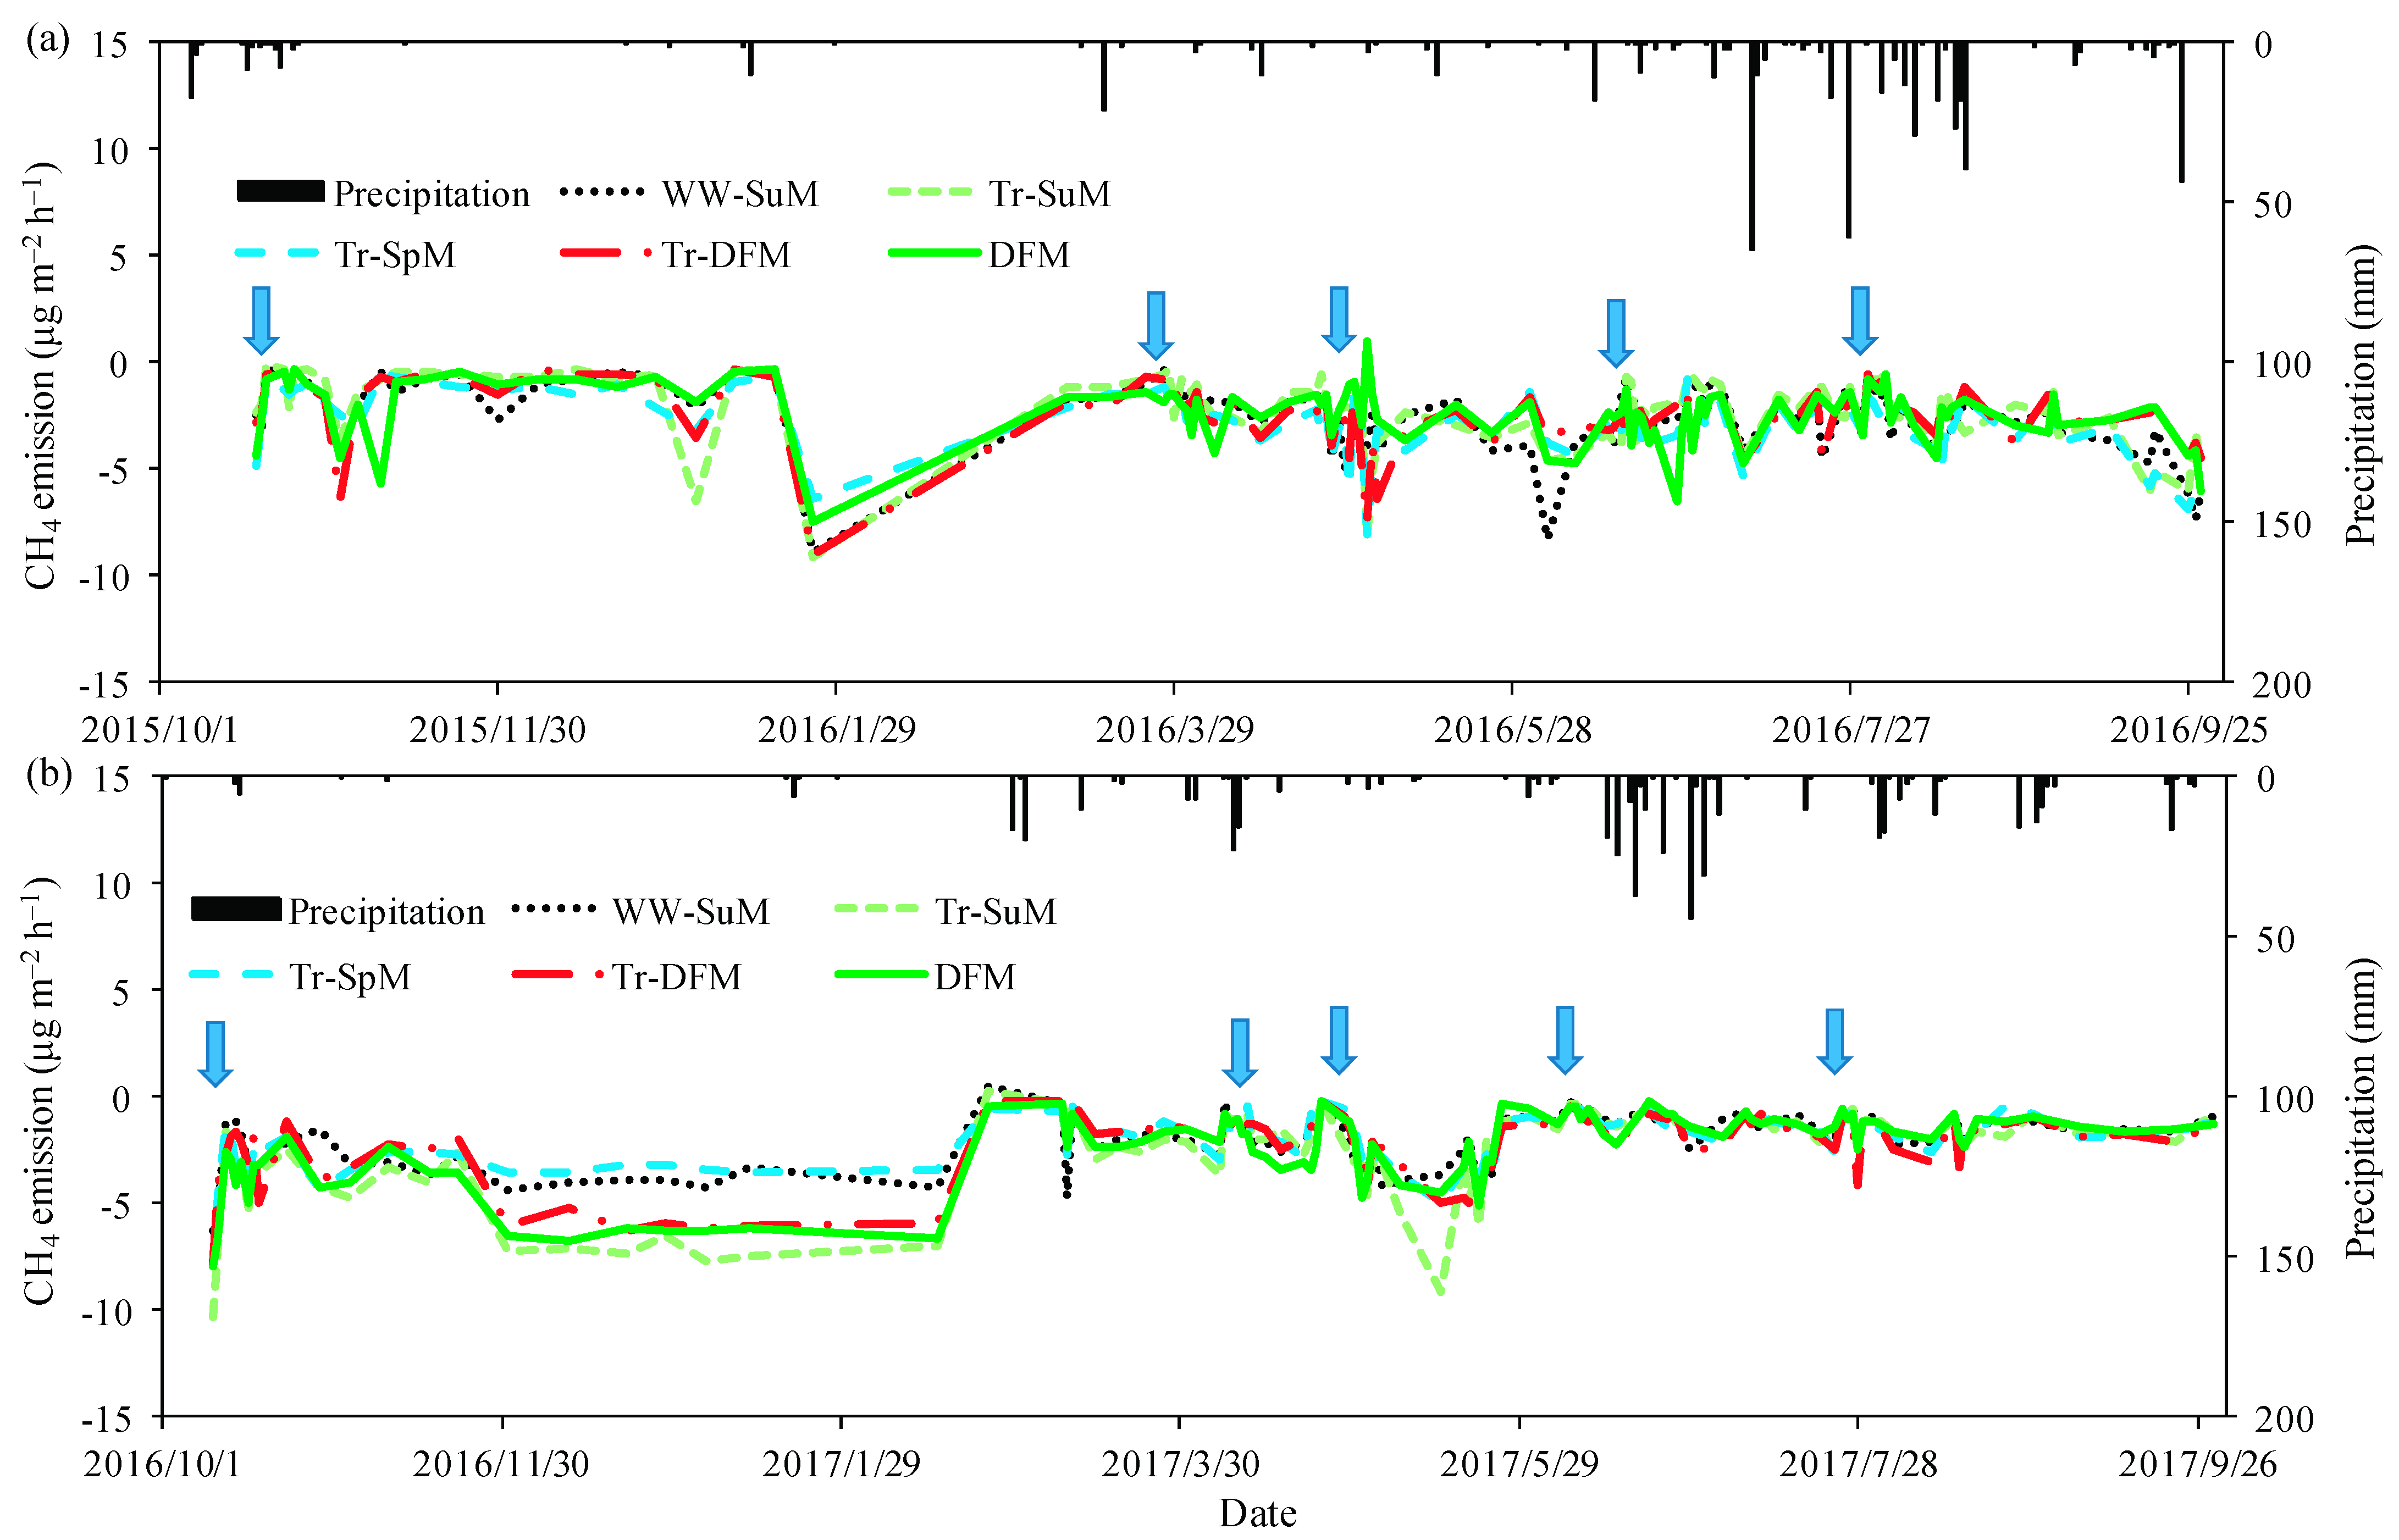
3.2. N2O and CH4 Emissions of Different Cropping Systems

The N2O emissions from the five cropping systems are shown in Figure 3. In general, the N2O emission rates usually peaked 3–4 days after N fertilization, although the peak emission rates differed among these systems due to the differences in the timing and rate of N fertilization. For instance, in the first experimental year, the peak emissions rates of N2O after basal application (stage i) and topdressing in mid-spring (stage ii) ranged from 187 to 446 μg m−2 h−1 and were lower than those of 656–771 μg m−2 h−1 in stage iii, 221–1201 μg m−2 h−1 in stage iv, and 1260–2279 μg m−2 h−1 in stage v, respectively (Figure 3a), explicitly indicating the major contribution of summer N2O emissions to the annual emissions. Meanwhile, similar findings regarding the seasonal pattern of N2O emissions were observed in the second experimental year (Figure 3b). In addition, due to the large differences in timing and amounts of N fertilizations (Table 2), the N2O emissions patterns of the five rotation systems differed, especially between the DFM and the other rotation systems. For example, there were no apparent emissions peaks in stages i and ii for the DFM, and this highlighted the importance of controlling N2O emissions from the DFM in the summer season (Figure 3). In addition, the annual N2O emissions of the two-year average of the Tr-DFM reached 7.17 kg ha−1, which were significantly greater than those of the other rotations, which varied between 5.31 and 5.96 kg ha−1 (Table 4). The ratio of the annual N2O-N losses to their annual N application rates (AEFN2O) were calculated to represent the relative N2O emissions factor. It appears that the Tr-DFM was also characterized as having the greatest AEFN2O of 1.08%, which was comparable to those of WW-SuM, Tr-SuM, and DFM (p > 0.05), but significantly higher than for Tr-SpM (p < 0.05) (Table 4).
The measured CH4 fluxes are shown in Figure 4. During most of the two-year experimental period, negative emissions (i.e., CH4 uptake by soils) were observed for the five rotation systems, although the uptake varied considerably, and no consistent impact from the irrigation and N fertilization was identified. This indicated the minor role of field management practices on CH4 emissions from the selected cropping upland systems under sub-humid climatic conditions in North China. In addition, the annual CH4 uptake of the two-year average of the five rotation systems ranged from 2.10 to 2.85 kg ha−1, and no significant differences were observed among them (Table 4).

3.3. NH3 Emissions of Different Rotation Systems

The NH3 emissions after N fertilization were measured in the first experimental year (Figure 5). The NH3 emissions from WW-SuM, Tr-SuM, Tr-SpM, and Tr-DFM in stage i were undetectable after basal fertilization in mid-October 2017 (Figure 5), which might be mainly attributed to the application method of incorporation through plowing, with immediate irrigation afterwards. Nonetheless, considerable NH3 emissions in other stages were observed when surface application methods were used. Here, the NH3 emissions peaked 1–2 days after fertilization and started declining afterwards, although the declining trends might be disturbed by rainfall events, which might have caused short-period increases in NH3 emissions. In general, the NH3 emissions from these rotation systems mainly occurred within 7–10 days after N fertilization.
The NH3 emissions from different rotation systems are shown in Table 5. The relative NH3-N losses with respect to their N application were also calculated as a ratio of the annual NH3-N losses to the annual N application rates, representing the relative NH3 emissions factor (AEFNH3). Of the five systems, the DFM rotation had the lowest NH3 emissions (p < 0.05) compared to the others, which was mainly due to the lowest total annual N application rate of 325 kg ha−1 (Table 2). The Tr-DFM rotation had a slightly lower N rate of 425 kg ha−1, but a slightly higher NH3 emission in comparison with WW-SuM, Tr-SuM, and Tr-SpM, which is likely due to more application events (5 for Tr-DGM vs. 4 for the others). In addition, the AEFNH3 of Tr-DFM was significantly greater (p < 0.05) than those of other comparable crops (Table 5).

3.4. Greenhouse Gases Emissions of Different Rotation Systems

The greenhouse effects of different rotation systems, including direct (N2O and CH4) and indirect (NH3) components, expressed as CO2-e, are given in Table 4 and Table 5. As expected, the positive CO2-e emissions derived from the N2O of different systems were found to vary from 1407 kg ha−1 in the Tr-SpM to 1900 kg ha−1 in the Tr-DFM (Table S3), and this rotation system had significantly higher emissions than the others (p < 0.05) (Table 4). The CO2-e fluxes of the CH4 of all rotation systems were negative because the soils acted as a sink for the atmospheric CH4, and these rotation systems showed similar results, with a narrow range from −79.8 to −58.8 kg ha−1, although no significant differences among these systems were identified (Table 4). In addition, the indirect GHG emissions from NH3 volatilization varied from 35.6 to 62.9 kg ha−1 and only played a minor in the total GHG emissions (Table 5). Overall, the total GHG emissions of these rotation systems were dominated by the contributions of N2O emissions from a regime of N2O, CH4, and NH3, and significantly higher emissions from the Tr-DFM were obtained (p < 0.05).

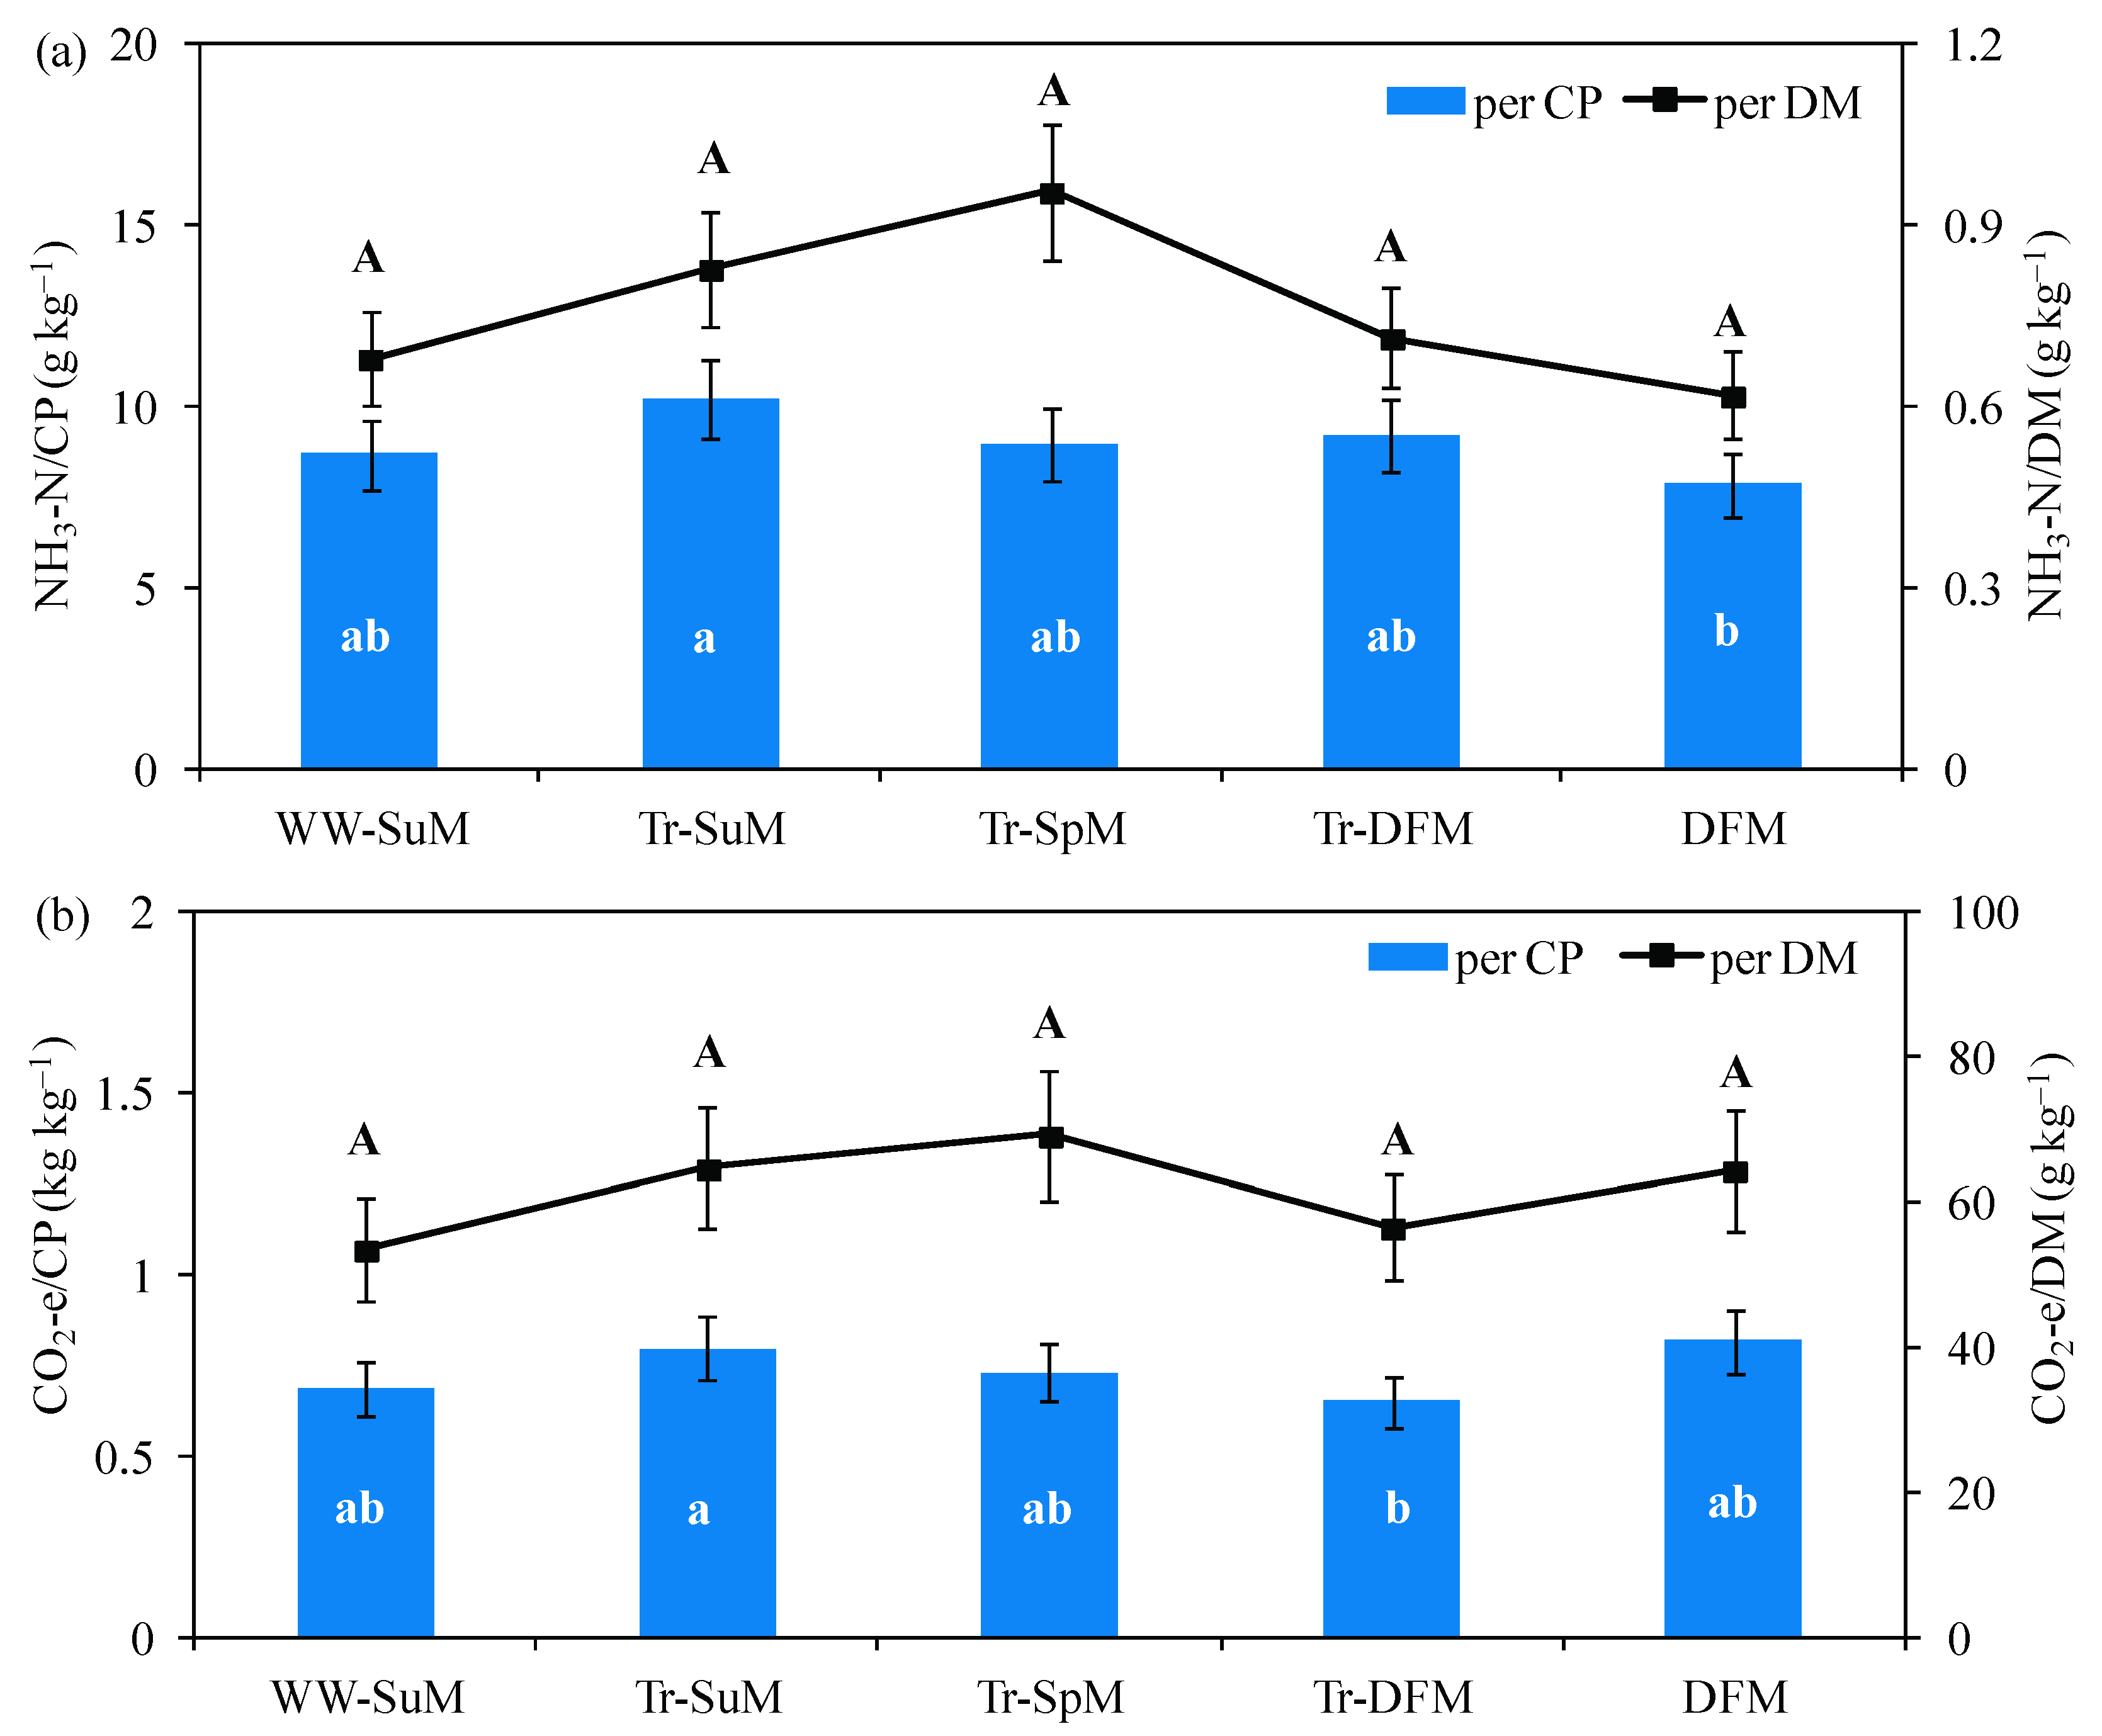
3.5. Emissions Intensities of Different Rotation Systems

Additionally, the emission intensities of CO2-e and NH3-N corresponding to the production of 1 kg CP and 1 kg DM for all rotation systems were also calculated (Figure 6). It is found that for the emission intensities on the CP basis, the NH3-N intensities ranged from 7.84 g kg−1 for the DFM to 10.19 g kg−1 for the Tr-SpM, and the CO2-e intensities ranged from 0.65 kg kg−1 for the Tr-DFM to 0.82 kg kg−1 for the DFM, where the Tr-DFM has the lowest GHG intensity and medium NH3-N intensity. However, no significant difference among these cropping systems in terms of CO2-e and NH3-N can be found on the DM basis.

4. Discussion

4.1. Performance of Different Cropping Systems

The obtained DM amounts of forage maize in the first forage maize season were 6–59% and 140–162% greater than those in the following maize season, in the first and second experimental year, respectively (Table 3), thereby reflecting the impact of low temperatures and radiation in the second season on DM yields [27]. Meanwhile, the DM yields of the forage maize in the DFM in the two seasons appeared to be smaller than those of the Tr-DFM (Table 3), which might be attributed to the low residual effect of N fertilization due to the lack of large amounts of N fertilization when triticale production was absent [43,44]. Overall, the higher value of the Tr-DFM as a livestock feedstuff over the other rotations was mainly contributed by the double-forage maize production (Table 3). A similar study assessing these forage cropping systems also indicated that the DM and the total digestible nutrients yields of the triticale-maize systems were markedly higher than those associated with conventional cultivation, when the accumulated temperature was sufficient [45]. Such phenomenon can be attributable to several factors [46]. Generally, summer maize has been demonstrated to have a greater yield gap and production gap than winter wheat, and is henceforth considered to be the most important crop in terms of increasing future grain production in the NCP [47]. However, the summer maize yield can be limited by many factors, in addition to factors such as plant density, N input, the sowing date, and potassium fertilizer input [48,49,50]; the growth of summer maize (bred for quick maturity to allow for the winter wheat to be sown in time) could be restricted due to the declining kernel filling rate during the late stage because of the low temperature and solar radiation in late September [51]. In our study, the early harvesting of triticale in mid-April in the Tr-DFM rotation extended the length of the growing season for forage maize; meanwhile, the forage maize has a shorter growing period than the conventional maize and thus, can partly avoid the low temperature period in later fall. It is concluded that with respect to feed production, the Tr-DFM rotation can make full use of the climatic resources, with a relatively high productivity in terms of DM production and partial factor productivity, but further research is needed to validate the agronomic assumptions underlying this scenario.

4.2. Gaseous Emissions

The high N2O and NH3 emissions from the Tr-DFM were determined to be mainly caused by the high N fertilization in the summer, in combination with favorable conditions for gaseous emissions. The N2O emission peaks were mainly associated with high temperatures and high soil water content, resulting from rainfall or irrigation events [20,52]. Similar to other studies [22,53], the sums of the direct and indirect GHG emissions of all of our rotation systems were consistently dominated by N2O emissions, which were followed by the indirect GHG from NH3 redeposition and the negative CH4 fluxes. This is in agreement with the fact that the single largest source of greenhouse emissions from crop production in upland cropping systems was the emission of N2O [52,54]. Of the alternative cropping systems, the Tr-DFM rotation was characterized by the lowest GHG intensity and medium NH3-N intensity on the basis of CP (Figure 5), mainly due to the greatest productivity (Table 3).

4.3. Implications

In this study the Tr-DFM was characterized by greater productivity over the conventional WW-SuM and other rotation systems and low or moderate yield-scaled emission intensities, and the GHG emissions were dominated by N2O emissions, especially during maize seasons. Consequently, from an environmental and food security perspectives, the Tr-DFM rotation should be encouraged for promoting more efficient and cleaner forage production in the NCP [55]. Therefore, the remaining concern for this rotation will be how to further reduce the absolute emissions.
First, mitigating the direct and indirect gaseous emissions by optimizing nutrient management plays an important role in lowering emission intensities. In our case, basal N fertilization in the wheat season, and all N fertilization in the maize season, are critical periods for N2O mitigation. It is reported that farmers in the North China Plain apply relatively high rates of N fertilizer to maize [53], thus optimizing N application rates to improve N efficiency in combination with water saving practices (e.g., drip irrigation can reduce N2O emissions by 32% and 46%, compared to furrow and sprinkler irrigation systems, respectively) may exhibit strong potential for reducing GHG emissions from the Tr-DFM rotation [21,56,57].
Second, the application of biochar [54,58,59,60] and the use of manure as a substitute for chemical N have been demonstrated to be promising strategies for reducing the GHG and ensuring food security concomitantly in these intensive cropping systems in the NCP, and the application of the above practices may also be helpful for the further GHG reduction for the Tr-DFM rotation system [20,22,30,61,62]. In addition, inhibitors for urease, e.g., the novel urease inhibitor product, Limus® (BASF, Ludwigshafen, Germany), containing active ingredients N-(n-butyl) thiophosphoric triamide (NBPT) and N-(n-propyl) thiophosphoric triamide (NPPT)) and nitrification (the 3, 4-dimethypyrazole phosphate, DMPP) could also be promising tools to mitigate N losses and N2O emissions from Tr-DFM rotation [63], but their impacts need to be examined with field measurements.
Third, the GHG emission intensities from agricultural systems can be kept low when the management is optimized toward better exploitation of the yield potential [52]. In this study, field management was based on the conventional practices of the local farmers. These practices pose the necessity of applying advanced management technologies in order to realize a high yield and adopting technical progress and policy support to overcome the yield bottlenecks [64,65].
For instance, many farming system models can be used to investigate the potential yield, water-limiting or nutrient-limiting yields, and the yield gaps across regions, e.g., the APSIM [66]. Taking maize as an example, contributions of the variety, sowing date, planting density, irrigation, and nitrogen fertilization to the yield gaps can be estimated and evaluated. A previous study identified that the declining radiation, together with increasing temperature, particularly during the pre-flowering period, might decrease the potential yield of maize, and accordingly, the selection of new maize varieties that can maintain the pre-flowering periods and extend post-flowering periods led to significant yield increases toward the potential yield at 7 out of the 10 sites in the NCP [60]. Therefore, making full use of these models to better integrate precipitation, irrigation, climate-resilient maize varieties, and planting density can largely improve maize yields and reduce emission intensities of the Tr-DFM rotation in the NCP [66,67,68,69].
Although this paper provided novel insights into the structural reform of agricultural cultivation from the food and environmental perspectives, long-term and comprehensive evaluation at various eco-regions of the Tr-DFM rotation is necessary in the future, which should include the GHG emissions from other agricultural inputs/managements such as seeds, irrigation, or plowing to make solid recommendation [55].

5. Conclusions

This field study investigated the gaseous emissions of five rotation systems over two years in the NCP. All these five rotation systems are sources of NH3 and N2O, but weak sinks of atmospheric CH4. The total GHG emissions of these systems were dominated by the contribution of N2O emissions. Of the selected rotation systems, the triticale-double forage maize showed greater DM and CP production and greater partial factor productivities per kg N, but relatively low NH3-N and GHG emission intensities. Therefore, further research for examining the suitability of the triticale-double forage maize in the NCP and optimizing the management practices is needed.

Supplementary Materials

The following supporting information can be downloaded at: https://www.mdpi.com/article/10.3390/atmos13071153/s1, Table S1: DM productions and the PFPDM (mean ± standard deviation) of different rotation systems during the experimental period; Table S2: CP productions and the PFPCP (mean ± standard deviation) of different rotation systems during experimental period; Table S3: GHG emissions (mean ± standard deviation) of N2O, CH4, and indirect N2O from the deposition of emitted NH3 of different rotation systems during the experimental period.

Author Contributions

Conceptualization, W.L. and Z.G.; data curation, S.W.; investigation, W.L., C.L. and X.Z.; methodology, Z.G.; software, X.Z.; validation, Y.F.; writing—original draft, W.L.; writing—review and editing, C.L. and Z.G. All authors have read and agreed to the published version of the manuscript.

Funding

This research was funded by Hebei Province Key Research and Development Program (20327306D) and the National Natural Science Foundation of China (41675151).

Institutional Review Board Statement

Not applicable.

Informed Consent Statement

Not applicable.

Data Availability Statement

Not applicable.

Conflicts of Interest

The authors declare no conflict of interest.

References

  1. MOA, Ministry of Agriculture of the People’s Republic of China. National Crop Structure Adjustment Plan 2016–2020. 2016. Available online: http://www.moa.gov.cn/nybgb/2016/diwuqi/201711/t20171127_5920851.htm (accessed on 19 June 2022).
  2. Chang, D.; Wang, X.; Tian, X.; Du, W. Studies on multiple intercropping effects and quality of autumn sown triticale and sweet sorghum in central Gansu Province. Acta Prataculturae Sin. 2021, 30, 212–220. [Google Scholar] [CrossRef]
  3. He, P.; Wang, Y.; Jie, H.; Deng, H.; Xing, H.; Jie, Y. Effects of different cutting time on the forage yield and nutritional quality of forage triticale. Acta Agrestia Sin. 2021, 29, 2609–2614. [Google Scholar] [CrossRef]
  4. Wang, Z.; Zhang, L.; Wei, L. Comparison test of different triticale varieties in winter fallow saline farmland. Crops 2021, 4, 191–195. [Google Scholar] [CrossRef]
  5. Zhao, F.; Zhao, Y.; Tian, X.; Du, W. Comprehensive evaluation of forage yield and nutritional value of 30 triticale cultivars in semi-arid irrigation area of Lintao, Gansu Province. Grassl. Turf. 2021, 41, 10–16. [Google Scholar] [CrossRef]
  6. Gallo, A.; Fancello, F.; Ghilardelli, F.; Zara, S.; Spanghero, M. Effects of several commercial or pure lactic acid bacteria inoculants on fermentation and mycotoxin levels in high-moisture corn silage. Anim. Feed Sci. Technol. 2002, 286, 115256. [Google Scholar] [CrossRef]
  7. Zhao, M.; Feng, Y.; Shi, Y.; Shen, H.; Hu, H.; Luo, Y.; Xu, L.; Kang, J.; Xing, A.; Wang, S.; et al. Yield and quality properties of silage maize and their influencing factors in China. Sci. China Life Sci. 2022, 65, 1–12. [Google Scholar] [CrossRef]
  8. Liu, H.L.; Lou, Y.J. Study on degradation character of Leymus chinensis and alfalfa products in the cow rumen. Chin. J. Grassl. 2006, 28, 47–51, (In Chinese with English abstract). [Google Scholar] [CrossRef]
  9. Ning, T.; Su, L.; Jiao, N.; Cao, M.; Zhao, C.; Li, Z. Effects of relay intercropping of spring-sown and summer-sown maize on the nutritive values of whole-crop forage at different nitrogen levels. Sci. Agric. Sin. 2006, 39, 2042–2047, (In Chinese with English abstract). [Google Scholar] [CrossRef]
  10. Ye, D.J.; Gao, Q.; He, W.T.; He, P. Effect of N application on N utilization and N balance in spring maize. J. Plant Nutrit. Fertiliz. 2010, 16, 552–558, (In Chinese with English abstract). [Google Scholar] [CrossRef]
  11. Tharangani, R.M.H.; Yakun, C.; Zhao, L.; Shen, Y.; Ma, L.; Bu, D. Proposal and validation of integrated alfalfa silage quality index (ASQI) method for the quality assessment of alfalfa silage for lactating dairy cows. Anim. Feed Sci. Technol. 2022, 289, 115339. [Google Scholar] [CrossRef]
  12. Wang, M.; Chen, M.; Bai, J.; Zhang, J.; Su, R.; Franco, M.; Ding, Z.; Zhang, X.; Zhang, Y.; Guo, X. Ensiling characteristics, in vitro rumen fermentation profile, methane emission and archaeal and protozoal community of silage prepared with alfalfa, sainfoin and their mixture. Anim. Feed Sci. Technol. 2022, 284, 115154. [Google Scholar] [CrossRef]
  13. Arunrat, N.; Wang, C.; Pumijumnong, N. Alternative cropping systems for greenhouse gases mitigation in rice field: A case study in Phichit province of Thailand. J. Clean. Prod. 2016, 133, 657–671. [Google Scholar] [CrossRef]
  14. Afreh, D.; Zhang, J.; Guan, D.H.; Liu, K.L.; Song, Z.W.; Zheng, C.Y.; Deng, A.X.; Feng, X.M.; Zhang, X.; Wu, Y.; et al. Long-term fertilization on nitrogen use efficiency and greenhouse gas emissions in a double maize cropping system in subtropical China. Soil Till. Res. 2018, 80, 259–267. [Google Scholar] [CrossRef]
  15. Kavdir, Y.; Hellebrand, H.J.; Kern, J. Seasonal variations of nitrous oxide emission in relation to nitrogen fertilization and energy crop types in sandy soil. Soil Till. Res. 2008, 98, 175–186. [Google Scholar] [CrossRef]
  16. Lewandowski, I.; Schmidt, U. Nitrogen, energy and land use efficiencies of miscanthus, reed canary grass and triticale as determined by the boundary line approach. Agri. Ecosyst. Environ. 2006, 112, 335–346. [Google Scholar] [CrossRef] [Green Version]
  17. Oliveira, M.; Castro, C.; Coutinho, J.; Trindade, H. Grain legume-based cropping systems can mitigate greenhouse gas emissions from cereal under Mediterranean conditions. Agri. Ecosyst. Environ. 2021, 313, 107406. [Google Scholar] [CrossRef]
  18. Scalise, A.; Pappa, V.A.; Gelsomino, A.; Rees, R.M. Pea cultivar and wheat residues affect carbon/nitrogen dynamics in pea-triticale intercropping: A microcosms approach. Sci. Tot. Environ. 2017, 592, 436–450. [Google Scholar] [CrossRef]
  19. Thomas, S.M.; Francis, G.S.; Barlow, H.E.; Beare, M.H.; Tabley, F.J. Winter grazing of forages-soil moisture and tillage methods impact nitrous oxide emissions and dry matter production. Proc. N. Z. Grassl. Assoc. 2004, 66, 135–140. [Google Scholar] [CrossRef]
  20. Adviento-Borbe, M.A.A.; Haddix, M.L.; Binder, D.L.; Walters, D.T.; Dobermann, A. Soil greenhouse gas fluxes and global warming potential in four high-yielding maize systems. Global Change Biol. 2007, 13, 1972–1988. [Google Scholar] [CrossRef]
  21. Tan, Y.C.; Xu, C.; Liu, D.X.; Wu, W.L.; Lal, R.; Meng, F.Q. Effects of optimized N fertilization on greenhouse gas emission and crop production in the North China Plain. Field Crop Res. 2017, 205, 135–146. [Google Scholar] [CrossRef]
  22. Huang, T.; Hu, X.K.; Gao, B.; Yang, H.; Huang, C.C.; Ju, X.T. Improved nitrogen management as a key mitigation to net global warming potential and greenhouse gas intensity on the North China Plain. Soil Sci. Soc. Am. J. 2018, 82, 136–146. [Google Scholar] [CrossRef]
  23. Neftel, A.; Blatter, A.; Gut, A.; Hgger, D.; Nathaus, F.J. NH3 soil and soil surface gas measurements in a triticale wheat field. Atmos. Environ. 1998, 32, 499–505. [Google Scholar] [CrossRef]
  24. Richter, U.; Smith, J.; Brümmer, C. Net summertime emission of ammonia from corn and triticale fields. In Proceedings of the EGU General Assembly Conference Abstracts, Vienna, Austria, 7–22 April 2016; p. EPSC2016-5478. [Google Scholar]
  25. Wang, M.; Ren, T.; Zhao, M.; Li, S.; Wang, X.; Li, L.; Chen, C. Matter production and resources use efficiency of double-cropping silage maize system. Acta Agron. Sin. 2007, 33, 1316–1323. Available online: https://zwxb.chinacrops.org/CN/Y2007/V33/I08/1316 (accessed on 8 March 2022).
  26. Wang, M.Y.; Zhao, M.; Ren, T.Z.; Li-Juan, L.I. Study on the characteristic of material production and resources efficiency of plastic film cultivation in double-cropping silage maize system. J. Maize Sci. 2008, 16, 127–128. [Google Scholar] [CrossRef]
  27. Li, L.J.; Wang, M.Y.; Xue, Q.L.; Cui, Y.H.; Hou, H.P.; Jun-Zhu, G.E.; Zhao, M. Yield performance and resource efficiency of double-cropping maize in Yellow-Huai-Hai river valleys region. Acta Agronomica Sin. 2011, 37, 1229–1234. [Google Scholar] [CrossRef]
  28. Wu, D. A Systematic Study on Adaptability of Maize-Maize Double Cropping in The Hebei Plain. Master’s Dissertation, Hebei Agricultural University, Baoding, China, 2014. [Google Scholar]
  29. Cai, Y.; Ding, W.; Luo, J. Nitrous oxide emissions from Chinese maize-wheat rotation systems: A 3-year field measurement. Atmos. Environ. 2013, 65, 112–122. [Google Scholar] [CrossRef]
  30. Li, H.; Qiu, J.J.; Wang, L.G.; Tang, H.J.; Li, C.S.; Van Ranst, E. Modelling impacts of alternative farming management practices on greenhouse gas emissions from a winter wheat-maize rotation system in China. Agr. Ecosyst. Environ. 2010, 135, 24–33. [Google Scholar] [CrossRef]
  31. Sherman, J.F.; Young, E.O.; Jokela, W.E.; Cavadini, J. Impacts of low-disturbance dairy manure incorporation on ammonia and greenhouse gas fluxes in a corn silage–winter rye cover crop system. J. Environ. Qual. 2021, 50, 836–846. [Google Scholar] [CrossRef]
  32. Sulaiman, M.F.; Wagner-Riddle, C.; Brown, S.E.; Warland, J.; Voroney, P.; Rochette, P. Greenhouse gas mitigation potential of annual and perennial dairy feed crop systems. Agri. Ecosyst. Environ. 2017, 245, 52–62. [Google Scholar] [CrossRef]
  33. Goglio, P.; Smith, W.N.; Grant, B.B.; Desjardins, R.L.; Gao, X.; Hanis, K.; Tenuta, M.; Campell, C.A.; McConkey, B.G.; Nemecek, T.; et al. A comparison of methods to quantify greenhouse gas emissions of cropping systems in LCA. J. Clean. Prod. 2017, 172, 4010–4017. [Google Scholar] [CrossRef] [Green Version]
  34. Shang, Q.; Yang, X.; Gao, C.; Wu, P.; Liu, J.; Xu, Y.; Shen, Q.; Zou, J.; Guo, S. Net annual global warming potential and greenhouse gas intensity in Chinese double rice-cropping systems: A 3-year field measurement in long-term fertilizer experiments. Global Change Biol. 2011, 17, 2196–2210. [Google Scholar] [CrossRef]
  35. Ali, S.A.; Tedone, L.; Verdini, L.; Mastro, G.D. Effect of different crop management systems on rainfed durum wheat greenhouse gas emissions and carbon footprint under mediterranean conditions. J. Clean. Prod. 2017, 140, 608–621. [Google Scholar] [CrossRef]
  36. Yang, H.; Yang, X.; Cheng, G.; Wang, Y.; Cai, H. Effects of silage on the nutrient preservation of corn harvested in different periods. China Herbiv. Sci. 2013, 33, 36–39. [Google Scholar]
  37. Kane, D. Carbon Sequestration Potential on Agricultural Lands: A Review of Current Science and Available Practices. Available online: https://sustainableagriculture.net/publications/ (accessed on 10 March 2022).
  38. Roelcke, M.; Li, S.X.; Tian, X.H.; Gao, Y.J.; Richter, J. In situ comparisons of ammonia volatilization from N fertilizers in Chinese loess soils. Nutr. Cycl. Agroecosyst. 2002, 62, 73–88. [Google Scholar] [CrossRef]
  39. Pacholski, A.; Cai, G.; Nieder, R.; Richter, J.; Fan, X.; Zhu, Z.; Roelcke, M. Calibration of a simple method for determining ammonia volatilization in the field—Comparative measurements in Henan Province, China. Nutr. Cycl. Agroecosyst. 2006, 74, 259–273. [Google Scholar] [CrossRef]
  40. Gericke, D.; Pacholski, A.; Kage, H. Measurement of ammonia emissions in multi-plot field experiments. Biosyst. Eng. 2011, 108, 164–173. [Google Scholar] [CrossRef]
  41. IPCC. Climate Change 2014: Synthesis Report. Contribution of Working Groups I, II and III to the Fifth Assessment Report of the Intergovernmental Panel on Climate Change; Core Writing Team, Pachauri, R.K., Meyer, L.A., Eds.; IPCC: Geneva, Switzerland, 2014; p. 151. [Google Scholar]
  42. IPCC. Guidelines for National Greenhouse Gas Inventories. Volume 4: Agriculture, Forestry and Other Land Use. Chapter 10: Emissions from Livestock and Manure Management; IPCC: Geneva, Switzerland, 2006. [Google Scholar]
  43. Dong, X.; Liu, X.; Ren, C.; Ji, Y.; Zhang, L.; Ju, X. Fate and residual effect of fertilizer nitrogen under winter wheat-summer maize rotation in north China Plain in meadow cinnamon soils. Sci. Agric. Sin. 2012, 45, 2209–2216, (In Chinese with English abstract). [Google Scholar] [CrossRef]
  44. Yan, X.; Ti, C.; Vitousek, P.; Chen, D.; Leip, A.; Cai, Z.; Zhu, Z. Fertilizer nitrogen recovery efficiencies in crop production systems of China with and without consideration of the residual effect of nitrogen. Environ. Res. Lett. 2014, 9, 95002. [Google Scholar] [CrossRef] [Green Version]
  45. Yoshihira, T.; Nakamura, I.; Kosaka, S. High-yielding forage crop rotation combined with early maturity in maize and sorghum cultivars with winter rye harvested at heading stage in central and southern Hokkaido, Japan. J. Rakuno Gakuen Univ. Nat. Sci. 2007, 31, 189–196. [Google Scholar]
  46. Thompson, N.M.; Armstrong, S.D.; Roth, R.T.; Ruffatti, M.D.; Reeling, C.J. Short-run net returns to a cereal rye cover crop mix in a midwest corn-soybean rotation. Agron. J. 2020, 112, 1068–1083. [Google Scholar] [CrossRef] [Green Version]
  47. Luo, J.; Jin, G.; Luo, Z.; Wang, H.; Qi, Y.; Liu, X.; Shen, Y. Production state and yield potential of wheat and maize in low-medium yield farmlands in Hebei Plain. Chin. J. Eco-Agri. 2016, 24, 1123–1134, (In Chinese with English abstract). [Google Scholar] [CrossRef]
  48. Chen, G.; Cao, H.; Liang, J.; Ma, W.; Guo, L.; Zhang, S.; Jiang, R.; Zhang, H.; Gouding, K.; Zhang, F. Factors affecting nitrogen use efficiency and grain yield of summer maize on smallholder farms in the North China Plain. Sustainability 2018, 10, 363. [Google Scholar] [CrossRef] [Green Version]
  49. Zhao, Y.; Lobell, D.B. Assessing the heterogeneity and persistence of farmers′ maize yield performance across the North China Plain. Field Crops Res. 2017, 205, 55–66. [Google Scholar] [CrossRef]
  50. Liang, W.L.; Carberry, P.; Wang, G.Y.; Lü, R.H.; Lü, H.Z.; Xia, A.P. Quantifying the yield gap in wheat–maize cropping systems of the Hebei Plain, China. Field Crop Res. 2011, 124, 180–185. [Google Scholar] [CrossRef]
  51. Gao, Z.; Feng, H.; Liang, X.; Zhang, L.; Lin, S.; Zhao, X.; Shen, S.; Zhou, L.; Zhou, S. Limits to maize productivity in the North China Plain: A comparison analysis for spring and summer maize. Field Crop Res. 2018, 228, 39–47. [Google Scholar] [CrossRef]
  52. Krauss, M.; Ruser, R.; Muller, T.; Hansen, S.; Mader, P.; Gattinger, A. Impact of reduced tillage on greenhouse gas emissions and soil carbon stocks in an organic grass-clover ley-winter wheat cropping sequence. Agr. Ecosyst. Environ. 2017, 239, 324–333. [Google Scholar] [CrossRef]
  53. Shen, Y.W.; Sui, P.; Huang, J.X.; Wang, D.; Whalen, J.K.; Chen, Y.Q. Global warming potential from maize and maize-soybean as affected by nitrogen fertilizer and cropping practices in the North China Plain. Field Crop Res. 2018, 225, 117–127. [Google Scholar] [CrossRef]
  54. Grant, T.; Beer, T. Life cycle assessment of greenhouse gas emissions from irrigated maize and their significance in the value chain. Aust. J. Exp. Agr. 2008, 48, 375–381. [Google Scholar] [CrossRef]
  55. Zhang, Z.; An, J.; Han, Y.; Feng, L.; Li, X.; Xiong, S.; Xing, F.; Xin, M.; Li, Y.; Wang, Z. Advantages of an Orychophragmus violaceus-maize rotation in reducing greenhouse gas emissions and reactive nitrogen losses and increasing net ecosystem economic benefits on the North China Plain. J. Clean. Prod. 2021, 317, 128426. [Google Scholar] [CrossRef]
  56. Kuang, W.; Gao, X.; Tenuta, M.; Zeng, F. A global meta-analysis of nitrous oxide emission from drip-irrigated cropping system. Glob. Change Biol. 2021, 27, 3244–3256. [Google Scholar] [CrossRef]
  57. Zhang, X.; Meng, F.; Li, H.; Wang, L.; Wu, S.; Xiao, G.; Wu, W. Optimized fertigation maintains high yield and mitigates N2O and NO emissions in an intensified wheat–maize cropping system. Agr. Water Manag. 2019, 211, 26–36. [Google Scholar] [CrossRef]
  58. Agegnehu, G.; Bass, A.M.; Nelson, P.N.; Bird, M.I. Benefits of biochar, compost and biochar–compost for soil quality, maize yield and greenhouse gas emissions in a tropical agricultural soil. Sci. Tot. Environ. 2016, 543, 295–306. [Google Scholar] [CrossRef] [PubMed]
  59. Angst, T.E.; Six, J.; Reay, D.S.; Sohi, S.P. Impact of pine chip biochar on trace greenhouse gas emissions and soil nutrient dynamics in an annual triticale system in California. Agric. Ecosyst. Environ. 2014, 191, 17–26. [Google Scholar] [CrossRef]
  60. Zhang, A.F.; Liu, Y.M.; Pan, G.X.; Hussain, Q.; Li, L.Q.; Zheng, J.W.; Zhang, X.H. Effect of biochar amendment on maize yield and greenhouse gas emissions from a soil organic carbon poor calcareous loamy soil from Central China Plain. Plant Soil. 2012, 351, 263–275. [Google Scholar] [CrossRef]
  61. Zhang, R. Effect of the Nitrogen Application on the Yield and Quality of Forage Maize. Master Dissertation, Northwest A & F University, Yangling, China, 2005. [Google Scholar]
  62. Chen, X.; Boeckx, P.; Shen, S.; Van Cleemput, O. Emission of N2O from triticale (Lolium perenne L.). Biol. Fert. Soils. 1999, 28, 393–396. [Google Scholar] [CrossRef]
  63. Sha, Z.; Ma, X.; Loick, N.; Lv, T.; Cardenas, L.M.; Ma, Y.; Liu, X.; Misselbrook, T. Nitrogen stabilizers mitigate reactive N and greenhouse gas emissions from an arable soil in North China Plain: Field and laboratory investigation. J. Clean. Prod. 2020, 258, 121025. [Google Scholar] [CrossRef]
  64. Yao, Z.Y.; Wang, Z.; Li, J.; Bedoussac, L.; Zhang, S.Q.; Li, Y.Y.; Cao, W.D.; Zhai, B.N.; Wang, Z.H.; Gao, Y.J. Screen for sustainable cropping systems in the rain-fed area on the Loess Plateau of China. Soil Till. Res. 2018, 176, 26–35. [Google Scholar] [CrossRef]
  65. Fischer, R.A.; Connor, D.J. Issues for cropping and agricultural science in the next 20 years. Field Crop Res. 2018, 222, 121–142. [Google Scholar] [CrossRef]
  66. Wang, J.; Wang, E.R.; Yin, H.; Feng, L.P.; Zhang, J.P. Declining yield potential and shrinking yield gaps of maize in the North China Plain. Agr. Forest Meteorol. 2014, 195, 89–101. [Google Scholar] [CrossRef]
  67. Chen, Y.; Zhang, Z.; Tao, F.L.; Wang, P.; Wei, X. Spatio-temporal patterns of winter wheat yield potential and yield gap during the past three decades in North China. Field Crop Res. 2017, 206, 11–20. [Google Scholar] [CrossRef]
  68. Liu, B.H.; Chen, X.P.; Meng, Q.F.; Yang, H.S.; van Wart, J. Estimating maize yield potential and yield gap with agro-climatic zones in China distinguish irrigated and rainfed conditions. Agr. For. Meteorol. 2017, 239, 108–117. [Google Scholar] [CrossRef]
  69. Lv, S.; Yang, X.G.; Lin, X.M.; Liu, Z.J.; Zhao, J.; Li, K.N.; Mu, C.Y.; Chen, X.C.; Chen, F.J.; Mi, G.H. Yield gap simulations using ten maize cultivars commonly planted in Northeast China during the past five decades. Agr. For. Meteorol. 2015, 205, 1–10. [Google Scholar] [CrossRef]
Figure 1. Cropping calendar of different rotation systems for each year. WW, winter wheat; Tr, triticale; SuM, summer maize; SpM, spring maize; DFM, the double forage maize cropping system. P, plowing; S, seeding; F, fertilization; I, irrigation.
Atmosphere 13 01153 g001
Figure 2. Illustrations of the measurement setup for N2O/CH4 and NH3 fluxes of five rotation systems during the experimental period.
Atmosphere 13 01153 g002
Figure 3. N2O fluxes of five rotation systems during the experimental period: (a) the first rotation year from October 2015 to September 2016; (b) the second rotation year from October 2016 to September 2017. WW, winter wheat; Tr, triticale; SuM, summer maize; SpM, spring maize; DFM, the double forage maize cropping system. Arrows indicate the timing of N application events. The standard deviations of the fluxes are not shown for clarity.
Atmosphere 13 01153 g003
Figure 4. CH4 fluxes of five rotation systems during the experimental period: (a) the first rotation year from October 2015 to September 2017; (b) the second rotation year from October 2016 to September 2017. WW, winter wheat; Tr, triticale; SuM, summer maize; SpM, spring maize; DFM, the double forage maize cropping system. Arrows indicate the timing of N application events. The standard deviations of the fluxes are not shown for clarity.
Atmosphere 13 01153 g004
Figure 5. NH3 volatilizations after different N applications during the first experimental year. WW, winter wheat; Tr, triticale; SuM, summer maize; SpM, spring maize; DFM, the double forage maize cropping system. Arrows indicate the timing of N application events. The standard deviations of the fluxes are not shown for clarity.
Atmosphere 13 01153 g005
Figure 6. Emission intensities of NH3-N (a) and GHG (b) of different rotation systems when producing 1 kg crude protein (CP) and 1 kg dry matter (DM). WW, winter wheat; Tr, triticale; SuM, summer maize; SpM, spring maize; DFM, the double forage maize cropping system. Bars indicate the standard deviations of total emission intensities. Different lowercase letters (capital letter) indicate significant difference (p < 0.05) on the CP (DM) basis.
Atmosphere 13 01153 g006
Table 1. Physical and chemical properties of the experimental soil.
Soil Depth
(cm)
pHOrganic Matter
(g kg−1)
Total N
(g kg−1)
Alkaline N
(mg kg−1)
NO3-N
(mg kg−1)
NH4+-N
(mg kg−1)
0–307.7212.640.8661.4214.625.66
30–607.969.000.4438.166.843.18
60–908.117.070.2420.983.721.04
Table 2. Details of N application rates during the two experimental years.
StageDate of EventsN Application Rate (N kg ha−1)
WW-SuMTr-SuMTr-SpMTr-DFMDFM
Stage i18 October 20151001007575na
Stage ii26 March 20161001007575na
Stage iii23 April 2016nana150100125
Stage iv16 June 2016125125150100125
Stage v29 July 2016125125na7575
Total in the 1st year450450450425325
Stage i10 October 20161001007575na
Stage ii10 March 20171001007575na
Stage iii21 April 2017nana150100125
Stage iv8 June 2017125125150100125
Stage v22 July 2017125125na7575
Total in the 2nd year450450450425325
WW, winter wheat; Tr, triticale; SuM, summer maize; SpM, spring maize; DFM, double maize cropping system; na, no fertilization.
Table 3. DM productions and the PFPDM (mean ± standard deviation) of different rotation systems during the experimental period.
RotationsMean DM
(kg ha−1 yr−1)
Mean CP
(kg ha−1 yr−1)
PFPDM
(kg kg−1)
PFPCP
(kg kg−1)
WW-SuM29,428 ± 1257 b2301 ± 136 a65.40 ± 2.79 b5.11 ± 0.30 b
Tr-SuM22,923 ± 3081 c1861 ± 233 b50.94 ± 6.85 c4.14 ± 0.52 c
Tr-SpM20,244 ± 850 c2158 ± 225 a44.99 ± 1.89 c4.80 ± 0.50 bc
Tr-DFM33,320 ± 1264 a2579 ± 135 a78.40 ± 2.97 a6.07 ± 0.32 a
DFM21,742 ± 1825 c1715 ± 109 b66.90 ± 5.62 b5.28 ± 0.34 b
WW, winter wheat; Tr, triticale; SuM, summer maize; SpM, spring maize; DFM, double maize cropping system. Different letters in one column indicate significant difference (p < 0.05).
Table 4. Annual N2O, CH4, and GHG (in term of equivalent CO2) emissions (mean ± standard deviation) from different rotation systems during the experimental period.
RotationsN2O Emission (kg ha−1 yr−1)CH4 Uptake (kg ha−1 yr−1)2-Year Average GHGdirecct (CO2 kg ha−1 yr−1)
2015–20162016–2017AverageAEFN2O (%)2015–20162016–2017Average
WW-SuM5.75 ± 0.23 b6.16 ± 0.13 b5.96 ± 0.18 b0.84 ± 0.03 ab2.25 ± 0.70 a1.94 ± 0.15 a2.10 ± 0.42 a1521 ± 59 b
Tr-SuM5.59 ± 0.50 b5.73 ± 0.24 bc5.66 ± 0.24 b0.80 ± 0.03 ab2.14 ± 0.14 a2.85 ± 0.69 ab2.50 ± 0.38 a1430 ± 74 b
Tr-SpM5.39 ± 0.93 b5.24 ± 0.42 cd5.31 ± 0.62 b0.75 ± 0.09 b2.30 ± 0.51 a1.89 ± 0.64 a2.10 ± 0.59 a1348 ± 181 b
Tr-DFM7.50 ± 1.59 a6.83 ± 0.29 a7.17 ± 0.98 a1.08 ± 0.15 a2.18 ± 0.22 a3.51 ± 0.91 b2.85 ± 0.51 a1820 ± 274 a
DFM5.67 ± 0.54 b5.12 ± 0.18 d5.39 ± 0.35 b0.98 ± 0.06 a2.08 ± 0.66 a2.54 ± 0.65 ab2.31 ± 0.66 a1364 ± 110 b
WW, winter wheat; Tr, triticale; SuM, summer maize; SpM, spring maize; DFM, double maize cropping system. AEFN2O, apparent emission factor of N2O, expressed with the ratio N2O-N to their fertilizer N input. Different letters in one column indicate significant difference (p < 0.05).
Table 5. Annual NH3-N emissions (mean ± standard deviation) of different rotation systems.
Timing of N ApplicationWW-SuMTr-SuMTr-SpMTr-DFMDFM
Stage i ndndndndnm
Stage ii8.60 ± 1.048.21 ± 0.837.40 ± 1.418.81 ± 1.15nm
Stage iiinmnm4.07 ± 1.053.81 ± 0.403.56 ± 0.44
Stage iv7.83 ± 0.597.76 ± 1.087.86 ± 1.197.15 ± 0.696.81 ± 0.16
Stage v3.55 ± 0.203.00 ± 0.45nm4.00 ± 0.483.06 ± 0.80
Total (kg ha−1yr−1)19.98 ± 1.68 a18.97 ± 2.46 a19.33 ± 3.86 a23.77 ± 2.69 a13.43 ± 1.85 b
GHGIndirect (CO2-e kg ha−1yr−1)52.65 ± 4.5 a502.7 ± 6.5 a51.22 ± 10.2 a62.99 ± 7.1 a35.59 ± 4.9 b
AEFNH3 (%)4.4 ± 0.37 b4.2 ± 0.54 b4.3 ± 0.86 b5.6 ± 0.63 a4.1 ± 0.56 b
WW, winter wheat; Tr, triticale; SuM, summer maize; SpM, spring maize; DFM, double maize cropping system; GHG, greenhouse gas (kg CO2-e ha−1); nd, no detectable emission; nm, no measurement. AEFNH3, apparent emission factor of NH3, expressed with the ratio NH3-N to their N input. Different letters in one row indicate significant difference (p < 0.05).
Publisher’s Note: MDPI stays neutral with regard to jurisdictional claims in published maps and institutional affiliations.

